Towards Trouble-Free Networks for End Users Kyung Hwa Kim Submied in partial fulfillment of the requirements for the degree of Doctor of Philosophy in the Graduate School of Arts and Sciences COLUMBIA UNIVERSITY 2018

Welcome message from author
This document is posted to help you gain knowledge. Please leave a comment to let me know what you think about it! Share it to your friends and learn new things together.
Transcript
Towards Trouble-Free Networks for End UsersKyung Hwa Kim
Submied in partial fulfillment of therequirements for the degree of
Doctor of Philosophyin the Graduate School of Arts and Sciences
COLUMBIA UNIVERSITY
2018

© 2018Kyung Hwa KimAll rights reserved
ABSTRACT
Towards Trouble-Free Networks for End Users
Kyung Hwa Kim
Network applications and Internet services fail all too frequently. However, end users
cannot effectively identify the root cause using traditional troubleshooting techniques
due to the limited capability to distinguish failures caused by local network elements
from failures caused by elements located outside the local area network.
To overcome these limitations, we propose a new approach, one that leverages col-
laboration of user machines to assist end users in diagnosing various failures related to
Internet connectivity and poor network performance.
First, we present DYSWIS (“Do You See What I See?”), an automatic network fault
detection and diagnosis system for end users. DYSWIS identifies the root cause(s) of net-
work faults using diagnostic rules that consider diverse information from multiple nodes.
In addition, the DYSWIS rule system is specially designed to support crowdsourced and
distributed probes. We also describe the architecture of DYSWIS and compare its perfor-
mance with other tools. Finally, we demonstrate that the system successfully detects and
diagnoses network failures which are difficult to diagnose using a single-user probe.
Failures in lower layers of the protocol stack also have the potential to disrupt Inter-
net access; for example, slow Internet connectivity is oen caused by poor Wi-Fi perfor-
mance. Channel contention and non-Wi-Fi interference are the primary reasons for this
performance degradation. We investigate the characteristics of non-Wi-Fi interference
that can severely degrade Wi-Fi performance and present WiSlow (“Why is my Wi-Fi
slow?”), a soware tool that diagnoses the root causes of poor Wi-Fi performance. WiS-
low employs user-level network probes and leverages peer collaboration to identify the
physical location of these causes. e soware includes two principal methods: packet
loss analysis and 802.11 ACK number analysis. When the issue is located near Wi-Fi
devices, the accuracy of WiSlow exceeds 90%.
Finally, we expand our collaborative approach to the Internet of ings (IoT) and pro-
pose a platform for network-troubleshooting on home devices. is platform takes ad-
vantage of built-in technology common to modern devices — multiple communication
interfaces. For example, when a home device has a problem with an interface it sends
a probe request to other devices using an alternative interface. e system then exploits
cooperation of both internal devices and remote machines. We show that this approach is
useful in home networks by demonstrating an application that contains actual diagnostic
algorithms.
Contents
Anowledgements iii
Introduction 1
1 DYSWIS: a network troubleshooting framework 7
1.1 Introduction . . . . . . . . . . . . . . . . . . . . . . . . . . . . . . . . . . 7
1.2 DYSWIS network . . . . . . . . . . . . . . . . . . . . . . . . . . . . . . . 9
1.3 Detecting faults . . . . . . . . . . . . . . . . . . . . . . . . . . . . . . . . 12
1.4 Diagnostics . . . . . . . . . . . . . . . . . . . . . . . . . . . . . . . . . . . 19
1.5 Implementation . . . . . . . . . . . . . . . . . . . . . . . . . . . . . . . . 24
1.6 Evaluation . . . . . . . . . . . . . . . . . . . . . . . . . . . . . . . . . . . 27
1.7 Related work . . . . . . . . . . . . . . . . . . . . . . . . . . . . . . . . . . 34
1.8 Discussion . . . . . . . . . . . . . . . . . . . . . . . . . . . . . . . . . . . 36
1.9 Conclusion . . . . . . . . . . . . . . . . . . . . . . . . . . . . . . . . . . . 41
2 WiSlow: diagnosing Wi-Fi performance degradation 43
2.1 Introduction . . . . . . . . . . . . . . . . . . . . . . . . . . . . . . . . . . 43
2.2 Background . . . . . . . . . . . . . . . . . . . . . . . . . . . . . . . . . . 46
2.3 Challenges . . . . . . . . . . . . . . . . . . . . . . . . . . . . . . . . . . . 46
i
2.4 Architecture . . . . . . . . . . . . . . . . . . . . . . . . . . . . . . . . . . 50
2.5 Analysis method 1: packet loss analysis . . . . . . . . . . . . . . . . . . . 51
2.6 Analysis Method 2: 802.11 ACK paern analysis . . . . . . . . . . . . . . 60
2.7 Classification . . . . . . . . . . . . . . . . . . . . . . . . . . . . . . . . . . 68
2.8 Locating interfering devices . . . . . . . . . . . . . . . . . . . . . . . . . 68
2.9 Evaluation . . . . . . . . . . . . . . . . . . . . . . . . . . . . . . . . . . . 71
2.10 Related work . . . . . . . . . . . . . . . . . . . . . . . . . . . . . . . . . . 77
2.11 Discussion . . . . . . . . . . . . . . . . . . . . . . . . . . . . . . . . . . . 79
2.12 Conclusion . . . . . . . . . . . . . . . . . . . . . . . . . . . . . . . . . . . 79
3 A Collaborative Network Troubleshooting Platform for the Internet of ings 81
3.1 Introduction . . . . . . . . . . . . . . . . . . . . . . . . . . . . . . . . . . 81
3.2 MoT architecture . . . . . . . . . . . . . . . . . . . . . . . . . . . . . . . . 84
3.3 Diagnosis scenarios . . . . . . . . . . . . . . . . . . . . . . . . . . . . . . 89
3.4 Implementation . . . . . . . . . . . . . . . . . . . . . . . . . . . . . . . . 92
3.5 Evaluation . . . . . . . . . . . . . . . . . . . . . . . . . . . . . . . . . . . 95
3.6 Related work . . . . . . . . . . . . . . . . . . . . . . . . . . . . . . . . . . 97
3.7 Conclusion . . . . . . . . . . . . . . . . . . . . . . . . . . . . . . . . . . . 99
Conclusion 101
Bibliography 103
ii
Acknowledgements
I would like to begin by taking this opportunity to express my gratitude to my advisor,
Prof. Henning Schulzrinne, who has continually encouraged and inspired me for the past
eight years. Without that unerring support and guidance, this work would never have
reached completion. His incredible knowledge, insight, and patience have been a beacon
throughout this process, guiding me in the right direction.
In addition, I would like to thank the thesis commiee, Prof. Kaiser, Prof. Misra, Prof.
Zussman, and Prof. Sahu, for their insightful comments and encouragement during the
review process.
To all of my colleagues and friends in the IRT lab who never hesitated to help, and
always had the time to discuss ideas, whenever I needed assistance, for that I am truly
thankful to all of you.
Special thanks also go to my parents, Woonseok and Jongmai, and my brother, Joon-
hwa. ey have supported me with love and belief throughout my life. ey have all
constantly sacrificed while I was abroad to ensure I had everything I needed, and their
belief in me has kept me going through the hardest times.
Last but not the least, I would like to thank my wife, Jungahh, who has stood by me
with unfailing patience during the long hours that this thesis has taken. You are the one
iii

who made all of this happen. If I had not met you, I would already have given up. ank
you, and I love you.
iv

is dissertation is dedicated to my wife, Jungahh, to my parents, Woonseok and
Jongmai, and to my brother, Joonhwa.
v

is page intentionally le blank
vi
Introduction
While operating systems and computing devices have generally become more user-
friendly and reliable, Internet usage can still be frustrating — applications fail silently,
exhibit inconsistent performance, and failures are oen transient. Compared to the past,
consumer Internet usage has changed in at least three aspects: 1) Users now expect to
connect to a wide variety of networks, from home and office networks to Wi-Fi hotspots
in hotels, planes, and coffee shops. 2) Applications have become more demanding in
terms of Internet connectivity and network bandwidth because nearly every application,
from calendars to games, relies on remote “cloud” storage and servers. In addition, ap-
plications that enable communications based on real-time voice and video are used fre-
quently. Moreover, drastically growing usage of video streaming services now dominates
Internet traffic, which requires consistent performance of both provider and consumer
networks. 3) ese applications frequently rely on the proper functioning of up to half a
dozen parties, from the local wireless network to DNS servers, content delivery networks
(CDNs), and various middleboxes such as network address translation (NAT) devices and
firewalls. Yet, for all of these components, professional assistance is either unavailable or
expensive, and therefore, most users need to become unwilling network administrators
(or rely on their technically-savvy children or friends for assistance).
1
egoal of this thesis is to explore improved and alternativeways to assist diagnosis of
network issues using automated soware tools. We observe that traditional troubleshoot-
ing tools for computer networks, running on a local computer, had limited capability to
diagnose network failures because they are designed to observe and probe the failures
on a single machine only. In contrast to the approach, this thesis presents three studies
that focus on the possibility of collaboration using multiple machines instead of just one.
First, we describe DYSWIS (“Do You See What I See?”) [33], a framework for network
troubleshooting applications that leverages cooperation of users and their machines. e
framework is designed to support crowdsourced rules and collaborative probes. Second,
on top of the framework, we have developed two applications: WiSlow (“Why is my
Wi-Fi slow?”) [32], a Wi-Fi performance troubleshooting application and MoT (“Medic of
ings”) [34], a network diagnosis platform for mobile devices and the Internet of ings
(IoT). e main features and contributions of the framework and applications are sum-
marized below.
DYSWIS: Troubleshooting network failures
ekey contribution of theDYSWIS framework is supporting collaboration of peers. First,
DYSWIS uses passively collected data from multiple users such as failure statistics and
normal paerns of network packets. e data is used to automatically detect abnormal
network packets and problematic behavior of an end user’s application. Second, for the
actual diagnosis, DYSWIS triggers active probes on multiple end-user machines located in
different networks. en, receiving the results of those probes, DYSWIS collects various
2
perspectives on the problems observed by other users. Since this information captures
multiple views from different networks and locations, the probability of identifying the
root causes is much higher than the case that the data is collected only from a local ma-
chine.
In addition, reflecting the proliferation of services, both standardized and proprietary,
new probes and rule sets are designed to be extensible by users and third parties, includ-
ing the vendors of the applications. For this purpose, DYSWIS adopts a crowdsourcing
approach to create extensible sets of rules and probes. e rule system is designed to
systemically support a crowdsourcing process and take advantage of collected rules and
probes. To achieve this, we use sets of tiny independent rules instead of a single ver-
bose rule to diagnose a problem. Finally, the architecture includes practical cooperative
mechanisms such as parallel distribution of the probe requests and a scoring system that
achieves fast and error-tolerant diagnosis.
Using the framework, various diagnostic rules and probes can be developed. First,
we focus on failures on the higher layers of the protocol stack, including the network,
transport, and application layers rather than the link or physical layers. For example,
DYSWIS aempts to diagnose Internet connectivity issues, DNS failures, NAT problems,
and TCP errors. To verify the feasibility of our approach, we artificially inject several
network-related failures addressed by other research studies into our testbed, and then
compare the diagnostic results of DYSWIS with four other soware applications. By tak-
ing advantage of the assistance of other nodes, DYSWIS successfully identifies the root
cause in seven out of eleven scenarios.
3
WiSlow: Diagnosing failures in wireless networks
Networks failures are not always caused by upper-layer protocols. Problems caused by
the lower layers such as 802.11 wireless networks also cause significant connectivity and
performance issues. Although poor Wi-Fi performance oen causes an unsatisfactory
user experience, isolating the root causes is nontrivial, even for a network expert because
there are no effective soware tools for investigating the lower layers. Additionally, these
problems oen show very similar symptoms at the user level, requiring special devices to
investigate them. is motivated WiSlow, which is designed to diagnose the root causes
of poor Wi-Fi performance with user-level network probes and leverages peer collabora-
tion to identify the physical locations of these causes. WiSlow first distinguishes channel
contention from non-Wi-Fi interference, then infers the product type of the interfering
device (e.g., a microwave oven, cordless phone, or babymonitor) by analyzing the network
packets. Finally, WiSlow points out the approximate location of the source of interference
by exploiting user collaboration. We evaluate WiSlow with various interference sources
and it demonstrates high diagnostic accuracy.
MoT: Diagnosing failures in wireless networks
Finally, we present a network problem diagnosis platform for the IoT environment. In
this environment, devices are required to connect to Internet to perform their functions
correctly. However, when they have a network problem, small devices that have less
computing power are oen not capable of troubleshooting the issues. erefore, we pro-
pose a platform in which not only computers, but also smart objects such as smart TVs
4
or network-connected door locks interact with each other to contribute to identifying the
causes of network failures. In this model, it is possible that small devices offload the trou-
bleshooting task to other devices that have more capabilities (e.g., network accessibility or
computing power). We present the architecture and mechanism that support the collabo-
ration of home devices and end-user devices such as laptop computers and smartphones.
We also demonstrate the feasibility of this approach by describing an Android application
that contains an algorithm that diagnoses failure scenarios.
Overview of the esis
is thesis is composed of three chapters. Chapter 1 discusses DYSWIS in detail with
architecture and mechanisms of DYSWIS presented in Section 1.2 to Section 1.4. We eval-
uate the collaborative approach in Section 1.6 and discuss additional issues, including
security concerns, on DYSWIS in Section 1.8.
Chapter 2 presents WiSlow. In Section 2.2, common sources of Wi-Fi performance
degradation are described. In Section 2.3, restrictions of an end user’s environment are
discussed as well as how WiSlow aempts to overcome them. Section 2.4 to Section 2.8
explain the detailedmethods employed byWiSlow and Section 2.9 evaluates our approach.
Chapter 3 describes MoT. In Section 3.2, we introduce the architecture of MoT, and in
Section 3.3, we discuss several practical scenarios of problem diagnosis. en, we present
the details of MoT implementation in Section 3.4 and demonstrate the feasibility of this
approach in Section 3.5. Finally, we state our conclusions in the last chapter.
5

Chapter 1
DYSWIS: a network troubleshooting framework
1.1 Introduction
When applications fail due to network problems, most of them provide minimal support,
at best, to help identify potential sources of trouble. If Web access is slow, for example,
the cause could be high packet loss on the local wireless network due to interference, an
overloaded residential Internet connection, wide-area network problems, a misconfigu-
ration in the NAT box, or a remote server problem. e appropriate action varies in each
case, ranging from using a third-party DNS server to simply waiting and hoping that the
server recovers.
e diagnostic mechanism of DYSWIS differs from other conventional methods in
relying on the assistance of other network users, modeling the common paernwhere one
person asks someone close by, “Hey, is your Internet working?” In other words, DYSWIS
focuses on collaborative diagnosis and parallel probing. Reflecting the proliferation of
services, both standardized and proprietary, DYSWIS is designed to be extensible by users
and third parties such as vendors of applications. In addition, we present a crowdsourcing
approach that enables end users, developers, and network administrators to contribute
new rules and diagnostic modules to expand DYSWIS functionality.
7
To summarize, DYSWIS is a complete system that automatically diagnoses common
network problems for end users using peer assistance in addition to an extensible probing
and a rule framework. e main contributions of the DYSWIS architecture are as follows:
Detecting problems autonomously
DYSWIS uses a statistical mechanism to determine whether particular network packets
observed in a user machine are indicators of significant network failures, which should
be further diagnosed, or if they are part of a normal behavior which can be ignored.
Optimized design for crowdsourced rules
To support crowdsourcing of network experts effectively, we build a rule system that is
composed of small independent rules. DYSWIS also provides a simple application inter-
face that enables multiple groups of developers, network administrators, and application
vendors to participate in writing new probe modules and diagnostic rules.
Designed for distributed networks
DYSWIS is specially designed to support decentralized networks such as distributed hash
tables (DHTs) which enables nodes to collaborate without an infrastructure and achieve
Internet scale. As each node’s information is published as key-value pairs into a DHT,
other nodes can discover appropriate nodes effectively. In this thesis, we use ‘node’ and
‘peer’ interchangeably to indicate a user machine that participates in probing network
failures in the DYSWIS system.
8
Practical design for distributed probes
A node categorizes other nodes by their properties. e categories are useful for help-
ing a problematic node find appropriate peers that are able to help the node. Once a
peer is found, a node distributes probing requests to multiple peers simultaneously to ob-
tain probing results from different networks. Using the results, it infers the status of the
network infrastructure, which is normally invisible to end-users, without any help from
network core devices.
1.2 DYSWIS network
e key feature of DYSWIS is the collaboration of end users. erefore, a node first needs
to discover other users who are willing to assist in the problem diagnosis. A central-
ized server is one of the possible options to maintain a list of available peers; an alter-
native method is to build a distributed hash table (DHT) composed of end users. Al-
though centralized-server approach is straightforward and easier to implement, it does
not function perfectly in this case since we assume this system will run in problematic
situations in most cases, which means it is highly probable that the end-user system is not
able to connect to the centralized server. erefore, our current implementation adopts
the distributed-network approach, which is more scalable and also tolerant to the single-
point-of-failure problem [42].
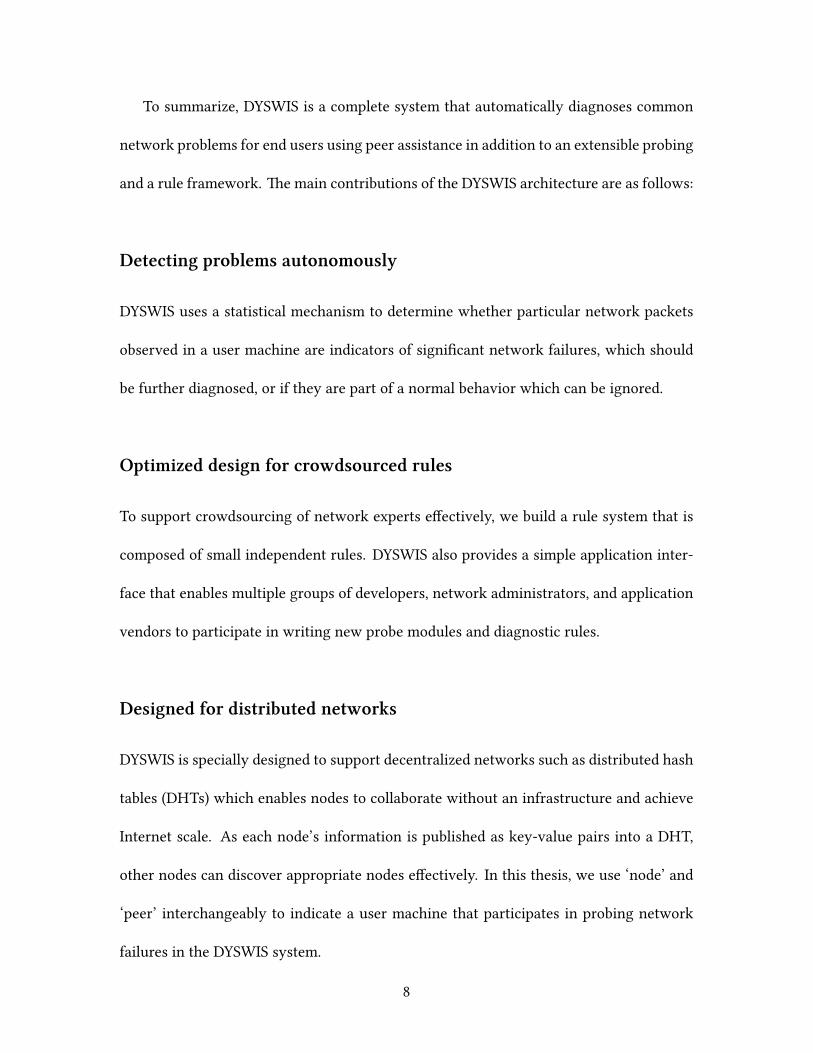
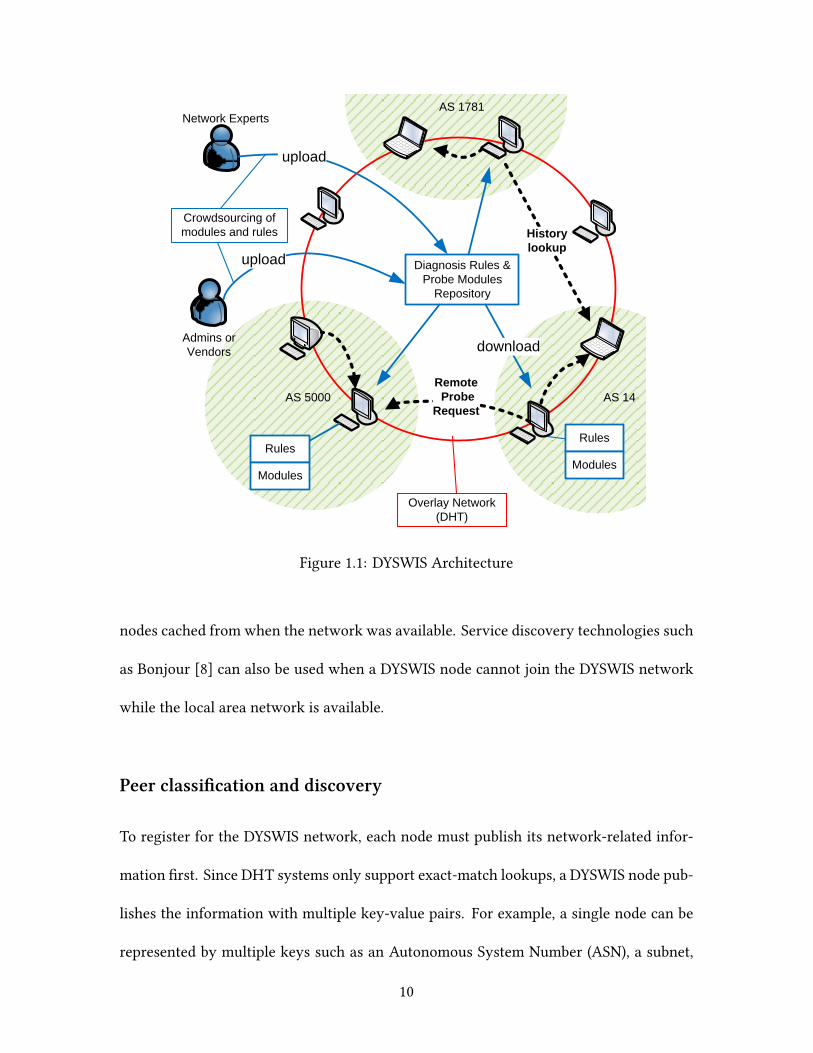
Figure 1.1 shows the DYSWIS network that uses DHT to connect to other collaborative
nodes. Since we are focusing more on partial network faults, we assume that a node is
able to connect to a few other nodes, or at least have a list of network addresses of other
9
AS 14AS 5000
AS 1781
History
lookup
Remote
Probe
Request
Diagnosis Rules &
Probe Modules
Repository
Network Experts
upload
downloadAdmins or
Vendors
upload
Overlay Network
(DHT)
Crowdsourcing of
modules and rules
Rules
Modules
Rules
Modules
Figure 1.1: DYSWIS Architecture
nodes cached from when the network was available. Service discovery technologies such
as Bonjour [8] can also be used when a DYSWIS node cannot join the DYSWIS network
while the local area network is available.
Peer classification and discovery
To register for the DYSWIS network, each node must publish its network-related infor-
mation first. Since DHT systems only support exact-match lookups, a DYSWIS node pub-
lishes the information with multiple key-value pairs. For example, a single node can be
represented by multiple keys such as an Autonomous System Number (ASN), a subnet,
10
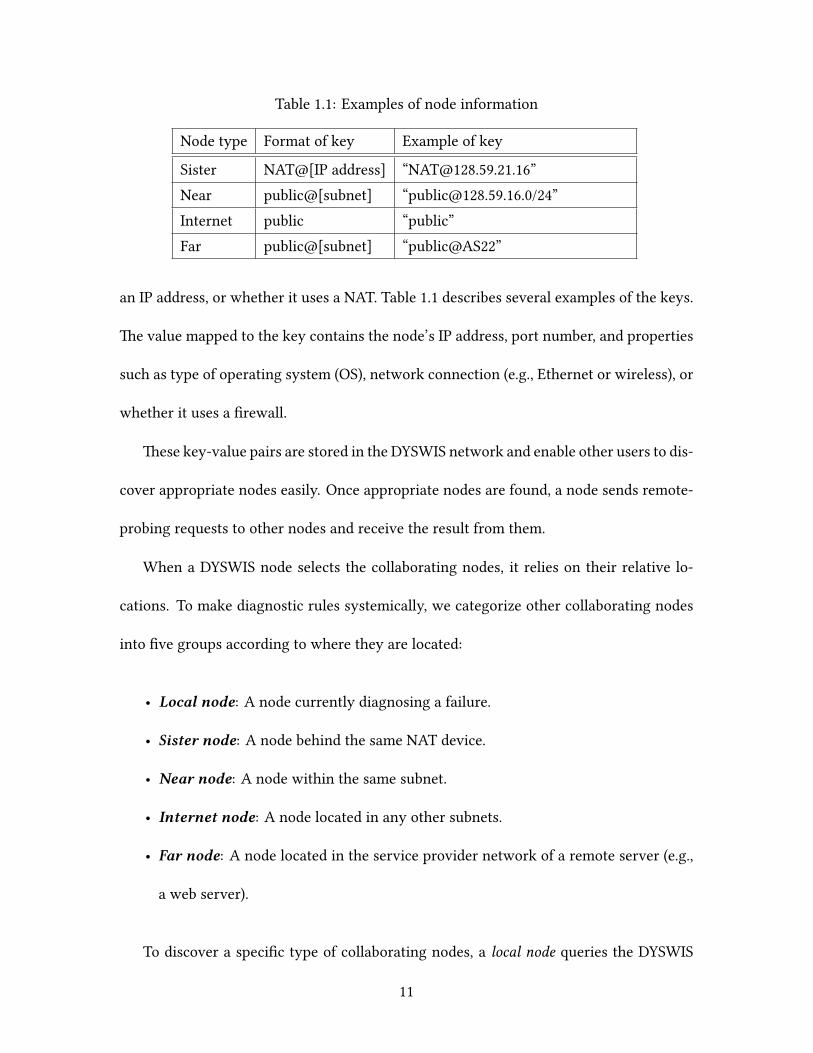
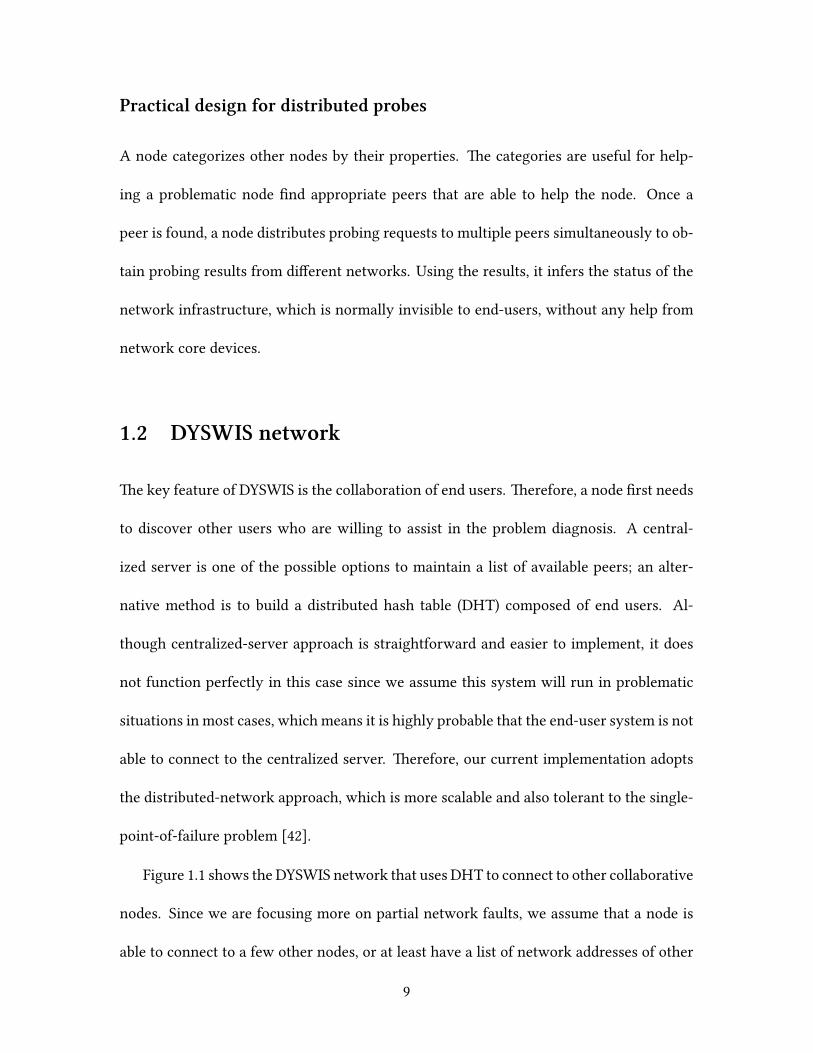
Table 1.1: Examples of node information
Node type Format of key Example of key
Sister NAT@[IP address] “[email protected]”Near public@[subnet] “[email protected]/24”Internet public “public”Far public@[subnet] “public@AS22”
an IP address, or whether it uses a NAT. Table 1.1 describes several examples of the keys.
e value mapped to the key contains the node’s IP address, port number, and properties
such as type of operating system (OS), network connection (e.g., Ethernet or wireless), or
whether it uses a firewall.
ese key-value pairs are stored in the DYSWIS network and enable other users to dis-
cover appropriate nodes easily. Once appropriate nodes are found, a node sends remote-
probing requests to other nodes and receive the result from them.
When a DYSWIS node selects the collaborating nodes, it relies on their relative lo-
cations. To make diagnostic rules systemically, we categorize other collaborating nodes
into five groups according to where they are located:
• Local node: A node currently diagnosing a failure.
• Sister node: A node behind the same NAT device.
• Near node: A node within the same subnet.
• Internet node: A node located in any other subnets.
• Far node: A node located in the service provider network of a remote server (e.g.,
a web server).
To discover a specific type of collaborating nodes, a local node queries the DYSWIS
11
network with a corresponding key. For example, to obtain a near node, the key must
include the subnet information or address of the first-hop router of the local node. If the
local node is behind a NAT, we oen need to discover a sister node to obtain the view from
the same environment. In this case, the key includes the public IP address of the NAT
device. To seek an Internet node, we simply query with a key, “public”, that returns a list
of random nodes from other networks. en, we can filter out near nodes from the list
to obtain only Internet nodes. In addition, we can discover a far node located at a specific
subnet. is far node is useful when we need to probe the subnet at which a problematic
remote server is located.
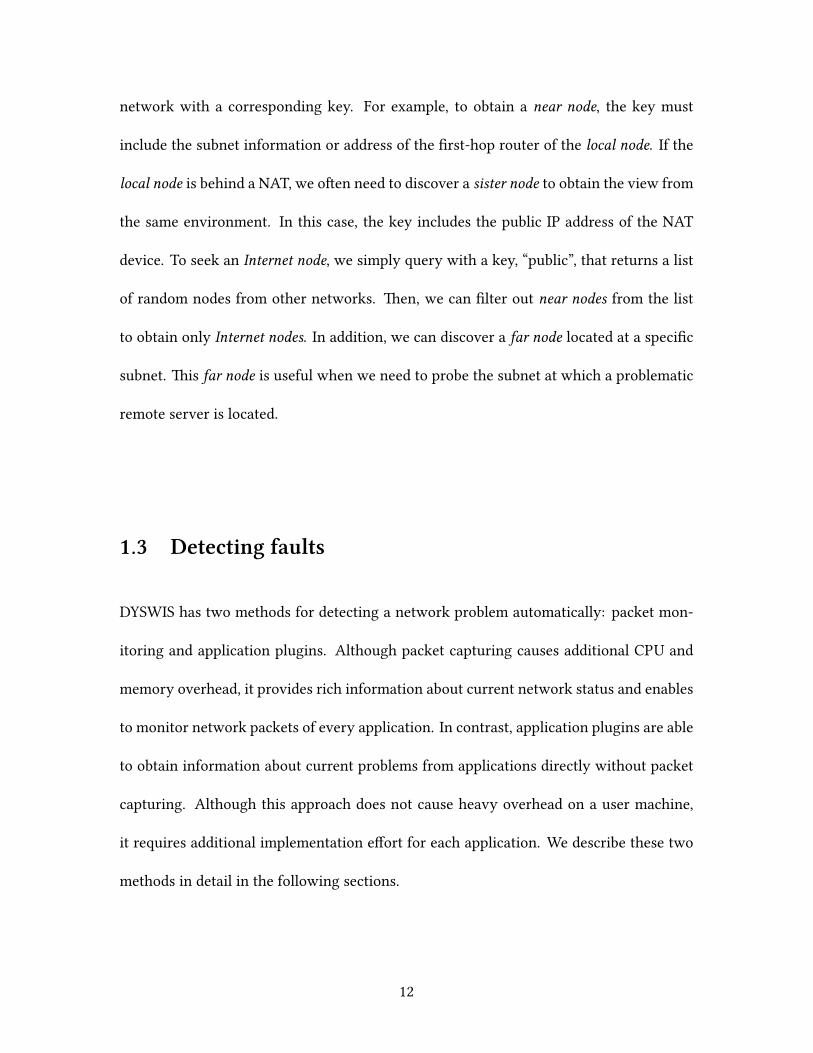
1.3 Detecting faults
DYSWIS has two methods for detecting a network problem automatically: packet mon-
itoring and application plugins. Although packet capturing causes additional CPU and
memory overhead, it provides rich information about current network status and enables
to monitor network packets of every application. In contrast, application plugins are able
to obtain information about current problems from applications directly without packet
capturing. Although this approach does not cause heavy overhead on a user machine,
it requires additional implementation effort for each application. We describe these two
methods in detail in the following sections.
12
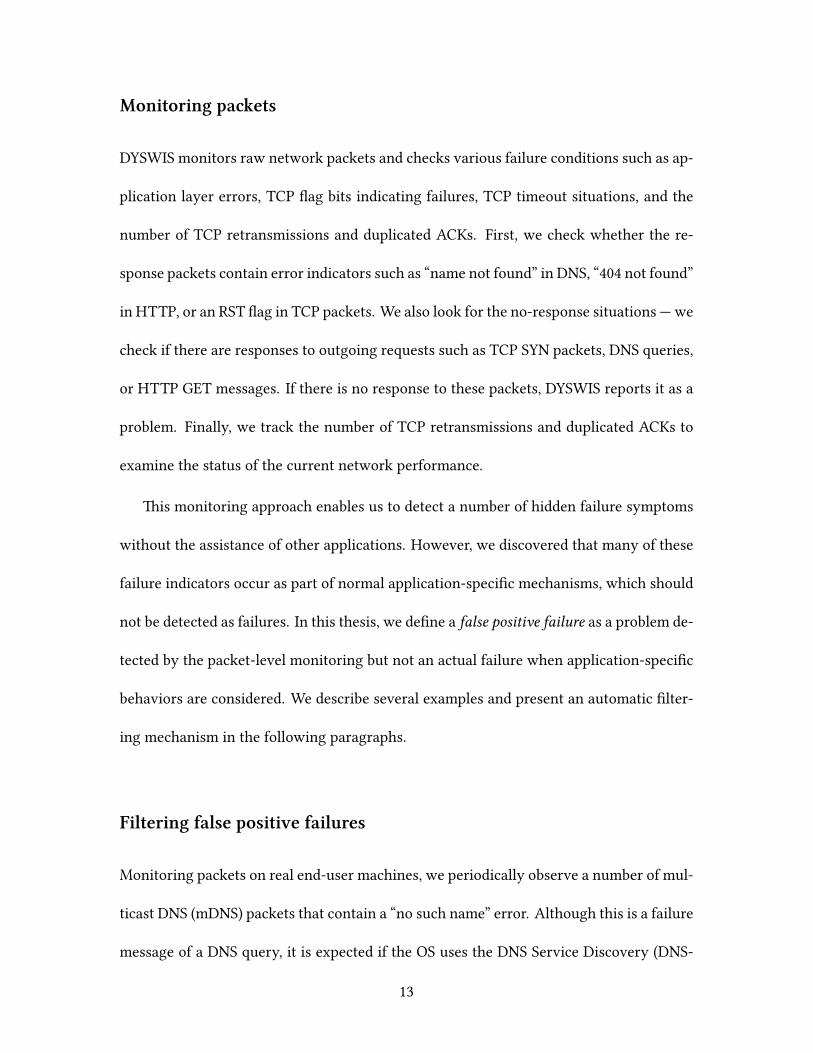
Monitoring paets
DYSWIS monitors raw network packets and checks various failure conditions such as ap-
plication layer errors, TCP flag bits indicating failures, TCP timeout situations, and the
number of TCP retransmissions and duplicated ACKs. First, we check whether the re-
sponse packets contain error indicators such as “name not found” in DNS, “404 not found”
in HTTP, or an RST flag in TCP packets. We also look for the no-response situations —we
check if there are responses to outgoing requests such as TCP SYN packets, DNS queries,
or HTTP GET messages. If there is no response to these packets, DYSWIS reports it as a
problem. Finally, we track the number of TCP retransmissions and duplicated ACKs to
examine the status of the current network performance.
is monitoring approach enables us to detect a number of hidden failure symptoms
without the assistance of other applications. However, we discovered that many of these
failure indicators occur as part of normal application-specific mechanisms, which should
not be detected as failures. In this thesis, we define a false positive failure as a problem de-
tected by the packet-level monitoring but not an actual failure when application-specific
behaviors are considered. We describe several examples and present an automatic filter-
ing mechanism in the following paragraphs.
Filtering false positive failures
Monitoring packets on real end-user machines, we periodically observe a number of mul-
ticast DNS (mDNS) packets that contain a “no such name” error. Although this is a failure
message of a DNS query, it is expected if the OS uses the DNS Service Discovery (DNS-
13
SD) protocol to discover services. is happens when a machine sends a service query
message, but the service does not exist in the network. In this case, there is no point in
reporting these errors to end users. Another example is HTTP long polling [14]. Long
polling is one of the push technologies, which is used by many applications and web
sites to communicate interactively with clients without disconnecting a TCP connection.
With long polling, a web server does not respond immediately aer receiving an HTTP
GET request but rather responds aer a period of time (e.g., one minute) to maintain the
connection. Although this delay is intended, its paern is identical to the case of a slow
response due to poor network performance or a problematic web server. erefore, even
though it is not an actual failure, long polling will be considered as a failure (i.e., high
latency) in the packet monitoring system.
Other examples include TCP-related failures such as TCP retransmission and TCP
RST packets. Although TCP RST packets usually imply that a session is unexpectedly
terminated, they are normal in some applications. For example, it is known that YouTube
may cause a number of TCP RST packets when a client changes video resolution while
watching a video [37].
Another example is TCP retransmission. Although the occurrence of a large num-
ber of TCP retransmissions indicates significant performance degradation, it is normal
to have a small number of retransmissions caused by temporary network congestion.
us, a fault detection system needs to set off an alarm only when an unusual number of
TCP retransmissions have been detected. In addition, some TCP RST packets can also be
misidentified as failures.
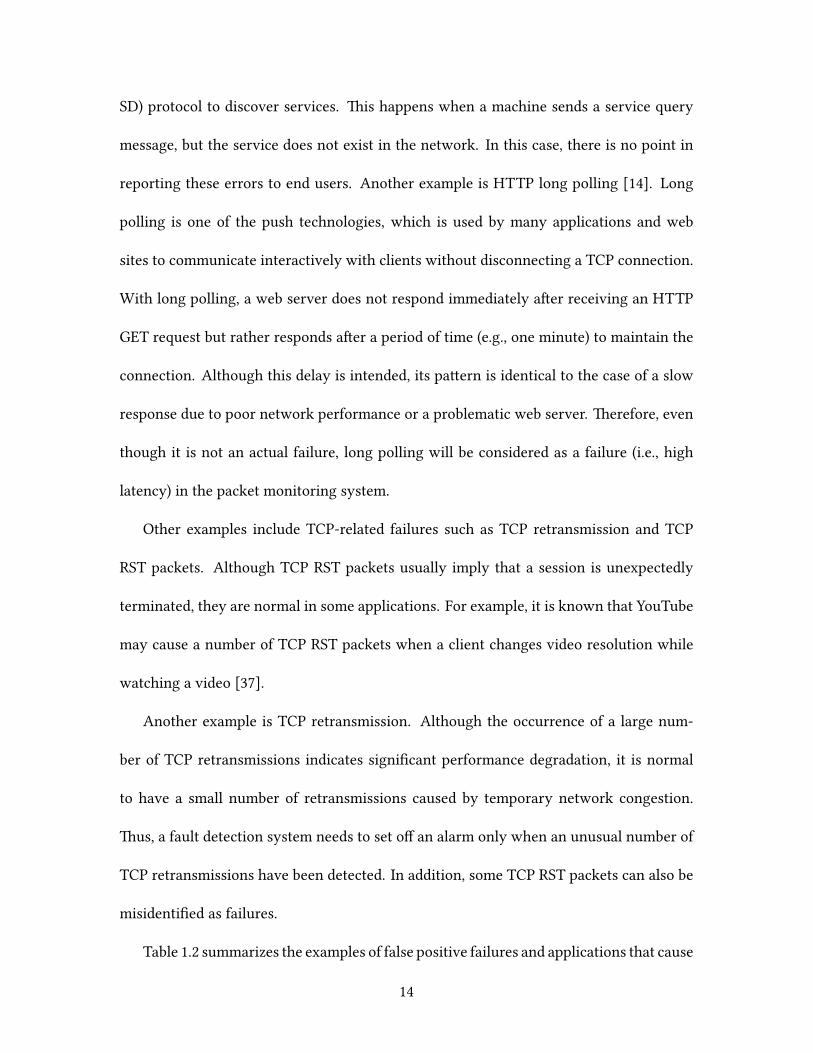
Table 1.2 summarizes the examples of false positive failures and applications that cause
14
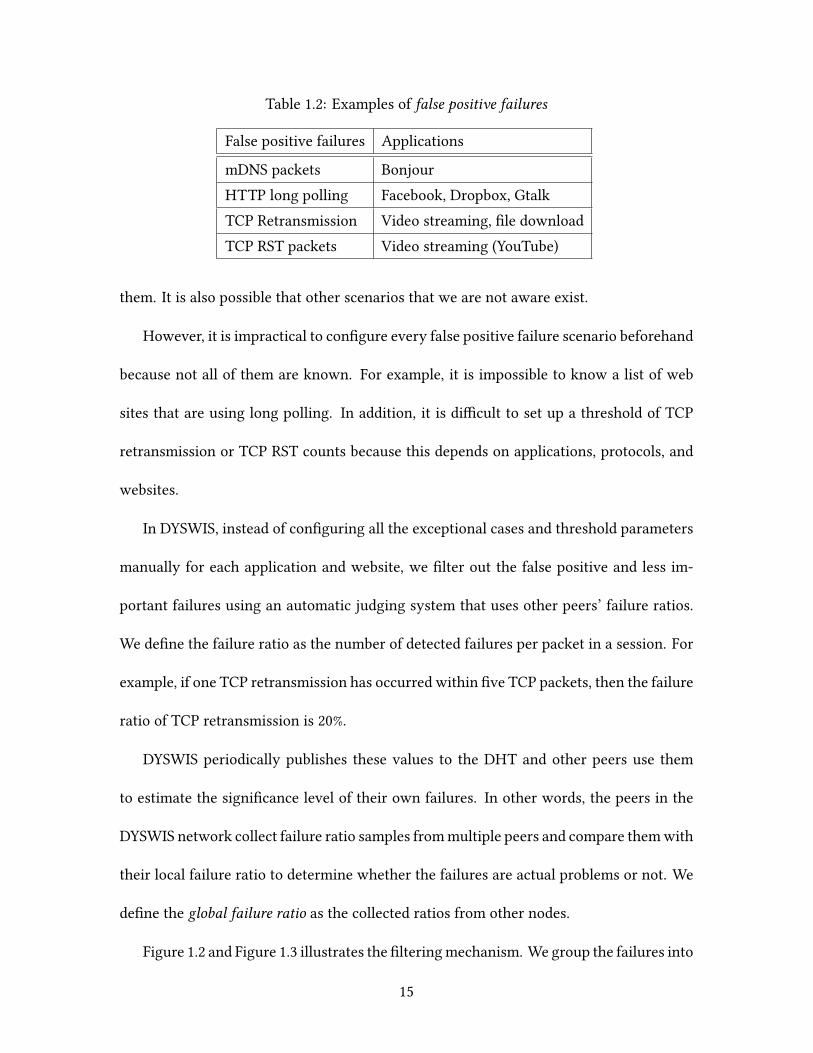
Table 1.2: Examples of false positive failures
False positive failures Applications
mDNS packets BonjourHTTP long polling Facebook, Dropbox, GtalkTCP Retransmission Video streaming, file downloadTCP RST packets Video streaming (YouTube)
them. It is also possible that other scenarios that we are not aware exist.
However, it is impractical to configure every false positive failure scenario beforehand
because not all of them are known. For example, it is impossible to know a list of web
sites that are using long polling. In addition, it is difficult to set up a threshold of TCP
retransmission or TCP RST counts because this depends on applications, protocols, and
websites.
In DYSWIS, instead of configuring all the exceptional cases and threshold parameters
manually for each application and website, we filter out the false positive and less im-
portant failures using an automatic judging system that uses other peers’ failure ratios.
We define the failure ratio as the number of detected failures per packet in a session. For
example, if one TCP retransmission has occurred within five TCP packets, then the failure
ratio of TCP retransmission is 20%.
DYSWIS periodically publishes these values to the DHT and other peers use them
to estimate the significance level of their own failures. In other words, the peers in the
DYSWIS network collect failure ratio samples frommultiple peers and compare themwith
their local failure ratio to determine whether the failures are actual problems or not. We
define the global failure ratio as the collected ratios from other nodes.
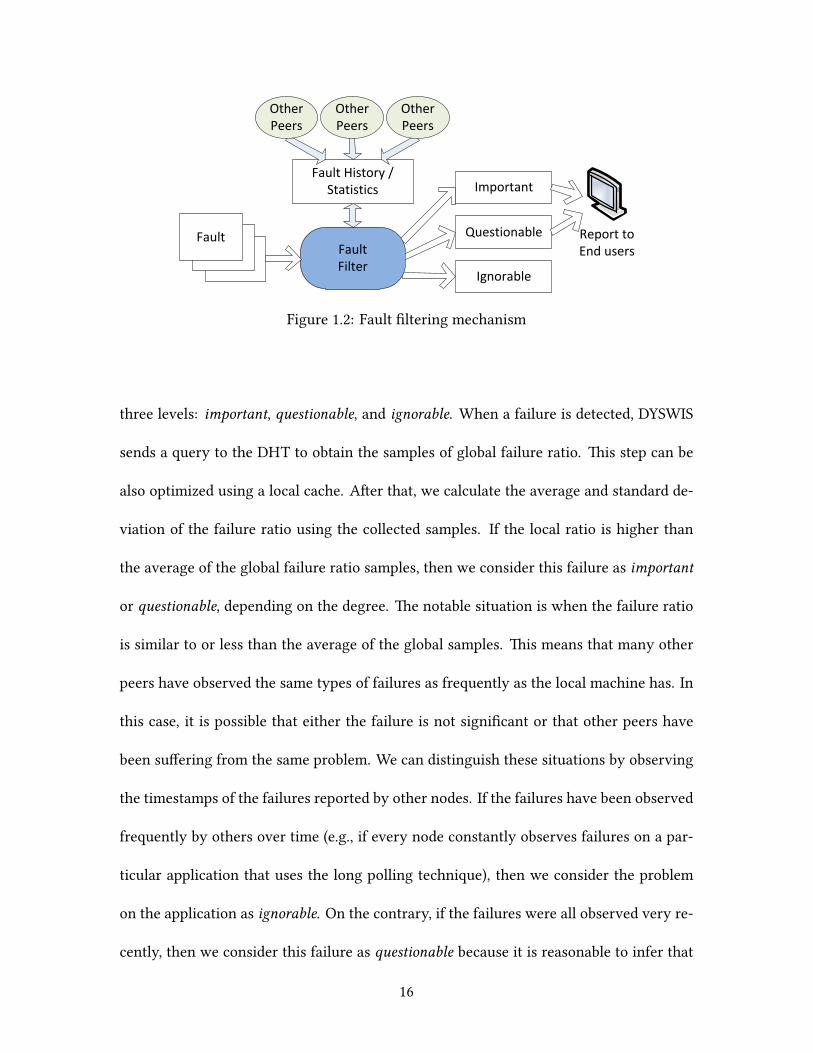
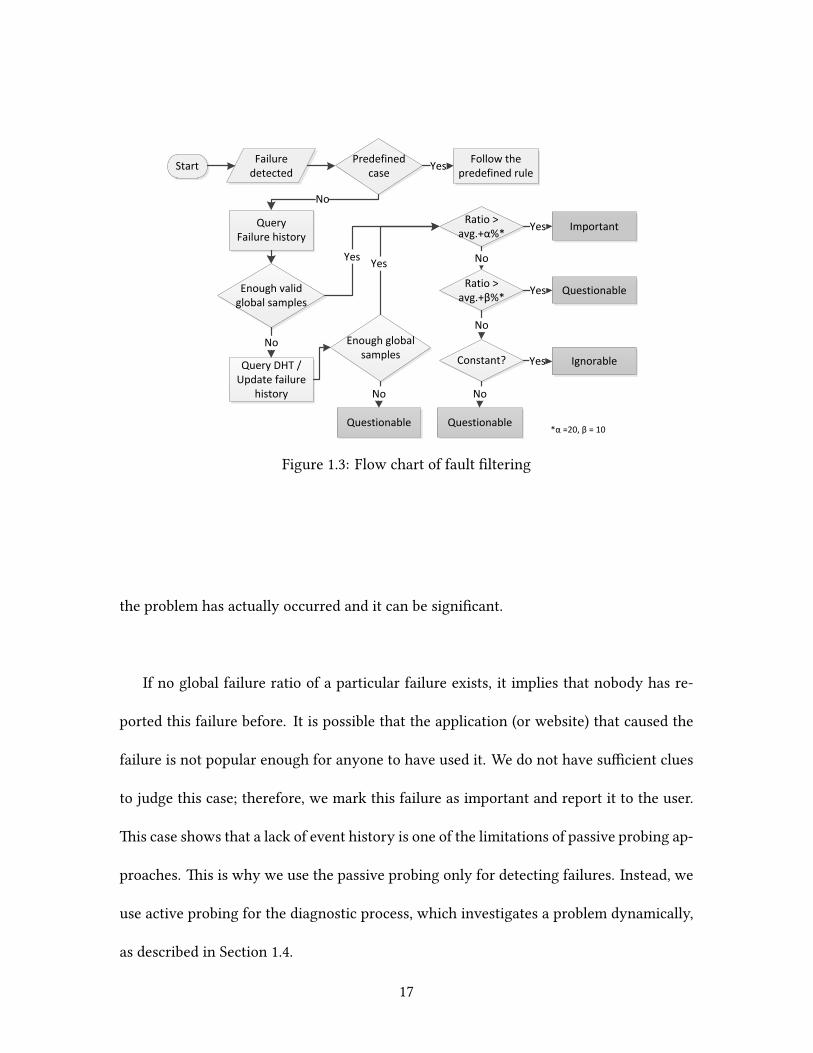
Figure 1.2 and Figure 1.3 illustrates the filteringmechanism. We group the failures into
15
FaultFaultFilter
Fault History / Statistics
OtherPeers
OtherPeers
OtherPeers
Important
Questionable
Ignorable
Report to End users
Figure 1.2: Fault filtering mechanism
three levels: important, questionable, and ignorable. When a failure is detected, DYSWIS
sends a query to the DHT to obtain the samples of global failure ratio. is step can be
also optimized using a local cache. Aer that, we calculate the average and standard de-
viation of the failure ratio using the collected samples. If the local ratio is higher than
the average of the global failure ratio samples, then we consider this failure as important
or questionable, depending on the degree. e notable situation is when the failure ratio
is similar to or less than the average of the global samples. is means that many other
peers have observed the same types of failures as frequently as the local machine has. In
this case, it is possible that either the failure is not significant or that other peers have
been suffering from the same problem. We can distinguish these situations by observing
the timestamps of the failures reported by other nodes. If the failures have been observed
frequently by others over time (e.g., if every node constantly observes failures on a par-
ticular application that uses the long polling technique), then we consider the problem
on the application as ignorable. On the contrary, if the failures were all observed very re-
cently, then we consider this failure as questionable because it is reasonable to infer that
16
Follow the predefined rule
StartFailure
detectedPredefined
case
Query Failure history
No
Enough valid global samples
Query DHT / Update failure
history
No Enough global samples
Ratio > avg.+α%*
YesYes
Yes
Ratio > avg.+β%*
No
Constant?
No
Questionable
No
IgnorableYes
QuestionableYes
ImportantYes
Questionable
No
*α =20, β = 10
Figure 1.3: Flow chart of fault filtering
the problem has actually occurred and it can be significant.
If no global failure ratio of a particular failure exists, it implies that nobody has re-
ported this failure before. It is possible that the application (or website) that caused the
failure is not popular enough for anyone to have used it. We do not have sufficient clues
to judge this case; therefore, we mark this failure as important and report it to the user.
is case shows that a lack of event history is one of the limitations of passive probing ap-
proaches. is is why we use the passive probing only for detecting failures. Instead, we
use active probing for the diagnostic process, which investigates a problem dynamically,
as described in Section 1.4.
17
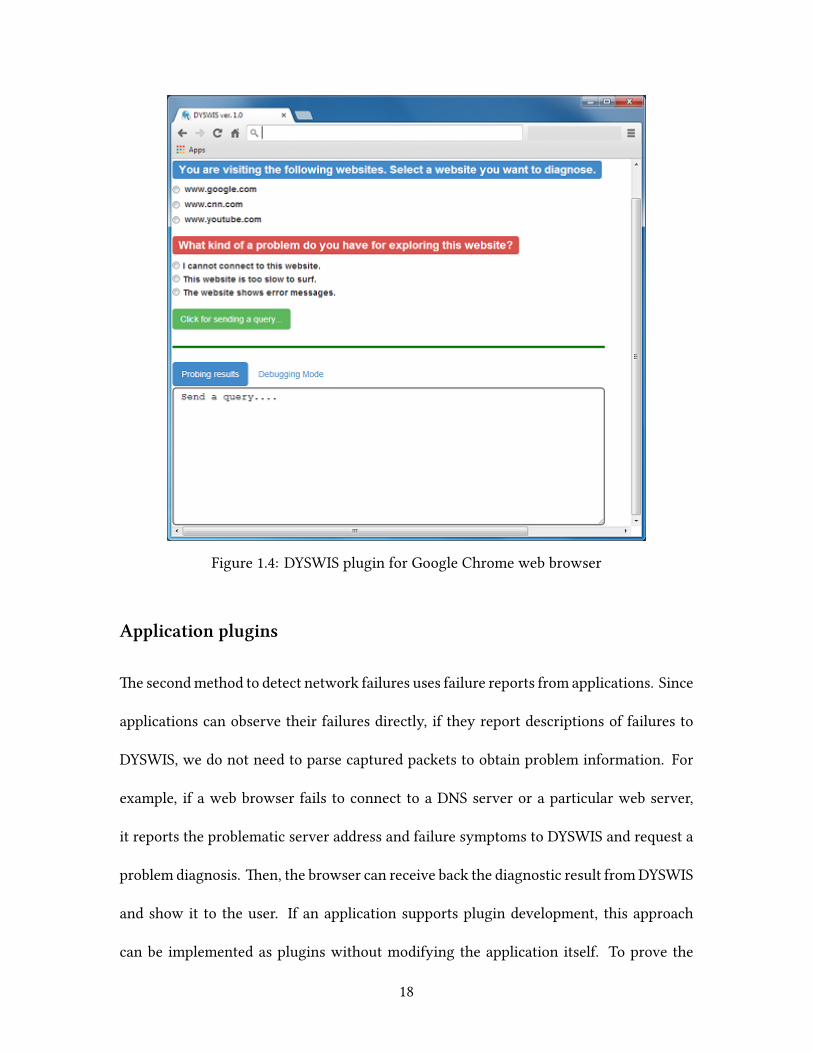
Figure 1.4: DYSWIS plugin for Google Chrome web browser
Application plugins
e secondmethod to detect network failures uses failure reports from applications. Since
applications can observe their failures directly, if they report descriptions of failures to
DYSWIS, we do not need to parse captured packets to obtain problem information. For
example, if a web browser fails to connect to a DNS server or a particular web server,
it reports the problematic server address and failure symptoms to DYSWIS and request a
problem diagnosis. en, the browser can receive back the diagnostic result fromDYSWIS
and show it to the user. If an application supports plugin development, this approach
can be implemented as plugins without modifying the application itself. To prove the
18
feasibility of this concept, we implemented a Google Chrome plugin that interacts with
DYSWIS to report network failures that occur while surfing the Internet.
1.4 Diagnostics
We have described how to detect and filter network failures in the previous sections. e
next step is to diagnose the detected network faults. In this phase, we actively diagnose
faults in real time to avoid relying on stale information. e history of faults obtained
from other nodes is helpful for filtering the faults, but it is oen useless in identifying
the root cause. For example, a result of probing that was performed an hour ago has
no significance if a failure occurred five minutes ago. In addition, if nobody has tried to
connect to a problematic server during that period, it is difficult to collect proper data
to diagnose the fault. In the following sections, we elaborate the probing process and
introduce our crowdsourcing-based rule and probing system.
Probing modules
Probing modules in the DYSWIS system are small programs that investigate various net-
working conditions. Each DYSWIS node has a set of probing modules, which can be
updated via the module repository.
A probing request contains a name of a probing module to be invoked and fault in-
formation to be used as parameters. e response can be either a return value generated
by the probing module or ‘no response,’ which means that the node does not answer.
Sometimes, ‘no response’ also provides an important clue for diagnosing the fault. For
19
example, if a node is able to contact some near nodes while failing to contact every far
node, we can infer that there is a network connection issue from the local subnet to the
outside network.
Crowdsourced rules
e diagnostic rules specify which probing modules need to be invoked in which order
and where (local or remote). eir roles also include analyzing the feedback from other
nodes and providing final diagnostic results to users. A decision tree is a straightforward
way to formulate diagnostic rules. Such a tree indicates which probing module should be
invoked, and its result decides the next step of probing. is is repeated until a leaf of a
tree is reached, which is either a conclusion or the execution of another rule. We use our
own Python-like syntax to represent the decision trees.
However, although decision trees show the diagnostic flow clearly, they do not fit a
crowdsourcing approach. For example, our prior work [7] diagnoses VoIP failures using
decision-tree-based rules that are designed carefully by VoIP experts. Ironically, how-
ever, these complete and large-size rules are not easily upgraded or expanded by others
because the rules are too intricate to be completely understood. It is very common that
a decision tree does not work as originally intended when a single part of the decision
tree is modified. Furthermore, more importantly, a decision tree-based-rule can mislead
if one of the probes in the middle of the decision tree returns incorrect information. In
addition, it oen takes a long time to complete the entire decision process since a next
step will be chosen only aer the current probe is completed and the result is returned.
20
If a collaborative node does not answer quickly due to the probing process itself or to
network latency, the steps are entirely suspended. For these reasons, we suggest a rule
system that is tailored to crowdsourcing of rules and parallel remote probes.
In DYSWIS framework, there are two groups who participate to build new diagnosis
strategy: Probing module programmers and network experts (e.g., network administra-
tors, application vendors). Programmers create new probing modules for new protocols
that they want to diagnose, or they can also modify basic probing modules which we
provide. Network experts write rules to determine the sequence of executing probing
modules. When they build new diagnosis strategy, they simply list up necessary probing
modules and construct new rules with them.
Voting-based rules
Searching for “network problems” on Google returns millions of web pages. Many of
these are linked to Q&A boards where people discuss their symptoms and others suggest
possible causes. However, it is very inefficient to visit every website and read every an-
swer to determine a correct solution for a specific situation. e DYSWIS rule repository
is intended to provide a unified platform for collecting such knowledge in a single place.
estions and answers on the Internet are equivalent to the diagnostic rules in DYSWIS.
To support crowdsourcing efficiently, we design the rules to be simple and independent.
Each rule contains the name of a probing module, a type of node, a probe result, likely
causes, and unlikely causes. Likely causes are the causes that the author of the rule believes
to be the probable causes when the particular type of node runs the probing module and
21
returns the specified result. On the contrary, unlikely causes are the causes that are be-
lieved to be irrelevant to the returned result.
When a user creates or updates a rule on the DYSWIS rule website, other experts can
judge the new rule and vote; plus one if they think it is true and useful (up-vote), and
minus one if it is incorrect (down-vote). e effectiveness of this type of voting has been
proven through many crowdsourced social websites such as Reddit and Stackoverflow.
Similar to these websites, the useful rules acquire greater points and more aention. e
total voting points for an incorrect or unhelpful rule will be low or even negative. Ignoring
the rules that have negative voting scores, DYSWIS can filter out inappropriate rules.
Parallel remote probing
To diagnose faults, DYSWIS first selects an appropriate set of rules based on the detected
symptoms of failures and automatically excludes the rules that have negative or low vot-
ing points. en, it sends probe requests to particular types of remote users according to
the rules. Remote users respondwith their probing results asynchronously, andwhenever
a result arrives, the possibility scores of potential causes are updated.
When a probe result arrives, the diagnosis module in DYSWIS finds a rule matched to
the received result. It then increases the possibility score of each cause in the likely causes
list and decreases the score of the causes in the unlikely causes list. For example, in our
example described in Table 1.3, if a sister node is asked to run the TCPConnectionmodule,
it will verify whether a TCP connection to the remote server is successful. If it succeeds,
it will respond ‘Yes’, and we increase the possibility score of problem C1 in Table 1.3a and
22
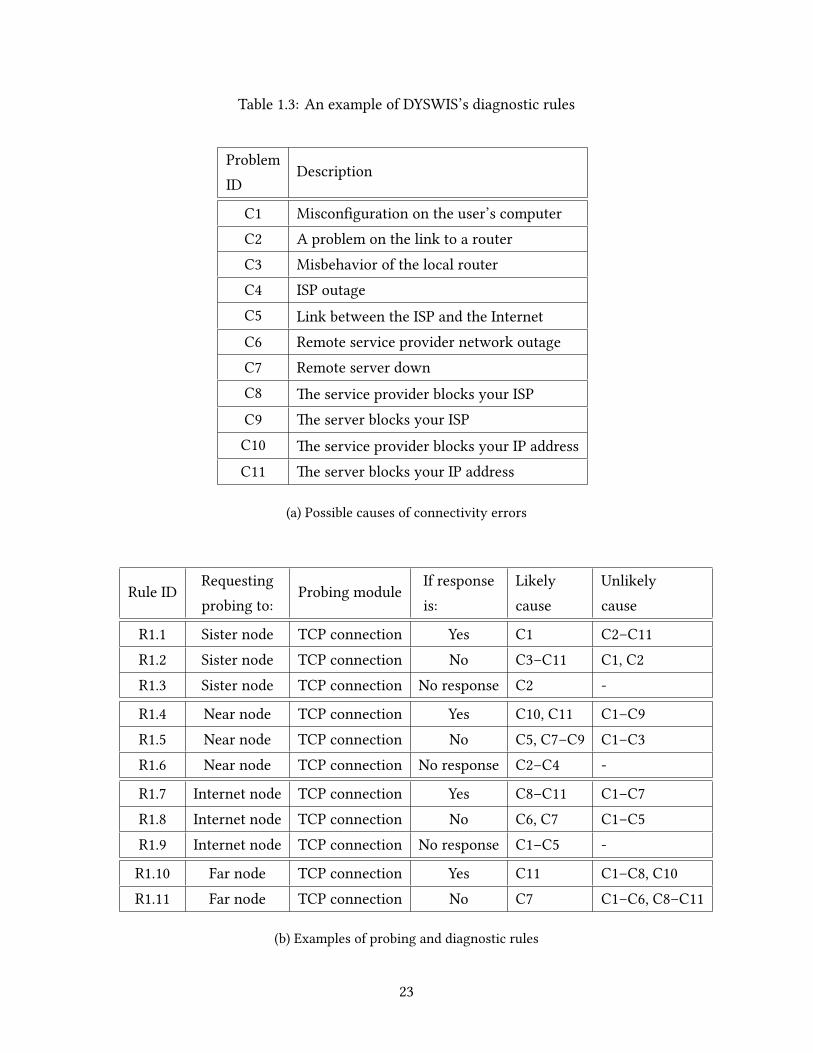
Table 1.3: An example of DYSWIS’s diagnostic rules
ProblemID
Description
C1 Misconfiguration on the user’s computerC2 A problem on the link to a routerC3 Misbehavior of the local routerC4 ISP outageC5 Link between the ISP and the InternetC6 Remote service provider network outageC7 Remote server downC8 e service provider blocks your ISPC9 e server blocks your ISPC10 e service provider blocks your IP addressC11 e server blocks your IP address
(a) Possible causes of connectivity errors
Rule IDRequestingprobing to:
Probing moduleIf responseis:
Likelycause
Unlikelycause
R1.1 Sister node TCP connection Yes C1 C2–C11R1.2 Sister node TCP connection No C3–C11 C1, C2R1.3 Sister node TCP connection No response C2 -
R1.4 Near node TCP connection Yes C10, C11 C1–C9R1.5 Near node TCP connection No C5, C7–C9 C1–C3R1.6 Near node TCP connection No response C2–C4 -
R1.7 Internet node TCP connection Yes C8–C11 C1–C7R1.8 Internet node TCP connection No C6, C7 C1–C5R1.9 Internet node TCP connection No response C1–C5 -
R1.10 Far node TCP connection Yes C11 C1–C8, C10R1.11 Far node TCP connection No C7 C1–C6, C8–C11
(b) Examples of probing and diagnostic rules
23
decrease all the other possibility scores according to rule R1.1, as shown in Table 1.3b. e
results from other collaborative nodes also update the scores, and finally, the cause with
the highest score is considered the most probable root cause. Aer informing the users
of the diagnostic results, we can also collect useful feedback information by asking them
whether the diagnostic result was correct. e statistics obtained from this survey can be
used to improve the rules and estimate the occurrence frequencies of the actual causes.
In the case where our diagnostic results fail to pinpoint a specific cause, this occurrence
frequency will be helpful for users to know which cause is the most common one.
Our architecture makes crowdsourcing approach feasible in developing diagnostic
rules — the independence of rules enables multiple participants to create their rules easily
without disturbing other rules. e voting feature enables DYSWIS to exclude useless or
incorrect rules, and distinguish more commonly occurring causes. In addition, the sep-
aration of rules makes parallel remote probing possible. Since the diagnostic process is
not affected by the order of received probe results, a node can distribute probe requests to
multiple nodes and process returned results asynchronously, which is faster than sequen-
tial probes. Furthermore, this approach can avoid the situation that the entire diagnostic
process is misdirected by a few incorrect probes from malicious nodes.
1.5 Implementation
We implemented DYSWIS as a framework that provides multiple APIs that hide the detail
of underneath operations (e.g., capturing packets, searching nodes, and executing diag-
nosis rules).
24
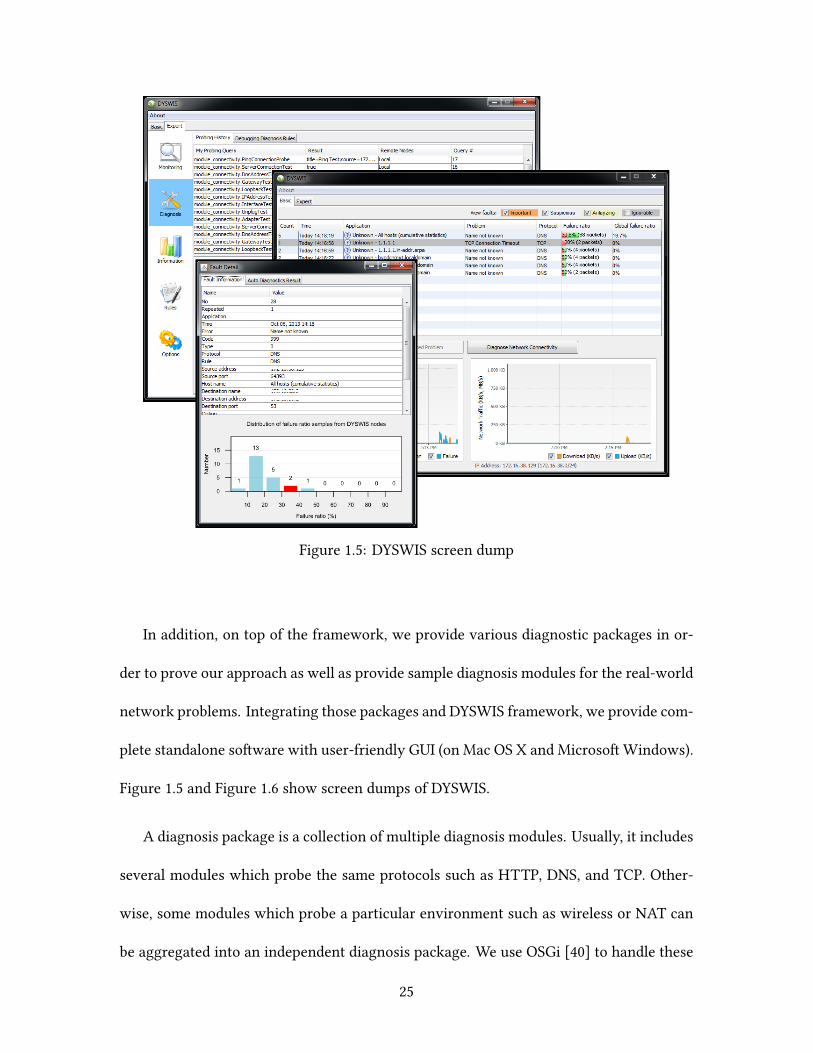
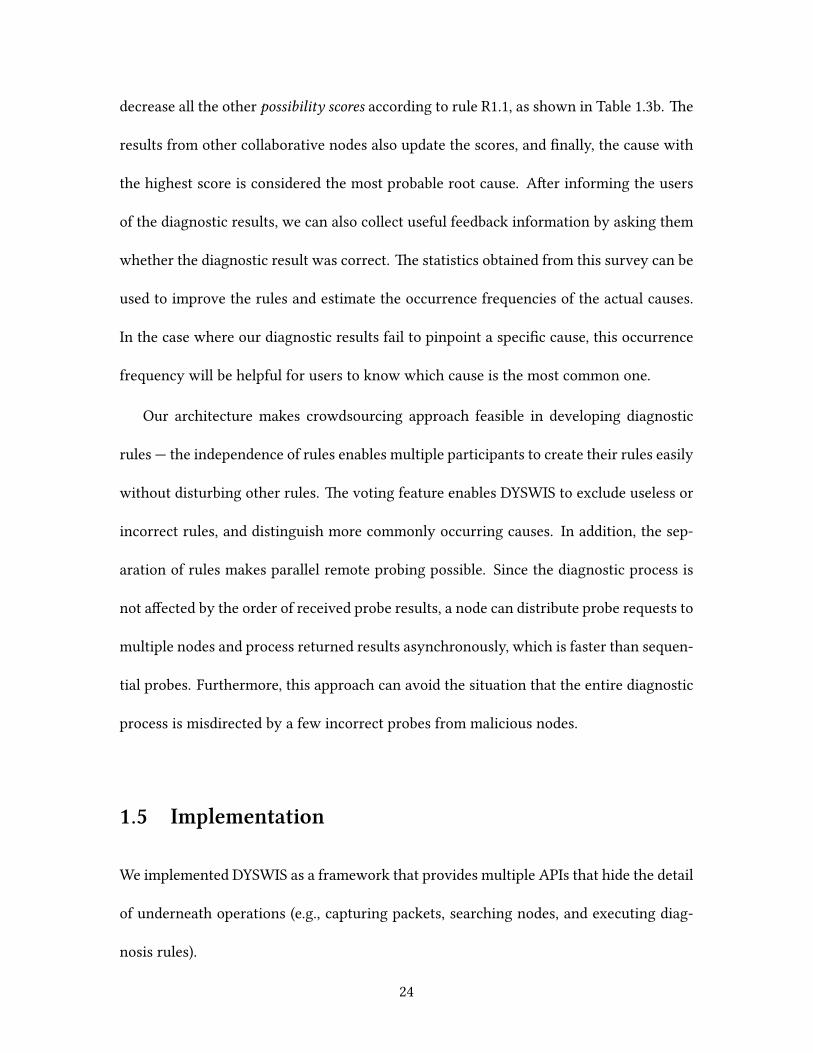
Figure 1.5: DYSWIS screen dump
In addition, on top of the framework, we provide various diagnostic packages in or-
der to prove our approach as well as provide sample diagnosis modules for the real-world
network problems. Integrating those packages and DYSWIS framework, we provide com-
plete standalone soware with user-friendly GUI (on Mac OS X and MicrosoWindows).
Figure 1.5 and Figure 1.6 show screen dumps of DYSWIS.
A diagnosis package is a collection of multiple diagnosis modules. Usually, it includes
several modules which probe the same protocols such as HTTP, DNS, and TCP. Other-
wise, some modules which probe a particular environment such as wireless or NAT can
be aggregated into an independent diagnosis package. We use OSGi [40] to handle these
25
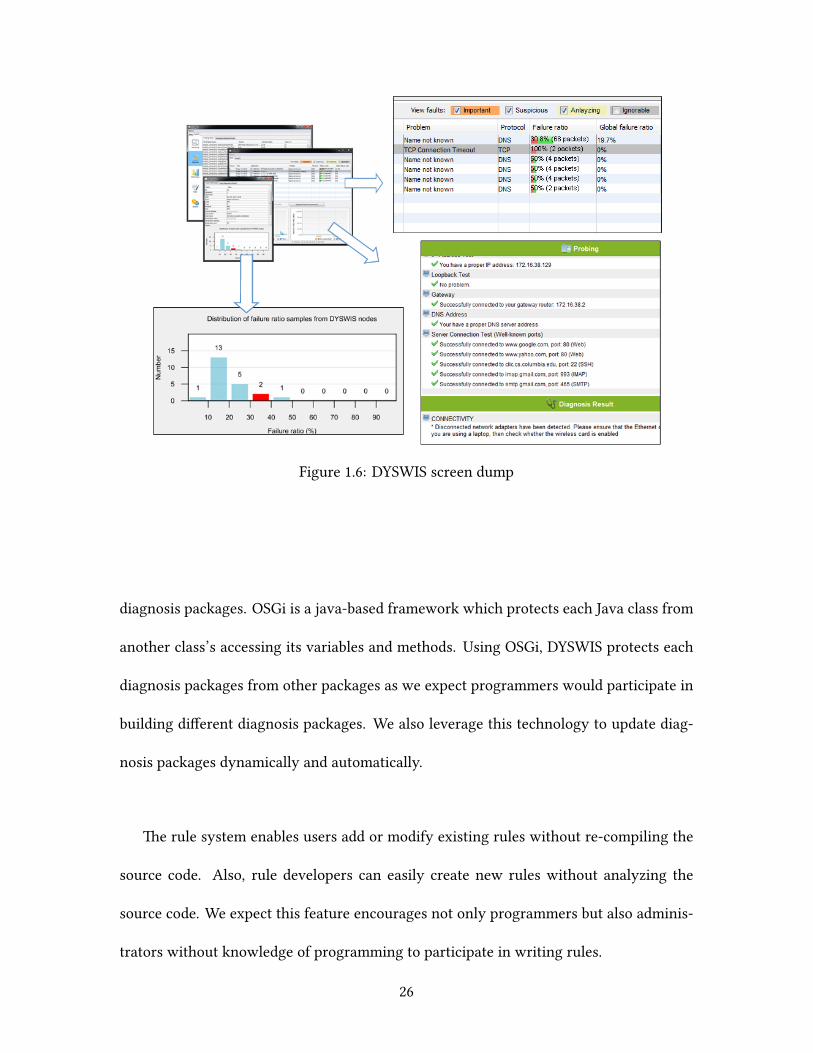
Figure 1.6: DYSWIS screen dump
diagnosis packages. OSGi is a java-based framework which protects each Java class from
another class’s accessing its variables and methods. Using OSGi, DYSWIS protects each
diagnosis packages from other packages as we expect programmers would participate in
building different diagnosis packages. We also leverage this technology to update diag-
nosis packages dynamically and automatically.
e rule system enables users add or modify existing rules without re-compiling the
source code. Also, rule developers can easily create new rules without analyzing the
source code. We expect this feature encourages not only programmers but also adminis-
trators without knowledge of programming to participate in writing rules.
26
Machine 7(Far node)
Machine 2192.168.1.102 / 128.59.x.y
(Sister node)
Machine 3192.168.1.120 / 128.59.x.y
(Local node)
Columbia CS Router128.59.16.1
Mudd-edge-1(ISP Router)
Machine 4128.59.19.223
(Near node)
Linux machine (Configured as a bridge)
Router (NAT Box)
Machine 5(Internet node)
RouterRemote Server(Web server)
Internet
Machine 6(Internet node)
Figure 1.7: A fault diagnosis testbed for injected failure scenarios
1.6 Evaluation
An experimental testbed
We set up a testbed that contained a NAT box, a bridge, remote servers, and collaborative
nodes. As illustrated in Figure 1.7, we placed near nodes inside the campus network,
Internet nodes in various external networks, and aweb server and far nodes on the Amazon
EC2 network. We simulated Internet service provider (ISP) network failures by injecting
network delays or dropping packets on the bridge between the NAT box and the campus
network.
Common network failures
We compared the diagnostic accuracy of DYSWIS with four diagnostic tools, two tools
provided by operating systems (Windows 7 and Mac OS X) and two commercial tools
(Network Magic Pro 5.5 from Cisco Systems [38] and HomeNet Manager 3.0.8 from Sin-
gleClick systems [28]). We ran each tool in the testbed with injected faults and evalu-
ated the diagnostic result. e failure scenarios were adopted from other studies [3, 23],
27
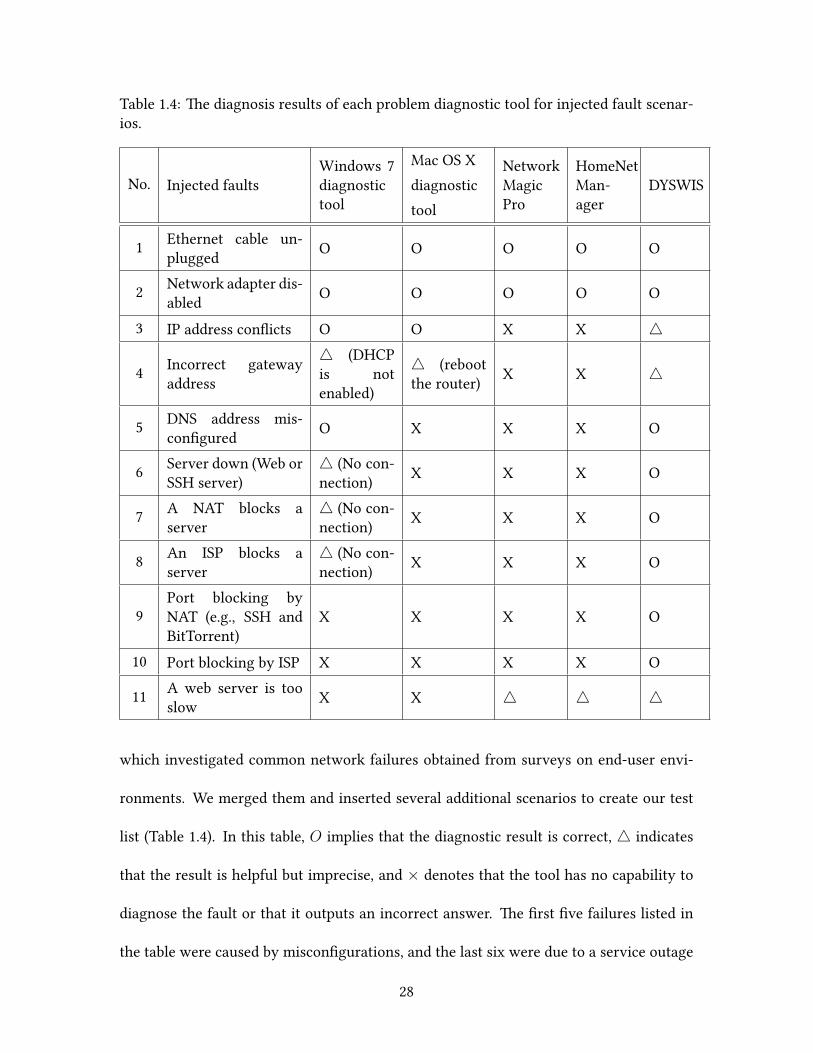
Table 1.4: e diagnosis results of each problem diagnostic tool for injected fault scenar-ios.
No. Injected faultsWindows 7diagnostictool
Mac OS Xdiagnostictool
NetworkMagicPro
HomeNetMan-ager
DYSWIS
1 Ethernet cable un-plugged O O O O O
2 Network adapter dis-abled O O O O O
3 IP address conflicts O O X X △
4 Incorrect gatewayaddress
△ (DHCPis notenabled)
△ (rebootthe router) X X △
5 DNS address mis-configured O X X X O
6 Server down (Web orSSH server)
△ (No con-nection) X X X O
7 A NAT blocks aserver
△ (No con-nection) X X X O
8 An ISP blocks aserver
△ (No con-nection) X X X O
9Port blocking byNAT (e.g., SSH andBitTorrent)
X X X X O
10 Port blocking by ISP X X X X O
11 A web server is tooslow X X △ △ △
which investigated common network failures obtained from surveys on end-user envi-
ronments. We merged them and inserted several additional scenarios to create our test
list (Table 1.4). In this table, O implies that the diagnostic result is correct, △ indicates
that the result is helpful but imprecise, and × denotes that the tool has no capability to
diagnose the fault or that it outputs an incorrect answer. e first five failures listed in
the table were caused by misconfigurations, and the last six were due to a service outage
28
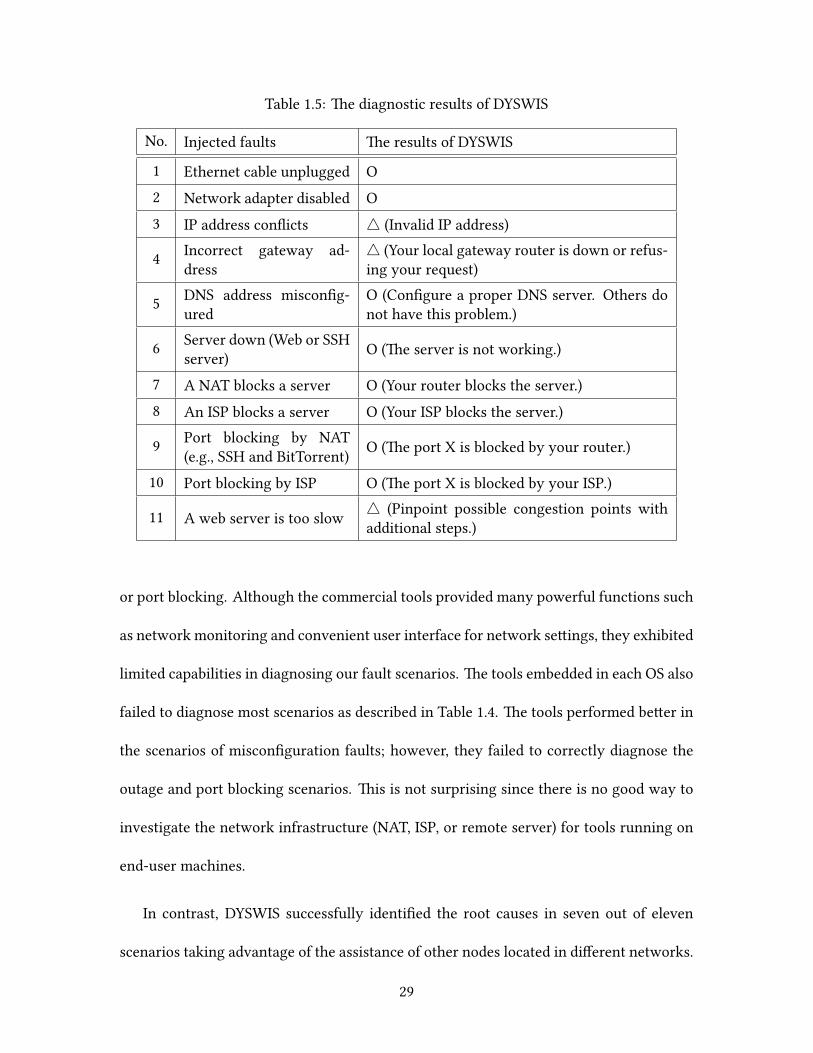
Table 1.5: e diagnostic results of DYSWIS
No. Injected faults e results of DYSWIS
1 Ethernet cable unplugged O2 Network adapter disabled O3 IP address conflicts △ (Invalid IP address)
4 Incorrect gateway ad-dress
△ (Your local gateway router is down or refus-ing your request)
5 DNS address misconfig-ured
O (Configure a proper DNS server. Others donot have this problem.)
6 Server down (Web or SSHserver) O (e server is not working.)
7 A NAT blocks a server O (Your router blocks the server.)8 An ISP blocks a server O (Your ISP blocks the server.)
9 Port blocking by NAT(e.g., SSH and BitTorrent) O (e port X is blocked by your router.)
10 Port blocking by ISP O (e port X is blocked by your ISP.)
11 A web server is too slow △ (Pinpoint possible congestion points withadditional steps.)
or port blocking. Although the commercial tools provided many powerful functions such
as network monitoring and convenient user interface for network seings, they exhibited
limited capabilities in diagnosing our fault scenarios. e tools embedded in each OS also
failed to diagnose most scenarios as described in Table 1.4. e tools performed beer in
the scenarios of misconfiguration faults; however, they failed to correctly diagnose the
outage and port blocking scenarios. is is not surprising since there is no good way to
investigate the network infrastructure (NAT, ISP, or remote server) for tools running on
end-user machines.
In contrast, DYSWIS successfully identified the root causes in seven out of eleven
scenarios taking advantage of the assistance of other nodes located in different networks.
29
For example, the blocking of a website by the ISP could be diagnosed by comparing probe
results from multiple near and Internet nodes. If every near node failed to connect to a
particular server while the Internet nodes could connect to the server, we inferred that the
traffic between the server and the ISP was constrained.
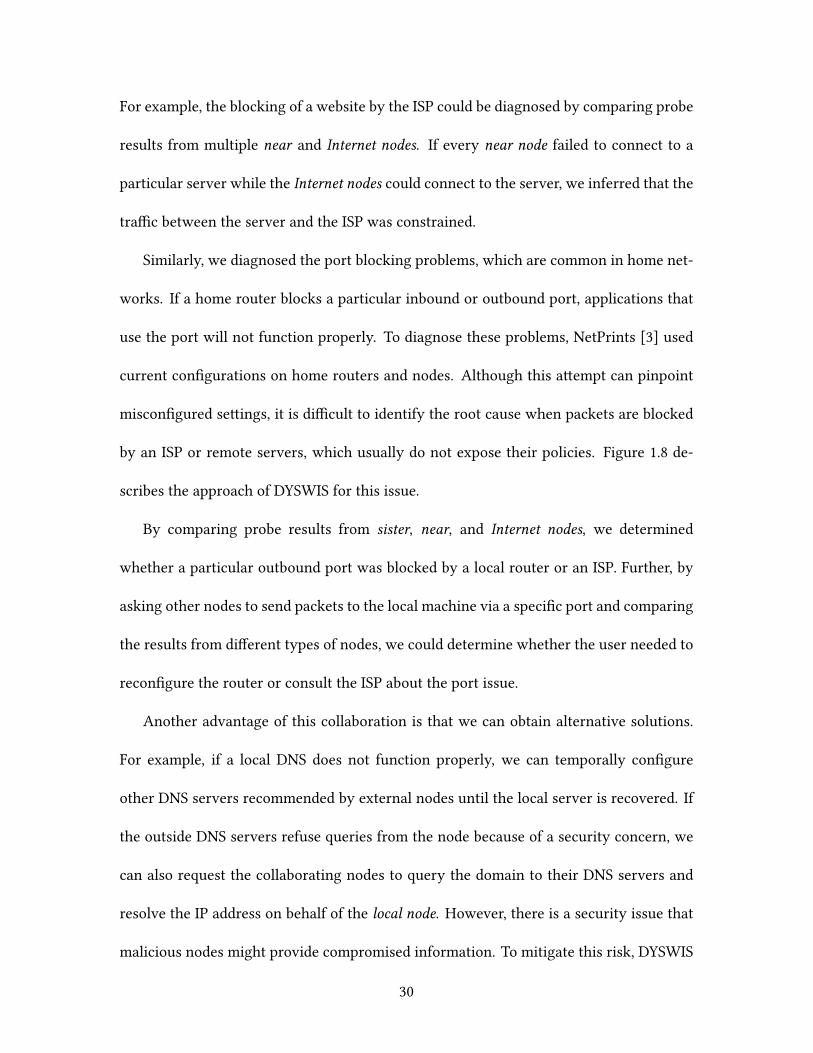
Similarly, we diagnosed the port blocking problems, which are common in home net-
works. If a home router blocks a particular inbound or outbound port, applications that
use the port will not function properly. To diagnose these problems, NetPrints [3] used
current configurations on home routers and nodes. Although this aempt can pinpoint
misconfigured seings, it is difficult to identify the root cause when packets are blocked
by an ISP or remote servers, which usually do not expose their policies. Figure 1.8 de-
scribes the approach of DYSWIS for this issue.
By comparing probe results from sister, near, and Internet nodes, we determined
whether a particular outbound port was blocked by a local router or an ISP. Further, by
asking other nodes to send packets to the local machine via a specific port and comparing
the results from different types of nodes, we could determine whether the user needed to
reconfigure the router or consult the ISP about the port issue.
Another advantage of this collaboration is that we can obtain alternative solutions.
For example, if a local DNS does not function properly, we can temporally configure
other DNS servers recommended by external nodes until the local server is recovered. If
the outside DNS servers refuse queries from the node because of a security concern, we
can also request the collaborating nodes to query the domain to their DNS servers and
resolve the IP address on behalf of the local node. However, there is a security issue that
malicious nodes might provide compromised information. To mitigate this risk, DYSWIS
30
Internet
Request: Test port A
Probe: Connect to port A
Request: Listen on port A
Probe: Connect to
port A
Sister nodeInternet node
Figure 1.8: Diagnosis example: Port blocking test
asks multiple nodes to collect multiple alternative solutions and provide the most fre-
quently answered solutions to the users because it is very rare for random collaborative
nodes to provide the same compromised information.
Detecting performance bottlenes
In this section, we describe the detailed diagnostic results of problem #11 (“A web server
is slow”) listed in Table 1.4. is kind of performance problem is challenging to diagnose
since there are a number of possible points where bolenecks may be located. We as-
sumed that there were seven candidate congestion points on the path from the client to
the remote server. en, our project members wrote multiple rules independently as de-
scribed in Section 1.4. For example, if round-trip time (RTT) between the local node to the
31
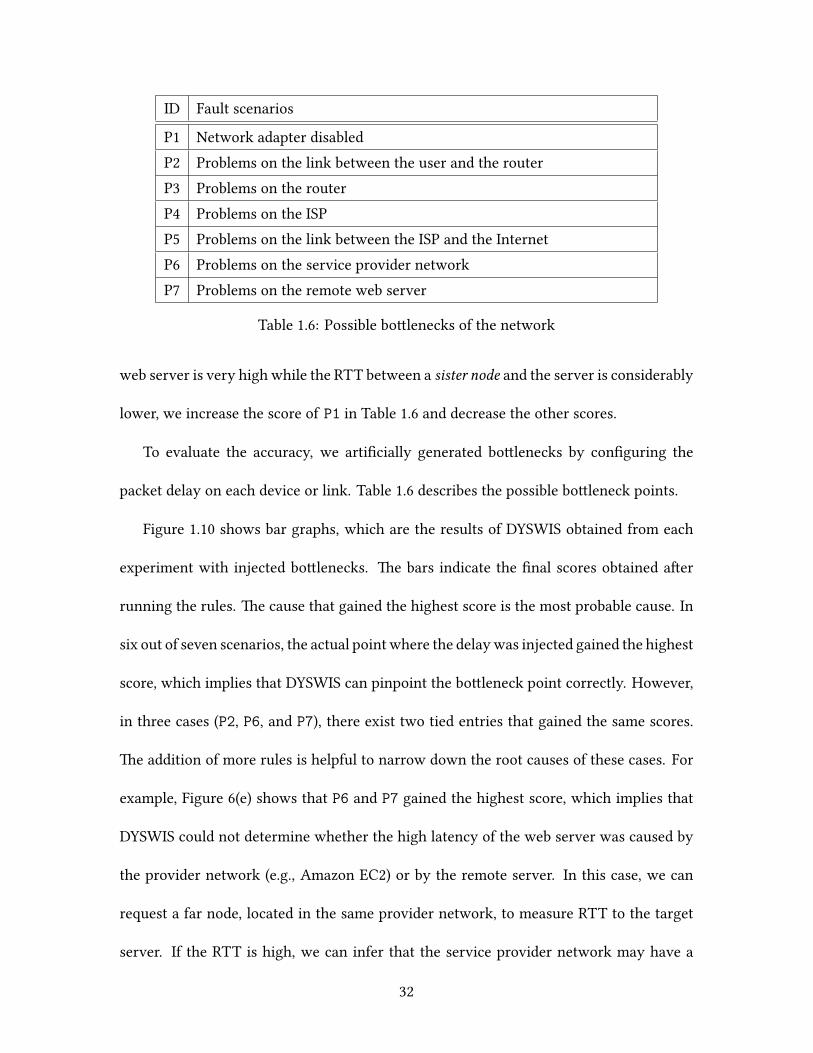
ID Fault scenarios
P1 Network adapter disabledP2 Problems on the link between the user and the routerP3 Problems on the routerP4 Problems on the ISPP5 Problems on the link between the ISP and the InternetP6 Problems on the service provider networkP7 Problems on the remote web server
Table 1.6: Possible bolenecks of the network
web server is very high while the RTT between a sister node and the server is considerably
lower, we increase the score of P1 in Table 1.6 and decrease the other scores.
To evaluate the accuracy, we artificially generated bolenecks by configuring the
packet delay on each device or link. Table 1.6 describes the possible boleneck points.
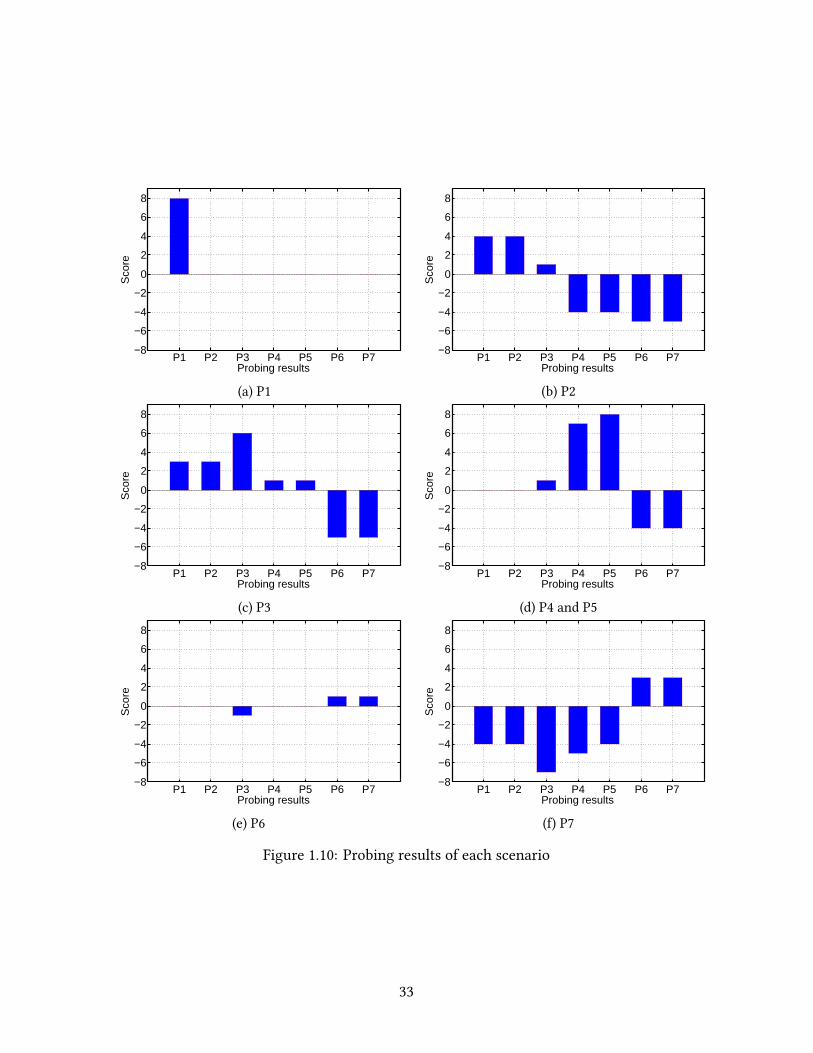
Figure 1.10 shows bar graphs, which are the results of DYSWIS obtained from each
experiment with injected bolenecks. e bars indicate the final scores obtained aer
running the rules. e cause that gained the highest score is the most probable cause. In
six out of seven scenarios, the actual point where the delaywas injected gained the highest
score, which implies that DYSWIS can pinpoint the boleneck point correctly. However,
in three cases (P2, P6, and P7), there exist two tied entries that gained the same scores.
e addition of more rules is helpful to narrow down the root causes of these cases. For
example, Figure 6(e) shows that P6 and P7 gained the highest score, which implies that
DYSWIS could not determine whether the high latency of the web server was caused by
the provider network (e.g., Amazon EC2) or by the remote server. In this case, we can
request a far node, located in the same provider network, to measure RTT to the target
server. If the RTT is high, we can infer that the service provider network may have a
32
P1 P2 P3 P4 P5 P6 P7−8
−6
−4
−2
0
2
4
6
8
Probing results
Sco
re
(a) P1
P1 P2 P3 P4 P5 P6 P7−8
−6
−4
−2
0
2
4
6
8
Probing results
Sco
re
(b) P2
P1 P2 P3 P4 P5 P6 P7−8
−6
−4
−2
0
2
4
6
8
Probing results
Sco
re
(c) P3
P1 P2 P3 P4 P5 P6 P7−8
−6
−4
−2
0
2
4
6
8
Probing results
Sco
re
(d) P4 and P5
P1 P2 P3 P4 P5 P6 P7−8
−6
−4
−2
0
2
4
6
8
Probing results
Sco
re
(e) P6
P1 P2 P3 P4 P5 P6 P7−8
−6
−4
−2
0
2
4
6
8
Probing results
Sco
re
() P7
Figure 1.10: Probing results of each scenario
33
problem. erefore, we can add the following rule – if the RTT from a far node to the
target server is high, increase the score of P6. By adding this rule, we ensure that P6 will
gain a higher score and DYSWIS can finally narrow down the actual cause appropriately.
is process can be repeated and applied to other scenarios by crowdsourcing. We believe
that the larger number of rules that are aggregated, the higher the system accuracy will
be.
1.7 Related work
Network fault detection and diagnosis have been an area of interest for a number of years.
A number of studies discuss home network environments. For example, HomeNet Pro-
filer [20] measured several characteristics of home networks such as the quality of home
Wi-Fi networks and the deployment of auto-configuration protocols. Cui et al. [19] iden-
tified the root cause of high web page loading time by capturing packets and correlating
various metrics such as DNS query time, TCP RTT, and data transfer period. Also, several
studies use the collaboration of different machines to diagnose problems. WebProfiler [1]
aggregated observations of multiple machines to discover network elements involved in
failures, Netprints [3] diagnosed and resolved problems in home router configurations
using shared knowledge of labeled (good or bad) configurations collected from multiple
machines, and WiFiProfiler [16] relies on cooperation among wireless clients to diagnose
and resolve problems. Aggarwal et al. [2] developed a network diagnostic tool that uses a
signature-based learning technique. Also, Dong et al. [23] wrote an argumentation-based
algorithm for home network diagnosis. In their system, arguments are possible conclu-
34
sions of the diagnosis, and assumptions are used to eliminate wrong arguments in the
reasoning process of the argument-based algorithm.
emain difference of DYSWIS’s approach from the studies above is that DYSWIS not
only uses the failure history of others, but also leverages end-users’ active probing in real-
time while others rely on passive observations from the users. By combining the passive
and active probings, we filter out false positive failures and diagnose the filtered problems
more accurately. Furthermore, in our best knowledge, DYSWIS is the first platform that
suggests a practical method that supports a crowdsourced-rule repository for network
problem diagnosis.
ere are several proposals that use user-based diagnosis. For example, Glasnost [22]
discovers service differentiation by ISP based on traffic analysis between an end point and
another controlled end point in the network. Choffnes et al. [17] proposed a methodology
to detect network events based on users’ experiences. ey aimed to detect events impact-
ing user-perceived application performance. Zhang et al. [57] proposed end user based
collaborative active probing to diagnose significant routing events. Tulip [35] probed
routers to localize anomalies such as packet reordering and loss. Dasu [46] developed a
platform that enables network researchers to experiment network-related issues using a
huge number of end users. ese studies focus more on investigating the network core
elements while DYSWIS focuses on diagnosing end-user problems.
AutoMON [12] uses a P2P-based solution to test network performance and reliability.
e distributed testing and monitoring nodes are coordinated by using a DHT, which
helps in locating resources or agents. is study focuses on testing and monitoring while
DYSWIS is designed to diagnose the root cause of failures.
35
In addition, DYSWIS shares the idea of distributedmeasurements with the “framework
for large-scale measurements” [24] which was recently proposed by the Large-Scale Mea-
surement of Broadband Performance (LMAP) working group. While DYSWIS focuses on
assisting end users, this framework proposes a measurement system that can be used by
ISPs and regulators as well. However, we believe that DYSWIS and the LMAP framework
can support each other and create a synergy when used together. Since the LMAP frame-
work proposes the detailed mechanisms of collecting and reporting data from distributed
measurement peers, DYSWIS can take advantages of its existing model to obtain useful
data for diagnosing end-user problems. Also, DYSWIS can be a part of the framework
participating as measurement peers to provide end-user data to contribute the LMAP
framework.
1.8 Discussion
Because our approach employs the collaboration among peers, it is susceptible to security
issues found in P2P networks [50], which are vulnerable to malicious users who try to
aack others by providing malformed data (e.g., file poisoning) or by using manipulated
identities (e.g., Sybil aack). Furthermore, in P2P systems, a user’s IP address is exposed
to others. is makes it easy for malicious users to target a user through denial of service
aack, in addition to the privacy issues that such exposure entails. In this section, we
discuss the potential security problems in our approach and suggest several solutions.
36
Security issues
Because DYSWIS’s network protocol and APIs are open to public, it is allowed to create
another application that participates in the DYSWIS network. However, a disadvantage
exists in that a user could contact DYSWIS nodes in order to initiate malicious probes
against a normal service. ere are two aack scenarios.
e first scenario is a DoS aack: A malicious node can simply send a large number
of probe requests to a target node, which will then become busy handling these probes.
is aack can be prevented by counting the number of requests from other nodes and
simply restricts the maximum number of probing requests per node within a particular
period.
e second scenario is a Distributed Denial of Service (DDoS) aack. When a mali-
cious user uses multiple DYSWIS nodes to launch a DDoS aack by requesting them to
probe the same node or web server. For example, the malicious user first collects as many
peers as possible and then requests them to execute a “TCP connection check” to a target
IP address. Because the peers are not aware that these requests are being sent to multiple
users by the malicious user, they will execute the requests as usual – open a TCP connec-
tion to the target – in a manner similar to how compromised nodes in a typical botnet
behave.
In order to prevent this aack, every node that is requested to perform a probe looks
up the probe history to check whether the host or service has been probed recently and a
usable result exists. is will prevent redundant probes from being performed. However,
for this to be effective, every probe transaction performed by each node should be stored.
37
is is not recommended because the database (DHT, in our system) can be flooded with
probing transactions. DYSWIS reduces the history size by randomly storing only a small
portion (e.g., 10%) of the entire transactions in the DHT because an estimated number
of probes is enough for our mechanism. For example, if ten recent probes are detected
by querying the DHT, it implies that around 100 probes have been performed recently.
If the number exceeds a certain limit, DYSWIS considers it to be a part of an aack and
refuses to perform the probe. In this case, the malicious user cannot harm the target, but
a normal user can still obtain probe results from other nodes.
Social Network Peers
Another challenging problem exists, namely, that of whether we can trust the probe re-
sults from other nodes. is is because a user might be malicious and could therefore
be providing wrong results. In this section, we suggest a mechanism to distinguish gen-
uine users from potentially malicious nodes by recommending social peers registered on
the friend list in a social network service (e.g., Facebook). is approach is based on the
actual human social interactions. When someone needs the answer to an important ques-
tion, they first ask their friends before asking, say, some random, anonymous person on
the street, because they trust their friends more. Similarly, we assume that if we choose
collaborative peers among close friends in the social network service, the probability of
obtaining trustable peers is much higher than the case of simply obtaining random nodes
in a DHT.us, if DYSWIS discovers peers who are on the friend list of the user, it recom-
mends those social peers to the user. e user can finally determine whether to choose
38
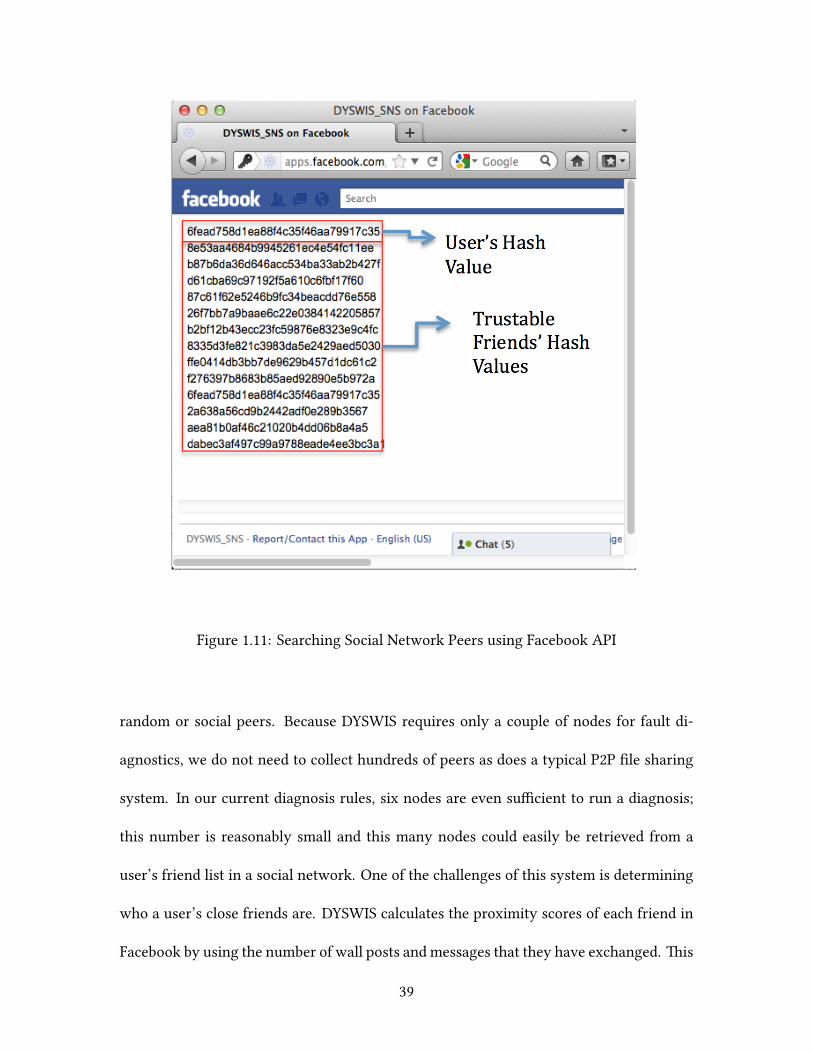
Figure 1.11: Searching Social Network Peers using Facebook API
random or social peers. Because DYSWIS requires only a couple of nodes for fault di-
agnostics, we do not need to collect hundreds of peers as does a typical P2P file sharing
system. In our current diagnosis rules, six nodes are even sufficient to run a diagnosis;
this number is reasonably small and this many nodes could easily be retrieved from a
user’s friend list in a social network. One of the challenges of this system is determining
who a user’s close friends are. DYSWIS calculates the proximity scores of each friend in
Facebook by using the number of wall posts and messages that they have exchanged. is
39
algorithm is heuristic, yet it adequately distinguishes actual friends from fake ones.
However, we also need to consider the privacy issue. It is possible that the IP address
of a particular friend could be exposed in this approach. Our goal is to provide the contact
points (IP addresses) of social peers without revealing the matches that indicate who has
a specific IP address.
We have implemented this system (Figure 1.11) using the Facebook API as a proof of
concept and integrated it into the DYSWIS framework. It first generates an identification
key for each node. e identification key is a unique MD5 hash string generated from
a Facebook user ID and a secret key of the application. Because the secret key is not
exposed to the public, it is impossible to reproduce the identification key using the names
of friends. us, only the user and the Facebook application know the secret key. Aer
receiving the identification key from the Facebook application, DYSWIS registers the (key,
IP address) pair in the DHT. When another user requests a social peer list, the Facebook
application calculates the proximity of the requested user and returns the closest friends
from the Facebook friend list of the user. For this purpose, it is necessary for the user
to pass the authentication process beforehand. Note that the application does not return
the names of friends or user IDs. Instead, it returns the hash strings that were generated
with a user ID along with a secret key. In the last step, DYSWIS queries the DHT to check
whether the received keys are registered. In other words, it checks whether the friends
have installed DYSWIS and are currently running it. Consequently, through these steps,
DYSWIS can obtain the IP addresses of close friends who are running DYSWIS without
revealing the actual owner of the IP addresses. It is difficult to convert the IP address to
the corresponding user because DYSWIS users only obtain the hashed keys of the user
40
IDs.
1.9 Conclusion
DYSWIS diagnoses complex network problems for end users using end-user collaboration.
We provide a new framework for a collaborative approach and diagnosis strategies for
various fault scenarios. We provide a detailed design to discover and communicate with
collaborating nodes. Also, we provide a crowdsourcing framework for administrators and
developers to participate in expanding the diagnostic system.
We have implemented DYSWIS framework, diagnostic rules, and probing modules
that diagnose several common network faults. We set up these scenarios with real net-
work devices and diagnosed them using DYSWIS. While local probing with traditional
diagnostic tools fail to point out the cause of these fault scenarios, our evaluation shows
that DYSWIS can effectively narrow down the problematic regions and pinpoint the root
causes.
41

Chapter 2
WiSlow: diagnosing Wi-Fi performance degradation
2.1 Introduction
Today, it is common for households to build home networks with a private wireless router
(access point) that supports multiple wireless devices. However, the increasing usage of
wireless networks using shared unlicensed spectrum inevitably results inmore contention
and interference, which causes unsatisfactory Wi-Fi performance. Furthermore, non-Wi-
Fi devices such asmicrowave ovens, cordless phones, and babymonitors severely interfere
with many Wi-Fi networks because these devices operate on the same 2.4 GHz spectrum
as 802.11b/g [26].
Although these problem sources can be easily removed in many cases (e.g., by relo-
cating the interfering device, choosing a different channel, or moving to the 5GHz band),
it is difficult for technically non-savvy users to even notice the existence of channel con-
tention or interference caused by non-Wi-Fi devices. Instead, properly working routers
or service providers are frequently misidentified as the culprit while the actual root cause
remains unidentified.
Isolating the root causes of poor Wi-Fi performance is nontrivial, even for a network
expert, because they show very similar symptoms at the user level, and special devices
43
are required in order to investigate the lower layers of the protocol stack.
In this chapter, we present WiSlow, a soware tool that diagnoses the root causes
of poor Wi-Fi performance with user-level network probes and leverages peer collabo-
ration to identify their physical locations. e goal of this tool is to report the problem
source and its approximate location to users such as “It appears that a baby monitor lo-
cated close to your router is interfering with your Wi-Fi network.” We focus on building
soware that does not require any additional spectrum analysis hardware (unlike, e.g.,
WiSpy [53], AirSleuth [5], or AirMaestro [4]). In addition, WiSlow does not depend on a
specific network adapter such as the Atheros chipsets, which were used to achieve similar
goals in other studies [44, 45]. ese features enable WiSlow to run on common end-user
machines that do not have special hardware.
First, we investigate behaviors of 802.11 networks such as retries, Frame Checksum
Sequence (FCS) errors, packet loss, and bit rate adaption, which can be observed on ordi-
nary operating systems. Our experimental results show that the statistical paerns of the
above variables vary depending on the problem sources. For example, with the interfer-
ence that caused by non-Wi-Fi devices, we observed a greater number of retried packets,
fewer FCS errors, and larger variations in the bit rates compared to channel contention.
Correlating these variables, we can categorize the sources of performance problems into
several distinct groups. In addition, the non-Wi-Fi devices such as babymonitors, cordless
phones, and microwave ovens show different paerns when the number of UDP packets
and 802.11 ACKs are ploed over time.
Based on our observations, we developed two methods to identify the root causes:
packet loss analysis and 802.11 ACK paern analysis. ese methods successfully distin-
44
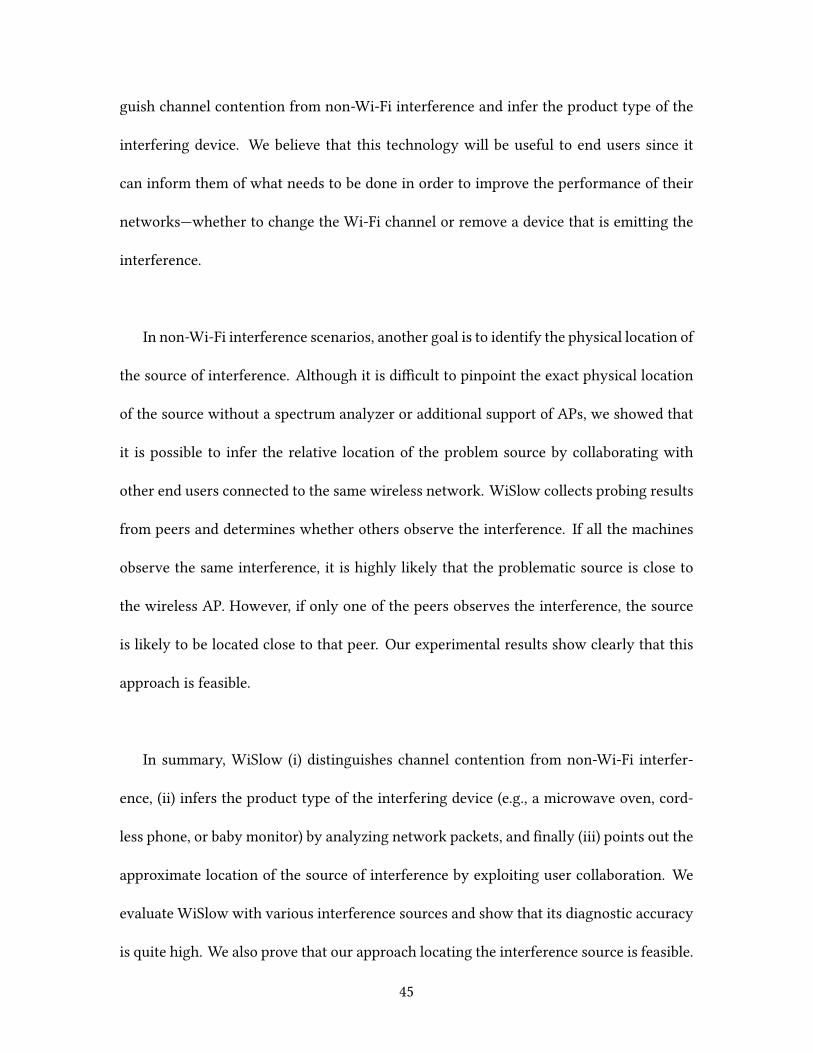
guish channel contention from non-Wi-Fi interference and infer the product type of the
interfering device. We believe that this technology will be useful to end users since it
can inform them of what needs to be done in order to improve the performance of their
networks—whether to change the Wi-Fi channel or remove a device that is emiing the
interference.
In non-Wi-Fi interference scenarios, another goal is to identify the physical location of
the source of interference. Although it is difficult to pinpoint the exact physical location
of the source without a spectrum analyzer or additional support of APs, we showed that
it is possible to infer the relative location of the problem source by collaborating with
other end users connected to the same wireless network. WiSlow collects probing results
from peers and determines whether others observe the interference. If all the machines
observe the same interference, it is highly likely that the problematic source is close to
the wireless AP. However, if only one of the peers observes the interference, the source
is likely to be located close to that peer. Our experimental results show clearly that this
approach is feasible.
In summary, WiSlow (i) distinguishes channel contention from non-Wi-Fi interfer-
ence, (ii) infers the product type of the interfering device (e.g., a microwave oven, cord-
less phone, or baby monitor) by analyzing network packets, and finally (iii) points out the
approximate location of the source of interference by exploiting user collaboration. We
evaluate WiSlow with various interference sources and show that its diagnostic accuracy
is quite high. We also prove that our approach locating the interference source is feasible.
45
2.2 Baground
Common sources that cause Wi-Fi performance degradation include:
• Wi-Fi annel contention reduces throughput when the channel is crowded by
multiple Wi-Fi devices that compete to transmit data through wireless access point
(AP). It also includes interference due to nearby APs that are using the same channel
or adjacent channels.
• Non-Wi-Fi interference refers to interference caused by non-Wi-Fi devices that use
the same spectrum as the 802.11 networks. e devices include microwave ovens,
cordless phones, baby monitors, and Bluetooth devices.
• Weak signal means that the radio signal is not strong enough due to distance or
obstacles. In this environment, packets can be lost or corrupted frequently.
Although the extent varies, all the above sources result in severe performance
degradation—some of them even drop the TCP/UDP throughput to almost zero [44]. In
this thesis, we focus on Wi-Fi channel contention and common non-Wi-Fi interference
sources.
2.3 Challenges
In this section, we describe the reasons why analyzing wireless networks is difficult for
end users.
46
Inaccurate RSSI and SINR measurements
Received signal strength indication (RSSI) and Signal-to-interference-plus-noise ratio
(SINR) are generally considered to be the key factors that indicate the quality of a wireless
link. However, according to Vlavianos et al. [51], RSSI inaccurately captures the link qual-
ity and it is difficult to accurately compute SINR with commodity wireless cards. We also
observed a similar result when monitoring RSSI and SINR values in our own experiments.
We placed various types of interference sources close to the AP and measured the values
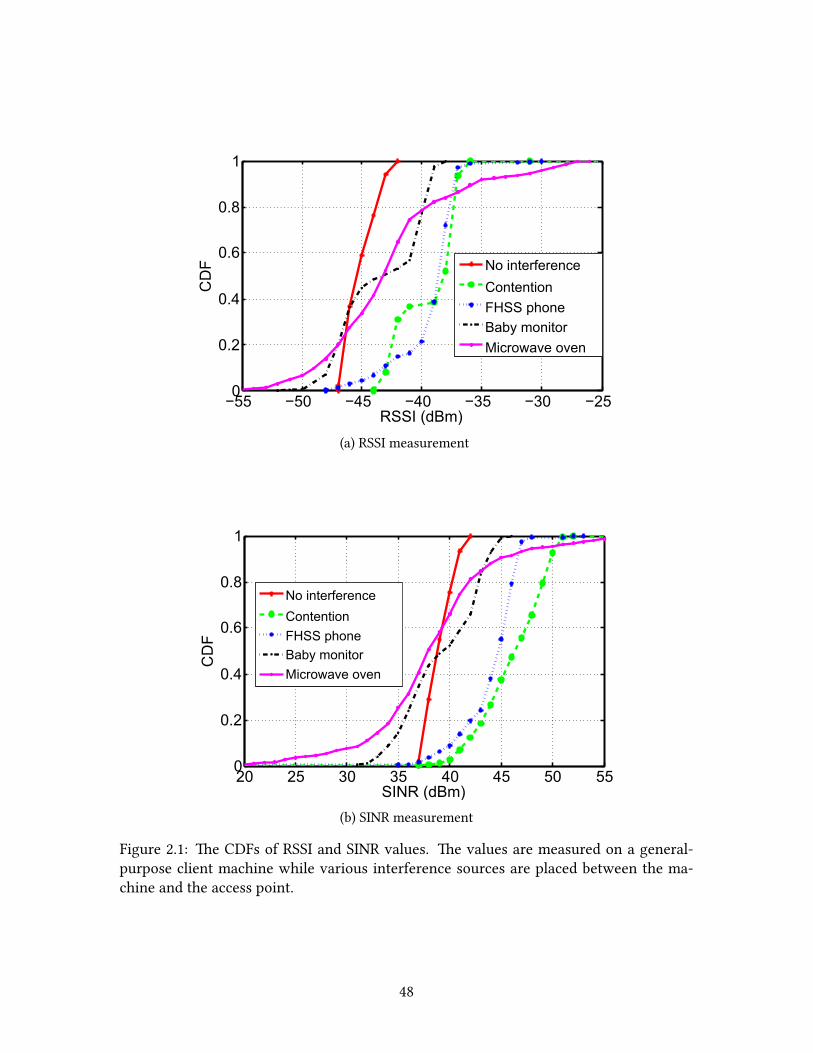
on a general-purpose client machine¹. In Figure 2.1a, RSSI values with a baby monitor
as interference were consistently higher than those with a cordless phone, but the mea-
surement result showed lower throughput for the baby monitor. In Figure 2.1b, the SINR
values with a cordless phone were higher than even a no-interference case. Furthermore,
these results varied for each experiment. Based on this observation, we conclude that
RSSI and SINR values captured by a general wireless card do not represent the level of
interference correctly. erefore, we do not use these metrics for purposes other than as
a hint in the case of an extremely weak signal.
No specific network adapter or driver
We do not make any assumptions about the specific network adapters or drivers that
end users may have. Some Atheros chipsets, which are widely used in other research
studies, support a spectral scan that provides a spectrum analysis of multiple frequency
ranges. Rayanchu et al. developed Airshark [44] andWiFiNet [45] leveraging this feature
¹We used a MacBook Pro 2013 (network card: AirPort Extreme, chipset: Broadcom BCM43 series) inthis measurement.
47
−55 −50 −45 −40 −35 −30 −250
0.2
0.4
0.6
0.8
1
RSSI (dBm)
CD
F
No interferenceContentionFHSS phoneBaby monitorMicrowave oven
(a) RSSI measurement
20 25 30 35 40 45 50 550
0.2
0.4
0.6
0.8
1
SINR (dBm)
CD
F
No interferenceContentionFHSS phoneBaby monitorMicrowave oven
(b) SINR measurement
Figure 2.1: e CDFs of RSSI and SINR values. e values are measured on a general-purpose client machine while various interference sources are placed between the ma-chine and the access point.
48
to distinguish non-Wi-Fi interferers using a commodity network card without specialized
hardware.
Although this approach achieved quite high accuracy in identifying the interfering
devices, to the best of our knowledge, only a few chipsets (e.g., Atheros) currently provide
this feature. In addition, we failed to discover references to this feature for any OS other
than Linux. Since there are hundreds of products that use a different chipset or OS, it is
impractical to assume that a general end user has this specific setup. erefore, we focus
instead on analyzing the quality of a link observing user-accessible packets such as UDP
and 802.11 packets. Because the mechanisms of these protocols are the same across Wi-Fi
devices, we believe WiSlow can help a wider range of end users.
La of monitoring data
Another restriction in the end-user environment is the lack of a monitoring history. If we
assume that we have beenmonitoring themachine up to themoment when a performance
problem happens, the diagnosis will be easier because we can obtain several important
clues such as the average quality of the link, the time when the problem started, and
whether it has happened in the recent past. However, although the overhead of network
monitoring is not heavy on modern machines, it is unrealistic to expect that end users
will continuously run such a tool. e more common scenario is that a user launches a
troubleshooting tool like WiSlow to request a diagnostic only aer he/she has noticed a
severe performance problem. erefore, we need to design the tool assuming lile or no
previous monitoring data. In the next section, it is explained how WiSlow estimates the
49
problem source without running in background, which implies that no information about
the quality of the underlying network is provided.
2.4 Aritecture
In this section, we elaborate on the details of probing methods for identifying the root
causes of network interference. First, to investigate the behavior of Wi-Fi networks in
each problem scenario, we artificially inject problems while transmiing UDP packets
between a client (laptop) and an AP. We capture every packet on the client machine, and
then trace the transport layer (UDP), the 802.11 medium access control (MAC) layer, and
some user-accessible 802.11 physical layer (PHY) information to ascertain each problem-
atic scenario’s interference levels and characteristics.
To capture 802.11 packets, WiSlow uses themonitor mode of wireless adapters. Moni-
tor mode provides the Radiotap [43] header, a standard for 802.11 frame information. e
headers are used to extract low layer information such as frame check sequence (FCS)
errors and bit rates. Sniffing wireless packets is supported by most Linux and all Mac
OS X machines without additional drivers or kernel modification. erefore, if we can
successfully characterize each performance-degrading source by probing the transmied
packets, the same probes will enable WiSlow to identify the problem sources on most
platforms. However, it is not always possible to capture wireless packets on some types
of OS, e.g., Microso Windows [52]. Instead, both Windows 7 and Windows 10 provide
Native WiFi APIs [54] that report 802.11 packet statistics to user applications. ose APIs
enable WiSlow to run on Windows because they provide all the information that WiSlow
50
must extract from the 802.11 packets.
In the following sections, we explain WiSlow’s two main diagnostic methods: packet
loss analysis and 802.11 ACK paern analysis.
2.5 Analysis method 1: paet loss analysis
First, we found that each problem source varies in their packet loss characteristics, rep-
resented by three statistics: i) the number of 802.11 retries, ii) the available bit rates, and
iii) the number of FCS errors. In each experiment, we measured these values on a client
laptop while downloading UDP packets from an AP. e values were recorded for each
100 KB of UDP packets. We repeated this experiment for different scenarios including
channel contention and non-Wi-Fi interference. To simulate channel contention, we set
up several laptops sending bulk UDP packet streams to the AP. To generate non-Wi-Fi
interference, we placed each interfering device (baby monitors, microwave ovens, and
cordless phones) close to the AP (about 20 cm away) and measured the effect on the client
placed at various distances from the AP. ² Note that the client downloaded 100MB of
UDP packets for each experiment to collect a statistically meaningful amount of samples,
but when actually probing on an end user’s machine, WiSlow only needs to transmit
5MBytes of UDP packets to identify the root cause, which takes a reasonable amount of
time (10–40 s).
• Retry and available bit rate: Since an 802.11 retry and bit rate reduction are both
initiated by a packet loss, their temporal changes are closely correlated; when a
²In this study, we do not consider the combined interference of multiple devices.
51
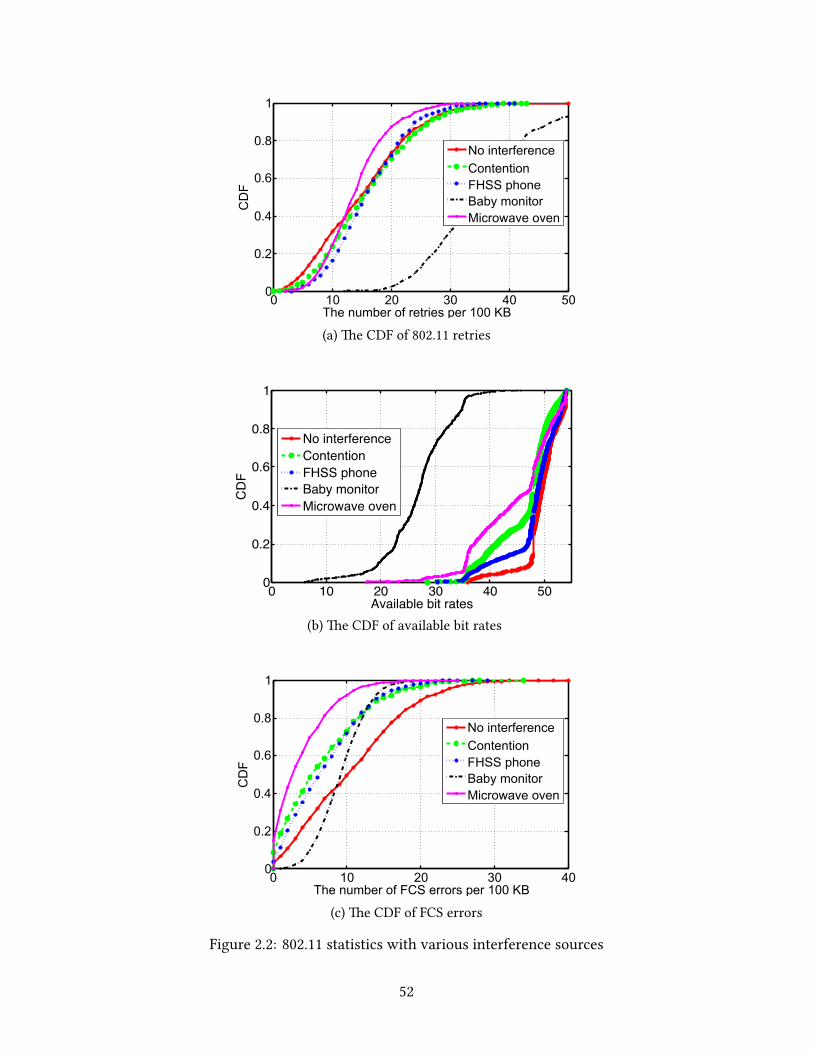
The number of retries per 100 KB 0 10 20 30 40 50
0
0.2
0.4
0.6
0.8
1
CD
F
No interferenceContentionFHSS phoneBaby monitorMicrowave oven
(a) e CDF of 802.11 retries
0 10 20 30 40 500
0.2
0.4
0.6
0.8
1
Available bit rates
CD
F
No interferenceContentionFHSS phoneBaby monitorMicrowave oven
(b) e CDF of available bit rates
The number of FCS errors per 100 KB0 10 20 30 40
0
0.2
0.4
0.6
0.8
1
CD
F
No interferenceContentionFHSS phoneBaby monitorMicrowave oven
(c) e CDF of FCS errors
Figure 2.2: 802.11 statistics with various interference sources
52
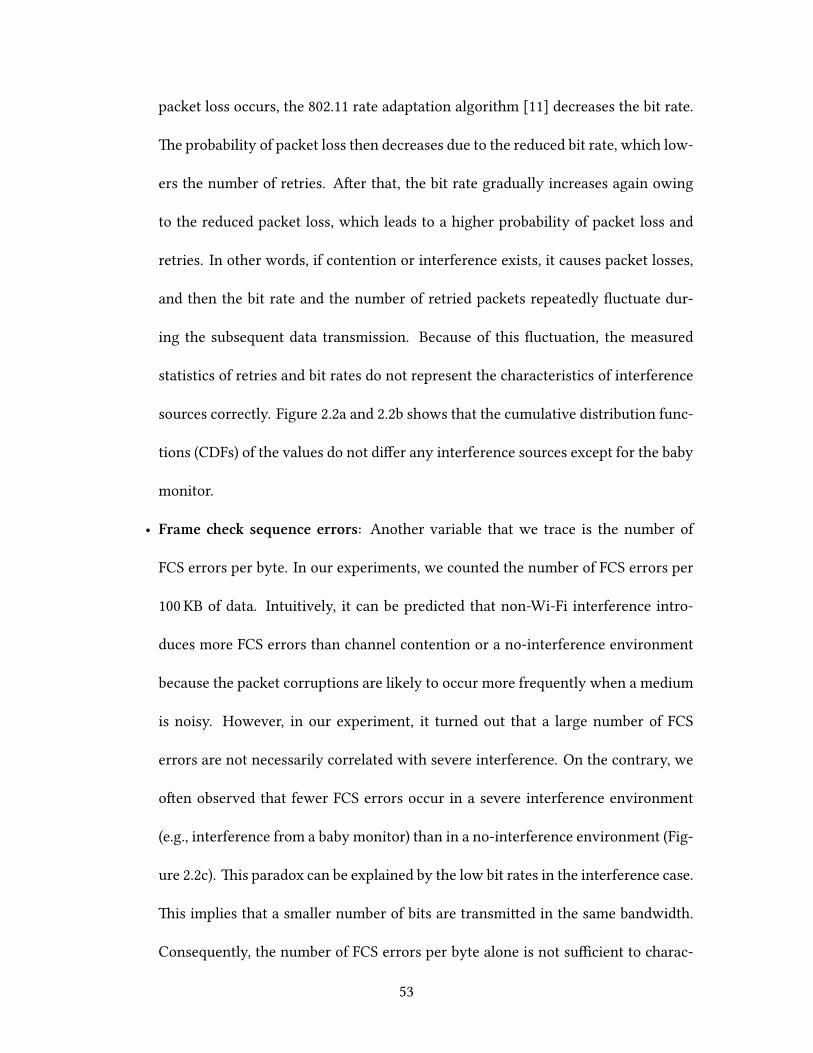
packet loss occurs, the 802.11 rate adaptation algorithm [11] decreases the bit rate.
e probability of packet loss then decreases due to the reduced bit rate, which low-
ers the number of retries. Aer that, the bit rate gradually increases again owing
to the reduced packet loss, which leads to a higher probability of packet loss and
retries. In other words, if contention or interference exists, it causes packet losses,
and then the bit rate and the number of retried packets repeatedly fluctuate dur-
ing the subsequent data transmission. Because of this fluctuation, the measured
statistics of retries and bit rates do not represent the characteristics of interference
sources correctly. Figure 2.2a and 2.2b shows that the cumulative distribution func-
tions (CDFs) of the values do not differ any interference sources except for the baby
monitor.
• Frame e sequence errors: Another variable that we trace is the number of
FCS errors per byte. In our experiments, we counted the number of FCS errors per
100 KB of data. Intuitively, it can be predicted that non-Wi-Fi interference intro-
duces more FCS errors than channel contention or a no-interference environment
because the packet corruptions are likely to occur more frequently when a medium
is noisy. However, in our experiment, it turned out that a large number of FCS
errors are not necessarily correlated with severe interference. On the contrary, we
oen observed that fewer FCS errors occur in a severe interference environment
(e.g., interference from a baby monitor) than in a no-interference environment (Fig-
ure 2.2c). is paradox can be explained by the low bit rates in the interference case.
is implies that a smaller number of bits are transmied in the same bandwidth.
Consequently, the number of FCS errors per byte alone is not sufficient to charac-
53
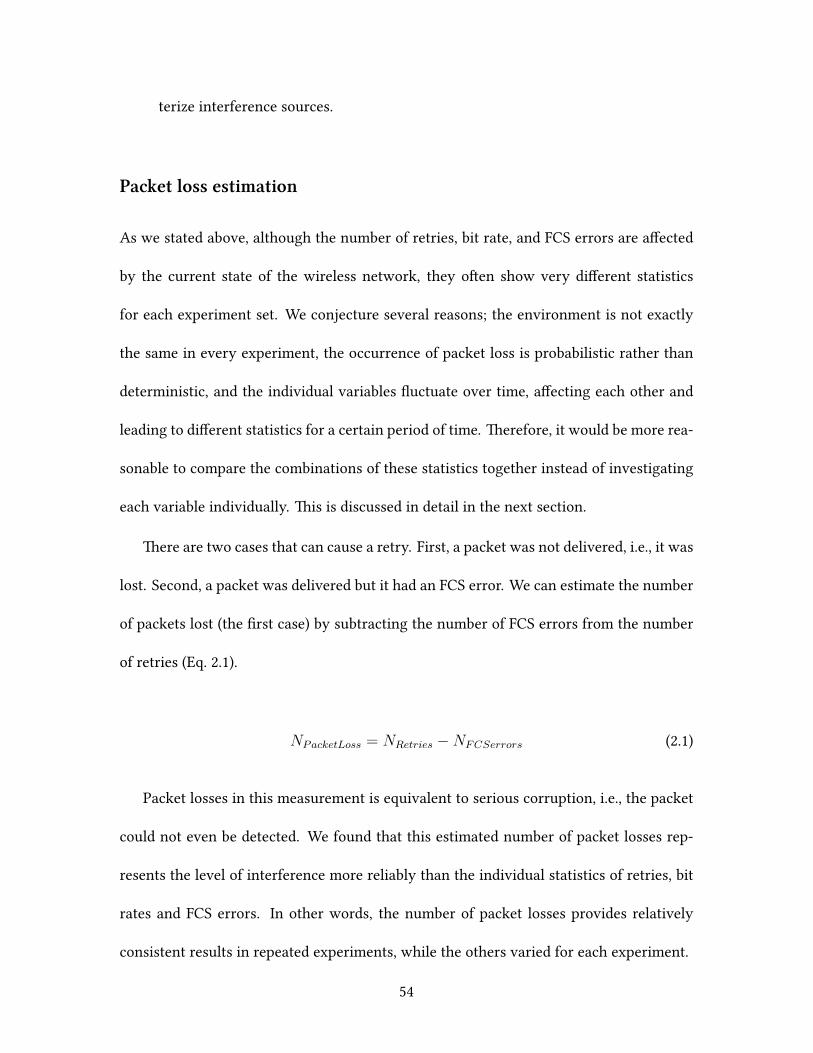
terize interference sources.
Paet loss estimation
As we stated above, although the number of retries, bit rate, and FCS errors are affected
by the current state of the wireless network, they oen show very different statistics
for each experiment set. We conjecture several reasons; the environment is not exactly
the same in every experiment, the occurrence of packet loss is probabilistic rather than
deterministic, and the individual variables fluctuate over time, affecting each other and
leading to different statistics for a certain period of time. erefore, it would be more rea-
sonable to compare the combinations of these statistics together instead of investigating
each variable individually. is is discussed in detail in the next section.
ere are two cases that can cause a retry. First, a packet was not delivered, i.e., it was
lost. Second, a packet was delivered but it had an FCS error. We can estimate the number
of packets lost (the first case) by subtracting the number of FCS errors from the number
of retries (Eq. 2.1).
NPacketLoss = NRetries −NFCSerrors (2.1)
Packet losses in this measurement is equivalent to serious corruption, i.e., the packet
could not even be detected. We found that this estimated number of packet losses rep-
resents the level of interference more reliably than the individual statistics of retries, bit
rates and FCS errors. In other words, the number of packet losses provides relatively
consistent results in repeated experiments, while the others varied for each experiment.
54
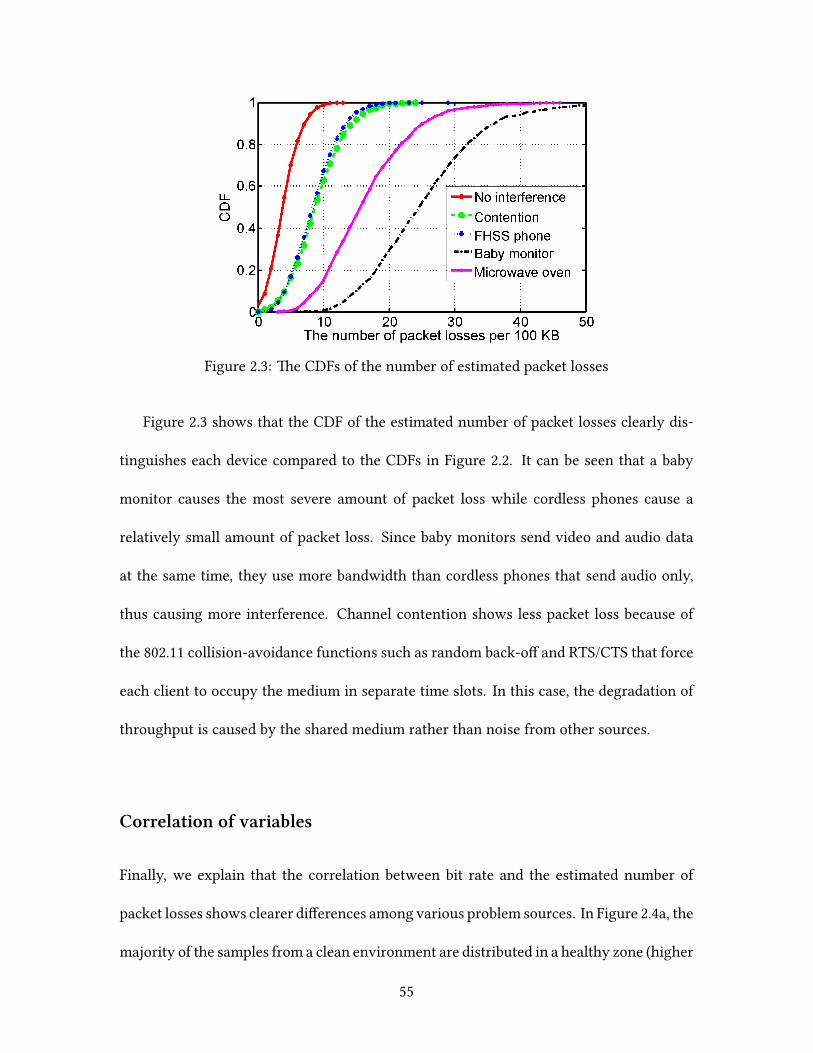
Figure 2.3: e CDFs of the number of estimated packet losses
Figure 2.3 shows that the CDF of the estimated number of packet losses clearly dis-
tinguishes each device compared to the CDFs in Figure 2.2. It can be seen that a baby
monitor causes the most severe amount of packet loss while cordless phones cause a
relatively small amount of packet loss. Since baby monitors send video and audio data
at the same time, they use more bandwidth than cordless phones that send audio only,
thus causing more interference. Channel contention shows less packet loss because of
the 802.11 collision-avoidance functions such as random back-off and RTS/CTS that force
each client to occupy the medium in separate time slots. In this case, the degradation of
throughput is caused by the shared medium rather than noise from other sources.
Correlation of variables
Finally, we explain that the correlation between bit rate and the estimated number of
packet losses shows clearer differences among various problem sources. In Figure 2.4a, the
majority of the samples from a clean environment are distributed in a healthy zone (higher
55
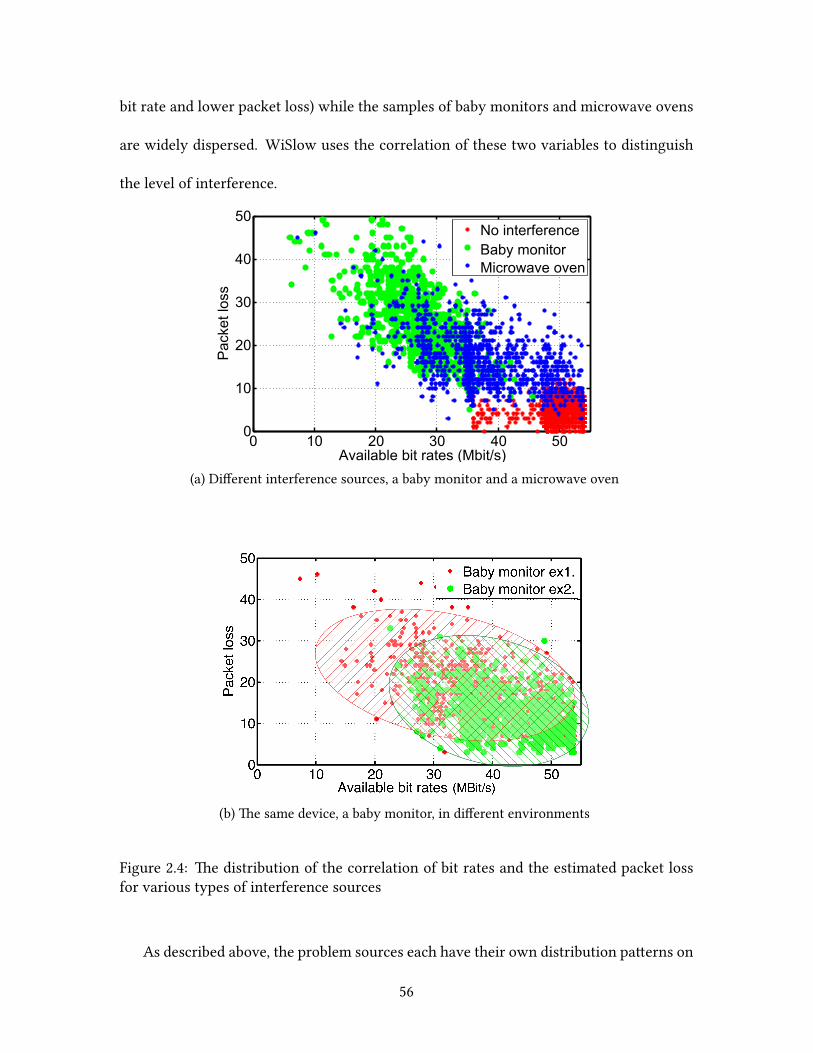
bit rate and lower packet loss) while the samples of baby monitors and microwave ovens
are widely dispersed. WiSlow uses the correlation of these two variables to distinguish
the level of interference.
Available bit rates (Mbit/s)0 10 20 30 40 50
0
10
20
30
40
50
Pac
ket l
oss
No interferenceBaby monitorMicrowave oven
(a) Different interference sources, a baby monitor and a microwave oven
(b) e same device, a baby monitor, in different environments
Figure 2.4: e distribution of the correlation of bit rates and the estimated packet lossfor various types of interference sources
As described above, the problem sources each have their own distribution paerns on
56
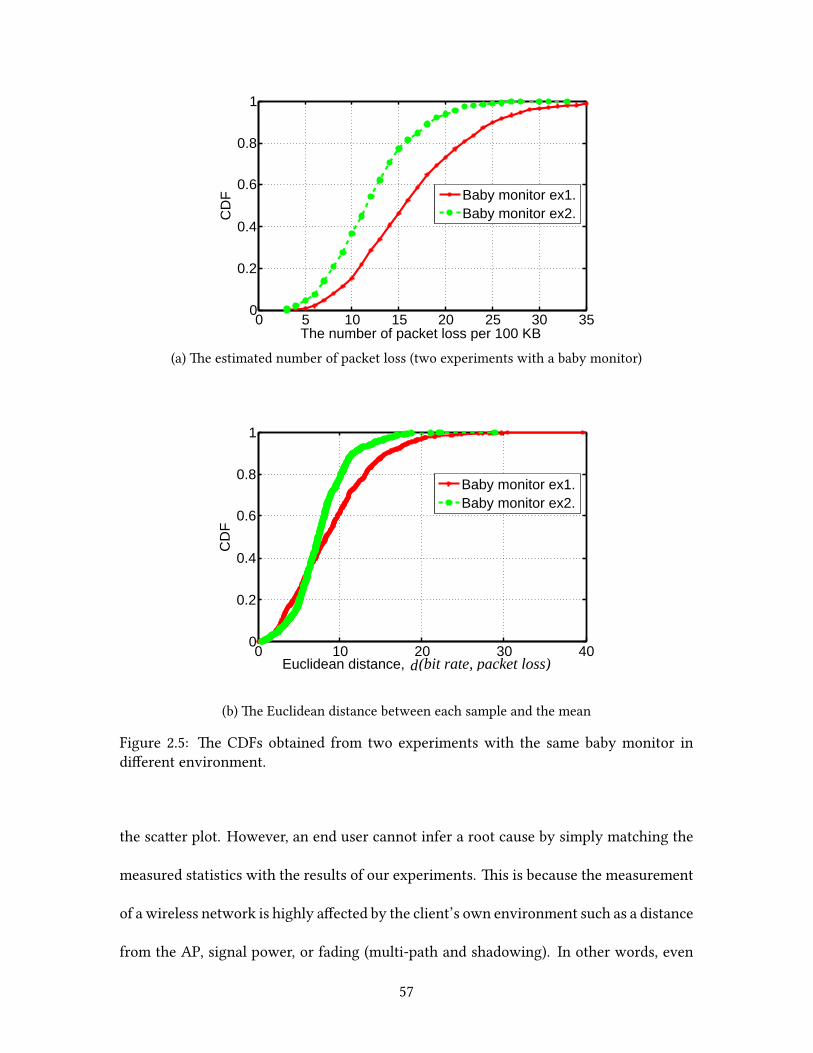
The number of packet loss per 100 KB0 5 10 15 20 25 30 35
0
0.2
0.4
0.6
0.8
1
CD
F
Baby monitor ex1.Baby monitor ex2.
(a) e estimated number of packet loss (two experiments with a baby monitor)
(bit rate, packet loss)Euclidean distance,
CD
F
0 10 20 30 400
0.2
0.4
0.6
0.8
1
Baby monitor ex1.Baby monitor ex2.
d
(b) e Euclidean distance between each sample and the mean
Figure 2.5: e CDFs obtained from two experiments with the same baby monitor indifferent environment.
the scaer plot. However, an end user cannot infer a root cause by simply matching the
measured statistics with the results of our experiments. is is because the measurement
of a wireless network is highly affected by the client’s own environment such as a distance
from the AP, signal power, or fading (multi-path and shadowing). In other words, even
57
though they have the same type of problem, the statistics of the measured metrics can
vary depending on each end user’s own situation. Note that this is the reason why simple
measurements such as the higher-layer throughput (e.g., TCP or UDP) or number of 802.11
retries are not enough to identify the level of interference and the type of interferers.
erefore, it is necessary to find a metric that only depends on the interference source,
not the underlying environments. To achieve this, we focused on evaluating the variance
of the measured samples rather than their values. On the scaer plot described above
where x-axis is the available bit rates and y-axis is the number of packet losses, we found
that even if the underlying environment changes, the extent of the area over which the sam-
ples are placed does not change significantly if the problem source is the same, which implies
that the variance of the samples are consistent across different environments. Figure 2.4b
shows that even though the two groups of samples from discrete environments are dis-
tributed on different spots on the coordinate plane, their extent is similar. us, we first
quantify how widely the samples are dispersed by calculating the Euclidean distances be-
tween each sample and the mean. We use the following formula to calculate the distance:
distance =√
(Mx − Sx)2 + (My − Sy)2,mean = (Mx,My), sample = (Sx, Sy), where
x = available bit rate (Mb/s), y = the number of packet losses per 100KB of data. Note
that the units of the sample data are best chosen to balance the magnitude of the variance
of x-axis values and that of y-axis values to avoid only one of them impacting the result.
erefore, the distance value itself is not meaningful, but a set of the distance values are
useful to compare the level of interference and identify the interference source. Figure 2.5
compares the CDFs obtained from two experiments that were conducted with the same
baby monitor in two discrete environments. e CDFs of packet loss estimation (Fig-
58
ure 2.5a) show different distributions while the CDFs of the Euclidean distances between
the samples and the mean show similar distribution (Figure 2.5b).
erefore, WiSlow can use the CDFs of the Euclidean distances to identify the root
causes of network interference. We prepare these CDFs of each problem source in ad-
vance, which are obtained from our experiments. en, WiSlow traces the wireless pack-
ets on an end user’s machine, generates a CDF of the distances, and compares it to the
pre-calculated CDFs of each problem source. For the convenience of identification, we
group the problem sources into three groups by the shape of the CDFs: no interferers
(group 1), light interferers (group 2), and heavy interferers (group 3). Each group has
its representative CDFs that are determined by multiple experiments (Figure 2.6). In our
data sets, group 1 indicates a no-interference environment, group 2 includes channel con-
tention and cordless phones that use frequency-hopping spread spectrum (FHSS), and
group 3 contains microwave ovens and baby monitors. WiSlow examines which repre-
sentative CDF is the most similar one to the CDF measured on the user’s machine. To
compare the CDFs, WiSlow uses the two-sample Kolmogorov-Smirnov test (K-S test), a
widely used statistical method that tests whether two empirical CDFs obtained from sep-
arate experiments have the same distribution [36]. If the p-value of this test is close to
1, the two CDFs are likely to come from the same distribution, however, if the p-value is
close to 0, they are likely to come from different distributions. Since the K-S test not only
considers the average and variance of the samples but also takes into account the shape
of the CDFs, it best fits the purpose of WiSlow where it is used to pick the most similar
distribution from multiple data sets. Our evaluation proves that the approach explained
above successfully distinguishes these groups, minimizing the impact of the end user’s
59
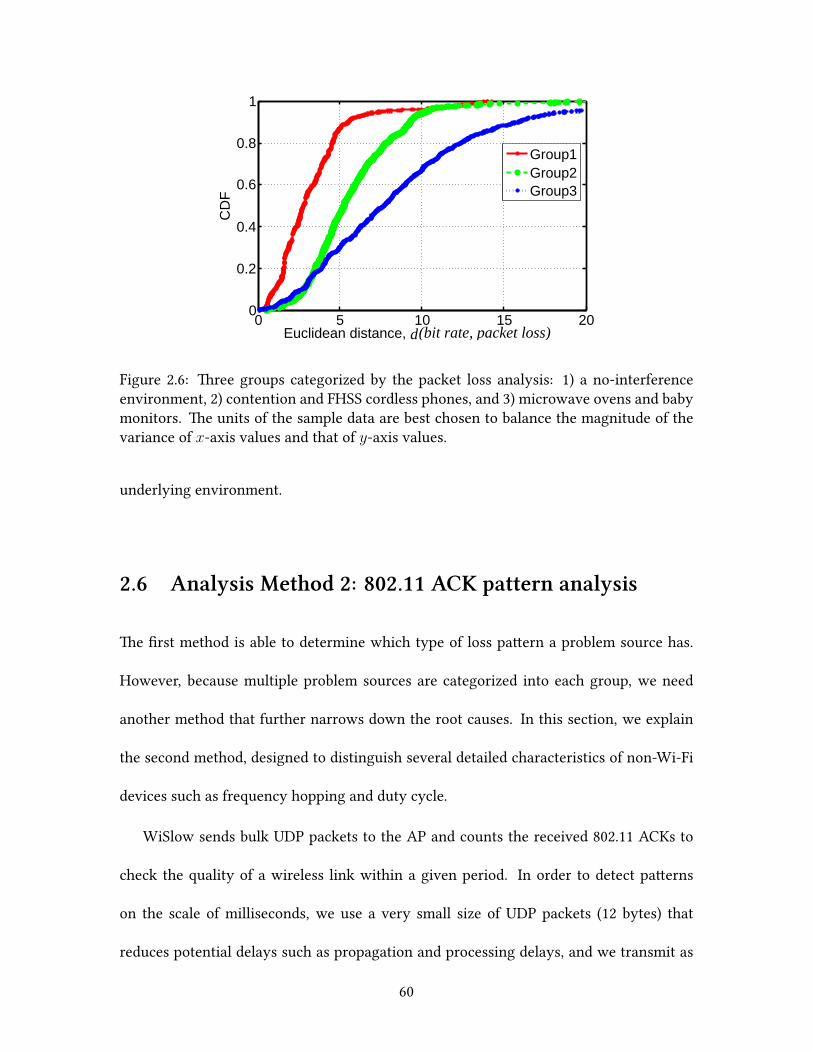
(bit rate, packet loss)dEuclidean distance,0 5 10 15 20
0
0.2
0.4
0.6
0.8
1
CD
F
Group1Group2Group3
Figure 2.6: ree groups categorized by the packet loss analysis: 1) a no-interferenceenvironment, 2) contention and FHSS cordless phones, and 3) microwave ovens and babymonitors. e units of the sample data are best chosen to balance the magnitude of thevariance of x-axis values and that of y-axis values.
underlying environment.
2.6 Analysis Method 2: 802.11 ACK pattern analysis
e first method is able to determine which type of loss paern a problem source has.
However, because multiple problem sources are categorized into each group, we need
another method that further narrows down the root causes. In this section, we explain
the second method, designed to distinguish several detailed characteristics of non-Wi-Fi
devices such as frequency hopping and duty cycle.
WiSlow sends bulk UDP packets to the AP and counts the received 802.11 ACKs to
check the quality of a wireless link within a given period. In order to detect paerns
on the scale of milliseconds, we use a very small size of UDP packets (12 bytes) that
reduces potential delays such as propagation and processing delays, and we transmit as
60
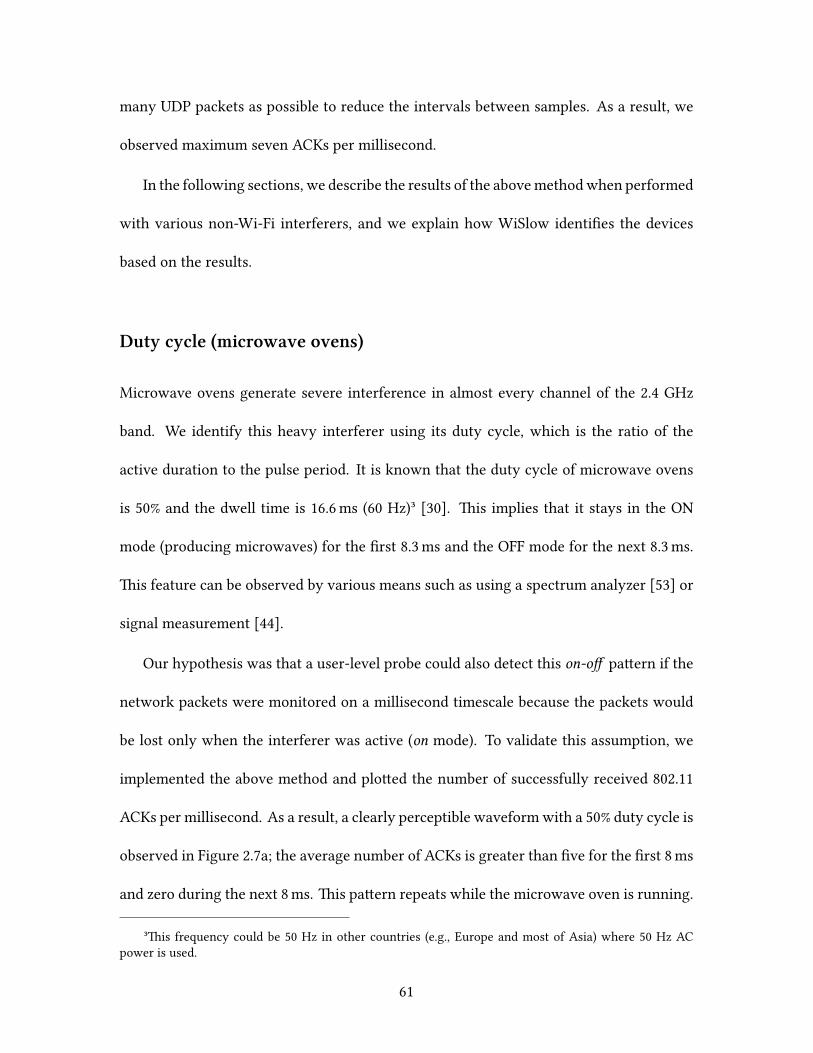
many UDP packets as possible to reduce the intervals between samples. As a result, we
observed maximum seven ACKs per millisecond.
In the following sections, we describe the results of the abovemethodwhen performed
with various non-Wi-Fi interferers, and we explain how WiSlow identifies the devices
based on the results.
Duty cycle (microwave ovens)
Microwave ovens generate severe interference in almost every channel of the 2.4 GHz
band. We identify this heavy interferer using its duty cycle, which is the ratio of the
active duration to the pulse period. It is known that the duty cycle of microwave ovens
is 50% and the dwell time is 16.6ms (60 Hz)³ [30]. is implies that it stays in the ON
mode (producing microwaves) for the first 8.3ms and the OFF mode for the next 8.3ms.
is feature can be observed by various means such as using a spectrum analyzer [53] or
signal measurement [44].
Our hypothesis was that a user-level probe could also detect this on-off paern if the
network packets were monitored on a millisecond timescale because the packets would
be lost only when the interferer was active (on mode). To validate this assumption, we
implemented the above method and ploed the number of successfully received 802.11
ACKs per millisecond. As a result, a clearly perceptible waveformwith a 50% duty cycle is
observed in Figure 2.7a; the average number of ACKs is greater than five for the first 8ms
and zero during the next 8ms. is paern repeats while the microwave oven is running.
³is frequency could be 50 Hz in other countries (e.g., Europe and most of Asia) where 50 Hz ACpower is used.
61
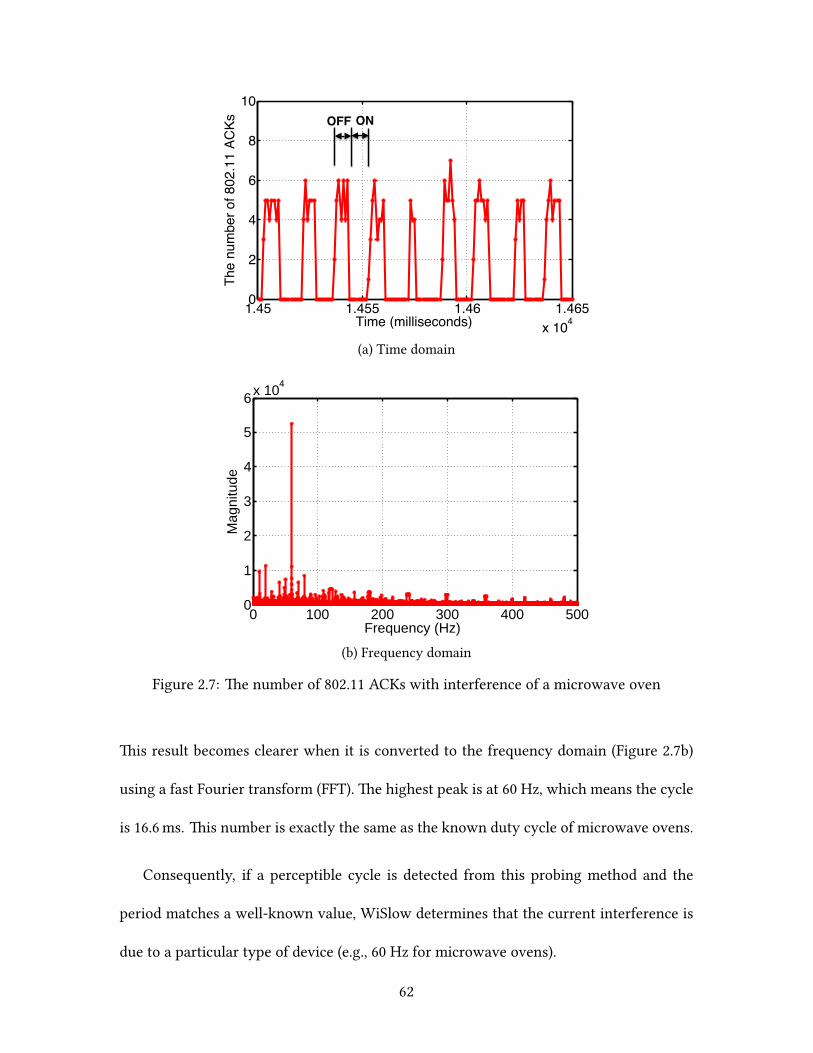
1.45 1.455 1.46 1.465x 10⁴
0
2
4
6
8
10
Time (milliseconds)
The
num
ber o
f 802
.11
ACKs ONOFF
(a) Time domain
Frequency (Hz)0 100 200 300 400 500
0
1
2
3
4
5
6x 10⁴
Mag
nitu
de
(b) Frequency domain
Figure 2.7: e number of 802.11 ACKs with interference of a microwave oven
is result becomes clearer when it is converted to the frequency domain (Figure 2.7b)
using a fast Fourier transform (FFT). e highest peak is at 60 Hz, which means the cycle
is 16.6ms. is number is exactly the same as the known duty cycle of microwave ovens.
Consequently, if a perceptible cycle is detected from this probing method and the
period matches a well-known value, WiSlow determines that the current interference is
due to a particular type of device (e.g., 60 Hz for microwave ovens).
62
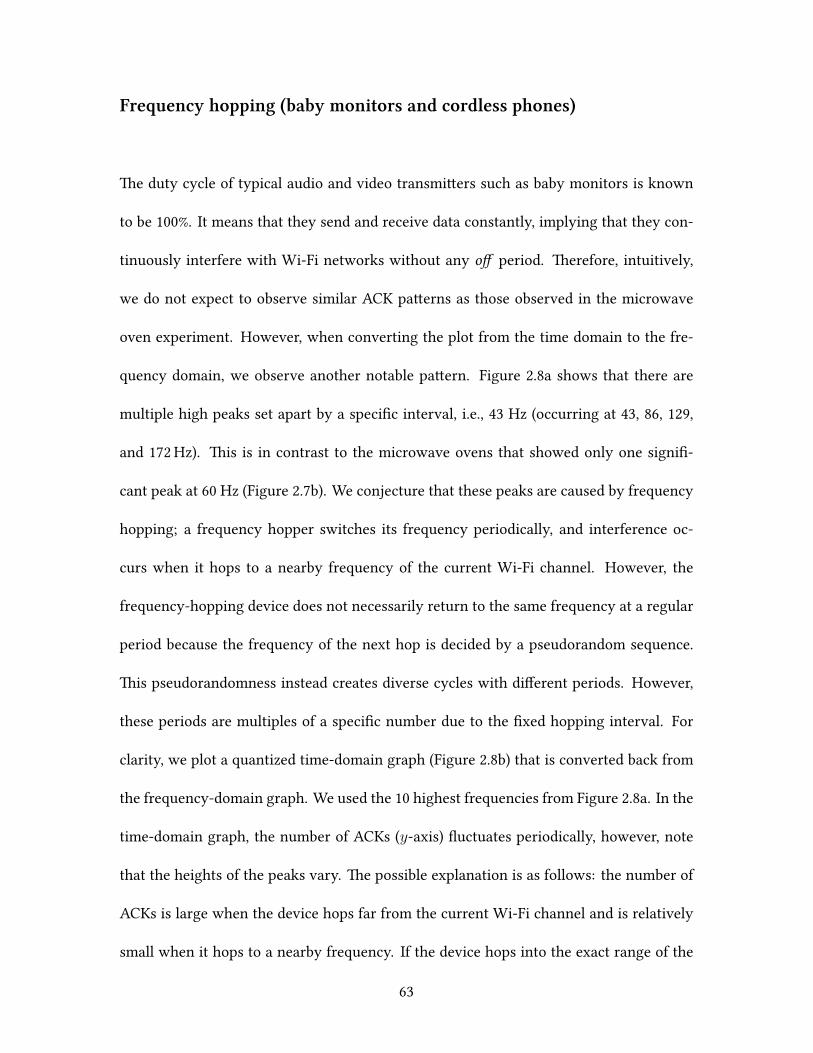
Frequency hopping (baby monitors and cordless phones)
e duty cycle of typical audio and video transmiers such as baby monitors is known
to be 100%. It means that they send and receive data constantly, implying that they con-
tinuously interfere with Wi-Fi networks without any off period. erefore, intuitively,
we do not expect to observe similar ACK paerns as those observed in the microwave
oven experiment. However, when converting the plot from the time domain to the fre-
quency domain, we observe another notable paern. Figure 2.8a shows that there are
multiple high peaks set apart by a specific interval, i.e., 43 Hz (occurring at 43, 86, 129,
and 172Hz). is is in contrast to the microwave ovens that showed only one signifi-
cant peak at 60 Hz (Figure 2.7b). We conjecture that these peaks are caused by frequency
hopping; a frequency hopper switches its frequency periodically, and interference oc-
curs when it hops to a nearby frequency of the current Wi-Fi channel. However, the
frequency-hopping device does not necessarily return to the same frequency at a regular
period because the frequency of the next hop is decided by a pseudorandom sequence.
is pseudorandomness instead creates diverse cycles with different periods. However,
these periods are multiples of a specific number due to the fixed hopping interval. For
clarity, we plot a quantized time-domain graph (Figure 2.8b) that is converted back from
the frequency-domain graph. We used the 10 highest frequencies from Figure 2.8a. In the
time-domain graph, the number of ACKs (y-axis) fluctuates periodically, however, note
that the heights of the peaks vary. e possible explanation is as follows: the number of
ACKs is large when the device hops far from the current Wi-Fi channel and is relatively
small when it hops to a nearby frequency. If the device hops into the exact range of the
63
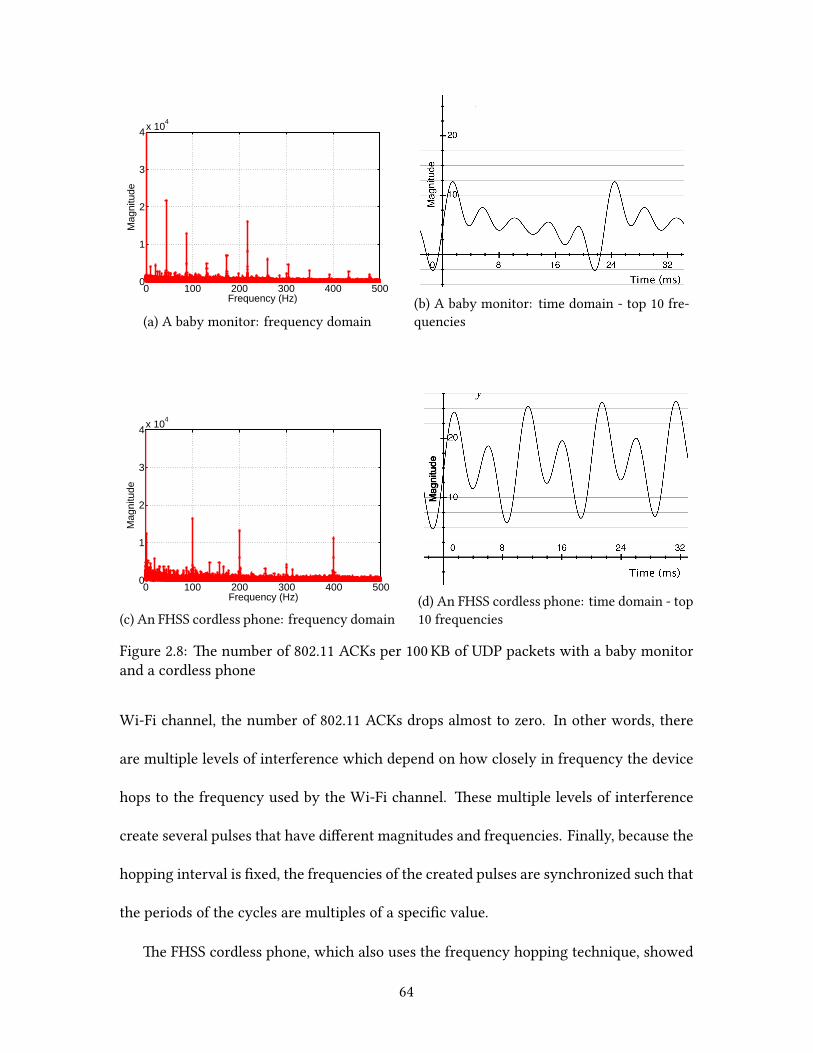
Frequency (Hz)0 100 200 300 400 500
0
1
2
3
4x 10⁴
Mag
nitu
de
(a) A baby monitor: frequency domain(b) A baby monitor: time domain - top 10 fre-quencies
Frequency (Hz)0 100 200 300 400 500
0
1
2
3
4x 10⁴
Mag
nitu
de
(c) An FHSS cordless phone: frequency domain
Magnitude
(d) An FHSS cordless phone: time domain - top10 frequencies
Figure 2.8: e number of 802.11 ACKs per 100 KB of UDP packets with a baby monitorand a cordless phone
Wi-Fi channel, the number of 802.11 ACKs drops almost to zero. In other words, there
are multiple levels of interference which depend on how closely in frequency the device
hops to the frequency used by the Wi-Fi channel. ese multiple levels of interference
create several pulses that have different magnitudes and frequencies. Finally, because the
hopping interval is fixed, the frequencies of the created pulses are synchronized such that
the periods of the cycles are multiples of a specific value.
e FHSS cordless phone, which also uses the frequency hopping technique, showed
64
a similar result — multiple peaks spaced by a fixed interval of 100Hz (Figure 2.8). is
verifies that our method is suitable to identify frequency hopping devices.
Consequently, we can distinguish frequency-hopping devices by determiningwhether
the number of 802.11 ACKs has multiple high peaks with a certain interval in the fre-
quency domain. We check this by linear regression of the peak frequencies; if the corre-
lation coefficient is greater than 0.99, we consider it to be a frequency-hopping device.
Fixed frequency (analog cordless phones)
Since many analog cordless phones use a fixed frequency, they usually interfere only with
a small number of channels. (e analog phones we tested only interfered with Channel
1.) Because they do not change frequency, severe interference occurs if the current Wi-Fi
channel overlaps with the frequency of the phone. In addition, their duty cycle is close to
100%, which implies that the paern of ACK rates does not exist. In our experiments, the
UDP throughput stayed very low and no explicit paern of received ACKs was observed
as expected. is implies that the device does not use the frequency-hopping mechanism.
erefore, WiSlow concludes that an analog cordless phone is the interferer if there is
heavy interference paern but no explicit ACK cycle or duty cycle is detected. en, we
can inform the user that switching the Wi-Fi channel can improve the performance in
this case because we know that this kind of devices only affects a few channels.
65
Mixed-mode devices with frequency hopping and partial duty cycle
A Frequency Hopping Spread Spectrum (FHSS) phone is another example of a device that
explicitly shows the hopping paerns that we described above. In addition, it is known
that some FHSS phones have a specific pulse interval, which was verified by Rayanchu
et al. [44] using signal measurement. We also confirmed this feature with our user-level
probes. Figure 2.8c shows 802.11 ACKs in the frequency domain. It shows similar pat-
terns as the microwave ovens (low duty cycle devices) rather than the baby monitors
(frequency-hopping devices) even though it also uses frequency hopping. is is because
the duty cycle influences the shape of the waveform more than the hopping effect. ere-
fore, it is possible to use this duty cycle to distinguish the FHSS cordless phones as we
did for the microwave ovens. In this case, we use the frequencies, 100 and 200 Hz, to
determine the FHSS cordless phone interference. However, to the best of our knowledge,
there is no standard regarding the period of the duty cycle for FHSS cordless phones. is
means it can vary depending on the product. erefore, if a duty cycle is detected but the
period is an unknown value, WiSlow fails to identify the exact product type. In this case,
we provide our best estimate of the problem source by listing a possible set of candidates.
Bluetooth
Bluetooth is another widely used wireless standard that operates in the 2.4 GHz spec-
trum. Hopping within the entire 2.4 GHz band, it interferes with every channel of an
802.11 network. However, algorithms such as Adapted Frequency Hopping (AFH), which
is used to automatically avoid busy channels, mitigate this interference. Consequently,
66
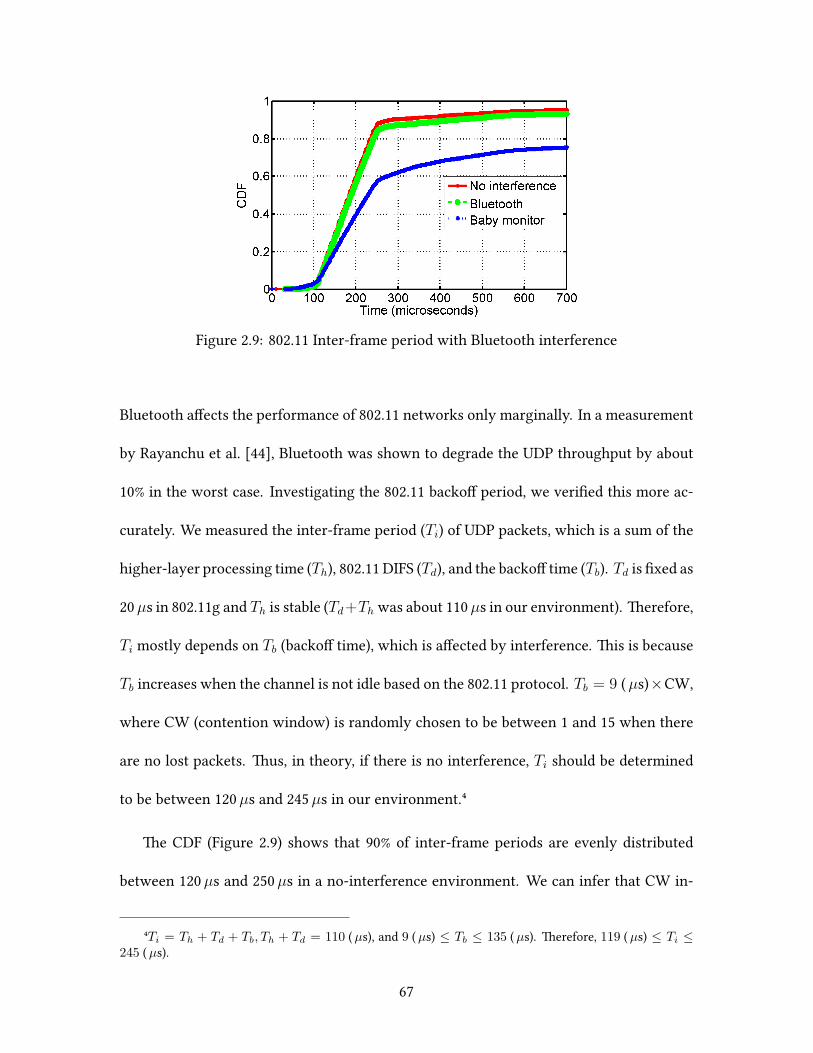
Figure 2.9: 802.11 Inter-frame period with Bluetooth interference
Bluetooth affects the performance of 802.11 networks only marginally. In a measurement
by Rayanchu et al. [44], Bluetooth was shown to degrade the UDP throughput by about
10% in the worst case. Investigating the 802.11 backoff period, we verified this more ac-
curately. We measured the inter-frame period (Ti) of UDP packets, which is a sum of the
higher-layer processing time (Th), 802.11 DIFS (Td), and the backoff time (Tb). Td is fixed as
20µs in 802.11g and Th is stable (Td+Th was about 110µs in our environment). erefore,
Ti mostly depends on Tb (backoff time), which is affected by interference. is is because
Tb increases when the channel is not idle based on the 802.11 protocol. Tb = 9 (µs)×CW,
where CW (contention window) is randomly chosen to be between 1 and 15 when there
are no lost packets. us, in theory, if there is no interference, Ti should be determined
to be between 120µs and 245µs in our environment.⁴
e CDF (Figure 2.9) shows that 90% of inter-frame periods are evenly distributed
between 120µs and 250µs in a no-interference environment. We can infer that CW in-
⁴Ti = Th + Td + Tb, Th + Td = 110 (µs), and 9 (µs) ≤ Tb ≤ 135 (µs). erefore, 119 (µs) ≤ Ti ≤245 (µs).
67
creased owing to the ACK timeout (lost packet) in the other 10% of the cases. With the
presence of a baby monitor, 40% of Ti were greater than 246µs. However, the Bluetooth
and no-interference cases show almost the same distribution (only 10% are greater than
250µs), which implies that Bluetooth does not interfere much with 802.11g networks. For
this reason, we excluded Bluetooth in both our experiment and the evaluation scenario.
2.7 Classification
WiSlow takes into account the combination of the results from the first method (packet
loss analysis) and the secondmethod (ACK paern analysis) to identify the device product
type precisely. For example, if the result of the first method is Group 3 and that of the sec-
ond method is frequency-hopping, we consider the problem source to be a baby monitor.
In addition, WiSlow looks into the source and destination addresses of the captured 802.11
packets in order to examine the channel occupancy rate. If the channel is highly occupied
by other clients or nearby APs, but WiSlow does not detect any non-Wi-Fi interference,
it considers the root cause to be channel contention.
Figure 2.10 describes the classification algorithm thatWiSlow uses to arrive at the root
cause.
2.8 Locating interfering devices
A number of research studies on indoor location tracking have aempted to pinpoint
the location of laptops or smartphones through various methods [6, 27, 56]. While these
68
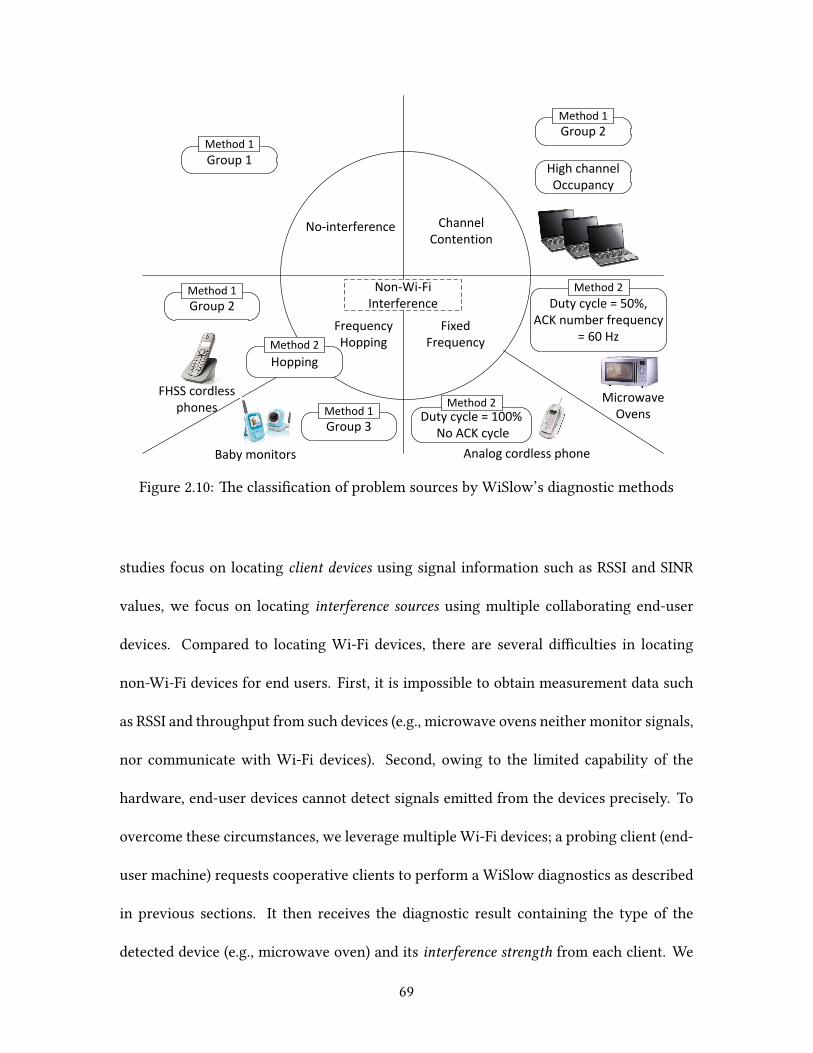
No-interference
Frequency Hopping
Fixed Frequency
ChannelContention
Duty cycle = 100% No ACK cycle
Baby monitors
Non-Wi-Fi Interference
Group 1Method 1
Group 2Method 1
High channel Occupancy
Duty cycle = 50%,ACK number frequency
= 60 Hz
Method 2
Method 2
Group 2Method 1
Hopping
Method 2
Group 3Method 1
Analog cordless phone
FHSS cordless phones
MicrowaveOvens
Figure 2.10: e classification of problem sources by WiSlow’s diagnostic methods
studies focus on locating client devices using signal information such as RSSI and SINR
values, we focus on locating interference sources using multiple collaborating end-user
devices. Compared to locating Wi-Fi devices, there are several difficulties in locating
non-Wi-Fi devices for end users. First, it is impossible to obtain measurement data such
as RSSI and throughput from such devices (e.g., microwave ovens neither monitor signals,
nor communicate with Wi-Fi devices). Second, owing to the limited capability of the
hardware, end-user devices cannot detect signals emied from the devices precisely. To
overcome these circumstances, we leverage multiple Wi-Fi devices; a probing client (end-
user machine) requests cooperative clients to perform a WiSlow diagnostics as described
in previous sections. It then receives the diagnostic result containing the type of the
detected device (e.g., microwave oven) and its interference strength from each client. We
69
calculate the interference strength using the magnitude of the paern of the number of
received ACKs which was used to detect the device, as described in the previous section.
For example, the interference strength of a microwave oven can be determined based on a
magnitude of 60 Hz in the FFT of the number of ACKs. In the case of an FHSS device, it
can be determined by the sum of the magnitudes of the multiple frequencies caused by the
frequency hopping paern. Aer collecting the strength values from the clients, we use
the same method of obtaining the center of mass to find the location of the interference.
If the interference strength detected by a particular client is greater than that detected
by other clients, it means that the interference source is closer to that client. erefore,
interference strength can be considered equivalent to the mass in the formula of the center
of mass. WiSlow first obtains the coordinates of cooperative clients based on the input
from end users and calculates the coordinates of the interference source using the formula.
e basic mechanism is that an end user (probing client) first requests multiple co-
operative clients to perform WiSlow diagnostics as described in previous sections. en
it checks whether the other client machines observe the same interference. If all the co-
operative client machines observe a particular type of interference at the same time, it
is likely that the problematic source is close to the AP because this would affect the en-
tire wireless network. However, if only one of the clients observes the interference, the
source is highly likely to be located close to that client.
Mi =m∑k=1
fi(kx), R =1
n∑i=1
Mi
n∑i=1
Miri (2.2)
Mi is the strength of interference on the ith client and fi denotes the function of the
70
measured magnitudes for each frequency, kx, where x is the smallest frequency caused
by the interfering device. e coordinate of the interference source, R, can be calcu-
lated based on the sum of each client’s weighted (Mi) coordinates (ri). We evaluate this
approach in Section 2.9.
2.9 Evaluation
In this section, we evaluate the accuracy of WiSlow. First, we placed a laptop 8m away
from an AP, sufficiently close so that Wi-Fi performance is not affected by weak signal
strength. en, we located the interfering devices between them, one at a time. We re-
peated the experiments altering the distance between the interfering device and the AP.
We ran WiSlow on the laptop 15 times each at six different locations (a total of 90 mea-
surements for each interfering device) and counted the number of times that WiSlow
correctly diagnosed the root cause. First, without considering the type of the non-Wi-Fi
device, we tested the capability of WiSlow to distinguish between no-interference, chan-
nel contention, and non-Wi-Fi interference.
We evaluate the diagnostic accuracy and the false positive rate (type-I error) of WiSlow
for each problem source. e diagnostic accuracy of a problem source P is the ratio of the
number of correct diagnostics to the total number of experiments in which P is injected as
a problem source. e false positive rate of P is the ratio of the number of cases that the
cause is misidentified as P to the total number of experiments in which P is not actually
the cause.
Table 2.1 shows thatWiSlow successfully distinguishes themwith high accuracy (over
71
90% for no-interference and channel contention cases). In the non-Wi-Fi interference
case, the accuracy was also over 90% when the interfering device was close to the AP;
however, it notably decreasedwhen the distance between the AP and the device increased.
We found that this inaccuracy was mostly caused by the FHSS cordless phones. In the
following sections, we explain the reason for this inaccuracy and the method WiSlow
employed to reduce it.
Identifying the root cause
Table 2.2 shows the detailed diagnostic results of identifying each type of non-Wi-Fi de-
vice. First, WiSlow could clearly detect interference caused by a microwave oven re-
gardless of the distance (average 98%). In our extra experiments, WiSlow could detect
the duty cycle of the microwave oven even when located relatively far from the AP and
laptop (11m and 16m). However, in these cases, the microwave oven did not severely
interfere with the Wi-Fi network, thus we do not elaborate further on the results.
Second, the diagnostic accuracy of detecting baby monitors was also very high when
it was close to the AP. However, it dropped to under 6.7% when the distance was greater
than 1m (Table 2.2). In most cases, it was misidentified as a FHSS cordless phone, which
contributed the high false positive rate of this device (24.8%). is result occurred because
these two devices have the same characteristic (frequency hopping), andWiSlow partially
considers their level of interference to distinguish them. In other words, if a baby monitor
is far from aWi-Fi device and causes less interference, it can mislead WiSlow’s identifica-
tion. e accuracy of detecting FHSS cordless phones was also low when it was not close
72
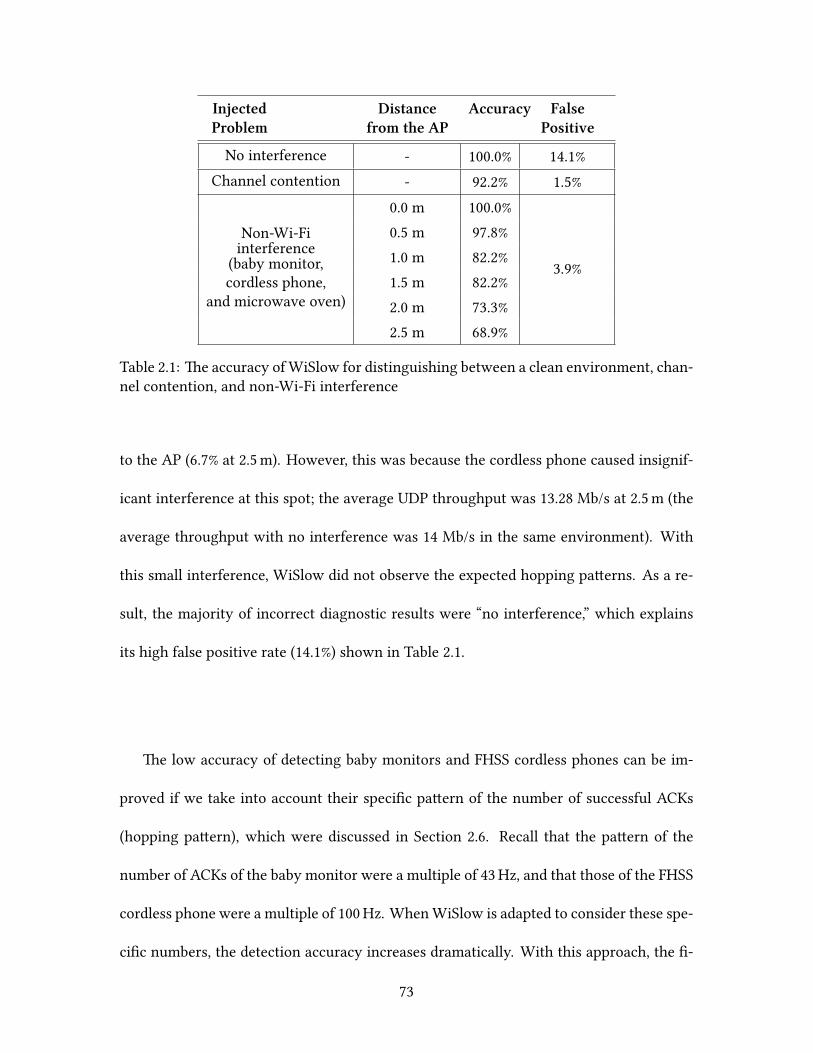
InjectedProblem
Distancefrom the AP
Accuracy FalsePositive
No interference - 100.0% 14.1%Channel contention - 92.2% 1.5%
Non-Wi-Fiinterference
(baby monitor,cordless phone,
and microwave oven)
0.0 m 100.0%
3.9%
0.5 m 97.8%1.0 m 82.2%1.5 m 82.2%2.0 m 73.3%2.5 m 68.9%
Table 2.1: e accuracy ofWiSlow for distinguishing between a clean environment, chan-nel contention, and non-Wi-Fi interference
to the AP (6.7% at 2.5m). However, this was because the cordless phone caused insignif-
icant interference at this spot; the average UDP throughput was 13.28 Mb/s at 2.5m (the
average throughput with no interference was 14 Mb/s in the same environment). With
this small interference, WiSlow did not observe the expected hopping paerns. As a re-
sult, the majority of incorrect diagnostic results were “no interference,” which explains
its high false positive rate (14.1%) shown in Table 2.1.
e low accuracy of detecting baby monitors and FHSS cordless phones can be im-
proved if we take into account their specific paern of the number of successful ACKs
(hopping paern), which were discussed in Section 2.6. Recall that the paern of the
number of ACKs of the baby monitor were a multiple of 43Hz, and that those of the FHSS
cordless phone were a multiple of 100Hz. WhenWiSlow is adapted to consider these spe-
cific numbers, the detection accuracy increases dramatically. With this approach, the fi-
73
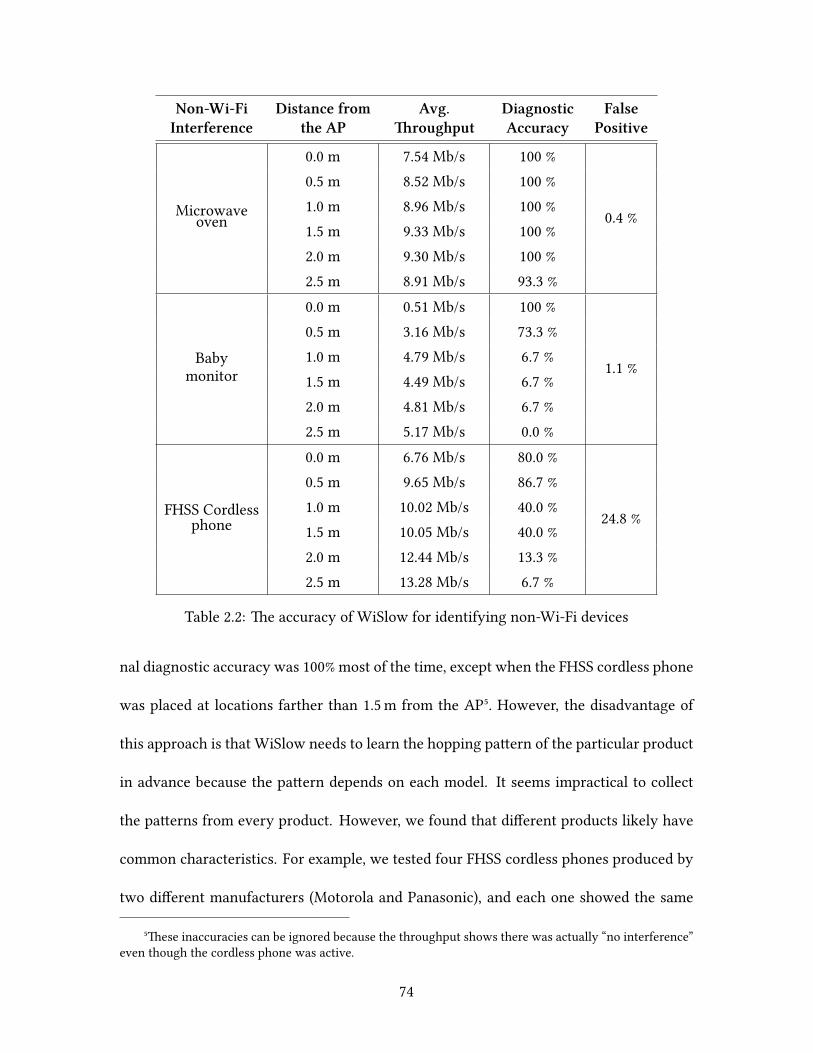
Non-Wi-FiInterference
Distance fromthe AP
Avg.roughput
DiagnosticAccuracy
FalsePositive
Microwaveoven
0.0 m 7.54 Mb/s 100 %
0.4 %
0.5 m 8.52 Mb/s 100 %1.0 m 8.96 Mb/s 100 %1.5 m 9.33 Mb/s 100 %2.0 m 9.30 Mb/s 100 %2.5 m 8.91 Mb/s 93.3 %
Babymonitor
0.0 m 0.51 Mb/s 100 %
1.1 %
0.5 m 3.16 Mb/s 73.3 %1.0 m 4.79 Mb/s 6.7 %1.5 m 4.49 Mb/s 6.7 %2.0 m 4.81 Mb/s 6.7 %2.5 m 5.17 Mb/s 0.0 %
FHSS Cordlessphone
0.0 m 6.76 Mb/s 80.0 %
24.8 %
0.5 m 9.65 Mb/s 86.7 %1.0 m 10.02 Mb/s 40.0 %1.5 m 10.05 Mb/s 40.0 %2.0 m 12.44 Mb/s 13.3 %2.5 m 13.28 Mb/s 6.7 %
Table 2.2: e accuracy of WiSlow for identifying non-Wi-Fi devices
nal diagnostic accuracy was 100% most of the time, except when the FHSS cordless phone
was placed at locations farther than 1.5m from the AP⁵. However, the disadvantage of
this approach is that WiSlow needs to learn the hopping paern of the particular product
in advance because the paern depends on each model. It seems impractical to collect
the paerns from every product. However, we found that different products likely have
common characteristics. For example, we tested four FHSS cordless phones produced by
two different manufacturers (Motorola and Panasonic), and each one showed the same
⁵ese inaccuracies can be ignored because the throughput shows there was actually “no interference”even though the cordless phone was active.
74
paern of the number of ACKs (multiples of 100Hz). In this particular case, the paern
is caused by the DECT (Digital Enhanced Cordless Telecommunications) standard [21]
which specifies the frame time as 10ms. erefore, we believe that collecting a small
amount of information can cover the majority of devices if they follow the industry stan-
dards or use similar technologies.
In conclusion, WiSlow successfully detected the root cause of Wi-Fi performance
degradation with a high probability (over 90%) in most cases, although it frequently
misidentified the type of certain non-Wi-Fi interfering devices when they were not lo-
cated near the Wi-Fi device. However, this inaccuracy can be removed if we take into
account the pre-obtained paern of the number of received ACKs of each device.
Locating interfering devices
We set up three laptops and one 802.11g AP in a building at Columbia University. We
placed a baby monitor between them and changed its location over time. Figure 2.11a
illustrates our experimental scenario. e circled numbers indicate the movement path of
the babymonitor. We ranWiSlow each time the locationwas changed. Figure 2.11b shows
an actual real-time screenshot of WiSlow detecting the location of the baby monitor. For
the first location, laptops A and B reported no interference, but laptop C detected the
baby monitor successfully. For the second location, the three laptops all detected the baby
monitor and reported similar interference strengths because the interference source was
close to the AP, and thus the entire wireless network was affected by the baby monitor. In
this particular case, WiSlow could infer that the problem source was likely to be a device
75
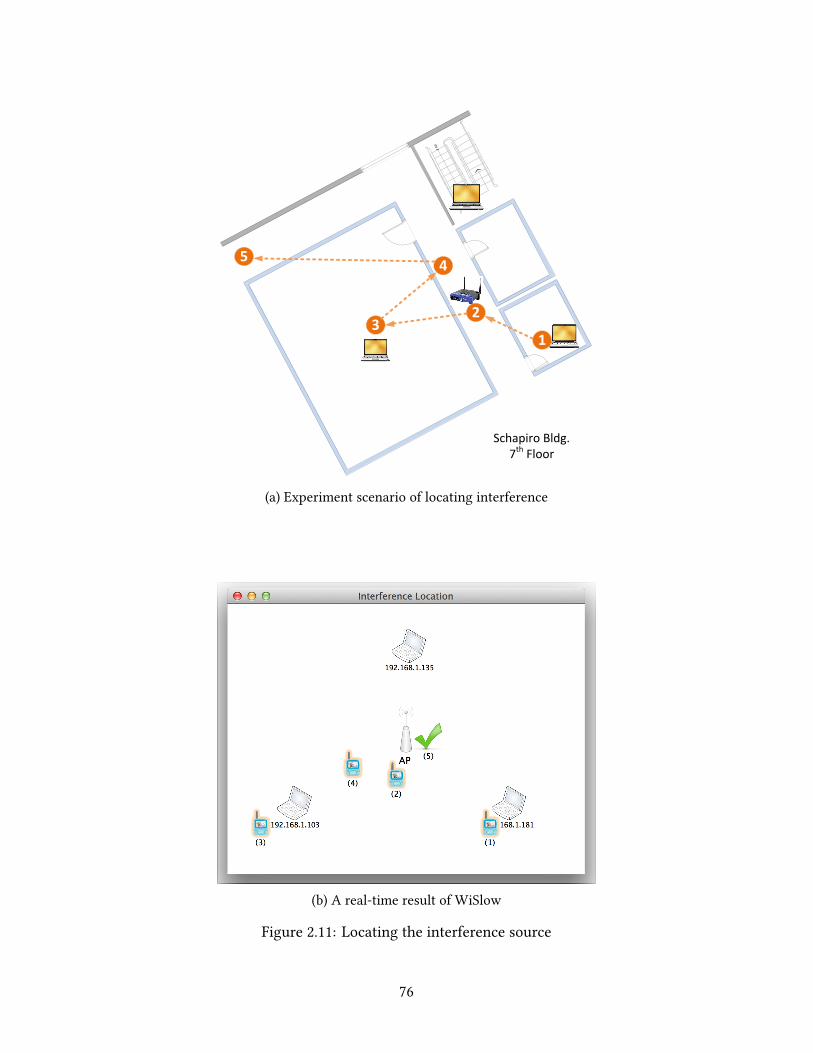
Schapiro Bldg. 7th Floor
Up
23
1
45
(a) Experiment scenario of locating interference
(b) A real-time result of WiSlow
Figure 2.11: Locating the interference source
76
placed near the AP. For the third location, only laptop B detected the baby monitor, and
thus WiSlow placed the baby monitor icon close to laptop B. For the fourth location,
the three laptops all detected the baby monitor, but the measured interference strengths
were distinct. erefore, based on the formula of the center of mass, WiSlow pointed the
location of the baby monitor as being relatively close to laptop B. For the last spot, since
none of the laptops detected any interference, only a green check icon was displayed,
which indicates that the state of the network is good.
is experiment proves that our approach is feasible for determining the relative lo-
cation of an interfering device. Although WiSlow shows errors of several meters in pin-
pointing a location, we believe that this level of error is not critical for a home network
environment since users typically have only one cordless phone or baby monitor. (ey
do need to distinguish between their own device and that operated by a neighbor.)
2.10 Related work
Airshark [44] uses a commodity Wi-Fi network adapter using Atheros chipsets to iden-
tify the source of interference. It leverages a spectral scan to obtain signal information
from multiple frequency ranges. It identifies the interference sources very accurately
(over 95%) by analyzing the spectrum data using various methods. However, it is not
easy to apply this approach for typical end users because collecting high-resolution sig-
nal samples across the spectrum is impossible if the network card does not support this
functionality. WiFiNet [45] identifies the impact of non-Wi-Fi interference and finds its
location using observations from multiple APs that are running Airshark. Although the
77
authors briefly mention that WiFiNet can be used by end users, they focus more on pin-
pointing the location of the interference source using multiple APs, which is difficult to
be used in a home network environment that usually has a single AP. In contrast, WiSlow
focuses on identifying the location of the interference source by exploiting cooperation
between end users.
Kanuparthy et al. [31] propose an approach similar to WiSlow in terms of using user-
level information. ey distinguish congestion (channel contention) from hidden termi-
nals and low SNR by measuring the one-way delay of different packet sizes. ey then
investigate the delay paerns to distinguish hidden terminals from low SNR. While their
approach intentionally avoids using layer-2 information, WiSlow actively exploits 802.11
information in order to obtain a more detailed identification (e.g., device type causing
the interference). Spectrum MRI [10] also isolates interference problems. e authors
discuss that the link occupancy and retransmission rate differs depending on the sources
of interference. ey measure and compare those metrics to identify Bluetooth, channel
congestion and the “slow link on same AP” problem bymeasuring the link occupancy and
retransmission rate and using a spectrum analyzer, Wi-Spy [53].
Sundaresan at el. [47] present a tool that identifies whether a performance boleneck
exists inside the home network or on the access link by measuring variation of packet
inter-arrival time and TCP RTT between a device and an access point. It also evaluates
the state of the wireless link by monitoring the bitrate and throughput on an AP. While
this tool focuses on identifying where a boleneck exists, WiSlow focuses on identifying
the type of interference source within the wireless network.
78
2.11 Discussion
802.11n
We have focused on interference in 802.11g networks (2.4 GHz). However, 802.11n, which
uses both 2.4 and 5GHz bands, has become popular. Although fewer non-Wi-Fi devices
are operating at 5 GHz, and thus less interference presently exists at that band, Cisco
has anticipated that more devices will use the 5GHz band in the future, and therefore a
similar interference will likely occur [18, 49]. We believe that our basic approach will also
be feasible for discovering non-Wi-Fi interference sources at 5 GHz if customized to an
802.11n environment.
Ad-Hoc mode and mobile devices
We also tested WiSlow on an ad-hoc network using two laptops, which enables WiSlow
to run independently without communicating with an AP. Since ad-hoc networks also
use the same 802.11 protocol, we did not see any differences from the experiments with
an AP. We expect that using WiSlow with ad-hoc networks will be especially helpful in
independently discovering nearby interference sources when used with multiple mobile
devices such as smartphones.
2.12 Conclusion
WedesignedWiSlow, aWi-Fi performance trouble shooting application, specialized to de-
tect non-Wi-Fi interference. WiSlow distinguishes 802.11 channel contention from non-
79
Wi-Fi interference, and identifies the type of interfering devices present. WiSlow was
designed to exploit user-level probing only, which enables a soware-only approach. For
this purpose, we developed two novel methods that use user-accessible packet informa-
tion such as UDP throughput and 802.11 ACKs.
e accuracy of WiSlow exceeds 90% when the sources are close to a Wi-Fi device
while it becomes less accurate when the interfering devices are located farther from the
Wi-Fi devices. However, this inaccuracy can be removed if we take into account the
known characteristics of each device. Also, we proved that the collaborative approach is
feasible for determining the relative location of an interfering device.
80
Chapter 3
MoT: A Collaborative Network Troubleshooting Platform for
the Internet of ings
3.1 Introduction
Today, not only smartphones and laptop computers but also traditional household de-
vices such as TVs, air conditioners, lamps, and door locks are networked (smart objects).
Although the Internet grants powerful functionality to these smart objects, the conve-
nience instantly turns into a nuisance when the network does not function properly and
the cause remains hidden. Troubleshooting network problems on such devices is not easy
because most devices have insufficient computing power to run sophisticated diagnostic
tools and have no user interfaces to debug the problem directly. According to Sundaresan
et al. [48], service calls to Internet Service Providers (ISPs) for network troubleshooting
are costly ($9–$25 per call). If the Internet ofings (IoT) environment further penetrates
the home and every household device is connected to the Internet, this cost will increase
drastically in the near future.
For general end-user computers, the diagnostic tools for network problems can be
useful to mitigate the pain of the troubleshooting process. Existing tools include tra-
ditional command line tools (e.g., ping and traceroute), network diagnostic soware
81
embedded in each operating system, and several third-party diagnostic tools (e.g., Net-
work Magic and HomeNet Manager described in Section 1.6). However, these tools are
not only difficult to use for technically non-savvy users, but also inappropriate for home
devices because they require user interfaces such as keyboards and monitors. Moreover,
some tools may execute arduous tasks such as packet sniffing to trace and analyze the
network packets [39], which requires more memory, storage, and CPU power than the
small devices usually possess. For example, it is impractical to connect a monitor and key-
board physically to a networked door lock and execute ping, nslookup, and tcpdump in
order to identify the cause of its network problem. erefore, it is necessary to build a
lightweight and user-friendly network diagnostic tool for home networks.
We propose MoT (“Medic of ings”), a network problem diagnosis platform that
leverages the collaboration of smart objects, smartphones, and computers. e main idea
is that when a device suffers fromnetwork problems such as DNS resolution errors, misbe-
havior of a Network Address Translation (NAT) box, port blocking, and DHCP problems,
it offloads the troubleshooting task to other devices that have more capabilities (e.g., net-
work accessibility or computing power). However, there is an issue of how to inform the
other devices that the problem has occurred if the network is faulty. We note that most
recent smart objects (e.g., smart TVs) have been designed to support extra communication
protocols such as Bluetooth, ZigBee, Wi-Fi Direct, or NFC (Near Field Communication)
in addition to Wi-Fi. erefore, even if a device has a problem with a Wi-Fi network,
the problem can be reported to nearby devices via other available communication inter-
faces. When another device receives the problem report, and that device has diagnostic
functionality, it can start the diagnostic process to examine the problematic device and
82
the network. Otherwise, it can simply forward the task to a more suitable device. For
example, if a networked refrigerator has a problem with a Wi-Fi network, it sends a diag-
nosis request (like a distress message) to a nearby laptop computer that has no network
problem. e laptop has enough memory, CPU, and user interfaces to run a dedicated
diagnostic tool and thus is beer able to diagnose the current network status.
We propose a common message format as the means through which heterogeneous
devices communicate with each other to send, forward, and receive reports of network
problems. Moreover, a device that diagnoses a problem can send probe requests to other
devices to obtain different information about the current network state from multiple
devices. To separate the modules for rules and probing, we designed two layers: e
logic layer and the probe layer. is enables some devices that have less computing power
to have only the probe functionality and others that have sufficient computing power
(e.g., laptop computers and tablets) to have both diagnostic and probe functionality. We
implemented a prototype of this platform, including applications for Android devices and
general computers. e Android application uses native APIs to implement the probe
layer and adopt a Web application technology for the logic layer. In order to obtain probe
results from other nodes located outside the home network, we use DYSWIS presented
in Chapter 1. We also suggest using instances in public clouds if a user worries about
privacy in using peer-to-peer nodes. To prove the feasibility, we introduce a sample rule
for diagnosis of push notification faults on Android devices.
83
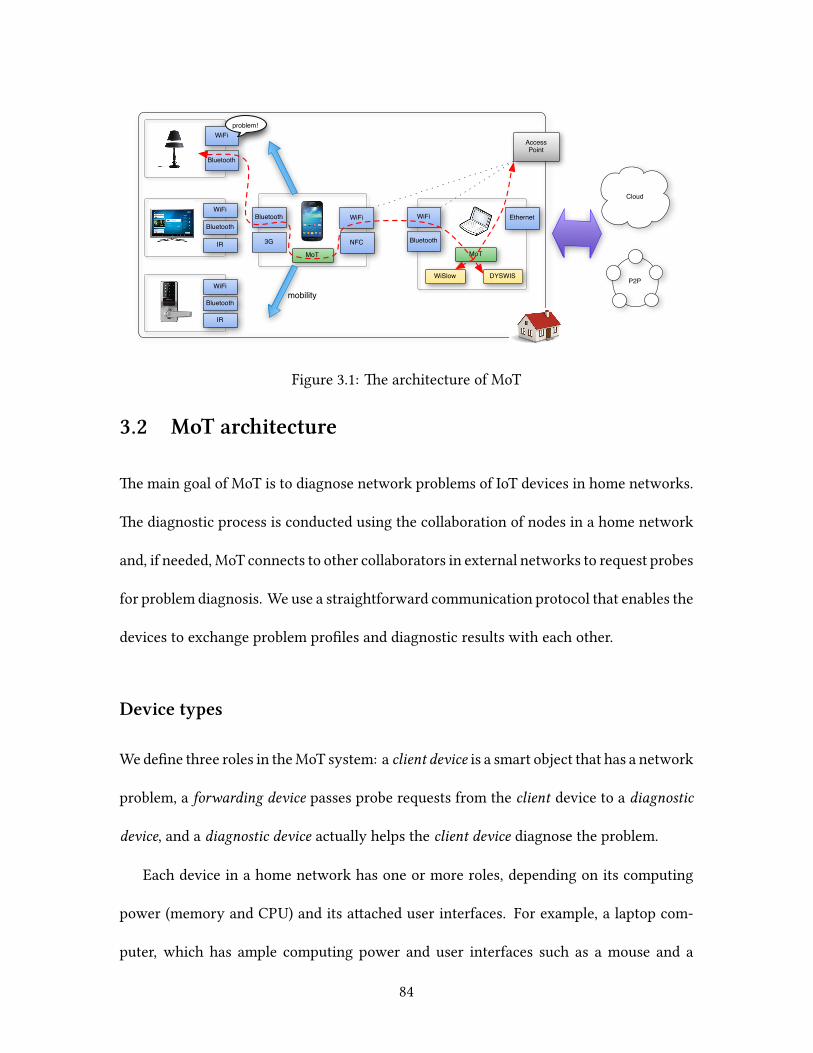
P2P
AccessPoint
Bluetooth WiFi
3G Bluetooth
WiFi
Bluetooth
WiFi
Bluetooth
WiFi
IR
WiSlow
Cloud
MoT
Bluetooth
WiFi
IR
MoT
DYSWIS
Ethernet
NFC
mobility
problem!
Figure 3.1: e architecture of MoT
3.2 MoT aritecture
e main goal of MoT is to diagnose network problems of IoT devices in home networks.
e diagnostic process is conducted using the collaboration of nodes in a home network
and, if needed, MoT connects to other collaborators in external networks to request probes
for problem diagnosis. We use a straightforward communication protocol that enables the
devices to exchange problem profiles and diagnostic results with each other.
Device types
Wedefine three roles in theMoT system: a client device is a smart object that has a network
problem, a forwarding device passes probe requests from the client device to a diagnostic
device, and a diagnostic device actually helps the client device diagnose the problem.
Each device in a home network has one or more roles, depending on its computing
power (memory and CPU) and its aached user interfaces. For example, a laptop com-
puter, which has ample computing power and user interfaces such as a mouse and a
84
screen, will be a diagnostic device because it can run diagnostic soware. e laptop may
also be a client device since it can request a diagnosis from other devices when it has a
network problem. Most other devices have roles as both client devices and forwarding
devices. e forwarding is necessary when a client device is not physically close enough
to the diagnostic device to communicate via Bluetooth, NFC, Wi-Fi direct or ZigBee.
Device registration
Each device first uses a service discovery technology (e.g., Bonjour) to discover a directory
server and registers its aributes with the server when they are connected to the network.
ese aributes include which network interfaces it has (e.g., Wi-Fi, Bluetooth, ZigBee,
or 3G/LTE), whether it can be mobile (e.g., smartphones and tablets), and whether it has
a capability to run diagnostic soware. A diagnostic device, which is usually a desktop
or laptop, runs a MoT server that maintains a device directory based on these profiles
and uses this when it diagnoses a problem. For example, if a cellular network is required
to diagnose a particular problem, it first looks up which devices can connect to a cellular
network (e.g., smartphones), and if such a device is currently reachable, it sends the probe
request to the device via intermediate network available (e.g., Wi-Fi or Bluetooth). We
describe this scenario in Section 3.3.
Problem description
When a device detects a network problem, it first creates a problem description that con-
tains failure symptoms (e.g., it cannot connect to the wireless access point (AP), or the
85
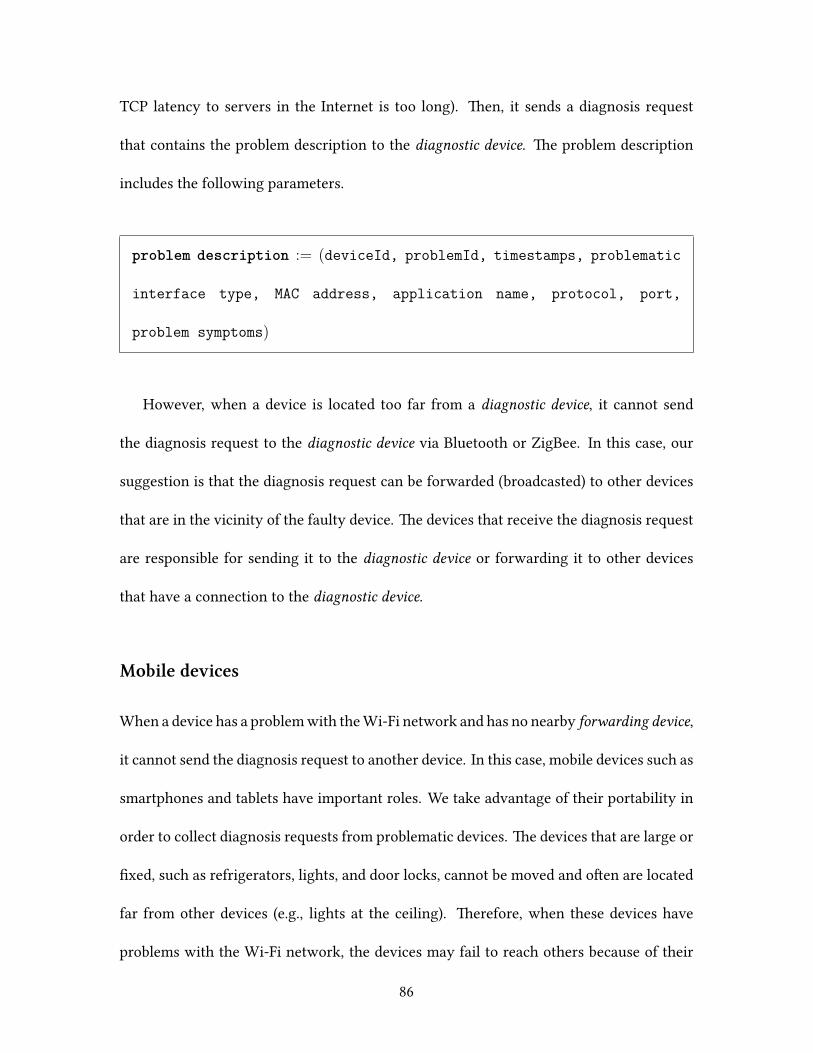
TCP latency to servers in the Internet is too long). en, it sends a diagnosis request
that contains the problem description to the diagnostic device. e problem description
includes the following parameters.
problem description := (deviceId, problemId, timestamps, problematic
interface type, MAC address, application name, protocol, port,
problem symptoms)
However, when a device is located too far from a diagnostic device, it cannot send
the diagnosis request to the diagnostic device via Bluetooth or ZigBee. In this case, our
suggestion is that the diagnosis request can be forwarded (broadcasted) to other devices
that are in the vicinity of the faulty device. e devices that receive the diagnosis request
are responsible for sending it to the diagnostic device or forwarding it to other devices
that have a connection to the diagnostic device.
Mobile devices
When a device has a problemwith theWi-Fi network and has no nearby forwarding device,
it cannot send the diagnosis request to another device. In this case, mobile devices such as
smartphones and tablets have important roles. We take advantage of their portability in
order to collect diagnosis requests from problematic devices. e devices that are large or
fixed, such as refrigerators, lights, and door locks, cannot be moved and oen are located
far from other devices (e.g., lights at the ceiling). erefore, when these devices have
problems with the Wi-Fi network, the devices may fail to reach others because of their
86
limited communication range, even if they have active communication interfaces other
than Wi-Fi. In this case, a mobile device can be a forwarding device or a diagnostic device.
A user carries the mobile device close to the problematic device and pairs via Bluetooth¹.
en, the problematic device notices that a forwarding (or diagnostic) device, which is
portable, is nearby and sends it the diagnosis request.
Diagnosis
e diagnostic processes are driven by predefined diagnostic rules. We adopt the rule
system from DYSWIS, so the rules can be crowdsourced and updated via a central rule
repository server. e basic rule starts with a check of whether the same problem has
been reported by other devices. If there has been no report of the problem, we aempt to
communicate with other devices to determine whether those are reachable without any
network problems. If it turns out that the same problem occurs for multiple devices in the
network, we infer that the problem is caused by the home network infrastructure (e.g., an
AP). In this case, we run other diagnostic soware such as DYSWIS and WiSlow to check
whether DNS, DHCP, TCP/UDP, and Wi-Fi are functioning properly. If other devices
do not observe the problem, then MoT interacts with the problematic device again via
an alternative communication interface and requests that the probe modules indicated
by the diagnostic rule be executed. We define a simple message syntax for this request.
e message contains the name of the probing module that should be executed and the
parameters that should be passed to the module. e return value will be sent back in a
similar format. As an example, JSON-format messages are illustrated below.
¹Currently, the Bluetooth paring process is done manually in our prototype.
87
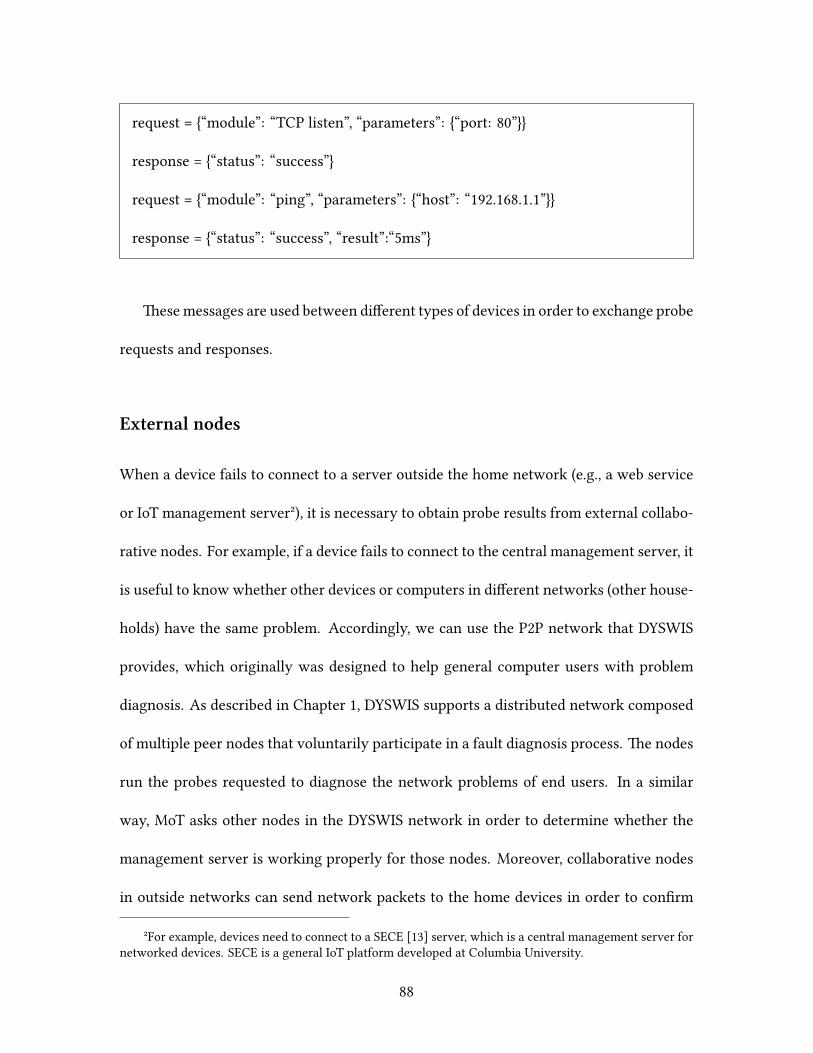
request = {“module”: “TCP listen”, “parameters”: {“port: 80”}}
response = {“status”: “success”}
request = {“module”: “ping”, “parameters”: {“host”: “192.168.1.1”}}
response = {“status”: “success”, “result”:“5ms”}
esemessages are used between different types of devices in order to exchange probe
requests and responses.
External nodes
When a device fails to connect to a server outside the home network (e.g., a web service
or IoT management server²), it is necessary to obtain probe results from external collabo-
rative nodes. For example, if a device fails to connect to the central management server, it
is useful to know whether other devices or computers in different networks (other house-
holds) have the same problem. Accordingly, we can use the P2P network that DYSWIS
provides, which originally was designed to help general computer users with problem
diagnosis. As described in Chapter 1, DYSWIS supports a distributed network composed
of multiple peer nodes that voluntarily participate in a fault diagnosis process. e nodes
run the probes requested to diagnose the network problems of end users. In a similar
way, MoT asks other nodes in the DYSWIS network in order to determine whether the
management server is working properly for those nodes. Moreover, collaborative nodes
in outside networks can send network packets to the home devices in order to confirm
²For example, devices need to connect to a SECE [13] server, which is a central management server fornetworked devices. SECE is a general IoT platform developed at Columbia University.
88
that incoming packets are received correctly.
However, a user may well be concerned about the privacy of using P2P networks, be-
cause information on the problem is revealed to other users when probes are requested.
If a user prefers a private method to diagnose the problem, the alternative method that
we suggest is the use of virtual instances in public clouds. Since public clouds now offer
instances in multiple geographical locations (e.g., Amazon EC2 offers instances in 16 ge-
ographic regions around the world), it is even possible to run probe processes in multiple
different networks without the help of a P2P network or a distributed shared network
such as PlanetLab [41]. Figure 3.1 illustrates the collaboration of cloud instances to diag-
nose home network devices. When a suspicious network behavior is observed, we launch
instances from a prepared image that contains probing modules to assist in the problem
diagnosis. e instances can be operated by a trustworthy third party, or users can run
their own isolated instances using their accounts on the cloud service providers.
3.3 Diagnosis scenarios
In this section, we describe several sample scenarios of the problem diagnosis process
using MoT.
Device diagnostics using history
Suppose that the bandwidth of a device is capped by a firewall at an AP for security rea-
sons. Because of this, the device has difficulty connecting to the network and sends a
diagnosis request to a nearby laptop via Bluetooth. en, the laptop starts the diagnos-
89
tic process by sending probe requests to other devices to determine whether those have
the same problem. en, MoT compares the problem description received from the prob-
lematic device with probe results received from other devices to identify the cause of the
problem. In this case, since other devices observe no network problem, MoT can infer that
the AP is functioning correctly, but only this device suffers from the bandwidth problem.
If the past log of the bandwidth measured on the device showed no problem consistently,
we can infer that a configuration at the AP might be the cause of the problem.
Device diagnostics using active probing
Suppose that a device suffers from performance degradation due to severe Wi-Fi interfer-
ence. e Wi-Fi interference can be caused by channel contention or nearby non-Wi-Fi
devices [44] as discussed in Chapter 2. In this case, the problematic device may even
fail to report the problem to a diagnostic node. erefore, our approach is that a mobile
device with a forwarding capability (e.g., smartphone) collects the problem description
from the problematic device using an alternative communication protocol such as Blue-
tooth and then forwards the message to the diagnostic node when the nodes move into
areas where the Wi-Fi network is accessible with no problem. en, the diagnostic node
runs specialized diagnostic soware such as WiSlow to detect the root cause of the Wi-Fi
interference.
90
Smartphone diagnostics
Another example is the diagnosis of a problem with a smartphone. Suppose that a smart-
phone application has a network problem but the source of the problem is not known.
For example, many Android applications use push notifications to send network pack-
ets to mobile devices. To test whether these notifications work correctly, the diagnos-
tic application on a smartphone sends probe requests to a laptop via Bluetooth or any
other short-range communication methods available. e laptop diagnoses the problem
using predefined diagnostic rules. ese diagnostic rules entail further probes into the
smartphone via Bluetooth to proceed with the diagnosis. We tested this scenario with an
Android application that we implemented (Section 3.4 and 3.5).
Computer diagnostics
Another possible scenario is the reverse of the previous scenario. A laptop computer has
a network problem, and thus it cannot contact external nodes in other networks. For
example, suppose that an ISP has a temporary outage and its customers have no Internet
connection. In this case, the laptop becomes completely isolated and there are not many
methods to diagnose the causes. With MoT, the laptop first detects that there is a device
(smartphone) connected to a cellular network. en, the laptop sends a diagnosis request
to the smartphone which connects to the Internet via the cellular network and diagnoses
the problem. Although the cellular and Wi-Fi network use different ISPs and network
paths, the cellular network can still assist the diagnosis. For example, the smartphone
can obtain real-time service interruption records from the websites that maintain the list
91
of services that are down³. Moreover, it can send probing requests to external nodes that
are connected to the same ISP to ascertain what is actually happening in the Internet and
the service provider network.
3.4 Implementation
As a proof of concept, we implemented and tested a prototype of a network troubleshoot-
ing tool based on the MoT platform. is implementation includes two applications, one
for Android devices and the other for computers. e applications communicate via Blue-
tooth in this example. e algorithm described in Figure 3.3 diagnoses the “Smartphone
diagnostics” scenario described in Section 3.3.
e challenges to implementation are twofold. First, we need to create a framework
that is generally applicable to heterogeneous devices. erefore, it is necessary to have
a platform-independent interface. Second, it should be possible to change the diagnostic
strategies easily without rewriting soware, since the diagnostic logic may be updated
frequently. To achieve these goals, we divide the system into two layers (Figure 3.2): the
core layer, which is rarely updated, and the logic layer, which can be updated flexibly.
ese two layers communicate with each other using the probe messages.
We aggregate platform-dependent modules and place these in the core layer to avoid
rebuilding the soware when diagnostic algorithms are updated. As a result, probe mod-
ules (e.g., ping, traceroute, and the TCP connection checker) and network communi-
cation modules (e.g., for Bluetooth and TCP) are included in the core layer since these
³For example, hp://www.downdetector.com
92
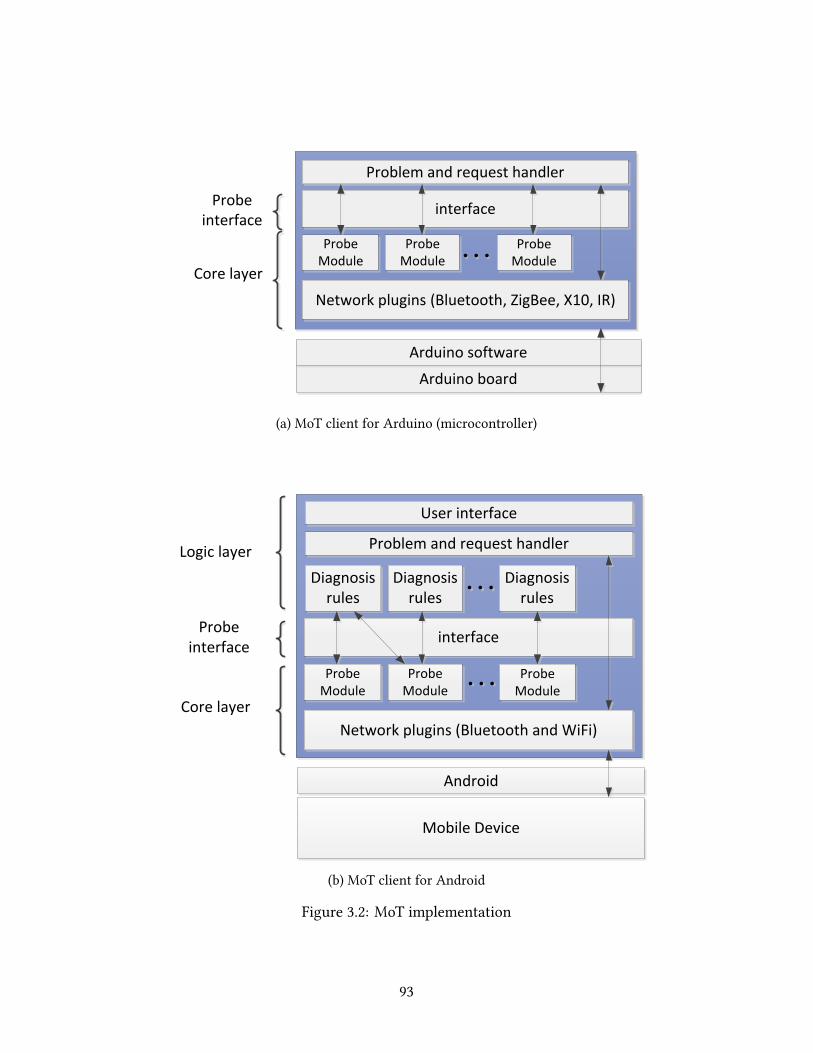
Arduino board
Network plugins (Bluetooth, ZigBee, X10, IR)
interface
ProbeModule
ProbeModule
Core layer
Probe interface
ProbeModule
Arduino software
Problem and request handler
(a) MoT client for Arduino (microcontroller)
Mobile Device
Android
Network plugins (Bluetooth and WiFi)
interface
Diagnosis rules
Problem and request handler
ProbeModule
ProbeModule
Diagnosis rules
Diagnosis rules
Logic layer
Core layer
Probe interface
ProbeModule
User interface
(b) MoT client for Android
Figure 3.2: MoT implementation
93
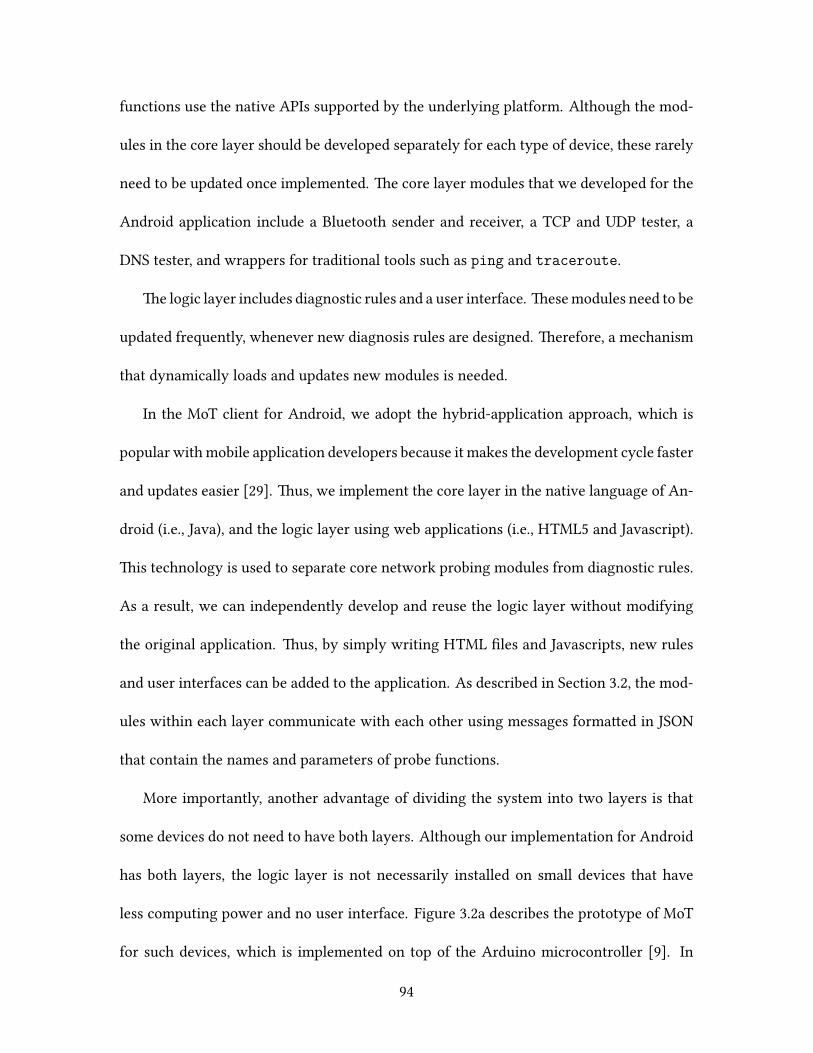
functions use the native APIs supported by the underlying platform. Although the mod-
ules in the core layer should be developed separately for each type of device, these rarely
need to be updated once implemented. e core layer modules that we developed for the
Android application include a Bluetooth sender and receiver, a TCP and UDP tester, a
DNS tester, and wrappers for traditional tools such as ping and traceroute.
e logic layer includes diagnostic rules and a user interface. esemodules need to be
updated frequently, whenever new diagnosis rules are designed. erefore, a mechanism
that dynamically loads and updates new modules is needed.
In the MoT client for Android, we adopt the hybrid-application approach, which is
popular withmobile application developers because it makes the development cycle faster
and updates easier [29]. us, we implement the core layer in the native language of An-
droid (i.e., Java), and the logic layer using web applications (i.e., HTML5 and Javascript).
is technology is used to separate core network probing modules from diagnostic rules.
As a result, we can independently develop and reuse the logic layer without modifying
the original application. us, by simply writing HTML files and Javascripts, new rules
and user interfaces can be added to the application. As described in Section 3.2, the mod-
ules within each layer communicate with each other using messages formaed in JSON
that contain the names and parameters of probe functions.
More importantly, another advantage of dividing the system into two layers is that
some devices do not need to have both layers. Although our implementation for Android
has both layers, the logic layer is not necessarily installed on small devices that have
less computing power and no user interface. Figure 3.2a describes the prototype of MoT
for such devices, which is implemented on top of the Arduino microcontroller [9]. In
94
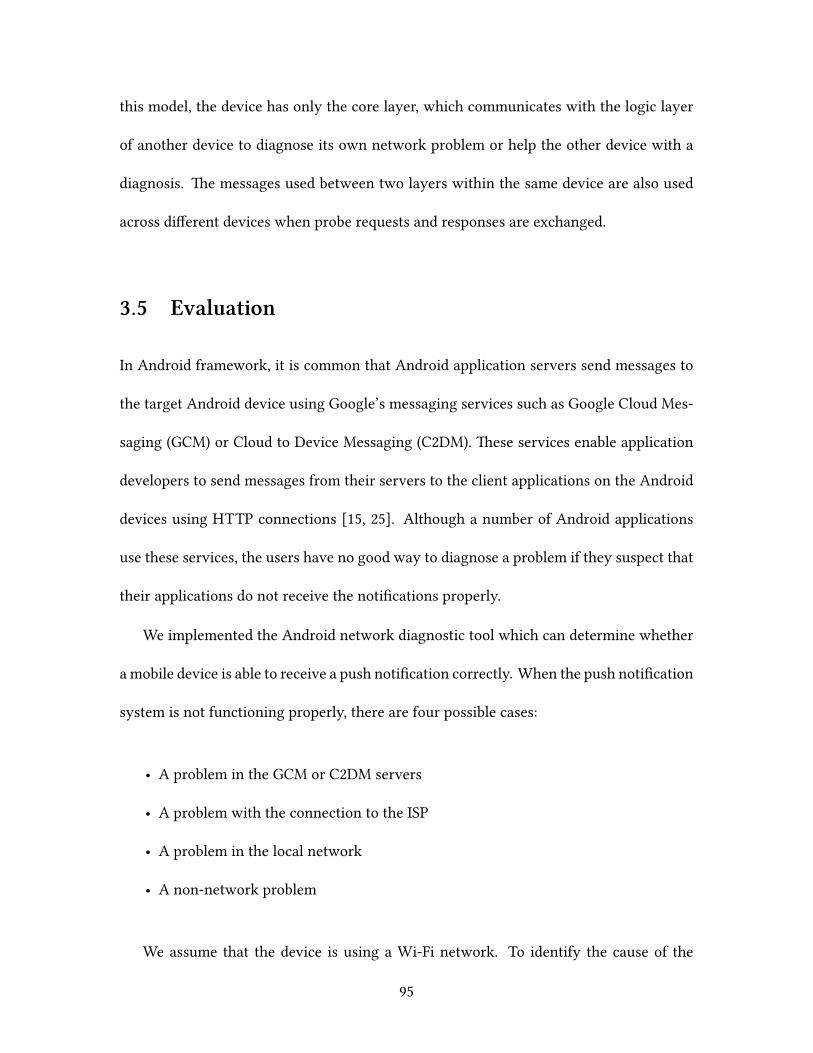
this model, the device has only the core layer, which communicates with the logic layer
of another device to diagnose its own network problem or help the other device with a
diagnosis. e messages used between two layers within the same device are also used
across different devices when probe requests and responses are exchanged.
3.5 Evaluation
In Android framework, it is common that Android application servers send messages to
the target Android device using Google’s messaging services such as Google Cloud Mes-
saging (GCM) or Cloud to Device Messaging (C2DM). ese services enable application
developers to send messages from their servers to the client applications on the Android
devices using HTTP connections [15, 25]. Although a number of Android applications
use these services, the users have no good way to diagnose a problem if they suspect that
their applications do not receive the notifications properly.
We implemented the Android network diagnostic tool which can determine whether
a mobile device is able to receive a push notification correctly. When the push notification
system is not functioning properly, there are four possible cases:
• A problem in the GCM or C2DM servers
• A problem with the connection to the ISP
• A problem in the local network
• A non-network problem
We assume that the device is using a Wi-Fi network. To identify the cause of the
95
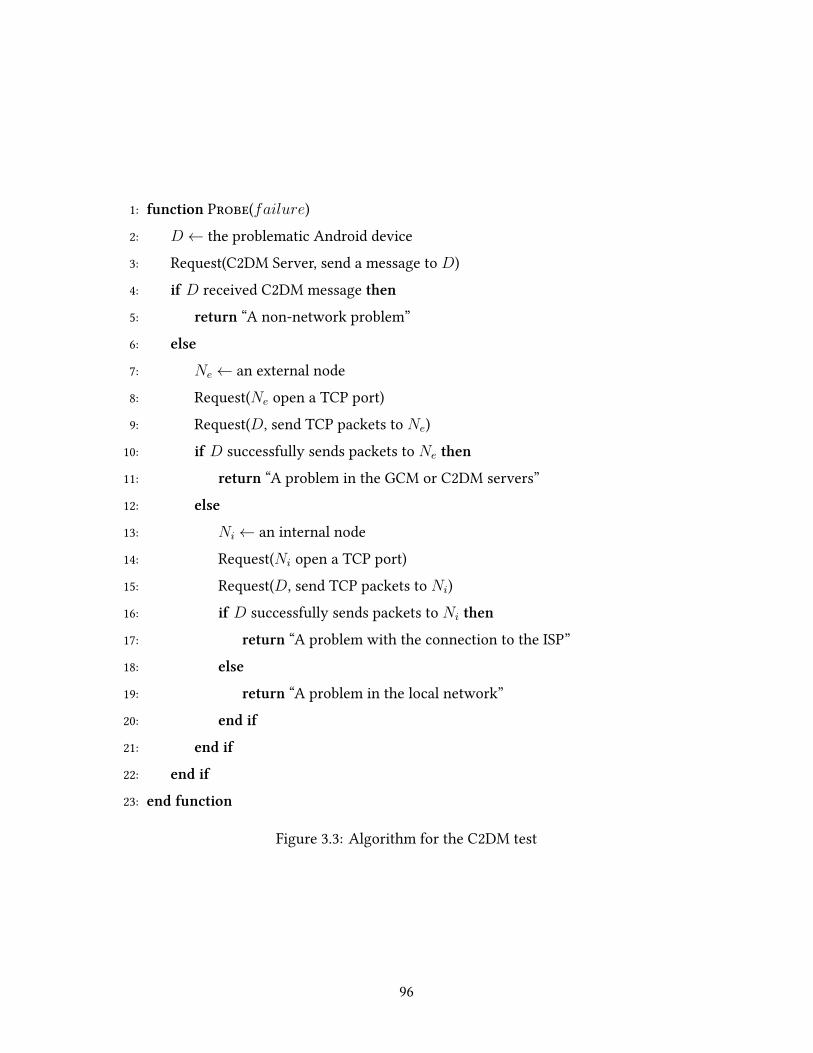
1: function P(failure)2: D← the problematic Android device3: Request(C2DM Server, send a message to D)4: if D received C2DM message then5: return “A non-network problem”6: else
7: Ne← an external node8: Request(Ne open a TCP port)9: Request(D, send TCP packets to Ne)
10: if D successfully sends packets to Ne then
11: return “A problem in the GCM or C2DM servers”12: else
13: Ni← an internal node14: Request(Ni open a TCP port)15: Request(D, send TCP packets to Ni)16: if D successfully sends packets to Ni then
17: return “A problem with the connection to the ISP”18: else
19: return “A problem in the local network”20: end if
21: end if
22: end if
23: end function
Figure 3.3: Algorithm for the C2DM test
96
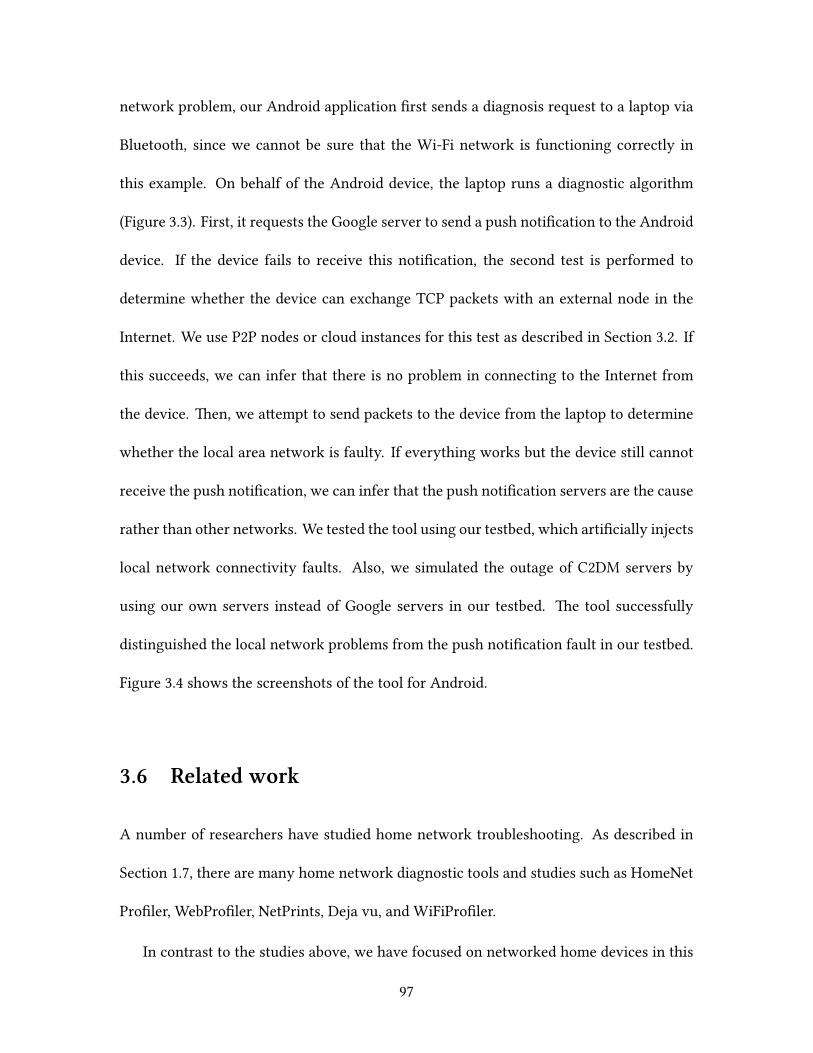
network problem, our Android application first sends a diagnosis request to a laptop via
Bluetooth, since we cannot be sure that the Wi-Fi network is functioning correctly in
this example. On behalf of the Android device, the laptop runs a diagnostic algorithm
(Figure 3.3). First, it requests the Google server to send a push notification to the Android
device. If the device fails to receive this notification, the second test is performed to
determine whether the device can exchange TCP packets with an external node in the
Internet. We use P2P nodes or cloud instances for this test as described in Section 3.2. If
this succeeds, we can infer that there is no problem in connecting to the Internet from
the device. en, we aempt to send packets to the device from the laptop to determine
whether the local area network is faulty. If everything works but the device still cannot
receive the push notification, we can infer that the push notification servers are the cause
rather than other networks. We tested the tool using our testbed, which artificially injects
local network connectivity faults. Also, we simulated the outage of C2DM servers by
using our own servers instead of Google servers in our testbed. e tool successfully
distinguished the local network problems from the push notification fault in our testbed.
Figure 3.4 shows the screenshots of the tool for Android.
3.6 Related work
A number of researchers have studied home network troubleshooting. As described in
Section 1.7, there are many home network diagnostic tools and studies such as HomeNet
Profiler, WebProfiler, NetPrints, Deja vu, and WiFiProfiler.
In contrast to the studies above, we have focused on networked home devices in this
97
(a) A GUI of test modules (b) Android C2DM test
Figure 3.4: An MoT application for Android devices
chapter. Since these devices are different from general computers in terms of user inter-
face and computing power, existing studies are unlikely to be applicable for these devices.
We adopt the rule system of DYSWIS and its collaborative method, and suggest additional
mechanisms to support home devices. Wustner et al. [55] suggested a similar idea as MoT
in terms of collaboration of home network devices for troubleshooting network problems.
When a user suffers from the low performance of a network, the authors suggested to cor-
relate the different recorded metrics such as RTT, jier, throughput, and packet retrans-
mission. ey determine which metric is related to the poor performance. Our approach
shares this idea of cooperation between devices; however, we use real-time probing with
predefined diagnostic rules instead of correlating metrics. us, our approach does not
require devices to record network states. Furthermore, we suggest practical mechanisms
98
such as discovering, forwarding, and probing that support the collaboration of devices
effectively.
3.7 Conclusion
We proposed a network troubleshooting system, MoT, which supports the collaboration
of home devices (smart objects) and end-user devices such as laptop computers and smart-
phones. We take advantage that recent devices have multiple communication interfaces.
erefore, when a device has a problem with one interface, it can send a probe request
to other devices using an alternative interface. Moreover, we focused on a mobile device
that is able to move physically close to other problematic devices and collect problem pro-
files. Finally, the system adopts collaborative mechanisms to diagnose the root cause of a
network problem. It can use cooperation from internal nodes or send requests to external
P2P nodes or cloud instances. We demonstrated the feasibility of this approach by im-
plementing an Android application and an algorithm that diagnoses the push notification
failure.
99

Conclusion
is thesis presents three studies focusing on troubleshooting network failures for end
users. ey include new architecture and algorithms that identify the root causes of fail-
ures related to Internet connectivity and poor network performance.
DYSWIS is a framework that supports diagnostic applications for complex network
problems using collaboration of end-user machines. We suggested a detailed mechanism
to discover and communicate with cooperative peers, built a framework that enables ad-
ministrators and developers to contribute to the expansion of the diagnostic system, and
finally implemented diagnostic tools based on the cooperative probing algorithms and
rules. We also demonstrated the ease with which participants could add new rules and
modules on top of the framework in order to diagnose common network failures. In our
experiments, DYSWIS successfully identifies the root cause in seven out of eleven scenar-
ios.
In addition, this thesis presents WiSlow, a Wi-Fi performance troubleshooting appli-
cation specialized to detect non-Wi-Fi interference. WiSlow distinguishes 802.11 chan-
nel contention from non-Wi-Fi interference and identifies the type of interfering devices
present. It is designed to exploit user-level probing only, enabling a soware-only ap-
proach. WiSlow contains novel diagnostic methods and algorithms which rely on user-
101

accessible packet information. e accuracy of detecting interference sources using WiS-
low exceeds 90% when the sources are close to a Wi-Fi device.
Furthermore, inspired by lessons learned from the above studies, we expanded the
collaborative approach to the IoT environment and proposed a network diagnosis plat-
form for home devices. is platform takes advantage of the built-in features of new
devices such as multiple communication interfaces. When a device has a problem with
an interface, it can send a probe request to other devices using an alternative communi-
cation interface. As a result, the proposed system is able to use cooperation between both
internal devices and remote machines.
e studies presented in this thesis aempt to solve problems in different areas, but
share one key concept — machines are able to help each other to diagnose complex net-
work issues. We have designed and built diagnostic tools based on this approach and
performed various experiments to show the idea is feasible.
Today, both network infrastructure and consumer products are still evolving rapidly.
In the near future, since almost every product will be connected to Internet, technologies
that are able to resolve network issues quickly and correctly will become more important.
I believe the concepts, system designs, and discussions presented in this thesis contribute
to upgrading the Internet by taking one step forward and towards trouble-free networks
for end users.
102
Bibliography
[1] Sharad Agarwal, Nikitas Liogkas, Prashanth Mohan, and Venkata N. Padmanab-han. “WebProfiler: cooperative diagnosis of Web failures.” In: Proc. of COMSNETS.Bangalore, India, Jan. 2010.
[2] Bhavish Aggarwal, Ranjita Bhagwan, Lorenzo De Carli, Venkat Padmanabhan,and Krishna Puaswamy. “Deja vu: fingerprinting network problems.” In: Proc. ofCoNEXT ’11. Tokyo, Japan, Dec. 2011.
[3] Bhavish Aggarwal, Ranjita Bhagwan, Tathagata Das, Siddharth Eswaran, VenkataN. Padmanabhan, and Geoffrey M. Voelker. “NetPrints: diagnosing home networkmisconfigurations using shared knowledge.” In: Proc. of NSDI. Berkeley, CA, USA,Apr. 2009.
[4] AirMaestro. http://www.bandspeed.com/products/products.php. [Online;accessed May 2013].
[5] AirSleuth. http://nutsaboutnets.com/airsleuth- spectrum- analyzer/.[Online; accessed May 2013].
[6] Adel Ali, LA Latiff, andNorsheila Fisal. “GPS-free indoor location tracking inmobilead hoc network (MANET) using RSSI.” In: Proc. of IEEE RFM. Selangor, Malaysia,Oct. 2004.
[7] A. Amirante, S. P. Romano, K. H. Kim, and H. Schulzrinne. “Online non-intrusivediagnosis of one-way RTP faults in VoIP networks using cooperation.” In: Proc. ofIPTComm ’10. Munich, Germany, Oct. 2010.
[8] Apple inc. Bonjour. hp://www.apple.com/support/bonjour/.
[9] Arduino. http://www.arduino.cc/. [Online; accessed November 2016].
[10] A. Baid, S. Mathur, I. Seskar, S. Paul, A. Das, and D. Raychaudhuri. “Spectrum MRI:Towards diagnosis of multi-radio interference in the unlicensed band.” In: Proc. ofIEEE WCNC. intana-Roo, Mexico, Mar. 2011.
103
[11] S. Biaz and Shaoen Wu. “Rate adaptation algorithms for IEEE 802.11 networks: Asurvey and comparison.” In: Proc. of IEEE ISCC. Marrakech, Morocco, July 2008.
[12] Andreas Binzenhöfer, Kurt Tutschku, Björn auf dem Graben, Markus Fiedler, andPatrik Arlos. “A P2P-Based Framework for Distributed Network Management.” In:Proc. of EuroNGI Workshop. Villa Vigoni, Italy, July 2005.
[13] O. Boyaci, V. Beltran, and Henning Schulzrinne. “Bridging communications andthe physical world: Sense Everything, Control Everything.” In: Proc. of GLOBECOMWorkshops ’10. Florida, USA, Dec. 2010.
[14] E. Bozdag, A. Mesbah, and A. van Deursen. “A Comparison of Push and Pull Tech-niques for AJAX.” In: Proc. of WSE 2007. Paris, France, Oct. 2007.
[15] C2DM. https://developers.google.com/android/c2dm/. [Online; accessedSep 2013].
[16] Ranveer Chandra, Venkata N. Padmanabhan, and Ming Zhang. “WiFiProfiler: Co-operative diagnosis in wireless LANs.” In: Proc. of MobiSys. Uppsala, Sweden, June2006.
[17] David R. Choffnes, Fabian E. Bustamante, and Zihui Ge. “Crowdsourcing service-level network event monitoring.” In: Proceedings of ACM SIGCOMM. New Delhi,India, Sept. 2010.
[18] Cisco. 20 Myths of Wi-Fi Interference. White Paper, http : / / goo . gl / E2Qmib.[Online; accessed April 2017].
[19] Heng Cui and Ernst Biersack. “Trouble shooting interactiveWeb sessions in a homeenvironment.” In: Proc. of HomeNets. Toronto, Ontario, Canada, Aug. 2011.
[20] L. DiCioccio, R. Teixeira, and C. Rosenberg. “Measuring home networks with home-net profiler.” In: Proc. of PAM. Hong Kong, China, Mar. 2013.
[21] Digital Enhanced Cordless Telecommunications. http : / / www . etsi . org /technologies-clusters/technologies/dect. [Online; accessed April 2017].
[22] Marcel Dischinger, Massimiliano Marcon, Saikat Guha, P. Krishna Gummadi, RatulMahajan, and Stefan Saroiu. “Glasnost: Enabling End Users to Detect Traffic Dif-ferentiation.” In: Proceedings of NSDI. San Jose, CA, USA, Apr. 2010.
[23] Changyu Dong and Naranker Dulay. “Argumentation-based fault diagnosis forhome networks.” In: Proc. of HomeNets. Toronto, Ontario, Canada, Aug. 2011.
104
[24] Philip Eardley, Al Morton, Marcelo Bagnulo, Trevor Burbridge, Paul Aitken, andAamerAkhter.A Framework for Large-ScaleMeasurement of Broadband Performance(LMAP). RFC 7594. Sept. 2015. : 10.17487/rfc7594. : https://rfc-editor.org/rfc/rfc7594.txt.
[25] GCM. http : / / developer . android . com / google / gcm/. [Online; accessedNovember 2016].
[26] Shyamnath Gollakota, Fadel Adib, Dina Katabi, and Srinivasan Seshan. “Clearingthe RF smog: making 802.11n robust to cross-technology interference.” In: Proc. ofACM SIGCOMM. Toronto, Ontario, Canada, Aug. 2011.
[27] Jeffrey Hightower, Roy Want, and Gaetano Borriello. “SpotON: An indoor 3D loca-tion sensing technology based on RF signal strength.” In: Technical Report, UW CSE00-02-02, University of Washington, Seale, WA (2000).
[28] HomeNet Manager. http://www.homenetmanager.com/. [Online; accessed Dec2013].
[29] Hybrid Apps. http://www.nngroup.com/articles/mobile-native-apps/.[Online; accessed November 2016].
[30] A. Kamerman and N. Erkocevic. “Microwave oven interference on wireless LANsoperating in the 2.4 GHz ISM band.” In: Proc. of PIMRC. Helsinki, Finland, Sept. 1997.
[31] Partha Kanuparthy, Constantine Dovrolis, Konstantina Papagiannaki, SrinivasanSeshan, and Peter Steenkiste. “Can user-level probing detect and diagnose commonhome-WLAN pathologies.” In: Computer Communication Review 42.1 (2012), pp. 7–15.
[32] Kyung-Hwa Kim, Hyunwoo Nam, and Henning Schulzrinne. “WiSlow: A Wi-FiNetwork Performance Troubleshooting Tool for End Users.” In: Proc. of IEEE IN-FOCOM. Toronto, Canada, Apr. 2014.
[33] Kyung-Hwa Kim, Hyunwoo Nam, Vishal Singh, Daniel Song, and HenningSchulzrinne. “DYSWIS: Crowdsourcing a Home Network Diagnosis.” In: Proc. ofICCCN. Shanghai, China, Aug. 2014.
[34] Kyung-Hwa Kim, Hyunwoo Nam, Jin-Hyung Park, and Henning Schulzrinne.“MoT: A Collaborative Network Troubleshooting Platform for the Internet ofings.” In: Proc. of IEEE WCNC. Istanbul, Turkey, Apr. 2014.
[35] Ratul Mahajan, Neil Spring, David Wetherall, and omas Anderson. “User-levelinternet path diagnosis.” In: Proceedings of ACM SOSP. New York, NY, USA, Oct.2003.
105
[36] Frank J Massey Jr. “e Kolmogorov-Smirnov test for goodness of fit.” In: Journalof the American statistical Association 46.253 (1951), pp. 68–78.
[37] Hyunwoo Nam, Bong Ho Kim, Doru Calin, and Henning Schulzrinne. “MobileVideo is Inefficient: A Traffic Analysis.” In: Columbia Technical Report cucs-018-13.June 2013.
[38] Network Magic Pro. http://tinyurl.com/n6hh7ka. [Online; accessed Dec 2013].
[39] Network diagnostics in Windows 7. https : / / technet . microsoft . com / en -us/library/ff625276.aspx. [Online; accessed November 2016].
[40] OSGi Alliance. OSGi. hp://www.osgi.org/Main/HomePage.
[41] PlanetLab. https://www.planet-lab.org/ . [Online; accessed Jan 2014].
[42] B Pourebrahimi, K Bertels, and S Vassiliadis. “A survey of peer-to-peer networks.”In: Proc. of ProRisc. Veldhoven, e Netherlands, Nov. 2005.
[43] Radiotap. http://www.radiotap.org/. [Online; accessed May 2013].
[44] Shravan Rayanchu, Ashish Patro, and Suman Banerjee. “Airshark: Detecting non-WiFi RF Devices Using Commodity WiFi Hardware.” In: Proc. of ACM IMC. Berlin,Germany, Nov. 2011.
[45] Shravan Rayanchu, Ashish Patro, and Suman Banerjee. “CatchingWhales andMin-nows Using WiFiNet: Deconstructing non-WiFi Interference Using WiFi Hard-ware.” In: Proc. of USENIX NSDI. San Jose, CA, USA, Apr. 2012.
[46] Mario A. Sánchez, John S. Oo, Zachary S. Bischof, David R. Choffnes, Fabián E.Bustamante, Balachander Krishnamurthy, and Walter Willinger. “Dasu: PushingExperiments to the Internet’s Edge.” In: Proc. of NSDI. Lombard, IL, Apr. 2013.
[47] Srikanth Sundaresan, Nick Feamster, and Renata Teixeira. “Home Network or Ac-cess Link? Locating Last-mile Downstream roughput Bolenecks.” In: Proc. ofPAM. Heraklion, Greece, Mar. 2016.
[48] Srikanth Sundaresan, Yan Grunenberger, Nick Feamster, Dina Papagiannaki, DaveLevin, and Renata Teixeira. “WTF? Locating Performance Problems in Home Net-works.” In: SCS Technical Report GT-CS-13-03. June 2013.
[49] Ten myths of Wi-Fi interference. http://searchmobilecomputing.techtarget.com/feature/Ten-myths-of-Wi-Fi-interference. [Online; accessed Novem-ber 2016].
106
[50] Guido Urdaneta, Guillaume Pierre, andMaarten Van Steen. “A survey of DHT secu-rity techniques.” In: ACM Comput. Surv. 43.2 (Feb. 2011), 8:1–8:49. : 0360-0300.: 10.1145/1883612.1883615.
[51] Angelos Vlavianos, Lap Kong Law, Ioannis Broustis, Srikanth V. Krishnamurthy,and Michalis Faloutsos. “Assessing link quality in IEEE 802.11 Wireless Networks:Which is the right metric?” In: Proc. of PIMRC. Cannes, France, Sept. 2008.
[52] WLAN packet capture. http://wiki.wireshark.org/CaptureSetup/WLAN.[Online; accessed May 2013].
[53] Wi-Spy. http://www.metageek.net/. [Online; accessed November 2016].
[54] Windows Native WiFi API. https://msdn.microsoft.com/en-us/library/windows/desktop/dd439487(v=vs.85).aspx. [Online; accessed April 2017].
[55] Stéphane Wustner, Diana Joumbla, Renata Teixeira, and Jaideep Chandrashekar.“Automated home network troubleshooting with device collaboration.” In: Proc. ofCoNEXT Student ’12. Nice, France, Dec. 2012.
[56] G.V. Zaruba, M. Huber, F.A. Kamangar, and I. Chlamtac. “Indoor location trackingusing RSSI readings from a single Wi-Fi access point.” In: Wireless Networks 13.2(Apr. 2007), pp. 221–235. : 1022-0038.
[57] Ying Zhang, Zhuoqing Morley Mao, and Ming Zhang. “Effective Diagnosis of Rout-ingDisruptions fromEnd Systems.” In: Proceedings of NSDI. San Francisco, CA, USA,Apr. 2008.
107
Related Documents