IEEE JOURNAL OF EMERGING AND SELECTED TOPICS IN POWER ELECTRONICS, VOL. 2, NO. 4, DECEMBER 2014 893 Toward the Design of Control Algorithms for a Photovoltaic Equalizer: Detecting Shadows Through Direct Current Sampling Luiz Fernando Lavado Villa, Bertrand Raison, Member, IEEE, and Jean-Christophe Crebier Abstract— The photovoltaic (PV) equalizer is a promising response to the problems of partial shading in PV modules. This paper studies its use to detect the presence of the shadow and to estimate its shape. It proposes a shadow model suited for describing the shadow and its changes over time as well as a method for estimating the estate of the shadow. This method is then studied through a theoretical approach, followed by simulations, and all results are validated through measurements. Index Terms— Embedded systems and photovoltaic (PV) mismatch, partial shading, power electronics, PV plants. I. I NTRODUCTION P HOTOVOLTAIC (PV) energy rates are among the most mature renewable energies currently available. However, two obstacles remain in the way of its massive deployment throughout the world: efficiency and shadows. Efficiency is the problem of how to make PV modules convert more light into electricity, while shadows is the problem of how to maximize their exposure to light once deployed. This paper focuses on their contributions in the latter. By filtering the light that shines over a PV module, shadows reduce its available current [1]. This effect is amplified when only part of the PV module is shaded, causing current differ- ences among cells connected in series, forming hot spots, and potentially damaging the PV module [2]. This can be mitigated by the use of bypass diodes, but these cause further problems. Bypass diodes do not solve the problem of uneven current production between the shaded and unshaded PV cells. Overall power production is hampered by the shaded cells, which limit the current of the unshaded ones [3]. Several researchers have studied ways to replace bypass diodes and balance the current production, leading to a wealth of data and solutions currently available in [4]. These solutions are called, in this paper, PV robustness enhancement systems or PRobES. There are two families of PRobES, series and parallel. Series PRobES are based on the idea of using several small power electronic converters to extract the power from a single Manuscript received January 31, 2014; revised May 21, 2014; accepted August 4, 2014. Date of publication August 27, 2014; date of current version October 29, 2014. Recommended for publication by Associate Editor Y.-F. Liu. The authors are with the Grenoble Electrical Engineering Laboratory, University of Grenoble, Grenoble 38031, France (e-mail: luizlavado@ gmail.com; [email protected]; jean-christophe.crebier@ g2elab.grenoble-inp.fr). Color versions of one or more of the figures in this paper are available online at http://ieeexplore.ieee.org. Digital Object Identifier 10.1109/JESTPE.2014.2352621 PV plant. Thus, each converter has a small area of cells and the effect of a local shadow will not propagate to other cell groups [5]. The main limitation of this approach is that smaller power electronics converters are prone to have a lower efficiency, which is their greatest challenge. Parallel PRobES are based on the idea of rerouting the ex- cess current from the unshaded cell groups, through the use of an inductor, onto the shaded cells. By doing so, the current production is evened out, and each cell group will be able to operate at its local maximum power [6]. The main limitation of these PRobES is their topology and the detection of the location of the shadow. A recent topological breakthrough, called PV equalizer, has partially solved the first problem. However, precise and swift detection of the shadow still remains a challenge. This paper seeks to address the issue of shadow detection by introducing the direct current (dc) sampling method. It consists of using the PV equalizer structure to acquire short current peaks from the PV cells. These peaks are then used to estimate the presence of a shadow. Although this paper focuses on the PV equalizer as a basis for its studies, the same approach can be easily adapted on other parallel PRobES. This paper is organized as follows. Section II describes the problem of intermittency in PV systems, the PRobES, and the PV equalizer in more detail. Section III explains the shadow model used in this paper and the dc sampling method. Section IV studies how this method can be used to determine the presence of the shadow under different conditions in theory, simulation, and practice. Section V discusses the results from this paper and proposes an interpretation of the peaks into shadow information. Section VI concludes with future work and possible applications of this paper. II. PV SYSTEMS AND I NTERMITTENCY PV systems are complex and composed of many parts with specific terminologies and characteristics. This section introduces them and describes the overall system intermittency problem currently faced by the scientific community. A. PV System Fundamentals The PV effect is a nonlinear dependency between current and voltage driven by the amount of light or irradiance shining over the PV module. The unit of irradiance is watts per square meter (W/m 2 ). This dependency can conveniently be expressed 2168-6777 © 2014 IEEE. Personal use is permitted, but republication/redistribution requires IEEE permission. See http://www.ieee.org/publications_standards/publications/rights/index.html for more information.

Welcome message from author
This document is posted to help you gain knowledge. Please leave a comment to let me know what you think about it! Share it to your friends and learn new things together.
Transcript

IEEE JOURNAL OF EMERGING AND SELECTED TOPICS IN POWER ELECTRONICS, VOL. 2, NO. 4, DECEMBER 2014 893
Toward the Design of Control Algorithms for aPhotovoltaic Equalizer: Detecting Shadows
Through Direct Current SamplingLuiz Fernando Lavado Villa, Bertrand Raison, Member, IEEE, and Jean-Christophe Crebier
Abstract— The photovoltaic (PV) equalizer is a promisingresponse to the problems of partial shading in PV modules. Thispaper studies its use to detect the presence of the shadow andto estimate its shape. It proposes a shadow model suited fordescribing the shadow and its changes over time as well as amethod for estimating the estate of the shadow. This methodis then studied through a theoretical approach, followed bysimulations, and all results are validated through measurements.
Index Terms— Embedded systems and photovoltaic (PV)mismatch, partial shading, power electronics, PV plants.
I. INTRODUCTION
PHOTOVOLTAIC (PV) energy rates are among the mostmature renewable energies currently available. However,
two obstacles remain in the way of its massive deploymentthroughout the world: efficiency and shadows. Efficiency is theproblem of how to make PV modules convert more light intoelectricity, while shadows is the problem of how to maximizetheir exposure to light once deployed. This paper focuses ontheir contributions in the latter.
By filtering the light that shines over a PV module, shadowsreduce its available current [1]. This effect is amplified whenonly part of the PV module is shaded, causing current differ-ences among cells connected in series, forming hot spots, andpotentially damaging the PV module [2]. This can be mitigatedby the use of bypass diodes, but these cause further problems.
Bypass diodes do not solve the problem of uneven currentproduction between the shaded and unshaded PV cells. Overallpower production is hampered by the shaded cells, whichlimit the current of the unshaded ones [3]. Several researchershave studied ways to replace bypass diodes and balance thecurrent production, leading to a wealth of data and solutionscurrently available in [4]. These solutions are called, in thispaper, PV robustness enhancement systems or PRobES.
There are two families of PRobES, series and parallel.Series PRobES are based on the idea of using several smallpower electronic converters to extract the power from a single
Manuscript received January 31, 2014; revised May 21, 2014; acceptedAugust 4, 2014. Date of publication August 27, 2014; date of currentversion October 29, 2014. Recommended for publication by Associate EditorY.-F. Liu.
The authors are with the Grenoble Electrical Engineering Laboratory,University of Grenoble, Grenoble 38031, France (e-mail: [email protected]; [email protected]; [email protected]).
Color versions of one or more of the figures in this paper are availableonline at http://ieeexplore.ieee.org.
Digital Object Identifier 10.1109/JESTPE.2014.2352621
PV plant. Thus, each converter has a small area of cellsand the effect of a local shadow will not propagate to othercell groups [5]. The main limitation of this approach is thatsmaller power electronics converters are prone to have a lowerefficiency, which is their greatest challenge.
Parallel PRobES are based on the idea of rerouting the ex-cess current from the unshaded cell groups, through the useof an inductor, onto the shaded cells. By doing so, the currentproduction is evened out, and each cell group will be able tooperate at its local maximum power [6]. The main limitationof these PRobES is their topology and the detection of thelocation of the shadow. A recent topological breakthrough,called PV equalizer, has partially solved the first problem.However, precise and swift detection of the shadow stillremains a challenge.
This paper seeks to address the issue of shadow detection byintroducing the direct current (dc) sampling method. It consistsof using the PV equalizer structure to acquire short currentpeaks from the PV cells. These peaks are then used to estimatethe presence of a shadow. Although this paper focuses on thePV equalizer as a basis for its studies, the same approach canbe easily adapted on other parallel PRobES.
This paper is organized as follows. Section II describesthe problem of intermittency in PV systems, the PRobES,and the PV equalizer in more detail. Section III explains theshadow model used in this paper and the dc sampling method.Section IV studies how this method can be used to determinethe presence of the shadow under different conditions intheory, simulation, and practice. Section V discusses the resultsfrom this paper and proposes an interpretation of the peaks intoshadow information. Section VI concludes with future workand possible applications of this paper.
II. PV SYSTEMS AND INTERMITTENCY
PV systems are complex and composed of many partswith specific terminologies and characteristics. This sectionintroduces them and describes the overall system intermittencyproblem currently faced by the scientific community.
A. PV System Fundamentals
The PV effect is a nonlinear dependency between currentand voltage driven by the amount of light or irradiance shiningover the PV module. The unit of irradiance is watts per squaremeter (W/m2). This dependency can conveniently be expressed
2168-6777 © 2014 IEEE. Personal use is permitted, but republication/redistribution requires IEEE permission.See http://www.ieee.org/publications_standards/publications/rights/index.html for more information.

894 IEEE JOURNAL OF EMERGING AND SELECTED TOPICS IN POWER ELECTRONICS, VOL. 2, NO. 4, DECEMBER 2014
Fig. 1. Characteristic PV curves. (a) I–V curve. (b) P–V curve.
by a current versus voltage or a power versus voltage curve,as shown in Fig. 1.
Three important points can be identified in both curves.First, at zero voltage, is the short circuit current (iSC), repre-sented by a circle. Second, at zero current, is the open circuitvoltage (VOC), represented by a triangle. Finally, between themis the maximum power point (MPP), represented by a square.
As its name states, at MPP, the power production of thePV module is maximal [7]. However, it is by no meansconstant, changing with the external conditions of the PV mod-ule. Thus, PV systems require a dedicated power electronicssystem to track its MPP due to changes in environmentalconditions. This solution is called an MPP tracker (MPPT),having many different topologies and algorithms [8].
B. Imperfections of PV Power Production
The ideal power production situation is to have every singlecell of the entire PV plant to be identical, under the sameirradiance and constantly working at their own MPP. In reality,each cell is slightly different from one another and may receivedifferent irradiances.
As different parts of the entire plant react differently tothe light received, they can experience different power yields.These operating irregularities are sometimes called PV mis-match in the literature, but there is currently no consensusabout it.
The PV mismatch is the key to explaining how theintermittency affects PV production. Its definition proposedin this paper is the difference between the expected and actualpower outputs of a PV system. It can be classified as internalor external, according to its origin.
1) Internal Mismatch—Cell Mismatch: Imperfectionswithin PV modules or cells, induced by aging, poor solderbonds, impurities in the silicon crystal, or variability inproduction, result in different performances of the modulesconnected in series.
Since their origins are more linked to production processes,the internal PV mismatch has been widely analyzedin [9]–[16]. They are considered to be responsible for nearly2% of the overall losses in the PV systems, and most pre-cautions needed to avoid them must be taken during cellproduction.
2) External Mismatch—Source Mismatch: All conditionsleading to a change in irradiance or temperature of a partor the whole PV plant are considered as external mismatch.The shaded PV cells will produce less current than the others,
with one of two consequences. Either the unshaded cellswill impose their higher current, forcing the shaded cellsinto reverse bias, or the shaded cells will impose their lowercurrent, effectively reducing overall power production [1], [4],[17]–[19].
There exist several solutions to solve these issues and raisethe overall power production of the PV plant. These solutionsallow the PV plant to produce more power, granting it a betterrobustness in the presence of a shadow. They are, thus, calledPV robustness enhancement systems or PRobES in this paper.
3) PV Robustness Enhancing Solutions—PRobES: Besidesbypass diodes, there are roughly two families of PRobES inthe current literature, namely, series and parallel. Each has adifferent approach to handle the presence of the shadow.
Bypass diodes have been used, for the past decades, as thede f acto PRobES by the industry. It becomes naturally biasedwhen the voltage of the shaded cell group becomes negative,short-circuiting them and ignoring their power [5], [20].
Series PRobES use a large number of power electronicsconverters for a single PV plant. Each would be able to trackthe local MPP, no matter the shadow, thus harvesting morepower per cell. However, less number of cells per group meansless power, and low-power converter tends to be less efficient.Their challenge is, thus, making power electronics convertersmore efficient for low-power applications [5], [8], [21]–[24].
Parallel PRobES aim at redistributing the available currentof the system. They reroute the current distribution amongthe cells, reducing its difference between those shaded andunshaded. One of the challenges of this solution is theoptimization of the topologies capable of such current dis-tribution. The other challenge is to detect the presence ofthe shadow and to find the best redistributing strategy for thecurrent [6], [25]–[28]. This paper focuses on the latter.
The parallel structure that will be used in this paper isthe PV equalizer, which has been introduced in [4]. Its mainaspects and properties are recalled below.
C. PV Equalizer
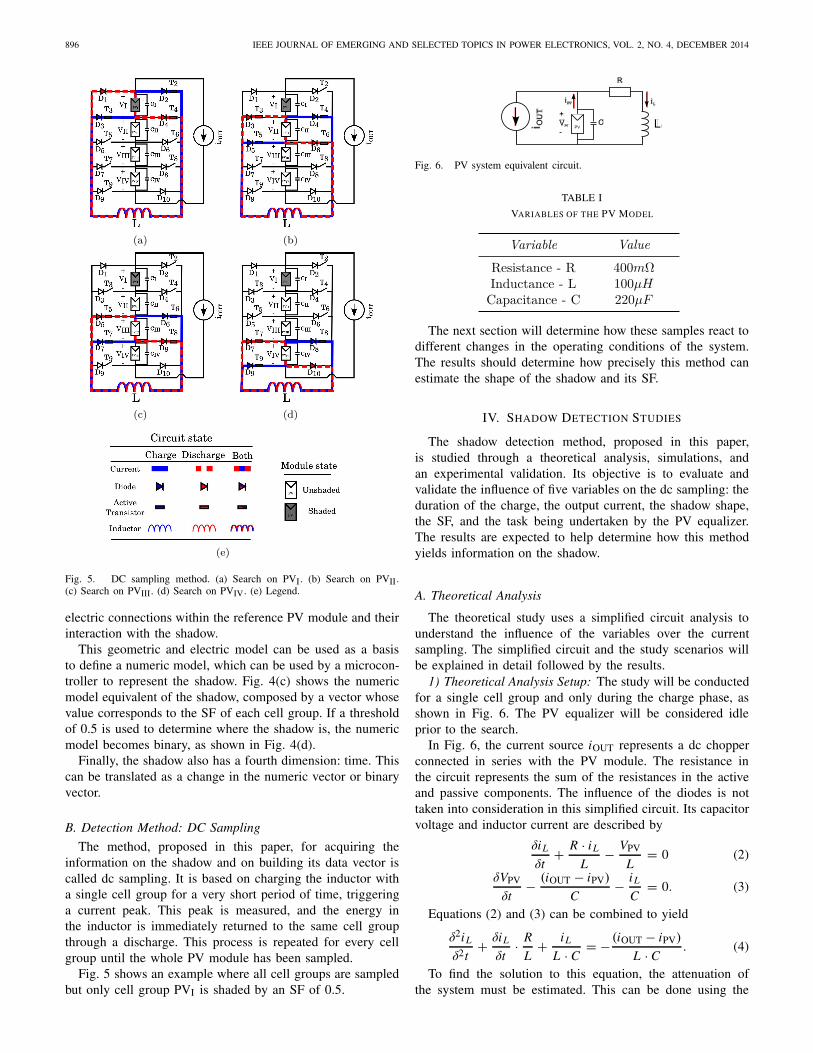
The parallel PRobES studied in this paper are calledPV equalizer. Inspired from its battery equivalent [29], thistopology equalizes the uneven current distribution among theshaded and unshaded cell groups of a PV module. Thisredistribution is achieved by surrounding the PV cell groupswith transistors, all connected to a single inductor, as shownin Fig. 2.
The PV equalizer used in this paper has eight transistors(T2–T9), ten diodes (D1–D10), four capacitors (CI–CIV), anda single inductor (L). It is connected to four cell groups(PVI–PVIV), which are all connected in series with a currentsource (iOUT). This current source represents the currentimposed by the MPPT over the PV module.
The transistors of the PV equalizer grant it with the neces-sary flexibility to connect to any number of the PV modulesand to transfer energy between them through a single inductor.However, its high switching frequency may impose rapidvariations in current to the cell groups, requiring the use ofcapacitors to filter them.
VILLA et al.: TOWARD THE DESIGN OF CONTROL ALGORITHMS FOR A PV EQUALIZER 895
Fig. 2. PV equalizer topology.
Fig. 3. Working example of the equalizer topology switching. (a) Chargeperiod. (b) Discharge period. (c) Circuit legend.
An example is shown in Fig. 3, where the shadow is locatedover PVIV. In this case, groups PVI–PVIII are used to chargethe inductor, while PVIV is used to discharge it. The currentflow during charge and discharge of the inductor is shown inFig. 3(a) and (b), respectively.
The choice of which cell groups give or receive energy iscalled a switching strategy and denoted according to a specificnotation. In the case of Fig. 3, its switching strategy would benoted as I.II.III → IV. On the left are the cell groups givingenergy and on the right are those receiving it. The arrow in themiddle points to the direction of the energy flow. A detailedstudy of the equations of the PV equalizer is available in [4].
Based on its operation principles, the PV equalizer can beeither idle or equalizing. When idle, the transistors of thePV equalizer are blocked but ready to operate at any givenmoment. During equalization, the presence of the shadow ismitigated through the use of a switching strategy and dutycycle, as described in [30].
However, to choose which strategy is to be used, thePV equalizer needs a clear method to determine the position
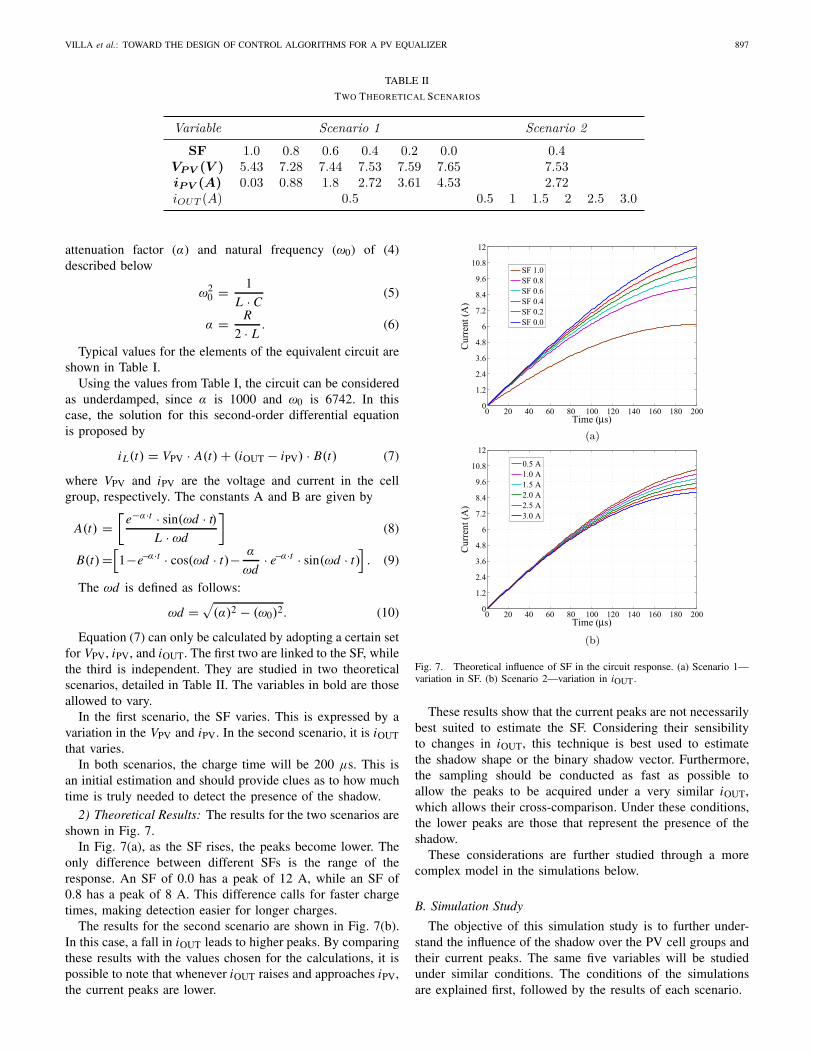
Fig. 4. Shadow model. (a) Reference PV module under partial shading.(b) Electric shadow model. (c) Numeric shadow model. (d) Binary shadowmodel.
of the shadow. This method, called dc sampling, is thecontribution of this paper.
III. SHADOW MODEL AND DC SAMPLING
Detecting the shadow requires the combination of a propermodel, a detection method, and their correlation. This sectionwill introduce the shadow model and the detection method,and the next section will study their correlation.
A. Shadow Model
A PV module is partially shaded when the light castupon some of its cells is obstructed by some object, cre-ating a shadow. In this paper, shadows will be modeled asa 2-D projection of a 3-D object. Thus, shadows will beconsidered to have a shape composed of two dimensions:length and width. This projection is cast over a PV module,effectively covering a certain number of cells.
Shadows can also vary in opacity, granting them withanother dimension equivalent to depth, called shading fac-tor (SF) in this paper. The more opaque the shadow, the lesslight passes through it. Thus, a higher SF means less irradiancefor the shadow, giving
Irradianceshadow = Irradiancetotal · (1 − SF). (1)
When the SF is zero, all the available irradiance reaches thePV module. When the SF is one, the shadow acts as a filter,and no irradiance reaches the PV module. In this paper, theSF is considered as linear.
Commercial PV modules are composed of cells con-nected in series forming cell groups. All cells of a sin-gle group are connected in series, and they are consideredto have their current limited by the shaded cells. Thus,a single group will be considered, in this paper, to share thesame SF.
Fig. 4(a) shows the reference PV module used in thispaper under partial shading conditions. Fig. 4(b) shows the
896 IEEE JOURNAL OF EMERGING AND SELECTED TOPICS IN POWER ELECTRONICS, VOL. 2, NO. 4, DECEMBER 2014
Fig. 5. DC sampling method. (a) Search on PVI. (b) Search on PVII.(c) Search on PVIII. (d) Search on PVIV. (e) Legend.
electric connections within the reference PV module and theirinteraction with the shadow.
This geometric and electric model can be used as a basisto define a numeric model, which can be used by a microcon-troller to represent the shadow. Fig. 4(c) shows the numericmodel equivalent of the shadow, composed by a vector whosevalue corresponds to the SF of each cell group. If a thresholdof 0.5 is used to determine where the shadow is, the numericmodel becomes binary, as shown in Fig. 4(d).
Finally, the shadow also has a fourth dimension: time. Thiscan be translated as a change in the numeric vector or binaryvector.
B. Detection Method: DC Sampling
The method, proposed in this paper, for acquiring theinformation on the shadow and on building its data vector iscalled dc sampling. It is based on charging the inductor witha single cell group for a very short period of time, triggeringa current peak. This peak is measured, and the energy inthe inductor is immediately returned to the same cell groupthrough a discharge. This process is repeated for every cellgroup until the whole PV module has been sampled.
Fig. 5 shows an example where all cell groups are sampledbut only cell group PVI is shaded by an SF of 0.5.
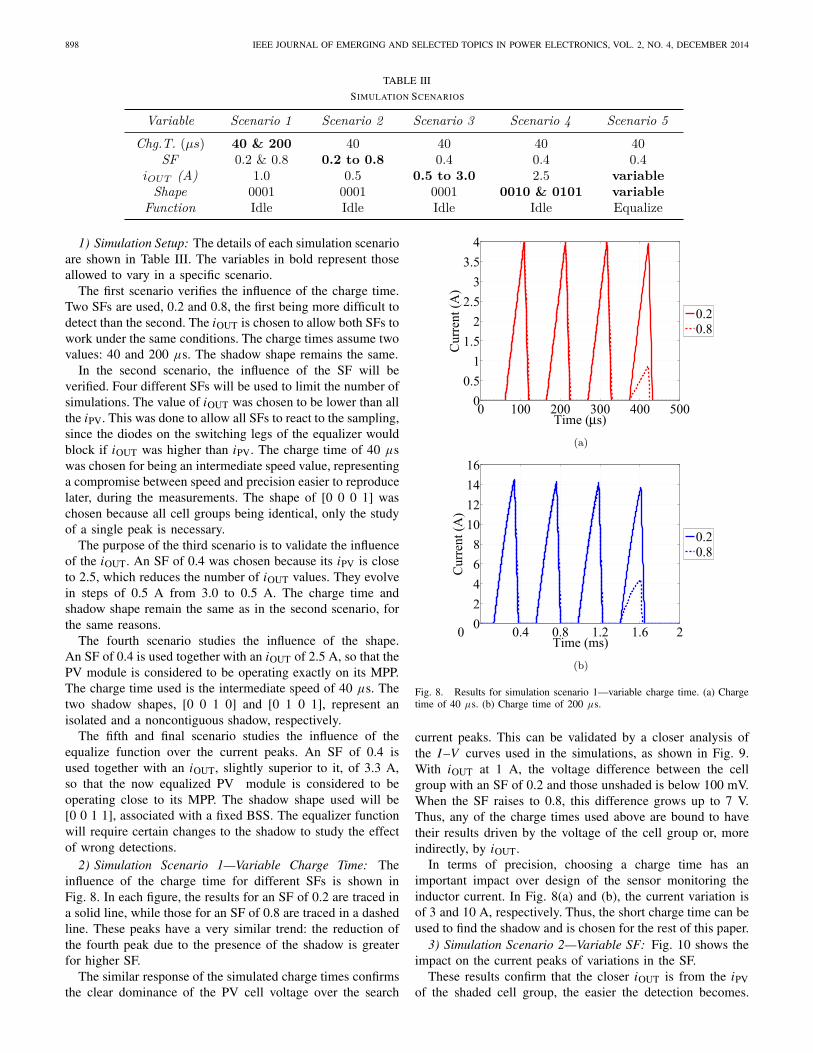
Fig. 6. PV system equivalent circuit.
TABLE I
VARIABLES OF THE PV MODEL
The next section will determine how these samples react todifferent changes in the operating conditions of the system.The results should determine how precisely this method canestimate the shape of the shadow and its SF.
IV. SHADOW DETECTION STUDIES
The shadow detection method, proposed in this paper,is studied through a theoretical analysis, simulations, andan experimental validation. Its objective is to evaluate andvalidate the influence of five variables on the dc sampling: theduration of the charge, the output current, the shadow shape,the SF, and the task being undertaken by the PV equalizer.The results are expected to help determine how this methodyields information on the shadow.
A. Theoretical Analysis
The theoretical study uses a simplified circuit analysis tounderstand the influence of the variables over the currentsampling. The simplified circuit and the study scenarios willbe explained in detail followed by the results.
1) Theoretical Analysis Setup: The study will be conductedfor a single cell group and only during the charge phase, asshown in Fig. 6. The PV equalizer will be considered idleprior to the search.
In Fig. 6, the current source iOUT represents a dc chopperconnected in series with the PV module. The resistance inthe circuit represents the sum of the resistances in the activeand passive components. The influence of the diodes is nottaken into consideration in this simplified circuit. Its capacitorvoltage and inductor current are described by
δiL
δt+ R · iL
L− VPV
L= 0 (2)
δVPV
δt− (iOUT − iPV)
C− iL
C= 0. (3)
Equations (2) and (3) can be combined to yield
δ2iL
δ2t+ δiL
δt· R
L+ iL
L · C= − (iOUT − iPV)
L · C. (4)
To find the solution to this equation, the attenuation ofthe system must be estimated. This can be done using the
VILLA et al.: TOWARD THE DESIGN OF CONTROL ALGORITHMS FOR A PV EQUALIZER 897
TABLE II
TWO THEORETICAL SCENARIOS
attenuation factor (α) and natural frequency (ω0) of (4)described below
ω20 = 1
L · C(5)
α = R
2 · L. (6)
Typical values for the elements of the equivalent circuit areshown in Table I.
Using the values from Table I, the circuit can be consideredas underdamped, since α is 1000 and ω0 is 6742. In thiscase, the solution for this second-order differential equationis proposed by
iL(t) = VPV · A(t) + (iOUT − iPV) · B(t) (7)
where VPV and iPV are the voltage and current in the cellgroup, respectively. The constants A and B are given by
A(t) =[
e−α·t · sin(ωd · t)
L · ωd
](8)
B(t) =[1−e−α·t · cos(ωd · t)− α
ωd· e−α·t · sin(ωd · t)
]. (9)
The ωd is defined as follows:
ωd =√
(α)2 − (ω0)2. (10)
Equation (7) can only be calculated by adopting a certain setfor VPV, iPV, and iOUT. The first two are linked to the SF, whilethe third is independent. They are studied in two theoreticalscenarios, detailed in Table II. The variables in bold are thoseallowed to vary.
In the first scenario, the SF varies. This is expressed by avariation in the VPV and iPV. In the second scenario, it is iOUTthat varies.
In both scenarios, the charge time will be 200 μs. This isan initial estimation and should provide clues as to how muchtime is truly needed to detect the presence of the shadow.
2) Theoretical Results: The results for the two scenarios areshown in Fig. 7.
In Fig. 7(a), as the SF rises, the peaks become lower. Theonly difference between different SFs is the range of theresponse. An SF of 0.0 has a peak of 12 A, while an SF of0.8 has a peak of 8 A. This difference calls for faster chargetimes, making detection easier for longer charges.
The results for the second scenario are shown in Fig. 7(b).In this case, a fall in iOUT leads to higher peaks. By comparingthese results with the values chosen for the calculations, it ispossible to note that whenever iOUT raises and approaches iPV,the current peaks are lower.
Fig. 7. Theoretical influence of SF in the circuit response. (a) Scenario 1—variation in SF. (b) Scenario 2—variation in iOUT.
These results show that the current peaks are not necessarilybest suited to estimate the SF. Considering their sensibilityto changes in iOUT, this technique is best used to estimatethe shadow shape or the binary shadow vector. Furthermore,the sampling should be conducted as fast as possible toallow the peaks to be acquired under a very similar iOUT,which allows their cross-comparison. Under these conditions,the lower peaks are those that represent the presence of theshadow.
These considerations are further studied through a morecomplex model in the simulations below.
B. Simulation Study
The objective of this simulation study is to further under-stand the influence of the shadow over the PV cell groups andtheir current peaks. The same five variables will be studiedunder similar conditions. The conditions of the simulationsare explained first, followed by the results of each scenario.
898 IEEE JOURNAL OF EMERGING AND SELECTED TOPICS IN POWER ELECTRONICS, VOL. 2, NO. 4, DECEMBER 2014
TABLE III
SIMULATION SCENARIOS
1) Simulation Setup: The details of each simulation scenarioare shown in Table III. The variables in bold represent thoseallowed to vary in a specific scenario.
The first scenario verifies the influence of the charge time.Two SFs are used, 0.2 and 0.8, the first being more difficult todetect than the second. The iOUT is chosen to allow both SFs towork under the same conditions. The charge times assume twovalues: 40 and 200 μs. The shadow shape remains the same.
In the second scenario, the influence of the SF will beverified. Four different SFs will be used to limit the number ofsimulations. The value of iOUT was chosen to be lower than allthe iPV. This was done to allow all SFs to react to the sampling,since the diodes on the switching legs of the equalizer wouldblock if iOUT was higher than iPV. The charge time of 40 μswas chosen for being an intermediate speed value, representinga compromise between speed and precision easier to reproducelater, during the measurements. The shape of [0 0 0 1] waschosen because all cell groups being identical, only the studyof a single peak is necessary.
The purpose of the third scenario is to validate the influenceof the iOUT. An SF of 0.4 was chosen because its iPV is closeto 2.5, which reduces the number of iOUT values. They evolvein steps of 0.5 A from 3.0 to 0.5 A. The charge time andshadow shape remain the same as in the second scenario, forthe same reasons.
The fourth scenario studies the influence of the shape.An SF of 0.4 is used together with an iOUT of 2.5 A, so that thePV module is considered to be operating exactly on its MPP.The charge time used is the intermediate speed of 40 μs. Thetwo shadow shapes, [0 0 1 0] and [0 1 0 1], represent anisolated and a noncontiguous shadow, respectively.
The fifth and final scenario studies the influence of theequalize function over the current peaks. An SF of 0.4 isused together with an iOUT, slightly superior to it, of 3.3 A,so that the now equalized PV module is considered to beoperating close to its MPP. The shadow shape used will be[0 0 1 1], associated with a fixed BSS. The equalizer functionwill require certain changes to the shadow to study the effectof wrong detections.
2) Simulation Scenario 1—Variable Charge Time: Theinfluence of the charge time for different SFs is shown inFig. 8. In each figure, the results for an SF of 0.2 are traced ina solid line, while those for an SF of 0.8 are traced in a dashedline. These peaks have a very similar trend: the reduction ofthe fourth peak due to the presence of the shadow is greaterfor higher SF.
The similar response of the simulated charge times confirmsthe clear dominance of the PV cell voltage over the search
Fig. 8. Results for simulation scenario 1—variable charge time. (a) Chargetime of 40 μs. (b) Charge time of 200 μs.
current peaks. This can be validated by a closer analysis ofthe I–V curves used in the simulations, as shown in Fig. 9.With iOUT at 1 A, the voltage difference between the cellgroup with an SF of 0.2 and those unshaded is below 100 mV.When the SF raises to 0.8, this difference grows up to 7 V.Thus, any of the charge times used above are bound to havetheir results driven by the voltage of the cell group or, moreindirectly, by iOUT.
In terms of precision, choosing a charge time has animportant impact over design of the sensor monitoring theinductor current. In Fig. 8(a) and (b), the current variation isof 3 and 10 A, respectively. Thus, the short charge time can beused to find the shadow and is chosen for the rest of this paper.
3) Simulation Scenario 2—Variable SF: Fig. 10 shows theimpact on the current peaks of variations in the SF.
These results confirm that the closer iOUT is from the iPVof the shaded cell group, the easier the detection becomes.
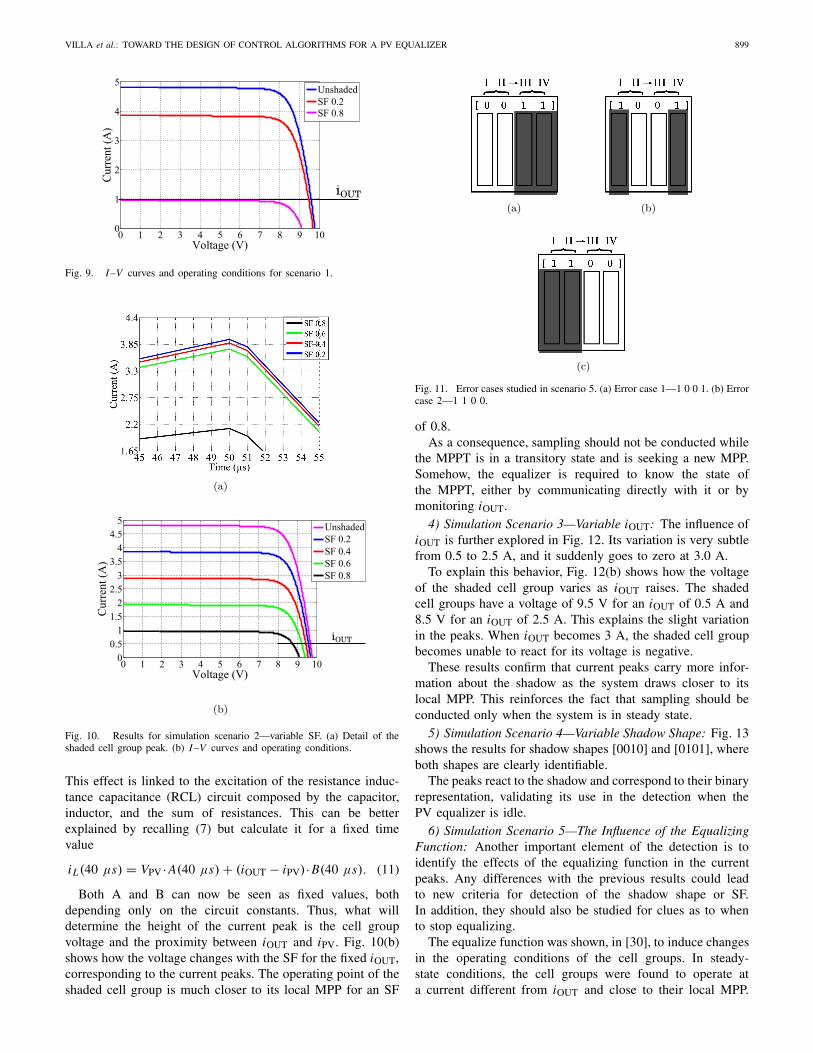
VILLA et al.: TOWARD THE DESIGN OF CONTROL ALGORITHMS FOR A PV EQUALIZER 899
Fig. 9. I–V curves and operating conditions for scenario 1.
Fig. 10. Results for simulation scenario 2—variable SF. (a) Detail of theshaded cell group peak. (b) I–V curves and operating conditions.
This effect is linked to the excitation of the resistance induc-tance capacitance (RCL) circuit composed by the capacitor,inductor, and the sum of resistances. This can be betterexplained by recalling (7) but calculate it for a fixed timevalue
iL(40 μs) = VPV · A(40 μs) + (iOUT − iPV)·B(40 μs). (11)
Both A and B can now be seen as fixed values, bothdepending only on the circuit constants. Thus, what willdetermine the height of the current peak is the cell groupvoltage and the proximity between iOUT and iPV. Fig. 10(b)shows how the voltage changes with the SF for the fixed iOUT,corresponding to the current peaks. The operating point of theshaded cell group is much closer to its local MPP for an SF
Fig. 11. Error cases studied in scenario 5. (a) Error case 1—1 0 0 1. (b) Errorcase 2—1 1 0 0.
of 0.8.As a consequence, sampling should not be conducted while
the MPPT is in a transitory state and is seeking a new MPP.Somehow, the equalizer is required to know the state ofthe MPPT, either by communicating directly with it or bymonitoring iOUT.
4) Simulation Scenario 3—Variable iOUT: The influence ofiOUT is further explored in Fig. 12. Its variation is very subtlefrom 0.5 to 2.5 A, and it suddenly goes to zero at 3.0 A.
To explain this behavior, Fig. 12(b) shows how the voltageof the shaded cell group varies as iOUT raises. The shadedcell groups have a voltage of 9.5 V for an iOUT of 0.5 A and8.5 V for an iOUT of 2.5 A. This explains the slight variationin the peaks. When iOUT becomes 3 A, the shaded cell groupbecomes unable to react for its voltage is negative.
These results confirm that current peaks carry more infor-mation about the shadow as the system draws closer to itslocal MPP. This reinforces the fact that sampling should beconducted only when the system is in steady state.
5) Simulation Scenario 4—Variable Shadow Shape: Fig. 13shows the results for shadow shapes [0010] and [0101], whereboth shapes are clearly identifiable.
The peaks react to the shadow and correspond to their binaryrepresentation, validating its use in the detection when thePV equalizer is idle.
6) Simulation Scenario 5—The Influence of the EqualizingFunction: Another important element of the detection is toidentify the effects of the equalizing function in the currentpeaks. Any differences with the previous results could leadto new criteria for detection of the shadow shape or SF.In addition, they should also be studied for clues as to whento stop equalizing.
The equalize function was shown, in [30], to induce changesin the operating conditions of the cell groups. In steady-state conditions, the cell groups were found to operate ata current different from iOUT and close to their local MPP.

900 IEEE JOURNAL OF EMERGING AND SELECTED TOPICS IN POWER ELECTRONICS, VOL. 2, NO. 4, DECEMBER 2014
Fig. 12. Results for simulation scenario 3—variable iOUT. (a) Detail of theshaded cell group peak. (b) I–V curves and operating conditions.
This changes (11) as shown below, where k is the cell groupover which the sampling is taking place
iLk (40 μs)=VPVk · A(40 μs)+(ilocalk −iPVk )·B(40 μs). (12)
In (12), the peaks are no longer comparable among them-selves as they represent how much energy is available locallyat a given discharge rate. However, they still bear informationthat can be helpful during equalizing, especially if the shadowwas wrongly estimated.
An example will be studied to demonstrate how the currentpeaks can be used to correct the initial shadow estimation.Fig. 11(a) shows the reference case used where the switchingstrategy is fixed to cell groups PVIII and PVIV that arereceiving energy from groups PVI and PVII, represented bythe arrow above the figures.
The other cases shown in Fig. 11 are two possible errorcases. These cases represent situations where the estimationof the shadow is correct, partially correct, or totally wrong.By comparing their peaks, information can be deduced as tohow they can be used to estimate changes in the shadow overtime.
The reference case is shown in Fig. 14. Its lower peakscorrespond correctly to the cell groups considered as shaded.The I–V curve shown in Fig. 14(b) shows how the distributionof current within the cell groups influences their local voltage.With equalization taking place, the local current rises to itslocal optimum while their voltage falters. As a consequence,the current peaks draw close together making their cross-comparison different from the previous cases.
Fig. 13. Results for simulation scenario 4—Variable shadow shapes.(a) Shadow shape [0010]. (b) Shadow shape [0101].
In case 1, the shadow moves away from group PVIV leadingit to have more voltage and a higher peak, as shown in Fig. 15.However, due to equalization, groups PVI and PVII share thesame current. Thus, since group PVI is now shaded, the currentof PVII is limited which leads it to have a higher voltage.A similar analysis can be made for groups PVIII and PVIV.
Fig. 16 shows the results for case 2. The shaded cell groupsfind themselves supporting unshaded ones with an importantconsequence to their peaks. Such a high difference amongthem is a clear sign that the cell groups considered as zeroshould be switched to one and vice-versa.
These results will be validated through measurements andsummed up in a method for interpreting the current peaks.
C. Experimental Validation
The objective of the experiments is to verify the simulations,thus validating their conclusion. The experimental rig will beintroduced first, followed by the experimental setup and theresults of each scenario.
1) Experimental Rig: The experimental rig is composed ofseveral blocks, as shown in Fig. 17. Its main parts are shownin Fig. 18.
The PV equalizer, shown in Fig. 18(a), is composed bysix cards, namely, debug, feeder, control, acquisition, power,and interconnections. The debug card allows the system to befed from outside sources, if necessary, and grants an interface

VILLA et al.: TOWARD THE DESIGN OF CONTROL ALGORITHMS FOR A PV EQUALIZER 901
Fig. 14. Results for the reference case—[0011]. (a) Current peaks. (b) I–Vcurves and operating conditions.
with an oscilloscope. The feeder card uses the energy from thePV module to feed the other cards of the PV equalizer. Thecontrol card has a dsPic33FJ16GS610 used to generate thepulsewidth modulation signals to the transistors or used toexecute any control algorithm, and a dsPic24FJ16GA002 usedto communicate with an outside computer through a USBinterface. The acquisition card measures the voltages of eachcell group, the output current, and the current in the inductor.The power card hosts the power transistors, the power diodes,the drivers, and the inductor. Finally, the interconnection cardis used to connect all the cards together.
The irradiance and temperature sensor is the reference cellof a PVPM1000C40 I–V tracer.
The MPPT used in this paper consists of the dc chopper inFig. 18(d), which can be controlled either to provide a fixedcurrent or to track the MPP of the PV module. Its controlleris the one used by the PV equalizer.
The PV module is a Photowatt PW1650, with 72 cellsand a rated power of 150 W under 1000 W/m2. Theiroriginal bypass diodes were removed for these experiments.The shadow cast over the PV module was created using plasticlayers. Their SF characterization is shown in Fig. 19.
2) Experimental Setup: The scenarios attempt to reproducethe simulations as closely as possible. The first scenarioreproduces the impact of two different charge times in thecurrent peaks. The second scenario has four SFs of 0.78,
Fig. 15. Results for case 1—[1010]. (a) Current peaks. (b) I–V curves andoperating conditions.
0.69, 0.56, and 0.35, which are slightly different from thesimulations due to the irradiance available during the mea-surements. The third scenario has iOUT values of 0.5, 1.0, 1.5,2.0, 2.2, and 2.3 A. The fourth and fifth scenarios have verysimilar, shadow shape, and equalize conditions to the sim-ulation, respectively. Table IV summarizes the experimentalscenarios.
All measurements were performed under similar irradi-ance and temperature conditions of 600 W/m2 and 28°,respectively.
3) Experimental Scenario 1 Results—Variable ChargeTime: The results for different charge times are shown inFigs. 20 and 21.
The results show that the same SF has a proportionallysimilar impact in all the charge times, confirming that thevoltage has a major impact on the peaks.
4) Experimental Scenario 2 Results—Variable SF: The sec-ond scenario reproduces the impact of SF variations over thecurrent peaks. Its results are shown in Fig. 22.
The intermediate SFs are all bundled together, while thelowest and highest ones are well-separated, making any preciseestimation of the SF very difficult. These results confirm thatthe closer iOUT is from the iPV of the shaded cell group, theeasier the detection becomes.
5) Experimental Scenario 3 Results—Variable iOUT: Thestudy of the influence of iOUT in the variations of the currentpeaks is shown in Fig. 23.
902 IEEE JOURNAL OF EMERGING AND SELECTED TOPICS IN POWER ELECTRONICS, VOL. 2, NO. 4, DECEMBER 2014
TABLE IV
EXPERIMENTAL SCENARIOS
Fig. 16. Results for case 2—[1100]. (a) Current peaks. (b) I–V curves andoperating conditions.
Fig. 17. Block diagram of the experimental rig.
As iOUT draws closer to the iPV of the shadedcell group, its peak lowers, suddenly disappearing be-tween currents 2.2 and 2.3 A. These results confirm thesimulations.
Fig. 18. Main parts of the experimental rig. (a) PV equalizer prototype. (b) Irr.and Temp. sensor. (c) PV module and shadow. (d) MPPT—dc chopper.
Fig. 19. Characterization of the artificial shadows.
6) Experimental Scenario 4 Results—Variable Shape: Thesame shadow shapes are used to validate the simulation results,as shown in Fig. 24.
All the shadow shapes can be clearly detected bya margin of nearly 300 mA. This validates the useof the dc sampling method to determine the shadowshape.

VILLA et al.: TOWARD THE DESIGN OF CONTROL ALGORITHMS FOR A PV EQUALIZER 903
Fig. 20. Experimental results for 40-μs charge. (a) 0.35 SF. (b) 0.56 SF.
7) Experimental Scenario 5 Results—EqualizeFunction: The experimental results for the influence ofthe equalize function on the current peaks are shown inFig. 25.
The same patterns are shown in all cases, confirmingthe interpretation of the peaks deduced from the simulationresults. However, the current peak from cell group PVI isshown to be systematically lower than its counterparts, in-dicating a potentially smaller capacitor. Such imperfectionsmust be considered when designing the control system of thePV equalizer.
Finally, all the conclusions from the simulations and the-oretical studies are considered as confirmed, which allows ageneral summary of these findings.
V. SUMMARY AND DISCUSSION
There are five important conclusions about the dc sam-pling method, which can be drawn from the resultsin this paper. The first conclusion is that the chargetime can be small. Thus, the sampling can take placewithin a few microseconds and cannot disrupt powerproduction.
The second conclusion is that only one sensor isenough to sample an entire PV plant, bringing costsdown.
The third conclusion is that the dc sampling method canbe used to find the shadow shape but not the SF. Several
Fig. 21. Experimental results for 400-μs charge. (a) 0.35 SF. (b) 0.56 SF.
Fig. 22. Experimental results scenario 2—variable SF.
Fig. 23. Experimental results scenario 3—variable iOUT.
results have shown that the peaks of intermediary SF bundletogether, while those with higher SF are easier to detect.

904 IEEE JOURNAL OF EMERGING AND SELECTED TOPICS IN POWER ELECTRONICS, VOL. 2, NO. 4, DECEMBER 2014
Fig. 24. Experimental results scenario 4—variable shapes. (a) Shape 0 0 1 0.(b) Shape 0 1 0 1.
Thus, this method is well-suited if the information regard-ing SF is not needed by the PRobES, as is the case withthe PV equalizer.
The fourth conclusion is that current sampling needs astable iOUT. Thus, it should only take place after the MPPTcontrolling power production has converged to a certain op-eration point. This may need some extra information shar-ing between the PV equalizer and the MPPT or someregular monitoring of output voltage and current by thePV equalizer.
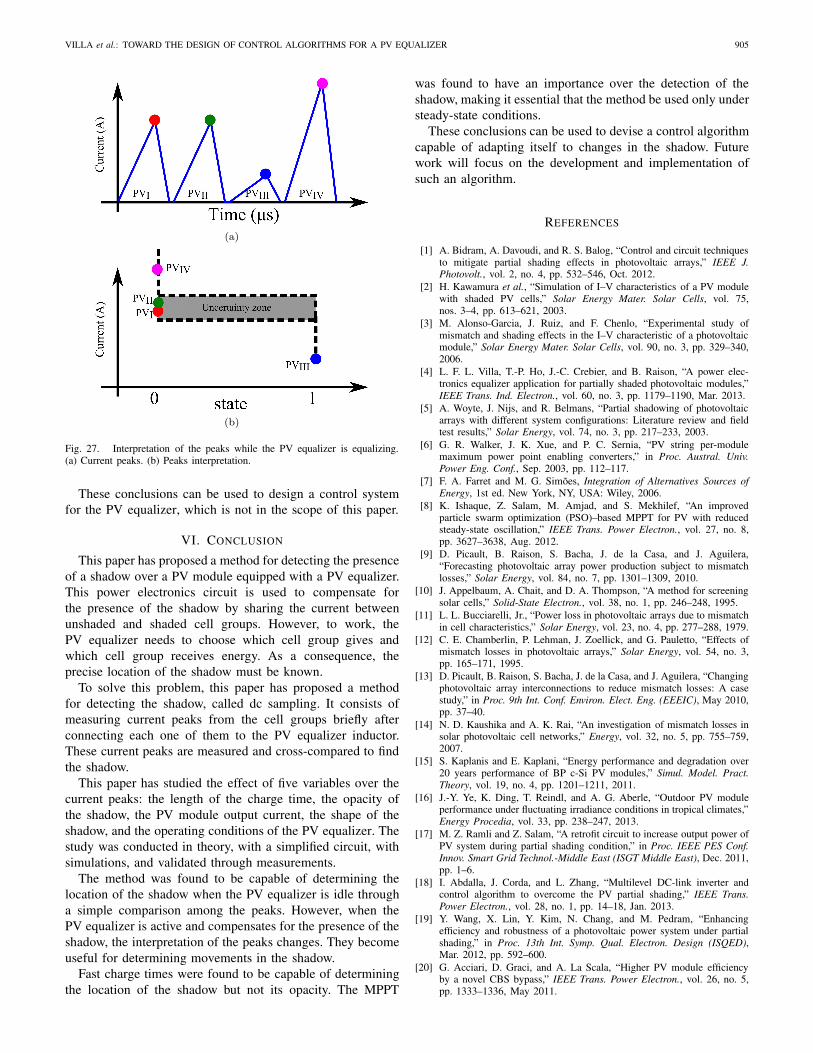
The fifth conclusion is that there is a clear differencebetween the interpretation of the peaks before and afterequalization. While the PV equalizer is idle, the current peaksgive a direct estimation of the shadow shape. To do so requiresa threshold to be calculated based on their value. Every peakhigher than the threshold is considered unshaded or zero, whileall those below are shaded or one. An average between thehighest and lowest peaks can be used, as the example shownin Fig. 26.
If equalization is taking place, then the interpretation of thepeaks changes. Equalization brings all the voltages of the cellgroups to very close values, creating an uncertainty zone forthe interpretation of the current peaks. As a result, the inter-pretation of the peaks becomes similar to a hysteresis aroundthe highest current peak value of the unshaded cell groups, asshown in Fig. 27. In this example, the shadow moved fromPVIV to PVIII, driving their respective peaks above and below
Fig. 25. Experimental results for the error cases. (a) Error case 4—1 0 0 1.(b) Error case 8—1 1 0 0.
Fig. 26. Interpretation of the peaks while the PV equalizer is idle. (a) Currentpeaks. (b) Peaks interpretation.
the uncertainty zone. Their shadow states can then be updatedaccordingly.
VILLA et al.: TOWARD THE DESIGN OF CONTROL ALGORITHMS FOR A PV EQUALIZER 905
Fig. 27. Interpretation of the peaks while the PV equalizer is equalizing.(a) Current peaks. (b) Peaks interpretation.
These conclusions can be used to design a control systemfor the PV equalizer, which is not in the scope of this paper.
VI. CONCLUSION
This paper has proposed a method for detecting the presenceof a shadow over a PV module equipped with a PV equalizer.This power electronics circuit is used to compensate forthe presence of the shadow by sharing the current betweenunshaded and shaded cell groups. However, to work, thePV equalizer needs to choose which cell group gives andwhich cell group receives energy. As a consequence, theprecise location of the shadow must be known.
To solve this problem, this paper has proposed a methodfor detecting the shadow, called dc sampling. It consists ofmeasuring current peaks from the cell groups briefly afterconnecting each one of them to the PV equalizer inductor.These current peaks are measured and cross-compared to findthe shadow.
This paper has studied the effect of five variables over thecurrent peaks: the length of the charge time, the opacity ofthe shadow, the PV module output current, the shape of theshadow, and the operating conditions of the PV equalizer. Thestudy was conducted in theory, with a simplified circuit, withsimulations, and validated through measurements.
The method was found to be capable of determining thelocation of the shadow when the PV equalizer is idle througha simple comparison among the peaks. However, when thePV equalizer is active and compensates for the presence of theshadow, the interpretation of the peaks changes. They becomeuseful for determining movements in the shadow.
Fast charge times were found to be capable of determiningthe location of the shadow but not its opacity. The MPPT
was found to have an importance over the detection of theshadow, making it essential that the method be used only understeady-state conditions.
These conclusions can be used to devise a control algorithmcapable of adapting itself to changes in the shadow. Futurework will focus on the development and implementation ofsuch an algorithm.
REFERENCES
[1] A. Bidram, A. Davoudi, and R. S. Balog, “Control and circuit techniquesto mitigate partial shading effects in photovoltaic arrays,” IEEE J.Photovolt., vol. 2, no. 4, pp. 532–546, Oct. 2012.
[2] H. Kawamura et al., “Simulation of I–V characteristics of a PV modulewith shaded PV cells,” Solar Energy Mater. Solar Cells, vol. 75,nos. 3–4, pp. 613–621, 2003.
[3] M. Alonso-Garcia, J. Ruiz, and F. Chenlo, “Experimental study ofmismatch and shading effects in the I–V characteristic of a photovoltaicmodule,” Solar Energy Mater. Solar Cells, vol. 90, no. 3, pp. 329–340,2006.
[4] L. F. L. Villa, T.-P. Ho, J.-C. Crebier, and B. Raison, “A power elec-tronics equalizer application for partially shaded photovoltaic modules,”IEEE Trans. Ind. Electron., vol. 60, no. 3, pp. 1179–1190, Mar. 2013.
[5] A. Woyte, J. Nijs, and R. Belmans, “Partial shadowing of photovoltaicarrays with different system configurations: Literature review and fieldtest results,” Solar Energy, vol. 74, no. 3, pp. 217–233, 2003.
[6] G. R. Walker, J. K. Xue, and P. C. Sernia, “PV string per-modulemaximum power point enabling converters,” in Proc. Austral. Univ.Power Eng. Conf., Sep. 2003, pp. 112–117.
[7] F. A. Farret and M. G. Simões, Integration of Alternatives Sources ofEnergy, 1st ed. New York, NY, USA: Wiley, 2006.
[8] K. Ishaque, Z. Salam, M. Amjad, and S. Mekhilef, “An improvedparticle swarm optimization (PSO)–based MPPT for PV with reducedsteady-state oscillation,” IEEE Trans. Power Electron., vol. 27, no. 8,pp. 3627–3638, Aug. 2012.
[9] D. Picault, B. Raison, S. Bacha, J. de la Casa, and J. Aguilera,“Forecasting photovoltaic array power production subject to mismatchlosses,” Solar Energy, vol. 84, no. 7, pp. 1301–1309, 2010.
[10] J. Appelbaum, A. Chait, and D. A. Thompson, “A method for screeningsolar cells,” Solid-State Electron., vol. 38, no. 1, pp. 246–248, 1995.
[11] L. L. Bucciarelli, Jr., “Power loss in photovoltaic arrays due to mismatchin cell characteristics,” Solar Energy, vol. 23, no. 4, pp. 277–288, 1979.
[12] C. E. Chamberlin, P. Lehman, J. Zoellick, and G. Pauletto, “Effects ofmismatch losses in photovoltaic arrays,” Solar Energy, vol. 54, no. 3,pp. 165–171, 1995.
[13] D. Picault, B. Raison, S. Bacha, J. de la Casa, and J. Aguilera, “Changingphotovoltaic array interconnections to reduce mismatch losses: A casestudy,” in Proc. 9th Int. Conf. Environ. Elect. Eng. (EEEIC), May 2010,pp. 37–40.
[14] N. D. Kaushika and A. K. Rai, “An investigation of mismatch losses insolar photovoltaic cell networks,” Energy, vol. 32, no. 5, pp. 755–759,2007.
[15] S. Kaplanis and E. Kaplani, “Energy performance and degradation over20 years performance of BP c-Si PV modules,” Simul. Model. Pract.Theory, vol. 19, no. 4, pp. 1201–1211, 2011.
[16] J.-Y. Ye, K. Ding, T. Reindl, and A. G. Aberle, “Outdoor PV moduleperformance under fluctuating irradiance conditions in tropical climates,”Energy Procedia, vol. 33, pp. 238–247, 2013.
[17] M. Z. Ramli and Z. Salam, “A retrofit circuit to increase output power ofPV system during partial shading condition,” in Proc. IEEE PES Conf.Innov. Smart Grid Technol.-Middle East (ISGT Middle East), Dec. 2011,pp. 1–6.
[18] I. Abdalla, J. Corda, and L. Zhang, “Multilevel DC-link inverter andcontrol algorithm to overcome the PV partial shading,” IEEE Trans.Power Electron., vol. 28, no. 1, pp. 14–18, Jan. 2013.
[19] Y. Wang, X. Lin, Y. Kim, N. Chang, and M. Pedram, “Enhancingefficiency and robustness of a photovoltaic power system under partialshading,” in Proc. 13th Int. Symp. Qual. Electron. Design (ISQED),Mar. 2012, pp. 592–600.
[20] G. Acciari, D. Graci, and A. La Scala, “Higher PV module efficiencyby a novel CBS bypass,” IEEE Trans. Power Electron., vol. 26, no. 5,pp. 1333–1336, May 2011.

906 IEEE JOURNAL OF EMERGING AND SELECTED TOPICS IN POWER ELECTRONICS, VOL. 2, NO. 4, DECEMBER 2014
[21] C. A. Ramos-Paja, G. Spagnuolo, G. Petrone, M. Vitelli, andJ. D. Bastidas, “A multivariable MPPT algorithm for granular control ofphotovoltaic systems,” in Proc. IEEE Int. Symp. Ind. Electron. (ISIE),Jul. 2010, pp. 3433–3437.
[22] A. Safari and S. Mekhilef, “Simulation and hardware implementation ofincremental conductance MPPT with direct control method using Cukconverter,” IEEE Trans. Ind. Electron., vol. 58, no. 4, pp. 1154–1161,Apr. 2011.
[23] R. Giral, C. E. Carrejo, M. Vermeersh, A. J. Saavedra-Montes, andC. A. Ramos-Paja, “PV field distributed maximum power point trackingby means of an active bypass converter,” in Proc. Int. Conf. Clean Elect.Power (ICCEP), Jun. 2011, pp. 94–98.
[24] T. L. Nguyen and K.-S. Low, “A global maximum power point trackingscheme employing direct search algorithm for photovoltaic systems,”IEEE Trans. Ind. Electron., vol. 57, no. 10, pp. 3456–3467, Oct. 2010.
[25] R. Kadri, J.-P. Gaubert, and G. Champenois, “New converter topologyto improve performance of photovoltaic power generation system undershading conditions,” in Proc. Int. Conf. Power Eng., Energy Elect. Drives(POWERENG), May 2011, pp. 1–7.
[26] Y. Nimni and D. Shmilovitz, “A returned energy architecture forimproved photovoltaic systems efficiency,” in Proc. IEEE Int. Symp.Circuits Syst. (ISCAS), Jun. 2010, pp. 2191–2194.
[27] T. Shimizu, M. Hirakata, T. Kamezawa, and H. Watanabe, “Generationcontrol circuit for photovoltaic modules,” IEEE Trans. Power Electron.,vol. 16, no. 3, pp. 293–300, May 2001.
[28] T. Shimizu, O. Hashimoto, and G. Kimura, “A novel high-performanceutility-interactive photovoltaic inverter system,” IEEE Trans. PowerElectron., vol. 18, no. 2, pp. 704–711, Mar. 2003.
[29] S.-H. Park, T.-S. Kim, J.-S. Park, G.-W. Moon, and M.-J. Yoon, “A newbuck-boost type battery equalizer,” in Proc. 24th Annu. IEEE Appl.Power Electron. Conf. Expo. (APEC), Feb. 2009, pp. 1246–1250.
[30] L. F. Villa, X. Pichon, F. Sarrafin-Ardelibi, B. Raison, J. C. Crebier, andA. Labonne, “Toward the design of control algorithms for a photovoltaicequalizer: Choosing the optimal switching strategy and the duty cycle,”IEEE Trans. Power Electron., vol. 29, no. 3, pp. 1447–1460, Mar. 2014.
Luiz Fernando Lavado Villa was born in Foz doIguacu, Brazil, in 1984. He received the Degree inelectrical engineering from the Federal University ofSanta Catarina, Santa Catarina, Brazil, in 2009, theM.S. degree from the Grenoble Institute of Tech-nology, Grenoble, France, in 2010, and the Ph.D.degree in electrical engineering from the Universityof Grenoble, Grenoble, in 2013, with a focus oninteractions between photovoltaics and shadows.
He is currently with the University of Strathclyde,Glascow, U.K. His current research interests include
power electronics and smart grids applications for the integration of renewableenergy.
Bertrand Raison (M’03) was born in Bethune,France, in 1972. He received the M.S. and Ph.D.degrees in electrical engineering from the GrenobleInstitute of Technology (INPG), Grenoble, France,in 1996 and 2000, respectively.
He was with INPG, from 2001 to 2009, as anAssociate Professor. Since 2009, he has been withUniversity Joseph Fourier, Grenoble, as a Professor.His current research interests include fault detectionand localization in electrical systems and distributionnetwork planning and protection with respect to fault
management.
Jean-Christophe Crebier received the bachelor’sdegree in electrical engineering from the Greno-ble Institute of Technology (INPG), Grenoble,France, in 1995, and the Ph.D. degree inpower electronics, electromagnetic compatibility,and power factor correction from the Laboratoired’Electrotechnique de Grenoble, INPG, in 1999.
He was a Postdoctoral Student with the Centerfor Power Electronics Systems, Blacksburg, VA,USA, in 1999, where he was involved in researchon system integration. In 2001, he was hired by
the National Center for Scientific Research, Paris, France, as a full-timeResearcher in power electronics. His current research interests include systemand functional, hybrid, and monolithic integration and packaging for medium-to-high-voltage active devices, and applications to the management of multi-cell systems, such as PV, batteries, and distributed systems.
Related Documents