Doctoral Dissertation Resources protection: towards replacement of cotton fiber with polyester By Edwin Kamalha * * * * * * Supervisors Prof. Roberta Bongiovanni Assoc. Prof. Ada Ferri Prof. Ludovic Koehl Prof. Christine Campagne Prof. Yan Chen Prof. Jinping Guan Politecnico di Torino, Italy Université de Lille, France Soochow University, China Torino, 28 May 2019

Welcome message from author
This document is posted to help you gain knowledge. Please leave a comment to let me know what you think about it! Share it to your friends and learn new things together.
Transcript

Doctoral Dissertation
Resources protection: towards
replacement of cotton fiber with
polyester
By
Edwin Kamalha * * * * * *
Supervisors Prof. Roberta Bongiovanni
Assoc. Prof. Ada Ferri
Prof. Ludovic Koehl
Prof. Christine Campagne
Prof. Yan Chen
Prof. Jinping Guan
Politecnico di Torino, Italy
Université de Lille, France
Soochow University, China
Torino, 28 May 2019

POLITECNICO DI TORINO
Doctoral Dissertation
PhD in Chemical Engineering (XXX Cycle)
Resources protection: towards
replacement of cotton fiber with
polyester
By
Edwin Kamalha* * * * * *
Supervisors Prof. Roberta Bongiovanni
Assoc. Prof. Ada Ferri
Doctoral Examination Committee: 1. Prof. Maurizio Galimberti, Politecnico di Milano (President)
2. Prof. Silvia Vicini, Università Degli Studi di Genova (Referee)
3. Prof. Adolphe Dominique, Université de Haute Alsace (Referee)
4. Prof. Alessandra Vitale, Politecnico di Torino (Member)
5. Prof. Lichuan Wang, Soochow University (Member)
6. Prof. Roberta Bongiovanni Maria, Politecnico di Torino
7. Prof. Ludovic Koehl, ENSAIT (Thesis Director)
8. Prof. Ada Ferri, Politecnico di Torino (Thesis Codirector)
9. Prof. Christine Campagne, ENSAIT
28 May, 2019

i
Declaration
I hereby declare that, the contents and organisation of this dissertation constitute
my own original work and does not compromise in any way the rights of third
parties, including those relating to the security of personal data.
……………………………….....
Edwin Kamalha
Turin, May, 2019

i
Abstract
In 2006/2007, and later in 2008/2009, the world experienced a peak in the global
production of cotton. However, there is increasing annual demand for cotton due
to world population growth and changes in consumers’ purchasing behavior.
Cotton fiber has the widest acceptance in apparel due to several desirable
properties (e.g mass and heat transfer, and sensory properties among others)
compared to synthetic fibers. The growing demand in consumption continuously
exerts pressure on resources for natural fibers, especially cotton. Apart from
ecological concerns with conventional cotton production and engineering (such as
land requirements, use of pesticides, water requirements and wet processing and
finishing), there is more concern as more cotton farmland is being rechanneled to
more profitable ventures such as real estate, transport and settlements. Other
natural fiber options such as wool, flax, linen and silk among others, are produced
in very meager proportions, globally that they cannot fill the gaps in demand and
the unpredictable future of cotton supply. Polyester, in the form of poly(ethylene
terephthalate) (PET) has qualities that could address this concern. With several
desirable properties such as tenacity, strength, light weight, and easycare,
polyester brings interesting properties for apparel purposes as well as furnishing.
Unfortunately, except for sportswear, consumers are reluctant to wear 100%
polyester clothing mainly because of its inferior sensory comfort, touch and
sometimes appearance.
This study seeks to find ways of improving polyester fabric characteristics in
order to decrease the gap between human perception of cotton vs. PET;
specifically the sensory perception and hydrophilic performance in comparison
with similar aspects of cotton fabrics. This study focuses on three main subjects:
1. Sensory study of cotton and polyester fabrics to identify the main
distinguishing attribute between PET and cotton fabrics, using sensory
analysis.
2. Chemical functionalization of PET fabrics to introduce a sensory
perception similar to that in cotton fabrics (bridging between PET and
cotton fabrics).
ii
3. Sensory evaluation of cotton fabrics, untreated PET fabrics and chemically
functionalized PET fabrics
4. Enhancement of the hydrophilic property of PET fabrics through photo-
initiated polymer grafting.
First, using sensory analysis, the sensory patterns of knitted and woven fabrics
were studied to determine the suitability of samples. The fabric samples included
plain and twill fabrics (for woven) of different structures, and interlock and single
jersey fabrics (for knitted) of different structures. It was found that knitted fabrics
are profiled differently from woven fabrics. Thus, approaches to enhance the
sensory perception of knitted fabrics would be different from those of woven
fabrics. For a manageable scope, this study proceeds to experiment with woven
fabrics of different structures. Objective measurements were also performed for
properties defining sensory attributes. The influences of yarn and fabric
construction were factored in the analysis of sensory perception and the measured
attributes. For example, the weave density, which compounds the yarn fineness
and threads per inch were found to significantly (p≤0.05) influence the stiffness
properties of woven fabrics.
To determine the disparity between cotton and PET woven fabrics, a multisensory
study was undertaken. A 12 judges’ panel was used to rank six cotton and
polyester woven fabrics for 11 sensory descriptors. Rank aggregation and
weighting were performed using cross-entropy Monte Carlo (CE) algorithms,
Genetic algorithms (GA), and the Borda count (BK) technique. The quality of the
sensory panel was studied using ANOVA and consonance analysis. Principle
component analysis (PCA) and unsupervised agglomerative hierarchical
clustering (AHC) were used to study and profile sensory relationships. The largest
Euclidean distance (dissimilarity) was found between fabrics of dissimilar
generic. The descriptor crisp accounted for the highest variability between PET
and cotton fabrics (p≤0.05). To replace cotton with PET via this sensory
approach, the modification of stiffness of polyester fabrics was judiciously
suggested. For the fabrics studied, it was deduced that visual aesthetics can be
used to distinguish between PET and cotton fabrics. It is also underscored that
cotton and polyester fabrics can be distinguished via their sensory attributes and
that the sensory behavior of fabrics can be predicted on the basis of fiber content.
However, fiber content does not influence sensory perception independently, but
rather with other factors such as weave type and type of finishing.
To bridge between the perceived sensory properties of polyester and cotton
fabrics, the stiffness of polyester fabrics was modified. NaOH and an amino-
functional polysiloxane softener, with atmospheric air plasma pre-oxidation were
used. Sensory evaluation was then carried out using a panel of 14 judges, for 11
sensory descriptors. Rank aggregation, sensory clustering, dissimilarity analysis

iii
and profiling were then carried out. NaOH and softening treatment of polyester
bridged between cotton and one of the three polyester fabrics studied.
Polyester fabrics treated with NaOH and the silicon softener were perceived soft,
smooth, less crisp, and less stiff compared to untreated polyester fabrics.
However, cotton fabrics were still perceived natural compared to any polyester
fabrics. Using the Ciro-FAST system and other appropriate testing equipment,
objective measurements were carried out on all fabrics studied. The Moisture
Management Tester was also used to study the in-plane moisture behavior of the
fabrics. Although NaOH-treated PET fabrics had enhanced air permeability and
hydrophilicity, they also presented degradation; loss in weight— accompanied
with reduced abrasion resistance and bursting strength. As expected, NaOH-
treated polyester fabrics later became hydrophobic and less air-permeable when
the silicon based softener was added. It is deduced that characterization of human
perception can play a vital role in human centered production of fabrics,
particularly in finishing. A better understanding of fabric sensory perceptions was
realized by integrating sensory analysis data with objective measurements data.
Using correlation analysis, clustering and profiling, the relationship between
instrumental (objective) measurements was studied. Only a few sensory attributes
were precisely expressed by instrumental measurements. Hand attributes were
more expressed by fabric mechanical and surface attributes. The profiling of
fabrics indicates that conventional PET fabrics can be distinguished from
conventional cotton fabrics using both subjective and objective evaluation, by
selected attributes. It is also argued that human evaluation and objective
measurements present varying dimensions for sensory analysis. It is further
deduced that textile human sensory perception cannot be directly represented by
instrumental measurements.
The final part of the study investigates and compares the hydrophilic potential and
efficacy of two vinyl monomers applied by photo-grafting on the surface of
polyethylene terephthalate (PET) fabric. Two monomers: Poly-(ethylene glycol)
diacrylate (PEGDA) and [2-(methacryloyloxy) ethyl]-trimethylammonium
chloride (METAC) were used separately, with 2-hydroxy-2-methyl-1-phenyl-1-
propanone (HMPP) as the radical photo initiator. Surface study of the grafted PET
was confirmed using X-ray photoelectron spectroscopy (XPS) and Energy
Dispersive Spectroscopy (EDS). Water contact angle (WCA) measurements and
dynamic moisture management tests (MMT) indicate that PEGDA and METAC
induce complete wetting of PET at concentrations 0.1-5% (V:V). The grafted PET
fabrics remain hydrophilic following testing by washing, crocking drycleaning
tests. PEGDA grafted fabrics perform better than METAC grafted fabrics, as
static water contact angles of METAC grafted fabrics increase after washing.
Colorimetric measurements (K/S and CIELAB/CH) and color on dyed PET
fabrics suggest that both monomers greatly improve the dyeing efficiency of PET.

iv
Grafted PET fabrics presented strong fastness properties, slightly better than the
reference PET fabric. The hand and appearance of grafted PET fabrics remains
largely unchanged, following drycleaning and laundering procedures. This study
demonstrates the potential of PEGDA and METAC for a hydrophilic function in
conventional textiles utilizing UV grafting. It is suggested that PEGDA and
METAC generate hydrophilic groups on PET; the macroradicals are in a form of
vinyl structures which form short chain grafts and demonstrate hydrophilic
function at the tested concentrations.
This study contributes to research on hydrophilic functionalization of PET. The
studied monomers have not been used elsewhere in the hydrophilic enhancement
of fabric for apparel purposes. The results of this research can play a practical
guiding role in the design of fabrics, sensory property design and contribute to the
development of cotton-like polyester fabrics.
Keywords
Polyester (PET) and cotton, woven fabrics, knitted fabrics, photo-grafting,
wettability, contact angle, moisture management, photo-initiator, hydrophilicity,
polyester dyeing, sensory evaluation, knitted fabrics, ranking, rank aggregation,
principal component analysis (PCA), clustering, dissimilarity, Euclidean distance,
softening, alkali hydrolysis, stiffness, performance, agglomerative hierarchical
clustering (AHC), FAST, surface modification, subjective evaluation, objective
evaluation, finishing, chemical finishing, NaOH treatment, EDX/EDS, XPX,
SEM, MMT, water contact angle
v
Acknowledgment
This research work is a result of mobility and studies in three Universities:
ENSAIT- Roubaix, Lille 1 University of Science and Technology in France,
Politecnico Di Torino in Italy, and Soochow University in China. The study was
possible with funding from the European Commission, under the Joint Doctoral
programme—Sustainable Management and Design for Textiles and China
Scholarship Council for the final study mobility. I am very grateful for this
scholarship and to the host Institutions.
The successes and achievements in this work have been a result of concerted
efforts, contributions and advice of various persons. Firstly, I would like to extend
gratitude to my Supervisors: Prof. Ludovic Koehl, Prof. Christine Campagne,
Prof. Ada Ferri, Prof. Roberta Bongiovanni, Prof. Yan Chen, and Prof. Jinping
Guan for their unending support, encouragement, advice and patience with me.
You were so kind to me from the inception through the end of my study. Thank
you for professionally working with me, in addition to the help with my
integration procedures. In the same line, I would like to extend gratitude to Prof.
Xianyi Zeng, the Programme Coordinator for his unwavering professional
assistance and continued advice.
I am also indebted to the assistance of Dr. Roberta Peila and Dr. Monica
Periolatto of Polito for experimental tutorials. I specially thank laboratory
personnel: Christian Cartel of ENSAIT, Julliet at CNR- Biella, and Gianluca
Migliavacca of Citta Studi- Biella for their help with equipment and experiments.
Special thanks go to Administrators- Dorothee Mecier and Samira Dahman of
ENSAIT and Laura Rognone of Polito, who handled my several registration and
procedural requirements. Sincere thanks to Dr. Lichuan Wang for the good
coordination and support during my mobility at Soochow University. In the same
vein, I thank Mr. Xu for the great help with my integration, travels and several
inquiries at Soochow. To my colleagues in the SMDTex programme; Razia
Hashemi, Yanic Hong, Ke Ma, Manoj Paras and Parag Bhavsar, the memories
will live on. I am blessed to have met you all as you impacted on my life. I thank
the many friends I met along this journey: Kaixuan, Tarun, May, Jagadish, Sohail,
Neeraj, Hossein, Carlo, Massimo, Constance, Boris, and Laurent, Eugene!
To my beloved parents, my wife, and children, you are such a blessing to me.
Edwin Kamalha

vi
I would like to dedicate this thesis to my loving family and parents

vii
Contents
1. General introduction and aim ............................................................................ 1
1.1 Background ........................................................................................ 1
1.2 Global fiber market; the fluctuating and reducing share of cotton .... 2
1.3 Consumer apparel perceptions and preference; cotton against
manmade fibers .................................................................................................... 3
1.4 Cotton versus polyester; ecological and economic sustainability ..... 5
1.5 The hand and wetting of polyester fabrics ......................................... 6
1.6 NaOH hydrolysis of polyester ........................................................... 6
1.7 Surface photo-grafting of polyethylene terephthalate ....................... 8
1.8 Sensory analysis in textiles ................................................................ 9
1.9 Mining of textile sensory data ......................................................... 10
1.9.1 Principal component analysis (PCA) ........................................... 11
1.9.2 Agglomerative hierarchical clustering (AHC) ............................. 11
1.10 Aim of the study ............................................................................. 12
2. The sensory disparity between cotton and polyester woven fabrics ................ 13
2.1 Overview ............................................................................................... 13
2.2 Materials and Methods .......................................................................... 13
2.2.1 Materials ......................................................................................... 13
2.2.2 Methods .......................................................................................... 14
2.3 Results and Discussion .......................................................................... 18
2.3.1 Descriptors generated by the sensory panel .................................... 18
2.3.2 Ranks and rank aggregation ............................................................ 19
2.3.3 Performance of the sensory panel ................................................... 21
2.3.4 Reducing the sensory descriptors to a significant six ..................... 27
2.3.5 Correlation and PCA of the leading sensory attributes ................... 28

viii
2.3.6 Dissimilarity of PET and cotton woven fabrics .............................. 30
2.3.7 Sensory profiles of woven fabrics .................................................. 31
2.4 Conclusions ........................................................................................... 33
3. Sensory analysis of cotton and functionalized polyester woven fabrics ......... 35
3.1 Overview ............................................................................................... 35
3.2 Materials and methods ........................................................................... 36
3.2.1 Materials ......................................................................................... 36
3.2.2 Methods .......................................................................................... 36
3.3 Results and discussion ........................................................................... 42
3.3.1 Wetting of plasma modified PET ................................................... 42
3.3.2 Stiffness of PET and cotton fabrics ................................................ 43
3.3.3 Rank lists and rank aggregation ...................................................... 44
3.3.4 Performance of the sensory panel ................................................... 46
3.3.5 Sensory relationships and the dissimilarity between cotton and
functionalized PET woven fabrics .................................................................. 49
3.3.6 Physical and performance properties of functionalized PET fabrics
........................................................................................................................ 57
3.4 Conclusions ........................................................................................... 66
4. Sensory analysis of cotton and polyester knitted fabrics ................................. 67
4.1 Overview ............................................................................................... 67
4.2 Materials and methods ........................................................................... 67
4.2.1 Materials ......................................................................................... 67
4.2.2 Methods .......................................................................................... 68
4.3 Results and discussion ........................................................................... 69
4.3.1 Ranks and rank aggregation ............................................................ 69
4.3.2 Relationship between knitted fabric parameters and subjective
evaluation ....................................................................................................... 70
4.3.3 Significant sensory descriptors ....................................................... 70
4.3.4 Clustering and dissimilarity of knitted fabrics ................................ 72
4.4 Conclusions ........................................................................................... 73
5. Subjective Vs objective valuation of cotton and polyester woven fabrics ...... 74
5.1 Overview ............................................................................................... 74
5.2 Materials and Methods .......................................................................... 74

ix
5.2.1 Materials ......................................................................................... 74
5.2.2 Methods .......................................................................................... 75
5.3 Results and discussion ........................................................................... 76
5.3.1 Objective measurements ................................................................. 76
5.3.1 Correlation between objective and subjective attributes ................ 77
5.3.2 Sensory clustering and profiling by subjective versus objective data
........................................................................................................................ 80
5.3.3 Clustering of fabrics by subjective and objective evaluation ......... 81
5.4 Conclusions ........................................................................................... 83
6. Radically photo-grafted PET woven fabric; Moisture, surface and dyeing
properties ......................................................................................................... 84
6.1 Overview ............................................................................................... 84
6.2 Materials and methods ........................................................................... 85
6.2.1 Materials ......................................................................................... 85
6.2.2 Methods .......................................................................................... 86
6.3 Results and discussion ........................................................................... 89
6.3.1 Wetting of untreated fabrics ........................................................... 89
6.3.2 Effect of UV irradiation on the wettability of PET fabrics ............. 90
6.3.3 Effect of PEGDA and METAC grafting on the wettability of PET
fabric ............................................................................................................... 90
6.4.4 Durability of grafted monomers ..................................................... 94
6.3.5 Surface analysis of untreated PET and grafted fabrics ................... 96
6.3.6 Surface analysis of fabrics after washing and wet rubbing ............ 99
6.3.7 Color strength parameters of dyed PET fabrics ............................ 101
6.3.8 Appearance and hand of grafted fabrics after laundering and
drycleaning ................................................................................................... 102
6.3.9 Colourfastness of dyed fabrics ...................................................... 103
6.4 Conclusions ......................................................................................... 103
7. General conclusions and future work ............................................................ 105
7.1 General conclusions ............................................................................. 105
7.3 Recommendations for future work ...................................................... 107
8. References ...................................................................................................... 109
9. Appendix ........................................................................................................ 120

x
Sensory evaluation tools ............................................................................ 120
Individual identified fabric characteristics (descriptors of perceptions) 120
Bridged listing of sensory descriptors ................................................... 121
Ranking of fabrics for descriptors: knitted fabrics ................................ 122
Ranking of fabrics for descriptors: woven fabrics ................................. 122
Protocol for sensory evaluation ............................................................. 123

xi
List of Abbreviations
PET- Poly (ethylene terephthalate)
CI- Cotton Incorporated
CCI- Cotton Council International
GA- Genetic algorithim
CE- Cross Entropy
BK-Borda Kendall Borda Count)
METAC- (methacryloyloxy) ethyl]-trimethylammonium chloride
PEGDA- Poly-(ethylene glycol) diacrylate
HMPP- 2-hydroxy-2-methyl-1-phenyl-1-propanone
XPS- X-ray photoelectron spectroscopy
EDS- Energy Dispersive Spectroscopy
WCA- Water contact angle
MMT- Moisture management tester
FAST- Fabric assurance by simple testing


1
Chapter 1
General introduction and aim
1.1 Background
In 2006/2007 and later in 2008/2009, the world experienced a peak in the global production of
cotton. However, there is increasing annual demand for cotton due to world population growth
and changes in consumers’ purchasing behavior. Cotton fiber has the widest acceptance in
apparel due to several desirable properties (e.g mass and heat transfer, and sensory properties
among others) compared to synthetic fibers. It was recently reported in the Sourcing Journal that
cotton demand would hit an all-time high in late 20181. The growing demand in consumption
continuously exerts pressure on resources for natural fibers, especially cotton. Apart from
ecological concerns with conventional cotton production and engineering (such as land
requirements, use of pesticides, water requirements and wet processing and finishing), there is
more concern as more cotton farmland is being rechanneled to more profitable ventures such as
real estate, transport and settlements. Other natural fiber options such as wool, flax, linen and
silk among others, are produced in very meager proportions, globally that they cannot fill the
gaps in demand and the unpredictable future of cotton supply. Polyester, in the form of
poly(ethylene terephthalate) (PET)has qualities that could address this concern. With several
desirable properties such as tenacity, strength, light weight, and easycare, polyester brings
interesting properties for apparel purposes as well as furnishing. Unfortunately, except for
sportswear and sometimes in Fast Fashion, consumers are reluctant to wear 100% polyester
clothing mainly because of its inferior sensory comfort, touch and sometimes appearance.
Therefore, this study seeks to improve polyester fabric characteristics in order to decrease the
gap between human sensory perception and hydrophilic character of PET against cotton.

2
1.2 Global fiber market; the fluctuating and reducing
share of cotton
As the global demand for cotton fiber grows annually, supply statistics point to a declining
market share for cotton. Despite a steady production, the proportion of global fiber consumption
of cotton has gradually fallen from over 80% in the early 1950’s, to about 32% presently, in
favor of polyester (PET), currently at about 58%2. Figure 1.1 shows global fiber production and
forecast through 1980-2025.
Figure 1.1 Projection of global fiber production through 1980-20253. Copyright Tecnon OrbiChem; Reproduced with
permission.
This demonstrates the growing prominence of polyester and the gradual substitution of cotton in
several applications. For decades, polyester has also had the largest share of the global synthetic
fiber market, peaking at 82% in 20152.
Polyester also competes with cotton in global apparel market share, both averaging between
31% and 36% since 20104,5
. As pressure on farming land increases, the future of cotton could be
uncertain, with a predicted decline in the global market share to about 21%, while polyester is
anticipated to peak to about 70% by 20253,5,6
. For four consecutive marketing years, global
cotton demand was lower than actual supply, until 2015/16 when a deficit of 15 million bales
was recorded. A further decrease in production was recorded for the 2016/2017 marketing year.
These were argued on reduced cotton prices, poor farming conditions and excess stocks7. Global
cotton consumption in 2017-18 is also projected to rise by 5%, to 120.4 million bales, according
to latest US Department of Agriculture (USDA) statistics. The rise in cotton demand is attributed
to the reduction in global polyester production, the rising cotton mill use, and expanding global
economy8,9
. Figure 1.2 presents trends and forecasts for global cotton production and
consumption, along with price.

3
Figure 1.2 Global cotton production, consuption, and prices
USDA has projected a new record high in world cotton mill use in the 2018/19 marketing year1,
with a 3.9% increase in global consumption from the 2017/2018 period. Compared to the
2015/16 cotton year, cotton mill use is projected to increase in China (18%), India (2%), Pakistan
(4%) and Bangladesh (27%). The projection is very remarkable for Vietnam at 67%.
The versatility in applications, in addition to some performance properties (such as high abrasion
resistance, tensile strength, lightweight, resistance to attack by many chemicals, dimensional
stability, high degree of resistance to creasing, and excellent resistance to photochemical
degradation10,11
, account for polyester’s grown prominence. Polyester is also well priced
compared to many other synthetic and natural fibers including cotton12
1.3 Consumer apparel perceptions and preference;
cotton against manmade fibers
Today’s competitive apparel market calls for manufacturers to recognize changing patterns in
consumer preferences. Today’s interpretation of quality compounds important associated
elements of total quality of apparel materials such as a fabric’s ability to provide protection from
cold or hot weather, tactile sensation, fit, lifecycle details, and several varying consumer
emotional or psychological needs.
When apparel users talk about their preferred wear, they mention comfort, fit and that the item
makes them look or feel good; and that usually, their favorite apparel is made of cotton13
. The
wider application of cotton in a range of apparel products is partly due to the desirable
physiological and sensory comfort perceived with cotton fabrics. According to a Cotton
Incorporated’s 2015 Lifestyle Monitor survey carried out in the US, 29% of respondents cited
jeans as their favorite apparel13
. These were followed by tees, active bottoms and casual pants by
15%, 9%, and 8% respectively. Comfort was mentioned by 47% of the wearers, as the main
reason for their choices. 14% said they preferred the garments for the fit, while 14% said that
they made them look and feel good. In the same Lifestyle Monitor survey, a similar question
revealed that over respondents favored cotton and cotton blends for the making of their jeans
4
(96%), tees (96%), socks (93%), casual shirts (91%), underwear (89%), pajamas (86%), dress
shirts (78%), casual slacks (74%), and activewear (65%). A significant proportion of respondents
generally asserted that quality garments are made from all natural fibers like cotton. Consistently
over time, and recently it has been reported that most global wearers say cotton and cotton
blends are best suited for today’s fashions.
Earlier in 2004, a Global Lifestyle Monitor survey carried out by Cotton Incorporated (CI) and
Cotton Council International (CCI), with respondents from Brazil, China, Colombia, Germany,
Hong Kong, India, Italy, Japan, and the United Kingdom, found an overwhelming preference for
cotton fiber14
. Compared to a their preceding survey of 2001, it was noted that fiber type/content
had gained more prominence as an important factor in apparel purchase; 50% of the interviewed
consumers preferred clothing made of natural fibers, and that 60% of the consumers cited
preference for apparel made of cotton rather than other fibers. Two-thirds of respondents said
they prefer to avoid synthetic fibers, and that 67% would find out the fiber content of clothing
before purchasing. Followed by India, Hong Kong had the highest percentage of consumers with
cotton preference among the surveyed countries.
According to a market survey by CCI and CI, growth in consumer interest in fiber content had
surged by 2011, especially in the fast growing markets15
. With interviewee sample sizes above
500, for each country, Italy and India posted 95% and 86% respectively, for consumers
interested in fiber content. In Brazil, 85% of respondents indicated this interest, while Chinese
consumers stood at 83%. The 2011 survey indicated that 85% of global consumers preferred
cotton and cotton blends for their garments, and that the majority of consumers in all countries
surveyed preferred cotton clothing. 96% of Chinese consumers associated cotton garments with
comfort and softness, while 92% associated cotton clothing with natural and breathable. In India,
cotton was found in 87% of men’s clothing compared to 83% in women’s clothing. The survey
also noted that 75% of apparel on US retail stalls contained cotton, and that cotton was higher in
men’s garments (85%) compared to women’s (68%). Jeans, shorts and knitted shirts accounted
for the highest cotton presence with 99%, 92% and 82% respectively. The lowest cotton presence
was in outerwear (46%), skirts (46%), athletic apparel (37%), and dresses (34%). Price was not a
hindering factor for cotton clothing purchases. More than half of global consumers are willing to
pay an extra to keep cotton from being substituted for synthetic fibers in their clothing. Even in
apparel where synthetics dominate, such as sports apparel, several consumers would pay extra
for cotton moisture management athletic apparel. 90% of consumers are willing to purchase
cotton athletic apparel that wicks moisture like synthetics. However, the market survey found
that of the 35% of athletic apparel with moisture management properties, only 12% of cotton
athletic apparel contained moisture management properties. With a slogan that “cotton is the
enemy” the brand Under Armour was established and succeeded on synthetics, thriving on
moisture management, especially for wicking15
.
Overall, consumers consider quality as the most popular deciding factor during clothing
purchase. The proportion of American consumers willing to pay for a premium for better quality
was at 68% in 1999 and 70% in 2001. More than six in every ten consumers associated cotton
clothing with higher quality compared to synthetic clothing15
.

5
1.4 Cotton versus polyester; ecological and economic
sustainability
In light of continued exploitation of resources and disposal of used items, it is also important that
cleaner methods are used to minimize environmental impacts. Economic sustainability in terms
of costs is also considered. Some consumers and economies are keen to promote these aspects.
The use of pesticides and herbicides in the cotton value chain, the usage of chemicals in
manmade fibers and the composition of textile dyes has increasingly come under scrutiny. A
growing number of consumers prefer their clothing produced close to home16,17
. Polyester fiber
and apparel are relatively priced lower compared to many other synthetics and natural fibers;
posting a ratio of about 0.6-0.8 compared to cotton12
.
Studies on life cycle assessment of cotton and polyester fabrics have reported findings in favor of
polyester, against cotton for, natural resources requirements- land, water, and location. Since
most of the global cotton is produced conventionally; entailing the use of irrigation, fertilizers
and pesticides, there are adverse ecological implications18,19
. Polyester can be produced in many
locations, and seasons unlike cotton, thus reducing the supply chain time and eco-footprints
associated with transport. The energy requirement to produce 1 Kg of cotton fabric requires less
energy and impacts less on fossil fuels compared to polyester, with an estimated ratio of about
1.5 (polyester to cotton). However, the production of a unit of 1 Kg of polyester fabric was found
to emit less carbon dioxide compared to cotton with a ratio of 0.818–21
. Moreover, the spinning of
polyester for fabrics provides a re-use medium for polyester waste from food and beverage
packaging, and waste fabrics among others. Polyester of several grades is obtained from
recycling of these waste materials. For instance, most PET extruded from PET waste is used for
coarse fibers utilized in fabrics for bags, denim, footwear and composites lately18,19,22,23
.
Therefore, the promotion of PET spinning is an avenue to cater for sustainable end-of-life
applications for PET waste from fabrics and other industries.
From the reviewed literature, the mass and heat transport behavior (breathability, wicking,
porosity, absorbance) of clothing, along with sensory attributes (such as soft feel, fit), among
others, have been largely found as preferred by consumers. Despite the several positives with
polyester fiber, the use of polyester in apparel is only common in blends, (mostly with cotton,
rayon, and wool), fast fashion-wear and sportswear. This is, among others, due to inferior
sensorial comfort and poor heat and mass transfer attributes of polyester24
. While there are
several other requirements of apparel, this study focuses on the enhancement of the user sensory
perception and moisture management of polyester fabrics through chemical functionalization.
Sensory evaluation and sensory data mining were used to identify the key sensory attributes that
distinguish cotton fabrics from polyester fabrics, and to also determine the gap between cotton
and polyester fabrics. NaOH and an amino functional polysiloxane softener were used to modify
the hand property of polyester fabrics in comparison with cotton fabrics. Radical photo-grafting
was used to modify the surface of polyester fabrics using two monomers, separately, to introduce
hydrophilicity.
6
1.5 The hand and wetting of polyester fabrics
Polyester is a synthetic fiber composed of at least 85 percent by weight of an ester of dihydric
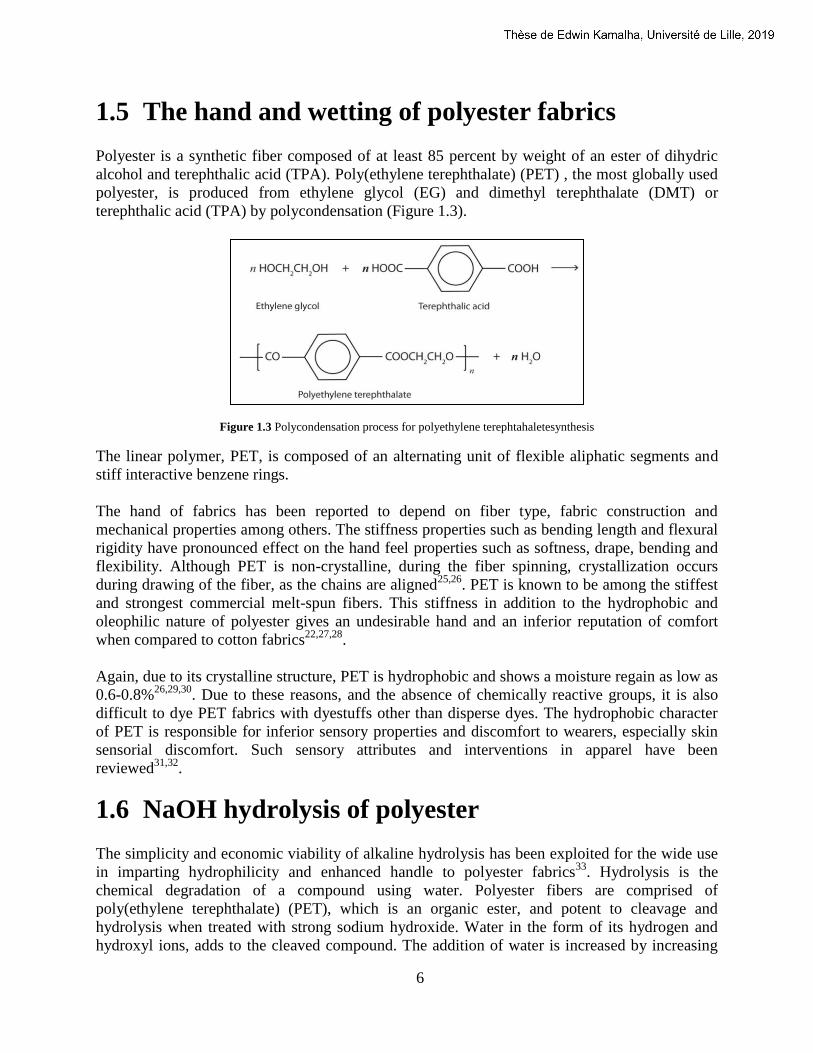
alcohol and terephthalic acid (TPA). Poly(ethylene terephthalate) (PET) , the most globally used
polyester, is produced from ethylene glycol (EG) and dimethyl terephthalate (DMT) or
terephthalic acid (TPA) by polycondensation (Figure 1.3).
Figure 1.3 Polycondensation process for polyethylene terephtahaletesynthesis
The linear polymer, PET, is composed of an alternating unit of flexible aliphatic segments and
stiff interactive benzene rings.
The hand of fabrics has been reported to depend on fiber type, fabric construction and
mechanical properties among others. The stiffness properties such as bending length and flexural
rigidity have pronounced effect on the hand feel properties such as softness, drape, bending and
flexibility. Although PET is non-crystalline, during the fiber spinning, crystallization occurs
during drawing of the fiber, as the chains are aligned25,26
. PET is known to be among the stiffest
and strongest commercial melt-spun fibers. This stiffness in addition to the hydrophobic and
oleophilic nature of polyester gives an undesirable hand and an inferior reputation of comfort
when compared to cotton fabrics22,27,28
.
Again, due to its crystalline structure, PET is hydrophobic and shows a moisture regain as low as
0.6-0.8%26,29,30
. Due to these reasons, and the absence of chemically reactive groups, it is also
difficult to dye PET fabrics with dyestuffs other than disperse dyes. The hydrophobic character
of PET is responsible for inferior sensory properties and discomfort to wearers, especially skin
sensorial discomfort. Such sensory attributes and interventions in apparel have been
reviewed31,32
.
1.6 NaOH hydrolysis of polyester
The simplicity and economic viability of alkaline hydrolysis has been exploited for the wide use
in imparting hydrophilicity and enhanced handle to polyester fabrics33
. Hydrolysis is the
chemical degradation of a compound using water. Polyester fibers are comprised of
poly(ethylene terephthalate) (PET), which is an organic ester, and potent to cleavage and
hydrolysis when treated with strong sodium hydroxide. Water in the form of its hydrogen and
hydroxyl ions, adds to the cleaved compound. The addition of water is increased by increasing

7
the concentration of hydrogen or hydroxyl ions through the addition of acid or base— which
increases the rate of hydrolysis25,34
. Acidic or basic catalysts can enhance the hydrolysis of
esters. The hydrolysis reaction of NaOH with PET is commenced by an attack of a hydroxyl ion
on the electron deficient carbonyl carbon atom of the ester linkages. The carboxyl group formed
then converts into a carboxylate anion and the reaction goes on until complete hydrolysis is
reached. It is suggested that the alkali randomly acts at the surface of the fiber, attacking
carboxyl groups of the polymer molecule and hydrolyses them as short chains of disodium
terephthalate11,35
. Owing to the removal of fiber material in the form of short chains, the fiber
suffers a loss in weight.
A cotton-like or silky hand has particularly been noted after NaOH treatment of polyester
fabrics, associated with morphological changes, although maintaining a circular cross-section of
fibers, while also creating polar groups at the fiber surface11,33,35–38
. Treatment with NaOH
reduces the regular filaments of fabrics to finer deniers, leaving scars on the surface of the
filament. This gives fabrics with a silky appearance and touch. Polyester fabrics produced by this
treatment exhibit irregularity comparable to natural silk fabrics; with a silk-like soft touch, good
drape and reduced stiffness. Previous studies have also deeply examined, among others, the
morphological, physiochemical, and mechanical changes associated with NaOH treatment of
polyester. The concentration and duration of NaOH treatment on polyester have been noted as
the main parameters that influence the treated fabric properties39
.
Application of softeners after NaOH treatment of polyester has been found to enhance the
smoothness, softness, and to reduce associated harshness40
. Softeners for fabrics exist in a wide
range of classes and also offer added functionality, in addition to handle modification. Many
anionic, cationic and non-ionic softeners also add anti-static or hydrophilic properties. Nonionic
softeners are argued for stability to temperatures, and resistance to yellowing41,42
. They are thus
suitable for finishing bleached or whitened fabrics40,43
. The substantivity of nonionic softeners is
not distinctive since they do not carry any electrical charge. Padding, followed by curing is the
main process of applying nonionic softeners onto fabrics. Amino functional silicones are known
for distinct smoothening and softening properties compared to all other groups of softeners43
.
They can be made into micro and semi-micro emulsion recipes using specially selected
emulsifying combinations. Additionally, softeners have been found to enhance some
performance properties of polyester fabrics, such as the
elastic resilience, crease recovery, abrasion resistance, sewability, and tear strength. Silicone
softeners particularly enhance durable press performance and maintain mechanical properties
and durability, compared to cationic softeners40
. The elastic silicone polymer network entraps
fibers within its matrix— thus improving the fabric’s wrinkle recovery ability. The high
molecular flexibility of the silicone chain confers low glass transition temperature (about –100
°C) and unique softness to fabrics finished with silicone softeners. During curing, silicone bonds
with fabric and also forms a cross-linking network due to self-polymerization44
. The
pretreatment of polyester with atmospheric air plasma was fund to increase the reactivity with
NaOH and the substantivity of softeners; and also improves the wrinkle recovery angles much
more than in the absence of plasma pre-treatment40,44–46
.
The use of heat (boiling or heat-setting), enzymes33,47–51
and oxidizing chemicals52
has also been
explored to produce polyester fabrics with a cotton-like hand and enhanced wettability.
8
However, these methods have been found less effective and costly as they consume large
quantities of reagents and require longer treatment times44
.
Earlier studies on the modification of polyester largely focused on the production of ‘silk-like’
fabrics. Recently, ‘cotton-like’ fabrics have also been produced but the application has been on a
limited scope. The sensory evaluation of polyester fabrics, towards the replacement of cotton
fiber, has not been studied. Attempts have mainly focused on objective measurements, which
hardly reflect end-user perception. Understanding the human sensory perception of NaOH
hydrolyzed polyester fabrics would aid in optimizing process parameters. Considering the
several desirable properties of polyester fabrics, ‘cotton-like’ polyester fabrics with enhanced
comfort would transform the chemical fiber and apparel industry in view of replacement of
cotton fiber with polyester. A most recent publication on alkali treatment of PET for cotton-like
properties reported on four aspects of the wearable ability53
. Through objective and subjective
tests, the handle and luster of treated fabrics were found close to those of cotton fabrics.
Optimal parameters were noted to be: an alkali concentration of 25 g/l, treatment time of 50
min, bath ratio of 1:15 and treatment temperature of 110 °C. In 2013, Laijiu’s group10
reported
on the porosity of knitted fabrics made from chemically modified polyester fibers, for cotton-
like properties.
Although there are other stages (fiber or yarn) at which cotton-like effects could be introduced in
polyester textiles, the costs of producing special raw fibers, combining and modifying filaments
may be incomparable to the processing costs of NaOH treatment, on fabrics. Again, most often,
specially processed fibers and yarns undergo alkaline treatment as a cleaning stage. In this study,
NaOH treatment, preceded by plasma oxidation was carried out on three polyester woven
fabrics. The concentration and temperature of treatment were fixed; however, varied for the
different fabric structures, following an experimental pilot. A commercial amino functional
silicon softener was applied on selected NaOH treated polyester fabrics. The functionalized and
untreated (reference) PET fabrics were then subjected to a sensory evaluation and objective
measurements, along with cotton fabrics evaluated.
1.7 Surface photo-grafting of polyethylene
terephthalate
At industrial scale, alkaline treatment of PET has been used for decades to improve PET fabric
wettability and wicking. However, alkaline hydrolysis of PET induces a controlled degradation
of the fabric usually accompanied by loss in fabric strength and weight33,54
. Alternative
treatments with less profound effect on PET mechanical properties are thus preferable. Graft
copolymerization offers an approach to functionalize polymers such as PET. For grafting on a
polymer surface, ionic chemical groups or free radicals are formed either on the polymer
backbone, or on the monomer to be grafted. This may be achieved by decomposition of a
chemical initiator triggered by ultraviolet light or high energy radiation55
.
Photo-grafting possesses several advantages over conventional thermal, oxidative, and
evaporative methods. The advantages of photo-grafting include: reduced overall costs, high
productivity, less space requirement, enhanced safety with omission of volatile reagents, lower

9
energy requirements, and environmental sustainability56,57
. In photo-grafting, UV irradiation in
the presence of a radical photo-initiator generates free radicals which can abstract hydrogen
atoms from the substrate polymer, yielding active sites for grafting and initiating a chain growth
from the substrate surface. At the same time, the generated free radicals can also promote
homopolymerisation of the monomers55,58
. Several examples of photo-initiated grafting reactions
have been reported for different purposes, such as: photo-grafting of poly(ethylene glycol
methacrylate) and glycidyl methacrylate on PTFE for reduced surface adsorption and increased
conductivity respectively;59,60
poly(3-hydroxyoctanoate) and methoxy poly(ethylene glycol) for
antitumor drug delivery of paclitaxel;61
. A review by Neugebauer62
focused on PEO graft
copolymers and their applications. The graft density and yield were reported to increase with
increasing UV irradiation time and the macro-monomer concentration63
. With UV-initiated
grafting, hydrophilic and antistatic properties of PET fabrics were greatly enhanced using
acrylamide, poly(ethylene glycol) methacrylate, 2-acrylamide-2-methyl propane sulfonic acid,
and dimethyl aminoethyl methacrylate vinyl monomers64
.
In this research, UV-grafting of two vinyl monomers, separately, on PET fabric was attempted.
The potential to enhance wetting and dyeing of PET by the selected monomers has been studied.
The monomers selected were PEGDA (H2C=CHCO(OCH2CH2)nO2CCH=CH2) and METAC
(H2C=C(CH3)CO2CH2CH2N(CH3)3Cl). PEGDA is a PEG-based monomer with an acrylate
function as end group of the PEG linear chain65,66
. In the presence of a photo-initiator and UV
light, PEGDA gels quickly, at room temperature. PEGDA gels are hydrophilic, elastic, of high
modulus and are inert. Common applications of PEGDA include: adhesives, coatings, sealants,
photoresists, solder masks and photopolymers65,67
. METAC is a quaternary ammonium salt that
contains one acrylic reactive function. METAC is commonly used as an intermediary in the
production of polymers such as polyelectrolites. METAC also possesses antimicrobial
properties; thus, METAC functionalized fabrics could offer an associated antimicrobial function
that could inhibit control odor associated with PET fabrics 68,69
. The changes in wetting and
dyeing of PET, following photo-grafting of PEGDA and METAC were evaluated. This study
was motivated by: i) the merits of using UV as a cure method compared to other conventional
methods already mentioned ii) the use of PEGDA and METAC, which have never been used in
hydrophilic functionality of textiles; iii) as a basis to study other similar monomers, and
sustainable techniques to enhance wetting of polyester. The study findings suggest that PEGDA
and METAC are potential monomers for hydrophilic functionalization of PET with profound
enhancement of color depth.
1.8 Sensory analysis in textiles
In apparel design and development, sensory value addition isn’t an exception; it engulfs end-user
requirements with designers’ constraints. To perceive a quality of clothing, customers engage in
touch, vision and try-on of garments. This process generates and integrates various multi-
sensory, sentimental and cognitive experiences that partly inform buying decisions17,70
. When
appropriately defined, user preferences, sensory, hedonic and practical user requirements can be
integrated in product design and quality evaluation. Textile sensory attributes may relate to
tactility, moisture, pressure, temperature, aesthetics, acoustic, and olfaction71,72
. Sensory
properties of textile products are a function of fiber, yarn and fabric characteristics, as well as the
type of dyeing and finishing processes73
.

10
Sensory evaluation is premised on the competence of trained or experienced human beings
(usually called judges) to execute objective measurements of sensations74
. Sensory analysis
involves the evaluation of products through descriptors linked to human senses (sight, hearing,
taste, smell, touch). From the sensory analysis of food, cosmetics, and pharmaceuticals, methods
tailored to textiles have been developed75–77
. Attempts have been made to develop and
standardize terminologies and scales to describe subjective sensory experiences; but also found
to vary with individuals78
. Objective sensory evaluation, which involves physical tools, has also
been developed. They include the works of Kawabata in the early1970’s through the late 80’s79
,
and other innovations with computer programs80,81
. However, instrumental methods do not
represent the in-use textile experience since the measured mechanical parameters cannot directly
reflect human sensations in a precise way. The use of humans as tools for sensory evaluation
exploits and integrates the non-uniform perception of sensory attributes; which is also consumer
representative82
. Park and Hong83
and Kim et al84
recently noted a variation in sensory
perception across selected nationalities and cultures. A study by Zeng and Koehl85
argued that
sensory evaluation of fabrics was cultural-independent since it is preference-independent; and
that a well trained panel should deliver credible scores.
Rank-based and score-based methods are popular in textile sensory evaluation86–88
. The rank-
based system accords a distinct position to an item, in a rank list based on the perceived
magnitude of the attribute assessed. The score-based system utilizes a scale to estimate the
magnitude for each item. Rank lists from a sensory session are usually aggregated and object
ranks can be transformed into scores89,90
. In this study the rank-based system was applied.
1.9 Mining of textile sensory data
The multidimensional and non-linear nature of sensory data is often analyzed using advanced
multivariate statistics91
and intelligent algorithms— such as neural networks and fuzzy logic71,92
.
Such methods have provided new frontiers for modeling and predicting sensory relationships,
using sensory data. Jeguirim’s team93
utilized multiple factor analysis (MFA) and principal
component analysis (PCA) in studying the effect of fabric finishes on low stress mechanical
properties and sensory parameters. The study noted significant correlation between the sensory
attributes; thick, heavy, soft, elastic and crumple-like; and the measured attributes— resilience,
and the geometrical and frictional roughness. Fuzzy logic and neural networks were found to
yield better prediction results when used together94,95
.
Analyzing assessors’ performance helps to discover any significant variations in sensory ratings
and consequently to decide on assessors who may have challenges in discriminating samples. For
example, non-perceivers may fail to perceive an attribute. Also, non-discriminators may fail to
discriminate between some samples for one or more attributes. Reproducibility errors are also
common as panelists may fail to replicate assessments. In other cases, a panelist may use the
rating scale in opposition to the rest of the panel (crossover effects) or use a varying interval of
magnitudes compared to other panelists (magnitude error). Crossover errors are said to
contribute largely to poor panel consistency96,97
. Errors in sensory evaluation may be due to
individual assessors or by agreement within a sensory panel. One way analysis of variance
(ANOVA) can show the relative importance of attributes, identify assessor errors, and class the
total variation of sensory data into sources that affect sensory returns98
. Exploratory multivariate

11
techniques also give a robust overview of the panel performance. Consonance analysis (CA)
using PCA across variables may be used along with ANOVA99
. Consonance analysis entails a
PCA run on individual assessors' evaluations for the set of samples. The variance explained by
the first principle component represents the panel agreement for the descriptor in question.
Visualization of factor loadings, correlations, squared cosines, and percentage contributions
presents an exploratory image and facilitates the identification of outlying assessors and
reproducibility errors71,86,99
.
1.9.1 Principal component analysis (PCA)
In principal component analysis (PCA), observations are defined by inter-correlated quantitative
dependent variables with an aim of extracting the most relevant information. Output from PCA is
presented as a collection of new orthogonal variables called principal components. PCA utilizes
components along which the variation in the data is maximal. PCA is commenced and explained
by the Eigen decomposition of positive semi-definite matrices and upon the singular value
decomposition (SVD) of rectangular matrices100
. PCA then linearly merges original variables to
yield principal components (F1+F2.....+Fn). The ensuing components are orthogonal to
preceding components. Onto the principal components, variables are projected geometrically as
factor scores of the observations100,101
. Further analysis yields more relationships between
variables/observations and factors, and between observations and variables; such as correlations,
factor scores, squared cosines, and contributions to factors. These constraints have relative
meaning and importance to the variability. For instance, the magnitude of the squared cosines
indicates the relative significance of variables or observations to the variability102,103
. In this
study, PCA was used to study sensory patterns between different kinds of fabrics.
1.9.2 Agglomerative hierarchical clustering (AHC)
Hierarchical (connectivity) clustering establishes a hierarchy of clusters of objects on a set of
quantitative attributes, yielding multiple levels of abstraction of the original data set. AHC
clusters objects by combinations that minimize a given agglomeration criterion. A metric,
together with a linkage criterion is often used to indicate the distance between pairs of
observations. The Manhattan, Euclidean, and squared Euclidean distances are some common
metrics. Linkage criterion include minimum within class variance, mean linkage clustering,
weighted pair group method with arithmetic mean, and centroid linkage clustering among
others104,105
.
AHC outputs a binary clustering tree known as a dendrogram (Figure 1.4), a hierarchy from
which appropriate clusters may be selected.

12
Figure 1.4 A sample dendrogram from AHC of objects EFGHIJ
Graphically, the y-axis of the dendrogram represents the dissimilarity distance, while the x-axis
represents items or observations. In this study, AHC was performed to profile fabrics according
to sensory attributes defined by assessors. The squared Euclidean distance and the weighted
pair-group average were used as metric and linkage criteria respectively.
1.10 Aim of the study
Through the reviewed literature, it is presented that the future of cotton fiber supply is quite
uncertain as there is growing global demand. It is also noted that consumers prefer apparel made
from cotton fabrics, especially due to the perceived sensory comfort and moisture properties
attributed to cotton fabrics. Due to several desirable properties of PET, it is envisaged that
polyester could serve as a surrogate to cotton, if certain inferior properties were addressed. The
literature also presents that NaOH treatment of PET textiles has been widely used to enhance the
moisture and hand properties of PET fabrics. Although previous studies have carried out
objective measurements on NaOH-treated PET textiles, sensory evaluation has not been
undertaken on such fabrics. A sensory comparison between functionalized PET fabrics and
cotton fabrics has neither been undertaken as well. Such reflection of end-user perception is a
knowledge gap in these researches. There is no evidence of previous research to investigate and
identify sensory attributes that distinguish polyester fabrics from cotton fabrics. The use of UV
irradiation and surface grafting is not a new phenomenon. However, the potential of METAC
and PEGDA, enhancing hydrophilicity of fabric was the focus of this study. These monomers
have been used for other non-conventional applications but not for apparel.
EFGHIJ
EF E
F
GHI
G
H
I J

13
Chapter 2
The sensory disparity between cotton and
polyester woven fabrics
2.1 Overview
The aim of this study was to determine the disparity and identify the most discriminating sensory
attribute between cotton and polyester (poly(ethylene terephthalate))— PET woven fabrics. A
multisensory evaluation was used to explore the potential of PET as a surrogate to cotton in
woven fabrics. A panel of 12 judges was used to evaluate and rank six cotton and polyester
woven fabrics for 11 sensory descriptors. Rank aggregation and weighting were performed using
cross-entropy Monte Carlo and Genetic algorithms, and the Borda count technique. The quality
of the sensory panel was studied using ANOVA and consonance analysis. Principle component
analysis (PCA) and unsupervised agglomerative hierarchical clustering (AHC) were used to
study and profile sensory relationships. The largest Euclidean distance was found between
fabrics of dissimilar generic. The descriptor crisp accounted for the highest variability between
PET and cotton fabrics (p≤0.05). To replace cotton with PET via this sensory approach for
woven fabrics, the modification of stiffness of polyester fabrics has been judiciously suggested.
For the fabrics studied, it was deduced that visual aesthetics represent the vast of sensory
perception and that PET and cotton fabrics can be distinguished by appearance via vision.
2.2 Materials and Methods
2.2.1 Materials
2.2.1.1 Test fabrics and experimental conditions Six fabrics of 20x30 sq cm and basic parameters shown in Table 2.1 and Figure 2.1 were used in
this study. The experimental room was maintained at ambient temperature with day-lighting and
with no interference from external sounds/noise. The test fabrics were labeled and then

14
conditioned in standard atmosphere (according to ISO 139:2005 Textiles— Standard
atmospheres for conditioning and testing)106
for 48 hours at 20oC (±2
oC) and 65% RH (±4%).
The sample fabrics had neither coloring nor patterning.
Table 2.1 Basic parameters and structure of woven fabrics used in the study
Figure 2.1 PET and cotton woven fabric samples used in the sensory study
2.2.2 Methods
2.2.2.1 Sensory panel, descriptors and sensory evaluation The multicultural sensory panel comprised of six male and six female adults aged between 20
and 52 years. These included three college professors, five Doctorate scholars, two master’s
students and two undergraduate students. Figure 2.2 shows the sensory evaluation session.
Fabric Fiber content Weave Finish Warp
count
Weft
Count
Weave
density
Weight
g/m2
Thickness
mm
SA PET plain Bleach 31 28 847 149 0.276
SK PET twill 5 Bleach 38 38 1021 230 0.325
SC Cotton plain Bleach 19 20 702 136 0.348
SE PET microfiber plain Bleach 18 10 710 94 0.17
SG PET/cotton;33/67 twill 5 None 36 32 1182 258 0.76
SX Cotton plain Bleach+calendar 21 20 738 131 0.216

15
Figure 2.2 Assessors in the sensory evaluation session
The racial distribution included: four European natives, two African natives, three Asian natives,
and three Middle-Eastern natives. All panelists had background training/experience in
textiles/apparel, except the two undergraduate students. Prior to the experiment, training was
carried out by the principal investigator for all the panelists, in one session. Training involved
presentation of objectives, materials, evaluation criteria, and estimates for sensory evaluation. A
pilot sensory evaluation for selected descriptors was carried out for illustration.
The experimental room was maintained at ambient temperature with day-lighting and with no
interference from external sounds/noise. Before commencement of the sensory evaluation,
panelists were required to wash and rinse their hands ten minutes in advance. Each panelist
received one specimen for each of the six fabric samples, randomly without revealing
specifications. Free choice profiling (FCP)107
was adopted; each panelist independently listed
descriptors of sensations perceived as one examined the fabrics randomly. FCP was followed by
a focused discussion of all panelists with an aim of extracting and integrating the most frequent
sensations and their common descriptors. Based on the frequency, panelists consensually agreed
on 11 sensory descriptors with antonyms and synonyms. A frequency of at least eight was
considered for a descriptor adopted. Evaluation criterion/protocols (Appendix) and illustration
for each attribute were then discussed, printed and given to each panelist. For each descriptor,
each panelist nominally ranked the six fabrics in descending order according to the magnitude of
the perceived sensations.
2.2.2.2 Rank aggregation and rank weighting Three methods were used and compared to aggregate the 12 rank lists into one super list (fused
list), for each descriptor. The aggregation methods used were: the Borda count method also
known as the Borda-Kendall (BK) method108
, a genetic algorithm (GA) and a cross-entropy
Monte Carlo (CE) algorithm. On the basis of frequency and agreement with the modal list, fused
lists from only one method were adopted for further computations. The BK method was then
used to convert ranks into weights.

16
The Borda count (BK) method awards weights to objects based on their position in a rank list.
For a rank list T=[x1, x2,.... xk] w.r.t. universe U; xi ∈ T; i ∈ N (N is a set of integers of ranks of
objects in (T); T(i) is the rank of i in T; a low-numbered position indicates a higher magnitude of
a sensory sensation, Eq 2.1) is the normalized weight (score) of item i ∈ T.
The BK method may yield more than one fused list in case of ties in weights. The GA and CE in
this study are intelligent algorithms run under the function RankAggreg in software R109
. The GA
and CE may be weighted or without weights. The objective function of the GA or CE (Eq
2.2)109–111
aims to search for an “optimal” list or super list, close as possible to all individual
ordered lists concurrently.
where δ is the suggested ordered list of length k = |Li|; is the importance weight; d is the
distance function; and Li is the ith
ordered list. Hence, these iterative algorithms aim at finding δ∗
(Eq 2.3) that would minimize the total distance between δ∗ and Li’s 109,110
:
∗
Distance functions utilized by GA and CE are based on Spearman’s footrule distance or
Kendall’s tau. Considering scores Mi(1),...,… Mi(k) for an ordered list Li; Mi(1) being the highest
(first rank) score, followed by Mi(2). If A has rank in the list Li, given that A is in the top
k; or, k+1 if not in the top k, the Spearman's footrule distance between Li and any ordered list δ,
is the sum of the absolute differences between the ranks of all unique elements from all ordered
lists combined (Eq 2.4).
The Weighted Spearman's footrule distance (Eq 2.5)109,110
between Li and any ordered list δ
utilizes further quantitative information pertinent to the rank lists.
The Kendall’s tau distance (Eq 2.6 and 2.7)109
utilizes pairs of elements from the union of two
lists. It is based on award of penalties accruing from differences in ordering in lists compared.

17
where,
A penalty p; 0˂p˂1, is imposed if two elements t and u do not have the same relative ordering in
the compared lists. In the package RankAggreg, p=0. The weighted Kendall’s tau is computed as
in Eq 2.8109,110
:
Before weighting, scores from each rank list Li are normalized (Eq 2.9)
∗
(Eq 2.9)
Further studies provide more theoretical understanding of the GA and CE algorithms111–113
. An
input program for the GA and CE is specified by the main arguments; data matrix (x) of the rank
lists, length of the rank lists (k), number of elements being ranked (n), number of iterations for
the algorithms to converge (convIn), N given by 10k2 or 10kN if n>>k, rho (rarity parameter- the
"quantile" of candidate lists sorted by the function values). N and rho apply to only the CE
algorithm. Other arguments and details have been presented by Pihur109
. Both the GA and CE
apply a convergence mechanism; repetition of the same minimum value of the objective function
in convIn consecutive iterations. Based on six fabrics and 12 rank lists for each descriptor, the
eight rank aggregation programs below were written and used for aggregation, in separate runs:
1. CEKnoweights <- RankAggreg(table_matrix, 6, method="CE", distance="Kendall",
N=1440, convIn=30, rho=.1)
2. CESnoweights <- RankAggreg(table_matrix, 6, method="CE", distance="Spearman",
N=1440, convIn=30, rho=.1)
3. CEK <- RankAggreg(table_matrix, 6, w, "CE", "Kendall", N=1440, convIn=30, rho=.1)
4. CES <- RankAggreg(table_matrix, 6, w, "CE", "Spearman", N=1440, convIn=30, rho=.1)
5. GAKnoweights <- RankAggreg(table_matrix, 6, method="GA", distance="Kendall",
convIn=30)
6. GASnoweights <- RankAggreg(table_matrix, 6, method="GA", distance="Spearman",
convIn=30)
7. GAS <- RankAggreg(table_matrix, 6, w, "GA", "Spearman", convIn=30)
8. GAK <- RankAggreg(table_matrix, 6, w, "GA", "Kendall", convIn=30)
A total of nine (or ten in case of ties with the BK method) aggregated lists from the BK, GA and
CE methods were tabulated and compared simultaneously. Since the methods yielded different
aggregated rank lists in some cases, the modal aggregated lists were extracted for each
descriptor. Only lists from the method with the highest agreement with other methods were then
taken for consistency in further analyses. The BK method was then used to compute rank
weights for subsequent analyses.

18
2.2.2.3 Performance of the sensory panel The quality of the sensory panel was studied using ANOVA, and CA with PCA of assessors and
fabrics/attributes, performed on ranks’ data transformed into scores. PCA in this study was
performed with R software using packages prcomp and princomp114
. The significance of
assessors’ ratings for a descriptor was inferred from individual assessors’ total contribution (%)
on principal components F1 and F2. If C1 and C2 are the contributions of an assessor on F1 and
F2 respectively, the total contribution of an assessor, on explanation of variability by F1 and F2
is computed as: (C1*Eig1) + (C2*Eig2)115
; Eig1 and Eig2 are the eigenvalues of F1 and F2
respectively. Hence, if the contributions of the 12 assessors were uniform, the expected average
contribution on a given principal component would be 1/12 = 8.3%. In this case, the average
contribution of assessors for F1 and F2 would be: (8.3*Eig1) + (8.3*Eig2). Thus, significant
assessors for any descriptor are those with contribution higher than the average contribution. The
percentage contribution was also used in determining the number of descriptors that assessors
were able to effectively perceive and use for discriminating fabrics. In PCA, variables presenting
higher variability of the first principal component (denoted as the percent agreement), and/or
those with higher contribution (%) carry more importance. PCA of descriptors was also used to
identify atypical assessors and peculiar patterns; errors such as lack of sensitivity and cross-over.
2.2.2.4 Significant attributes, dissimilarity, and sensory profiles Using ANOVA, factor contribution of descriptors, correlation between descriptors, squared
cosines of descriptors, and our prior knowledge of textile fabric properties, the number of
sensory descriptors were reduced from eleven to six. PCA was then used to study sensory
patterns between fabrics and sensory attributes. Also, using PCA, the most significant sensory
attribute in discriminating between cotton and polyester fabrics was identified. The Euclidean
distance was then computed to estimate the dissimilarity between different pairs of fabrics. With
the squared Euclidean distance and the weighted pair-group average as metric and linkage
criterion respectively, unsupervised AHC was used to create fabric sensory classes and profiles.
Algorithms for AHC was performed using XLSTAT, an add-in for Excel116
.
2.3 Results and Discussion
2.3.1 Descriptors generated by the sensory panel
The sensory panel recorded 98 descriptors, from which the eleven below, were found to be the
most frequent and were consensually retained:
Stiff/inflexible, Soft/not hard, Smooth/not rough, Heavy/not light, Noisy/pitchy/harsh/not quiet
sound, Crisp/brittle/firm/fresh/crushable/crumbly, Stretchy/elastic/not rigid,
Drapy/hang/enclose, Regular/uniform/even, Natural/not synthetic/not artificial, and
Compact/packed/dense. These descriptors comprise taxonomy of aesthetic/tactile, visual,
physical, generic, acoustic, mechanical, and dynamic perceptual attributes of fibers and fabrics.
19
2.3.2 Ranks and rank aggregation
Twelve raw ranks lists were obtained for each descriptor. The aggregated rank lists from the BK,
CE and GA methods, and the modal list for each descriptor are shown in Table 2.2.

20
Table 2.2 Aggregated Rank Lists from the BK, GA and CE methods
Attribute BK CEKN GAKN CESN GASN CES GAS CEK GAK Modal list
Stiff SA,SK,SC,
SE,SG,SX
SA,SK,SC,SE,
SG,SX
SA,SK,SC,SE,
SG,SX
SA,SK,SE,SC,
SX,SG
SA,SK,SC,SE,
SX,SG
SA,SK,SE,SC,
SG,SX
SA,SK,SC,SE,
SG,SX
SA,SK,SC,SE,
SG,SX
SA,SK,SC,SE,
SG,SX
SA,SK,SC,SE,
SG,SX
Soft SX,SE,SC,
SG,SA,SK
SX,SE,SC,SG,
SA,SK
SX,SE,SC,SG,
SA,SK
SX,SE,SC,SG,
SK,SA
SX,SE,SC,SG,
SK,SA
SX,SE,SC,SG,
SA,SK
SX,SE,SC,SG,
SA,SK
SX,SC,SE,SG,
SA,SK
SX,SC,SE,SG,
SA,SK
SX,SE,SC,SG,
SA,SK
Smooth*
SX,SE,SC,
SG,SA,SK;
SX,SC,SE,
SG,SA,SK
SX,SE,SC,SG,
SK,SA
SX,SE,SC,SG,
SK,SA
SX,SE,SC,SG,
SK,SA
SX,SE,SC,SG,
SK,SA
SC,SX,SE,SG,
SA,SK
SC,SX,SE,SG,
SA,SK
SX,SC,SE,SK,
SA,SG
SX,SC,SE,SK,
SA,SG
SX,SE,SC,SG,
SK,SA
Heavy SG,SK,SC,
SA,SX,SE
SG,SK,SC,SA,
SX,SE
SG,SK,SC,SA,
SX,SE
SG,SK,SA,SC,
SX,SE
SG,SK,SA,SC,
SX,SE
SG,SK,SC,SA,
SX,SE
SG,SK,SC,SA,
SX,SE
SG,SK,SC,SA,
SX,SE
SG,SK,SC,SA,
SX,SE
SG,SK,SC,SA,
SX,SE
Noisy*
SK,SA,SE,
SX,SC,SG;
SK,SA,SE,
SC,SX,SG
SK,SA,SE,SX,
SC,SG
SK,SA,SE,SC,
SX,SG
SK,SA,SE,SX,
SC,SG
SK,SA,SE,SX,
SC,SG
SK,SA,SE,SC,
SX,SG
SK,SA,SE,SC,
SX,SG
SK,SA,SE,SX,
SC,SG
SK,SA,SE,SX,
SC,SG
SK,SA,SE,SX,
SC,SG
Crisp SA,SK,SE,
SC,SX,SG
SA,SK,SE,SC,
SX,SG
SA,SK,SE,SC,
SX,SG
SA,SK,SE,SC,
SX,SG
SA,SK,SE,SC,
SX,SG
SA,SK,SE,SC,
SX,SG
SA,SK,SE,SC,
SX,SG
SA,SK,SE,SC,
SX,SG
SK,SA,SE,SC,
SX,SG
SK,SA,SE,SX,
SC,SG
Stretchy SK,SX,SA,
SC,SE,SG
SK,SA,SX,SC,
SE,SG
SK,SA,SX,SC,
SE,SG
SK,SA,SX,SE,
SC,SG
SK,SA,SX,SE,
SC,SG
SK,SA,SX,SC,
SE,SG
SK,SA,SX,SC,
SE,SG
SK,SX,SA,SC,
SE,SG
SK,SX,SA,SC,
SE,SG
SK,SA,SX,SC,
SE,SG
Drapy SX,SG,SC,
SE,SK,SA
SX,SG,SC,SE,
SK,SA
SX,SG,SC,SE,
SK,SA
SX,SC,SG,SE,
SK,SA
SX,SC,SG,SE,
SK,SA
SX,SG,SC,SE,
SK,SA
SX,SG,SC,SE,
SK,SA
SG,SX,SC,SE,
SK,SA
SG,SX,SC,SE,
SK,SA
SX,SG,SC,SE,
SK,SA
Regular SE,SX,SA,
SK,SC,SG
SE,SX,SK,SA,
SC,SG
SE,SX,SA,SK,
SC,SG
SE,SX,SK,SA,
SC,SG
SE,SX,SK,SA,
SC,SG
SE,SX,SK,SA,
SC,SG
SE,SX,SK,SA,
SC,SG
SE,SX,SK,SA,
SC,SG
SE,SX,SK,SA,
SC,SG
SE,SX,SK,SA,
SC,SG
Natural SG,SC,SX,
SA,SE,SK
SG,SC,SX,SA,
SE,SK
SG,SC,SX,SA,
SE,SK
SG,SC,SX,SA,
SE,SK
SG,SC,SX,SA,
SE,SK
SG,SC,SX,SA,
SE,SK
SG,SC,SX,SA,
SE,SK
SC,SG,SX,SA,
SE,SK
SC,SG,SX,SA,
SE,SK
SG,SC,SX,SA,
SE,SK
Compact SK,SG,SC,
SX,SA,SE
SK,SG,SC,SX,
SE,SA
SK,SG,SC,SX,
SA,SE
SK,SG,SC,SX,
SE,SA
SG,SKSC,SX,
SA,SE
SK,SG,SC,SX,
SE,SA
SK,SG,SC,SX,
SE,SA
SK,SG,SE,SX,
SC,SA
SK,SG,SE,SX,
SC,SA
SK,SG,SC,SX,
SE,SA
*Descriptors with two super lists from the BK method, Descript- Descriptor, BK- Borda Kendal, CEKN- Unweighted cross entropy Kendall, GAKN- Unweighted genetic Kendall, CESN- Unweighted cross entropy Spearman, GASN- Unweighted genetic Spearman, CES- Weighted cross entropy
Spearman, GAS- Weighted genetic Spearman, CEK- Weighted cross entropy Kendall, GAK- Weighted genetic Kendall

21
Due to ties in the weighted score for SE and SC (for smooth), and SX and SC (for
noisy), there were two optimal rank lists by the BK method for smooth and noisy.
This demerit associated with the BK method has been reported elsewhere117,118
.
The unweighted CE utilizing Kendall’s tau (CEKnoweight) was the most closest
to other methods, returning the modal fused list in 100% of the descriptors. While
the descriptor crisp presented the highest agreement (89%) within the rank
aggregation methods, the descriptor smooth recorded the lowest agreement (40%),
followed by drapy and stretchy, both with 44%.
By observing positions in rank lists, polyester fabrics presented a strong
dominance in magnitude for permutations of stiff, noisy, crisp, and stretchy.
While, cotton fabrics, were prominent in magnitude for soft, drapy, smooth, and
natural. The positioning of SX, SE and SG fabrics does not present a precise
pattern with respect to some attributes. This could be attributed to the micro fiber
nature of SE, the blended composition of SG, and the calendared finish on SX.
Aggregated rank lists did not give precise conclusions about the influence of the
fiber generic on the magnitudes of the perceived sensations. Since different rank
fusion methods yielded different aggregated rank lists, it was judged that the
outcome of each method was a function of the constraints (distance function,
weighted or un-weighted). Hence, it was judiciously thought to adopt aggregated
lists from one method for consistency in further computations, rather than the
modal lists. The unweighted CE rank lists were selected on the basis of similarity
to the modal list for all the descriptors. Table 2.3 presents rank BK scores
computed from the selected aggregated rank lists.
Table 2.3 Weighted and normalised BK scores of fabrics for each descriptor
Fabric Stiff Soft Smooth Heavy Noisy Crisp Stretchy Drapy Regular Natural Compact
SA 1.00 0.33 0.17 0.50 0.83 0.83 0.83 0.17 0.50 0.50 0.17
SK 0.83 0.17 0.33 0.83 1.00 1.00 1.00 0.33 0.67 0.17 1.00
SX 0.17 1.00 1.00 0.33 0.50 0.50 0.67 1.00 0.83 0.67 0.50
SE 0.50 0.83 0.83 0.17 0.67 0.67 0.33 0.50 1.00 0.33 0.33
SC 0.67 0.67 0.67 0.67 0.33 0.33 0.50 0.67 0.33 0.83 0.67
SG 0.33 0.50 0.50 1.00 0.17 0.17 0.17 0.83 0.17 1.00 0.83
;
2.3.3 Performance of the sensory panel
The analysis of the performance of the sensory panel was based on datasets of
weighted ranks of assessors before rank aggregation. The univariate plots (Figure
2.3) present a visualization of the relative subjective estimation of magnitudes of
perceptions by panelists for each descriptor. Magnitude and crossover (inversion
of ratings) errors can be observed where the minimum and maximum scores of
ranks for a particular fabric are far apart.

22
Figure 2.3 Univariate plots of panelists’ scores for the 11 descriptors
For instance, SC and SG for stiff, SG for soft, SA for smooth, SA, SK and SC for
stretchy, SA, SK, SX, SC and SG for drapy, SA for regular, and all fabrics,
except SC for compact. From the box plots, outlying scores were identified in five
descriptors; with heavy having the highest (4). The univariate plots also present
some visible responsive patterns for some fabrics and sensory descriptors;
polyester fabrics follow in sequence for some mechanical related attributes, and
there was an inverted relationship between stiff and soft, especially with polyester
fabrics.
SA SK SX SE SC SG 0
0.5
1
Stiff
SA SK SX SE SC SG 0
0.5
1
Soft
SA SK SX SE SC SG 0
0.5
1
Smooth
SA SK SX SE SC SG 0
0.2
0.4
0.6
0.8
1
1.2
1.4 Heavy
SA SK SX SE SC SG 0
0.2
0.4
0.6
0.8
1
1.2
1.4 Noisy
SA SK SX SE SC SG 0
0.2
0.4
0.6
0.8
1
1.2
1.4 Crisp
SA SK SX SE SC SG 0
0.2
0.4
0.6
0.8
1
1.2
1.4 Stretchy
SA SK SX SE SC SG 0
0.2
0.4
0.6
0.8
1
1.2
1.4 Drapy
SA SK SX SE SC SG 0
0.2
0.4
0.6
0.8
1
1.2
1.4 Regular
SA SK SX SE SC SG 0
0.2
0.4
0.6
0.8
1
1.2
1.4 Natural
SA SK SX SE SC SG 0
0.2
0.4
0.6
0.8
1
1.2
1.4 Compact
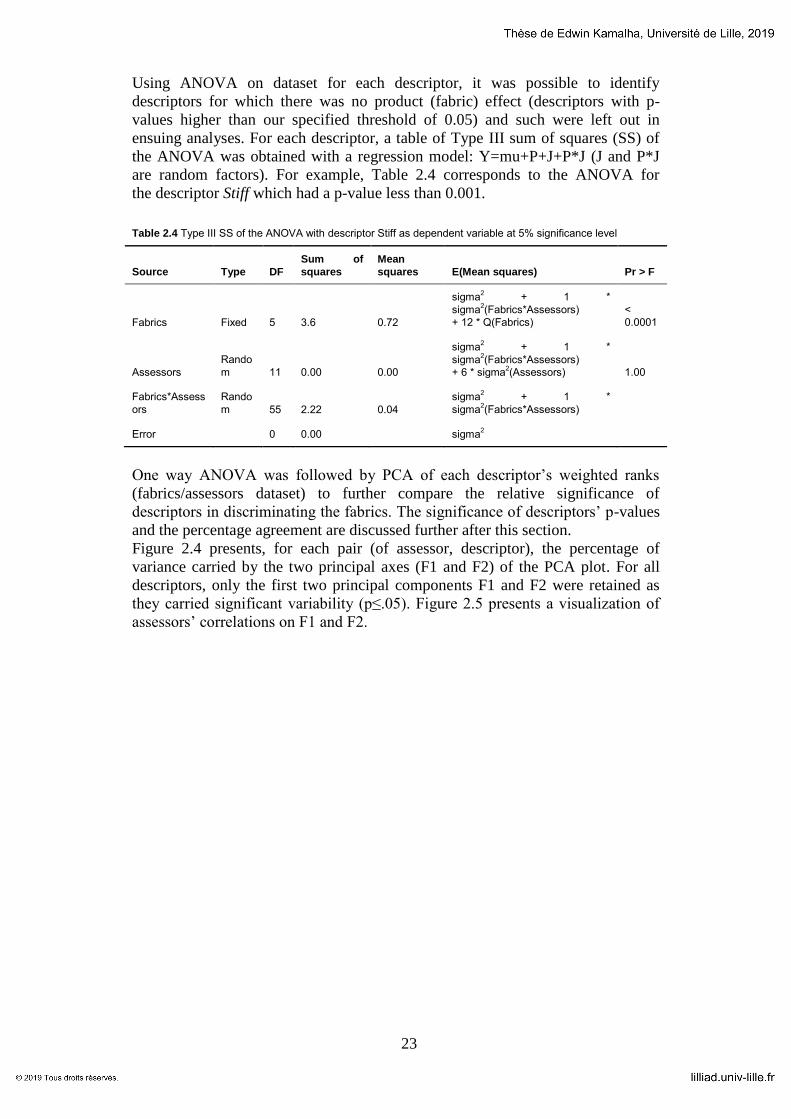
23
Using ANOVA on dataset for each descriptor, it was possible to identify
descriptors for which there was no product (fabric) effect (descriptors with p-
values higher than our specified threshold of 0.05) and such were left out in
ensuing analyses. For each descriptor, a table of Type III sum of squares (SS) of
the ANOVA was obtained with a regression model: Y=mu+P+J+P*J (J and P*J
are random factors). For example, Table 2.4 corresponds to the ANOVA for
the descriptor Stiff which had a p-value less than 0.001.
Table 2.4 Type III SS of the ANOVA with descriptor Stiff as dependent variable at 5% significance level
Source Type DF
Sum of
squares
Mean
squares E(Mean squares) Pr > F
Fabrics Fixed 5 3.6 0.72
sigma2 + 1 *
sigma2(Fabrics*Assessors)
+ 12 * Q(Fabrics)
<
0.0001
Assessors
Rando
m 11 0.00 0.00
sigma2 + 1 *
sigma2(Fabrics*Assessors)
+ 6 * sigma2(Assessors) 1.00
Fabrics*Assess
ors
Rando
m 55 2.22 0.04
sigma2 + 1 *
sigma2(Fabrics*Assessors)
Error 0 0.00 sigma2
One way ANOVA was followed by PCA of each descriptor’s weighted ranks
(fabrics/assessors dataset) to further compare the relative significance of
descriptors in discriminating the fabrics. The significance of descriptors’ p-values
and the percentage agreement are discussed further after this section.
Figure 2.4 presents, for each pair (of assessor, descriptor), the percentage of
variance carried by the two principal axes (F1 and F2) of the PCA plot. For all
descriptors, only the first two principal components F1 and F2 were retained as
they carried significant variability (p≤.05). Figure 2.5 presents a visualization of
assessors’ correlations on F1 and F2.

24
Figure 2.4 Percentage of variance carried by the two principal axes (F1 and F2) of the PCA plot
0
50
100
150
1 2 3 4 5 6 7 8 9 10 11 12
Co
ntr
ibu
tio
n (
%)
Assessors
Stiff
F1 F2
0
50
100
150
1 2 3 4 5 6 7 8 9 10 11 12
Co
ntr
ibu
tio
n (
%)
Assessors
Soft
F1 F2
0
50
100
150
1 2 3 4 5 6 7 8 9 10 11 12
Co
ntr
ibu
tio
n (
%)
Assessors
Smooth
F1 F2
0
50
100
150
1 2 3 4 5 6 7 8 9 10 11 12
Co
ntr
ibu
tio
n (
%)
Assessors
Heavy
F1 F2
0
50
100
150
1 2 3 4 5 6 7 8 9 10 11 12
Co
ntr
ibu
tio
n (
%)
Assessors
Noisy
F1 F2
0
50
100
150
1 2 3 4 5 6 7 8 9 10 11 12
Co
ntr
ibu
tio
n (
%)
Assessors
Crisp
F1 F2
0
50
100
150
1 3 5 7 9 11
Co
ntr
ibu
tio
n (
%)
Assessors
Stretchy
F1 F2
0
50
100
150
1 2 3 4 5 6 7 8 9 10 11 12
Co
ntr
ibu
tio
n (
%)
Assessors
Drapy
F1 F2
0
50
100
150
1 2 3 4 5 6 7 8 9 10 11 12
Co
ntr
ibu
tio
n (
%)
Assessors
Regular
F1 F2
0
50
100
150
1 2 3 4 5 6 7 8 9 10 11 12
Co
ntr
ibu
tio
n (
%)
Assessors
Natural
F1 F2
0
50
100
150
1 2 3 4 5 6 7 8 9 10 11 12
Co
ntr
ibu
tio
n (
%)
Assessors
Compact
F1

25
Figure 2.5 Correlations plot of assessors on F1 and F2 for 11 descriptors
The oriented factor loadings of assessors towards either F1 or F2 (Figure 2.4 and
Figure 2.5) present valuable information on variations and errors in assessors’
ranks. While a pair or group of assessors may have their largest loading on the
same principal component, they may also load in opposition (negative
correlation), on the same principal component. This pattern was noted between
assessors 1, 2 and 5 loading more on F1 (Figure 2.4), with assessor 5 in opposition
to assessors 1 and 2 (Figure 2.5) for smooth. Similarly, the largest factor loadings
A1 A2
A3 A4
A5
A6
A7
A8
A9
A10
A11
A12
-1
-0.75
-0.5
-0.25
0
0.25
0.5
0.75
1
-1 -0.75 -0.5 -0.25 0 0.25 0.5 0.75 1
F2 (1
8,9
3 %
)
F1 (62,33 %)
Stiff (F1 and F2: 81,26 %)
A1
A2
A3
A4
A5
A6
A7
A8
A9
A10
A11
A12
-1
-0.75
-0.5
-0.25
0
0.25
0.5
0.75
1
-1 -0.75 -0.5 -0.25 0 0.25 0.5 0.75 1
F2 (2
3,4
4 %
)
F1 (63,04 %)
Soft (F1 and F2: 86,48 %)
A1
A2
A3
A4 A5
A6
A7
A8
A9
A10 A11
A12
-1
-0.75
-0.5
-0.25
0
0.25
0.5
0.75
1
-1 -0.75 -0.5 -0.25 0 0.25 0.5 0.75 1
F2 (1
9,7
2 %
)
F1 (56,61 %)
Smooth (F1 and F2: 76,33 %)
A1
A2
A3 A4
A5
A6 A7 A8
A9
A10
A11
A12
-1
-0.75
-0.5
-0.25
0
0.25
0.5
0.75
1
-1 -0.75 -0.5 -0.25 0 0.25 0.5 0.75 1
F2 (1
1,0
5 %
)
F1 (78,16 %)
Heavy (F1 and F2: 89,21 %)
A1 A2
A3
A4
A5 A6
A7
A8
A9
A10
A11
A12
-1
-0.75
-0.5
-0.25
0
0.25
0.5
0.75
1
-1 -0.75 -0.5 -0.25 0 0.25 0.5 0.75 1
F2 (1
4,7
6 %
)
F1 (73,07 %)
Noisy (F1 and F2: 87,83 %)
A1 A2
A3
A4 A5
A6
A7
A8
A9
A10
A11 A12
-1
-0.75
-0.5
-0.25
0
0.25
0.5
0.75
1
-1 -0.75 -0.5 -0.25 0 0.25 0.5 0.75 1
F2 (9
,96
%)
F1 (75,55 %)
Crisp (F1 and F2: 85,51 %)
A1 A2 A3
A4
A5 A6
A7 A8 A9
A10 A11
A12
-1
-0.75
-0.5
-0.25
0
0.25
0.5
0.75
1
-1 -0.75 -0.5 -0.25 0 0.25 0.5 0.75 1
F2 (2
3,1
5 %
)
F1 (50,45 %)
Stretchy (F1 and F2: 73,61 %)
A1
A2
A3 A4
A5
A6 A7
A8
A9
A10 A11
A12
-1
-0.75
-0.5
-0.25
0
0.25
0.5
0.75
1
-1 -0.75 -0.5 -0.25 0 0.25 0.5 0.75 1
F2 (1
3,5
5 %
)
F1 (65,48 %)
Drapy (F1 and F2: 79,03 %)
A1
A2
A3
A4
A5
A6
A7 A8
A9 A10
A11 A12
-1
-0.75
-0.5
-0.25
0
0.25
0.5
0.75
1
-1 -0.75 -0.5 -0.25 0 0.25 0.5 0.75 1
F2 (2
1,5
2 %
)
F1 (53,70 %)
Regular (F1 and F2: 75,23 %)
A1
A2
A3
A4
A5
A6
A7
A8
A9 A10
A11 A12
-1
-0.75
-0.5
-0.25
0
0.25
0.5
0.75
1
-1 -0.75 -0.5 -0.25 0 0.25 0.5 0.75 1
F2 (6
,56
%)
F1 (87,12 %)
Natural (F1 and F2: 93,68 %)
A1 A2
A3
A4
A5 A6
A7
A8
A9
A10
A11
A12
-1
-0.75
-0.5
-0.25
0
0.25
0.5
0.75
1
-1 -0.75 -0.5 -0.25 0 0.25 0.5 0.75 1
F2 (1
8,7
1 %
)
F1 (60,75 %)
Compact (F1 and F2: 79,47 %)

26
of assessors 5, 6, and 9 are on F2 (Figure 2.4) whilst assessors 5 and 6 load in
opposition to assessor 9 (Figure 2.5), for stretchy. Assessors showing outlying
perceptions and low sensitivity can be identified by their isolated loading and low
contribution (%) relative to the rest of the panel. Sensitivity errors are
characterized by very low contributions of assessors on F1 and F2. In our
analysis, a total contribution (%) on F1 and F2, below 50% indicates that an
assessor had low sensitivity for the particular descriptor. Magnitude errors can be
noticed when the factor loading of an assessor is significantly lower or larger than
the vast of the panel members, on the same principal component. Magnitude
errors imply that some assessors’ subjective magnitudes of sensory perceptions
differ significantly compared to the rest of the panel members. Crossover errors
were noted by identifying assessors scoring in opposition to the vast of the panel.
For example, in Figure 2.5, assessors 5, 6, 7, and 12 exhibit this effect for
stretchy. Table 2.5 presents a summary of the panelists’ errors based on Figure
2.4 and Figure 2.5, p-values from one way ANOVA of descriptors, the percent
agreement from PCA of assessors’ scores, and the average contribution (%) of
assessors on F1 and F2.
Table 2.5 Summary of assessor/fabric effect: p-values, percent agreement of assessors, and assessors’ errors
Descriptor *Pr > F *Percent
agreement
Average
contribution
(%) of
assessors
on F1 and
F2
Assessors
below
average
contribution
on F1 and F2
Assessors
with
crossover
errors
Assessors
with a
magnitude
error
Assessors
with a
sensitivity
error
Stiff <0.0001 62 81 1,2,5,8,11 - 9 -
Soft <0.0001 63 86 1,5 - 7,9 -
Smooth <0.0001 57 76 2,3,5,9 - 1,2 1(5)
Heavy <0.0001 78 89 2,4,9,10,11,12 - - -
Noisy <0.0001 73 88 3,6,7,8,9 - 7,9 -
Crisp <0.0001 76 86 3,6,9,10,12 - 7,9 -
Stretchy 0.0032 50 74 2,3,4,7,9,10 5,6,7,12 - 2(4,9)
Drapy 0.3471 66 79 7,8,9,10 3,4,6 5 2(7,9)
Regular <0.0001 54 75 1,3,5,6,9 6 3 1(5)
Natural <0.0001 87 94 5,11 - - -
Compact 0.0981 61 79 3,4,5,9 2,7,9 - 2(4,5)
*The values were computed at significance level 0.05, figures in bold are higher than the threshold
The percent agreement shows that the descriptor natural carried the largest
variability, while, stretchy accounted for the lowest variability. Drapy and
compact were the least significant, considering their p-values. We introduced the
discriminating power, which represents the percentage of descriptors an assessor
was able to effectively perceive to discriminate fabrics. An assessor was recorded
to have effectively perceived a descriptor if the assessor’s contribution (%) for
that descriptor was higher than the panels’ average contribution (%) for the same
descriptor. For example, from Table 2.5, considering the average contribution (%)
on F1 and F2, assessor 1 was able to effectively perceive eight descriptors. Hence,
the discriminating power for assessor 1 is 73%. The average discriminating power
was 63%, with 50% of the panel attaining 72%. Assessor 9 exhibited the lowest
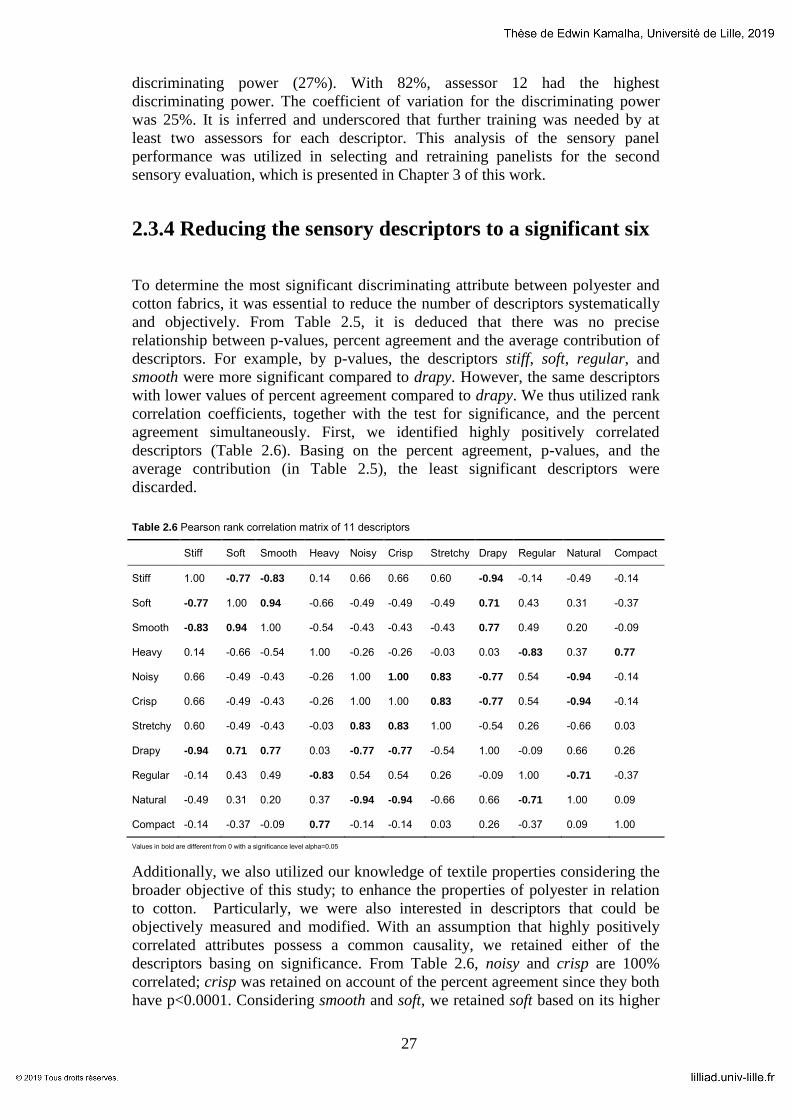
27
discriminating power (27%). With 82%, assessor 12 had the highest
discriminating power. The coefficient of variation for the discriminating power
was 25%. It is inferred and underscored that further training was needed by at
least two assessors for each descriptor. This analysis of the sensory panel
performance was utilized in selecting and retraining panelists for the second
sensory evaluation, which is presented in Chapter 3 of this work.
2.3.4 Reducing the sensory descriptors to a significant six
To determine the most significant discriminating attribute between polyester and
cotton fabrics, it was essential to reduce the number of descriptors systematically
and objectively. From Table 2.5, it is deduced that there was no precise
relationship between p-values, percent agreement and the average contribution of
descriptors. For example, by p-values, the descriptors stiff, soft, regular, and
smooth were more significant compared to drapy. However, the same descriptors
with lower values of percent agreement compared to drapy. We thus utilized rank
correlation coefficients, together with the test for significance, and the percent
agreement simultaneously. First, we identified highly positively correlated
descriptors (Table 2.6). Basing on the percent agreement, p-values, and the
average contribution (in Table 2.5), the least significant descriptors were
discarded.
Table 2.6 Pearson rank correlation matrix of 11 descriptors
Stiff Soft Smooth Heavy Noisy Crisp Stretchy Drapy Regular Natural Compact
Stiff 1.00 -0.77 -0.83 0.14 0.66 0.66 0.60 -0.94 -0.14 -0.49 -0.14
Soft -0.77 1.00 0.94 -0.66 -0.49 -0.49 -0.49 0.71 0.43 0.31 -0.37
Smooth -0.83 0.94 1.00 -0.54 -0.43 -0.43 -0.43 0.77 0.49 0.20 -0.09
Heavy 0.14 -0.66 -0.54 1.00 -0.26 -0.26 -0.03 0.03 -0.83 0.37 0.77
Noisy 0.66 -0.49 -0.43 -0.26 1.00 1.00 0.83 -0.77 0.54 -0.94 -0.14
Crisp 0.66 -0.49 -0.43 -0.26 1.00 1.00 0.83 -0.77 0.54 -0.94 -0.14
Stretchy 0.60 -0.49 -0.43 -0.03 0.83 0.83 1.00 -0.54 0.26 -0.66 0.03
Drapy -0.94 0.71 0.77 0.03 -0.77 -0.77 -0.54 1.00 -0.09 0.66 0.26
Regular -0.14 0.43 0.49 -0.83 0.54 0.54 0.26 -0.09 1.00 -0.71 -0.37
Natural -0.49 0.31 0.20 0.37 -0.94 -0.94 -0.66 0.66 -0.71 1.00 0.09
Compact -0.14 -0.37 -0.09 0.77 -0.14 -0.14 0.03 0.26 -0.37 0.09 1.00
Values in bold are different from 0 with a significance level alpha=0.05
Additionally, we also utilized our knowledge of textile properties considering the
broader objective of this study; to enhance the properties of polyester in relation
to cotton. Particularly, we were also interested in descriptors that could be
objectively measured and modified. With an assumption that highly positively
correlated attributes possess a common causality, we retained either of the
descriptors basing on significance. From Table 2.6, noisy and crisp are 100%
correlated; crisp was retained on account of the percent agreement since they both
have p<0.0001. Considering smooth and soft, we retained soft based on its higher
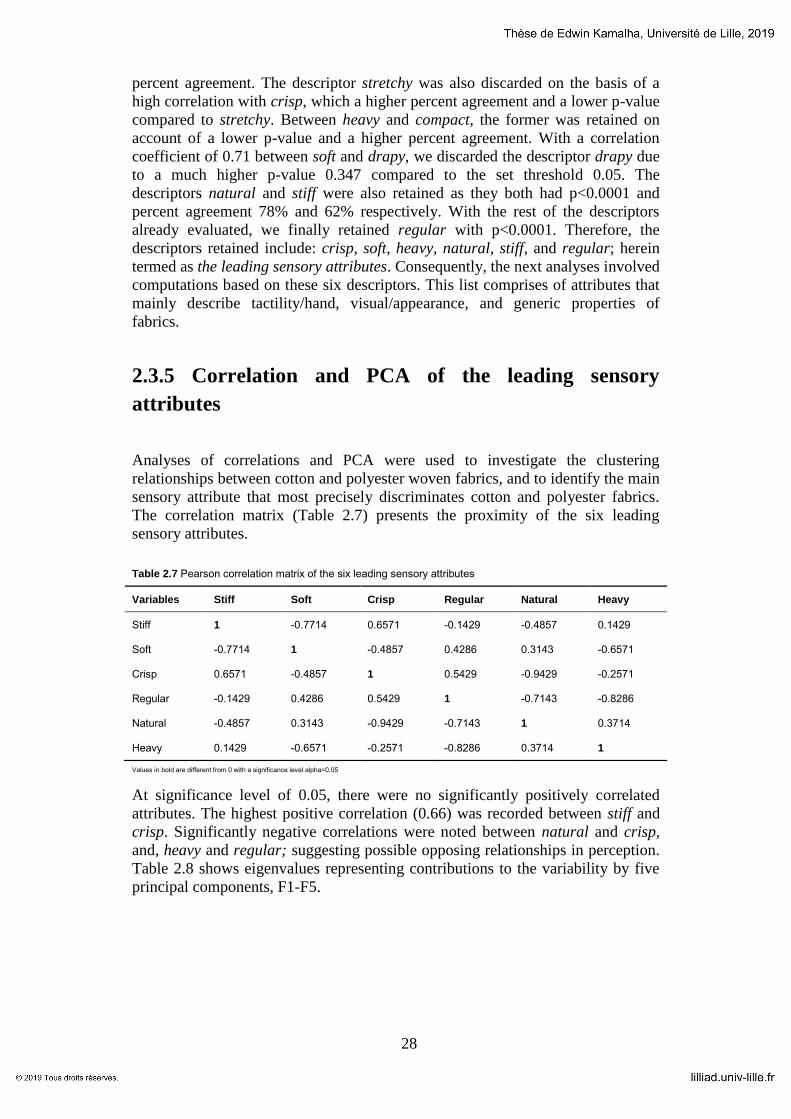
28
percent agreement. The descriptor stretchy was also discarded on the basis of a
high correlation with crisp, which a higher percent agreement and a lower p-value
compared to stretchy. Between heavy and compact, the former was retained on
account of a lower p-value and a higher percent agreement. With a correlation
coefficient of 0.71 between soft and drapy, we discarded the descriptor drapy due
to a much higher p-value 0.347 compared to the set threshold 0.05. The
descriptors natural and stiff were also retained as they both had p<0.0001 and
percent agreement 78% and 62% respectively. With the rest of the descriptors
already evaluated, we finally retained regular with p<0.0001. Therefore, the
descriptors retained include: crisp, soft, heavy, natural, stiff, and regular; herein
termed as the leading sensory attributes. Consequently, the next analyses involved
computations based on these six descriptors. This list comprises of attributes that
mainly describe tactility/hand, visual/appearance, and generic properties of
fabrics.
2.3.5 Correlation and PCA of the leading sensory
attributes
Analyses of correlations and PCA were used to investigate the clustering
relationships between cotton and polyester woven fabrics, and to identify the main
sensory attribute that most precisely discriminates cotton and polyester fabrics.
The correlation matrix (Table 2.7) presents the proximity of the six leading
sensory attributes.
Table 2.7 Pearson correlation matrix of the six leading sensory attributes
Variables Stiff Soft Crisp Regular Natural Heavy
Stiff 1 -0.7714 0.6571 -0.1429 -0.4857 0.1429
Soft -0.7714 1 -0.4857 0.4286 0.3143 -0.6571
Crisp 0.6571 -0.4857 1 0.5429 -0.9429 -0.2571
Regular -0.1429 0.4286 0.5429 1 -0.7143 -0.8286
Natural -0.4857 0.3143 -0.9429 -0.7143 1 0.3714
Heavy 0.1429 -0.6571 -0.2571 -0.8286 0.3714 1
Values in bold are different from 0 with a significance level alpha=0,05
At significance level of 0.05, there were no significantly positively correlated
attributes. The highest positive correlation (0.66) was recorded between stiff and
crisp. Significantly negative correlations were noted between natural and crisp,
and, heavy and regular; suggesting possible opposing relationships in perception.
Table 2.8 shows eigenvalues representing contributions to the variability by five
principal components, F1-F5.

29
Table 2.8 Eigenvalues and variability of the five principal components
F1 F2 F3 F4 F5
Eigenvalue 3.0082 2.5435 0.3955 0.0360 0.0168
Variability (%) 50.1366 42.3919 6.5920 0.6002 0.2793
Cumulative % 50.1366 92.5285 99.1206 99.7207 100.0000
Principal components F1 and F2 were retained for further analysis since they
explained a significant percentage (93%) of the variability. Figure 2.6 presents
correlations between attributes and the relationship between factors and sensory
attributes.
Figure 2.6 Correlation circle of the Leading sensory attributes
From the correlation circle (Figure 2.6) and Table 2.9, it is observed that attributes
with the highest factor loadings, in descending order, are: natural, crisp, soft and
heavy. This finding was also replicated with the squared cosines of the sensory
attributes.
Table 2.9 Factor loadings and squared cosines of attributes on principal components
Attribute
Factor loading Squared cosines Contribution (%) to F1
and F2
F1 F2 F1 F2
Stiff -0.605 -0.6663 0.366 0.4439 81
Soft 0.3367 0.9299 0.1133 0.8647 98
Crisp -0.9729 -0.1625 0.9465 0.0264 97
Regular -0.6712 0.7231 0.4506 0.5229 97
Natural 0.9738 -0.0354 0.9482 0.0013 95
Heavy 0.4284 -0.8272 0.1835 0.6843 87
Values in bold indicate figures for which the factor loadings and squared cosines of attributes are the largest
From Table 2.9, natural and crisp were identified closely, as the two most
significant sensory attributes accounting for the variability between cotton and
polyester woven fabrics. This implies that cotton and polyester fabrics can be
distinguished via vision as well. Considering the contribution (%), and
measurability, crisp was selected as the most significant. The evaluation panel
Stiff
Soft
Crisp
Regular
Natural
Heavy
-1
-0.75
-0.5
-0.25
0
0.25
0.5
0.75
1
-1 -0.75 -0.5 -0.25 0 0.25 0.5 0.75 1
F2 (4
2.3
9 %
)
F1 (50.14 %)
Variables (F1 and F2: 92.53 %)

30
defined crisp as being synonymous to firm, dry, crushable, and brittle. These
adjectives define visual and hand aesthetics.
To measure the disparity between cotton and polyester fabrics on the basis of
sensory profiling, we studied the relationship between the fiber generic and
sensory attributes. In the biplot (Figure 2.7), the loading of fabrics shows a
clustering defined by fiber generic and sensory attributes. Polyester fabrics SA,
SK and SE load closely and strongly with stiff, crisp and regular; in opposition to
cotton fabrics with stronger perceptions of natural and soft. The observed loading
of SG fabric closer to 100% cotton fabrics may be attributed to the high content
(67%) of cotton fiber in SG.
Figure 2.7 Biplot showing the clustering of fabrics with attributes
2.3.6 Dissimilarity of PET and cotton woven fabrics
The Euclidean distance was used as a metric to measure the disparity between
polyester and cotton fabrics. Table 2.10 and Figure 2.8 show the dissimilarity
between fabrics, on the basis of the leading sensory attributes.
Table 2.10 Dissimilarity (Euclidean distance) between fabrics
Fabric 1 SE SK SK SA SA SX SK SK SE SA SX SA SA SX SC
Fabric 2 SG SG SX SG SX SG SC SE SC SE SC SC SK SE SG
Dissimilarity 1.49 1.42 1.38 1.24 1.19 1.18 1.14 1.12 1.05 0.96 0.88 0.80 0.58 0.58 0.58
The most dissimilar fabrics are SE and SG, followed by SK and SG. Generally,
the dissimilarity is lower among fabrics of the same or closer fiber generic
composition.
SA SK
SX SE
SC
SG
Stiff
Soft
Crisp
Regular
Natural
Heavy
-4
-3
-2
-1
0
1
2
3
4
-4 -3 -2 -1 0 1 2 3 4 5 6
F2 (4
2.3
9 %
)
F1 (50.14 %)
Biplot of descriptors (axes F1 and F2: 92.53 %)

31
Figure 2.8 Visualization of the Euclidean distance between fabrics: A- Map, B- Graph of distances
SE and SX present unique clustering behavior probably due to their uncommon
characteristics. SE is composed of microfibers which are often finer and may
possess different hand and aesthetic properties compared to conventional fibers.
SX has a particular physical finish— calendered, that also offers a modification to
the visual and hand aesthetics. Especially, the sheen and softness are greatly
enhanced by this finish. It is also important to note the influence of fiber blending
on sensory attributes of SG. With controlled blending, a cotton-like perception
may be optimized since SG clustered closer to cotton fabrics and shows
heightened dissimilarity with PET fabrics. The Euclidean distance between
unconventional fabrics (SG, SE and SX) and the conventional fabrics (SA, SK
and SC) is thus subject to the modified characteristics of the unconventional
fabrics.
2.3.7 Sensory profiles of woven fabrics
Three classes of fabrics were identified each containing two fabrics. Figure 2.9
shows defining profiles and a dendrogram for the sensory taxonomic relationship
of the six fabrics.
Figure 2.9 A- AHC profiles of fabrics by leading attributes; B- Dendrogram of fabrics for the different
classes
The clustering behavior of fabrics in AHC was similar to results in Figure 2.7
from PCA; there is a recognizable clustering of fabrics— SA with SK, SE with
SA
SK
SX SE
SC
SG
-2
-1
0
1
2
3
-3 -2 -1 0 1 2 3
F2 (4
2.3
9 %
)
A F1 (50.14 %)
Fabrics (axes F1 and F2: 92.53 %)
B
0.0
0.2
0.4
0.6
0.8
1.0
1.2
1.4
1.6
SG SG SX SG SX SG SC SE SC SE SC SC SK SE SG
SE SK SK SA SA SX SK SK SE SA SX SA SA SX SC
Eucl
idia
n d
ista
nce
Fabric pairs
Dissimilarity between fabrics
Stiff Soft Crisp Regular Natural Heavy
A
0
0.2
0.4
0.6
0.8
1
1.2
Cla
ss c
entr
oid
s
Sensory attributes and classes
AHC profile plot of classes of fabrics
1 2 3 B
1 2
SA
SK
SC
SG
SX
SE
0
0.2
0.4
0.6
0.8
1
1.2
1.4
1.6
Dis
sim
ilari
ty
3

32
SX, and SG with SC. This pattern is associated with fiber generic and shared
sensory characteristics. The presented profiles indicate that polyester fabrics are
generally perceived stiff, crisp, regular, not heavy, not natural and not soft. On the
other hand, cotton fabrics are generally perceived soft, heavy, natural, not regular,
not stiff, and not crisp. Fabrics SE and SX may not be the adequate reference to
reduce the disparity between cotton and polyester fabrics. However, they present
an interesting profile as their perceived sensory attributes seem to transition
between those of 100% cotton and 100% polyester fabrics. Thus, class 1, which
contains only regular PET fabrics, is the appropriate reference to compare cotton
and polyester fabric sensory attributes. Additionally, fabrics in class 1 present
consistent profiles with respect to opposing attributes. For example, while they are
perceived as the stiffest and crispiest, they are also the least soft and least natural.
From Table 2.11, fabrics (SA and SK) in class 1 stand out as strongly stiff and
crisp, and fairly heavy, with SK as the central object. Fabrics (SX and SE) in class
2 are strongly soft and regular, with SE as the central object. While fabrics (SG
and SC) in class 3 on the other hand, are strongly natural and heavy, with SG at
the centre.
Table 2.11 Class centroids and central objects (fabrics) by AHC of leading attributes
Class Stiff Soft Crisp Regular Natural Heavy
1 (SK) 0.92 0.25 0.92 0.58 0.33 0.67
2 (SE) 0.33 0.92 0.58 0.92 0.50 0.25
3 (SG) 0.50 0.58 0.25 0.25 0.92 0.83
The distance between class central objects was directly related to the Euclidean
distance between fabrics, influenced by their fiber generic. For instance, SK was
closer to SE (1.12) than it is to SG (1.42). Also, SE is closer to SK than it is to SG
(1.49).
The influence of yarn and fabric structure and properties cannot be ignored. The
fabric weight and yarn count are of prominence among others. The yarn count is
integrated in the computation of the weave density. The weave density (WD) was
computed from the formula:
∗ ∗ ∗ ∗ , where, ppi is picks per inch, epi is
ends per inch, C1 and C2 are the weft count and warp count respectively. The
Pearson rank correlation coefficient between the measured fabric weight and the
perceived weight (heavy) was 0.9. Except for fabrics SC and SA, panelists were
able to rank other fabrics nominal to their weight. Despite PET fabric SA being
heavier by 13 GSM, panelists perceived cotton fabric SC as heavier. The
perception of compactness, which is related to the weave density, was
disproportionate to the calculated values. The Pearson’s rank correlation
coefficient between the perceived compactness and the weave density was 0.4.
Although the weave density was generally higher for PET fabrics, the perceived
compactness was highest in cotton fabrics. Thus, these fabric and yarn properties
had no direct influence on perceived attributes. Other inherent properties, such as
mechanical can deeply be evaluated with a study on objective sensory
measurements, which is not within the scope of this specific work.

33
To realize the main objective of the study; which is to determine and reduce the
disparity between cotton and polyester fabrics, the identified most distinguishing
attribute (crisp) needs to be measured objectively. Sensory crispness in
fabrics/textiles has not been explored nor deeply defined by sensory researchers
including the objective evaluation. Objective measurements and definitions of
crispness may differ from the subjective approach. As presented earlier in Table
2.6 and Table 2.7, crisp was found to correlate positively with stiff (0.67) and
negatively with natural (-0.94). While, stiff, negatively correlated with soft (-
0.77). In the sensory evaluation protocol, crisp was also defined by brittleness,
firmness, and crumbliness— which attributes are related to stiffness. Therefore,
reducing the stiffness of polyester would reduce the crispness while enhancing the
soft and natural perception. Although haptic attributes were found to be
significant, visual sensory attributes were more pronounced and represented the
vast of sensory perception. This finding is similar to findings by Xue’s research
team119
on fabric visual tactility and perception. Thus, polyester and cotton fabrics
can also be perceived and discriminated via vision, by their appearance attributes.
In food products, sensory crispness has been defined and associated with fracture
mechanics, micro and macrostructure, and acoustic properties of food among
others120–123
.
2.4 Conclusions
Using sensory analysis, discrimination between cotton and polyester woven
fabrics was achieved using the panel’s descriptors. For the studied fabrics, six key
sensory attributes (crisp, stiff, soft, heavy, natural, and regular) that discriminate
between cotton and polyester woven fabrics were identified; crisp was found to be
the most distinguishing attribute. The disparity between cotton and PET fabrics
was also determined; dissimilarity was larger between fabrics of dissimilar
generic. Polyester fabrics have particular sensory profiles distinct from those of
cotton fabrics; polyester fabrics are especially perceived crisp, stiff, regular and
are not natural. Assessors strongly perceived cotton fabrics as natural, not crisp,
not stiff, and not regular. Also, for the fabrics studied, this study demonstrates that
appearance attributes dominate sensory perception and that cotton and polyester
fabrics can be distinguished via vision. This study also underscores the
significance of other fabric and fiber characteristics such as finishing and structure
in sensory perception. The study of the performance of the sensory panel indicates
that all assessors needed re- training for at least two sensory attributes. The
limitation of these findings includes potential bias that could arise from the use of
panelists with the subject background and any bias that fabric samples may
present in their non uniform appearance. Part II of this study will deal with
functional techniques to reduce the disparity between polyester and cotton fabrics
based on sensory analysis.
34
35
Chapter 3
Sensory analysis of cotton and
functionalized polyester woven
fabrics
3.1 Overview
This study builds on results in Chapter 2, in which the modification of the
stiffness of polyester fabrics was suggested, to reduce the perceived disparity
between cotton and polyester woven fabrics. In this study, the use of sodium
hydroxide (NaOH) and an amino-functional polysiloxane softener, with
atmospheric air plasma pre-oxidation, to modify the stiffness of polyester was
attempted. Sensory evaluation of 20 fabric samples (which included cotton fabrics
and untreated and treated polyester fabrics) was then carried out using a panel of
14 judges, for 11 sensory descriptors. Rank aggregation, sensory clustering,
dissimilarity analysis and profiling were carried out. NaOH and softening
treatment of polyester bridged between cotton and one of the three polyester
fabrics studied. NaOH and softener treated fabrics were perceived soft, smooth,
less crisp, and less stiff compared to untreated polyester fabrics. However, cotton
fabrics were still perceived natural compared to any polyester fabrics. Although
NaOH-treated polyester fabrics had enhanced air permeability and hydrophilicity,
they also presented loss in weight— accompanied with loss in abrasion resistance
and bursting strength. NaOH-treated polyester fabrics became hydrophobic and
less air-permeable when the silicon based softener was added. It is deduced that
characterization by human perception can play a vital role in human centered
production and processing of fabrics. A better understanding of fabric sensory
perceptions was realized by integrating sensory analysis data with objective
measurements data.
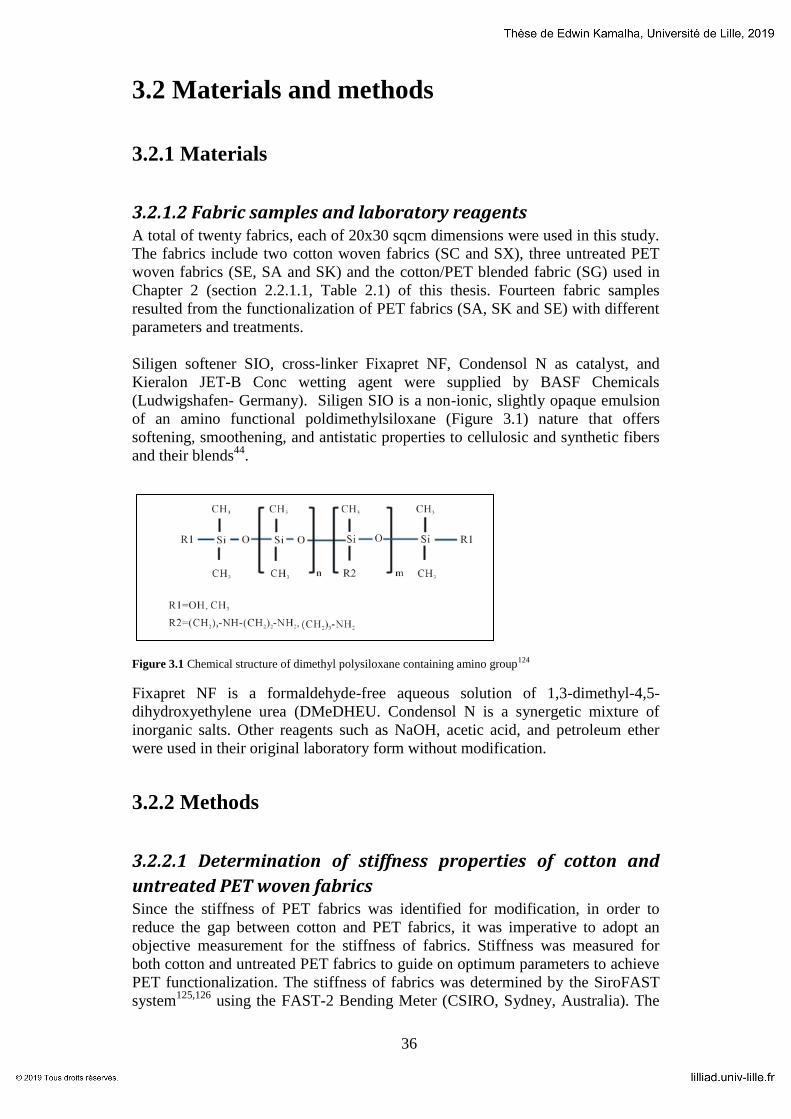
36
3.2 Materials and methods
3.2.1 Materials
3.2.1.2 Fabric samples and laboratory reagents A total of twenty fabrics, each of 20x30 sqcm dimensions were used in this study.
The fabrics include two cotton woven fabrics (SC and SX), three untreated PET
woven fabrics (SE, SA and SK) and the cotton/PET blended fabric (SG) used in
Chapter 2 (section 2.2.1.1, Table 2.1) of this thesis. Fourteen fabric samples
resulted from the functionalization of PET fabrics (SA, SK and SE) with different
parameters and treatments.
Siligen softener SIO, cross-linker Fixapret NF, Condensol N as catalyst, and
Kieralon JET-B Conc wetting agent were supplied by BASF Chemicals
(Ludwigshafen- Germany). Siligen SIO is a non-ionic, slightly opaque emulsion
of an amino functional poldimethylsiloxane (Figure 3.1) nature that offers
softening, smoothening, and antistatic properties to cellulosic and synthetic fibers
and their blends44
.
Figure 3.1 Chemical structure of dimethyl polysiloxane containing amino group124
Fixapret NF is a formaldehyde-free aqueous solution of 1,3-dimethyl-4,5-
dihydroxyethylene urea (DMeDHEU. Condensol N is a synergetic mixture of
inorganic salts. Other reagents such as NaOH, acetic acid, and petroleum ether
were used in their original laboratory form without modification.
3.2.2 Methods
3.2.2.1 Determination of stiffness properties of cotton and
untreated PET woven fabrics Since the stiffness of PET fabrics was identified for modification, in order to
reduce the gap between cotton and PET fabrics, it was imperative to adopt an
objective measurement for the stiffness of fabrics. Stiffness was measured for
both cotton and untreated PET fabrics to guide on optimum parameters to achieve
PET functionalization. The stiffness of fabrics was determined by the SiroFAST
system125,126
using the FAST-2 Bending Meter (CSIRO, Sydney, Australia). The
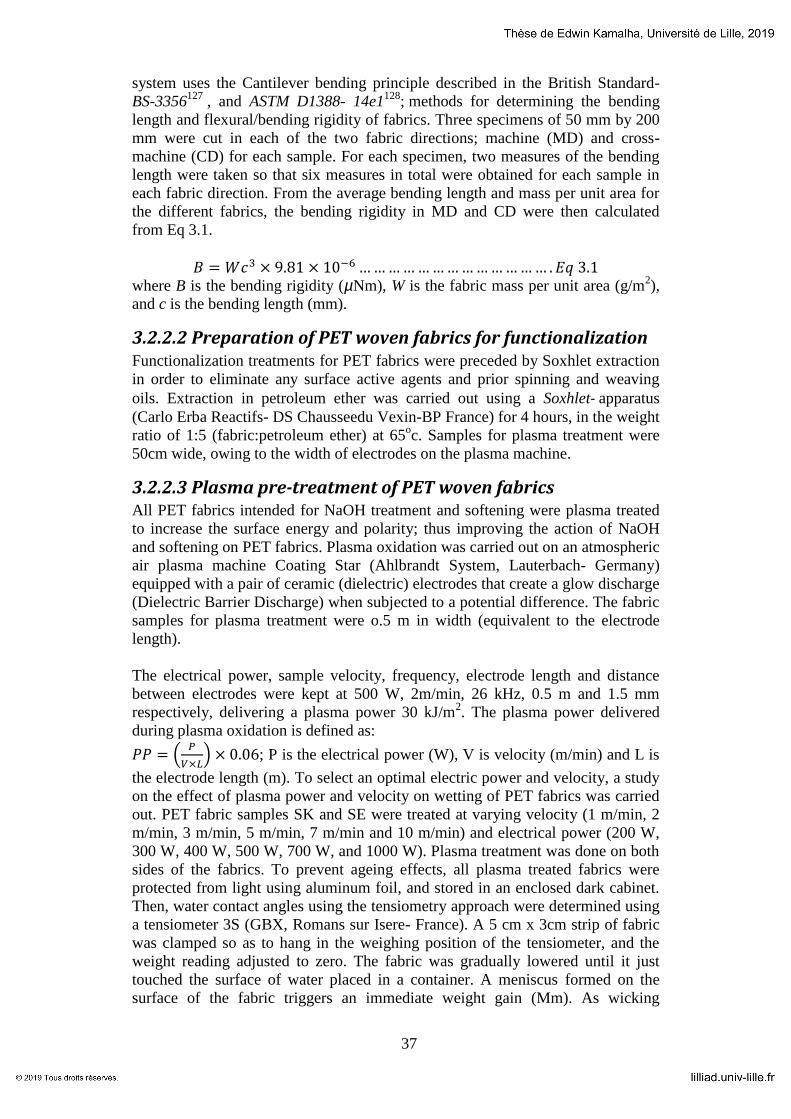
37
system uses the Cantilever bending principle described in the British Standard-
BS-3356127
, and ASTM D1388- 14e1128
; methods for determining the bending
length and flexural/bending rigidity of fabrics. Three specimens of 50 mm by 200
mm were cut in each of the two fabric directions; machine (MD) and cross-
machine (CD) for each sample. For each specimen, two measures of the bending
length were taken so that six measures in total were obtained for each sample in
each fabric direction. From the average bending length and mass per unit area for
the different fabrics, the bending rigidity in MD and CD were then calculated
from Eq 3.1.
where B is the bending rigidity (µNm), W is the fabric mass per unit area (g/m2),
and c is the bending length (mm).
3.2.2.2 Preparation of PET woven fabrics for functionalization Functionalization treatments for PET fabrics were preceded by Soxhlet extraction
in order to eliminate any surface active agents and prior spinning and weaving
oils. Extraction in petroleum ether was carried out using a Soxhlet- apparatus
(Carlo Erba Reactifs- DS Chausseedu Vexin-BP France) for 4 hours, in the weight
ratio of 1:5 (fabric:petroleum ether) at 65oc. Samples for plasma treatment were
50cm wide, owing to the width of electrodes on the plasma machine.
3.2.2.3 Plasma pre-treatment of PET woven fabrics All PET fabrics intended for NaOH treatment and softening were plasma treated
to increase the surface energy and polarity; thus improving the action of NaOH
and softening on PET fabrics. Plasma oxidation was carried out on an atmospheric
air plasma machine Coating Star (Ahlbrandt System, Lauterbach- Germany)
equipped with a pair of ceramic (dielectric) electrodes that create a glow discharge
(Dielectric Barrier Discharge) when subjected to a potential difference. The fabric
samples for plasma treatment were o.5 m in width (equivalent to the electrode
length).
The electrical power, sample velocity, frequency, electrode length and distance
between electrodes were kept at 500 W, 2m/min, 26 kHz, 0.5 m and 1.5 mm
respectively, delivering a plasma power 30 kJ/m2. The plasma power delivered
during plasma oxidation is defined as:
; P is the electrical power (W), V is velocity (m/min) and L is
the electrode length (m). To select an optimal electric power and velocity, a study
on the effect of plasma power and velocity on wetting of PET fabrics was carried
out. PET fabric samples SK and SE were treated at varying velocity (1 m/min, 2
m/min, 3 m/min, 5 m/min, 7 m/min and 10 m/min) and electrical power (200 W,
300 W, 400 W, 500 W, 700 W, and 1000 W). Plasma treatment was done on both
sides of the fabrics. To prevent ageing effects, all plasma treated fabrics were
protected from light using aluminum foil, and stored in an enclosed dark cabinet.
Then, water contact angles using the tensiometry approach were determined using
a tensiometer 3S (GBX, Romans sur Isere- France). A 5 cm x 3cm strip of fabric
was clamped so as to hang in the weighing position of the tensiometer, and the
weight reading adjusted to zero. The fabric was gradually lowered until it just
touched the surface of water placed in a container. A meniscus formed on the
surface of the fabric triggers an immediate weight gain (Mm). As wicking

38
progresses, the weight gain reached a total (Mt) g. The capillary weight (Mc) g
was then determined two minutes after the fabric had been raised from the water
surface. The WCA was computed from Eq 3.2:
;
where, is the meniscus liquid weight , are the water
surface tension (mN/m) and perimeter (mm) of the fabric surface in contact with
water, respectively. The perimeter of the fabric is estimated to be ; where L is
the length. Leroux29
presented a detailed discussion on these computations.
Following a study on the effect of plasma oxidation on the wetting of the PET
samples under study, we opted to fix the electrical power and velocity at 500 W
and 2 m/min respectively, for subsequent plasma treatments. Plasma treatment
was carried out on both sides of the fabric samples. Since ageing affects the
durability of hydrophilic species induced by plasma oxidation46,129
, NaOH and
softening treatments commenced immediately after plasma treatment.
3.2.2.4 NaOH treatment of PET woven fabrics NaOH treatment of plasma treated PET fabrics was carried out in 3% (W/V)
aqueous NaOH, in steel beakers of an AHIBA IR high temperature laboratory
machine (datacolor, Lawrenceville, New Jersey, USA). The fabric:NaOH ratio
was 1:5 at fixed temperature of 100°C or 120
°C depending on the fabric weight.
The NaOH treatment time was varied between 10 and 30 min. NaOH treatment
parameters were adopted following trials and a factorial experimental design.
Treatment temperatures above 120°C were avoided as they were prone to PET
degradation. Treatment parameters were drawn to optimize the reduction of the
stiffness of PET fabrics with minimum loss in weight and strength.
3.2.2.5 Application of the softener on PET woven fabrics The softening recipe was prepared with 10 g/l of Siligen SIO, 50 g/l of Fixapret
NF, and 0.5 g/l Kieralon JET-B Conc. Using acetic acid, the pH of the mixture
was adjusted to 5. The ratio of the softener liquor to fabric was 10:1 giving a wet
pickup range of 70%-80%. The softening process was realized by impregnation
and squeezing with a laboratory padder (MSV textile machinery Lodz, Poland),
and then drying and curing in a stenter (MSV textile machinery Lodz, Poland).
The drying and curing processes were carried out at at100°C (for 60 s) and 170
°C
(for 45 s) respectively, in hot air.
Table 3.1 summarizes the parameters for plasma oxidation, NaOH treatment and
softener application on selected PET fabrics.

39
Table 3.1 Experimental parameters for plasma treatment, NaOH treatment and softening of PET fabrics
Substrate fabric
Treated
fabric
Electric Power
(W)
NaOH Conc
(W/V %)
NaOH
treatment
Temp
(°C)
NaOH
treatment
Time
(Min)
Softener
Applied
SK SK10 500 3 120 10
SK SK10S 500 3 120 10
SK SK15 500 3 120 15
SK SK15S 500 3 120 15
SK SK20 500 3 120 20
SK SK20S 500 3 100 20
SK SK25 500 3 100 25
SK SK30 500 3 120 30
SA SA10 500 3 120 10
SA SA10S 500 3 120 10
SA SA20 500 3 100 20
SA SA20S 500 3 120 20
SE SE20 500 3 100 20
SE SE30 500 3 100 30
The coding for treated fabrics e.g SK20S represents PET fabrics from which they were obtained, the temperature at which they were treated, and S at the end if the softener was
applied to the fabric
3.2.2.6 Determination of the stiffness of NaOH and softener
treated fabrics The stiffness properties of PET fabrics after NaOH and softening treatments were
determined by the SiroFAST system125,126
already described, using the FAST-2
Bending Meter (CSIRO, Sydney, Australia).
3.2.2.7 Sensory panel, descriptors and sensory evaluation Following the study of the performance of the sensory panel in Chapter 2 (section
2.3.3) of this research, retraining and replacement of some panelists was carried
out. Also, the number of assessors was increased from 12 to 14. The sensory panel
comprised of eight male and six female adults aged between 24 and 52 years.
They included three college professors and eleven Doctoral scholars. The racial
distribution was: six European natives, two African natives, four Asian natives,
and two Middle-Eastern natives. All panelists had background training/experience
in textiles/apparel.
Eleven descriptors realized in Chapter 1 (section 2.3.1) of this research by free
choice profiling (FCP)107
: Stiff/inflexible, Soft/not hard, Smooth/not rough,
Heavy/not light, Noisy/pitchy/harsh/not quiet sound,
Crisp/brittle/firm/fresh/crushable/crumbly, Stretchy/elastic/not rigid,
Drapy/hang/enclose, Regular/uniform/even, Natural/not synthetic/not artificial,
and Compact/packed/dense were utilized for this sensory evaluation. Again the
six identified leading attributes- Stiff, Soft, Heavy, Crisp, Regular, and Natural,

40
from the first study, were considered for computations in clustering, and measure
of changes in disparity between cotton and PET fabrics.
Prior to the sensory evaluation, training was delivered by the researcher for all the
panelists, in one session regarding the objectives, materials, evaluation criteria,
and rank estimation. The evaluation criterion and illustration for each descriptor
were discussed, printed and given to each panelist. Panelists washed and rinsed
their hands ten minutes before the sensory experiment. Each panelist received one
specimen for each of the 20 fabric samples, randomly without revealing their
specifications. The panelists nominally ranked the 20 fabrics in descending order
of perceived magnitudes for each of the 11 sensory descriptors.
3.2.2.8 Rank fusion and weighting The unweighted cross-entropy Monte Carlo (CE) algorithm utilizing Kendall’s tau
(CEKnoweight)109–111
was used to aggregate the 14 rank lists into one super list
(fused list), for each descriptor. The CE method, under the function RankAggreg
in software R109
has been explained in Chapter 2 (section 2.2.2.2). Based on 20
fabrics and 14 rank lists for each descriptor, the rank aggregation program below
was written and used for aggregation lists for each descriptor, in separate runs:
CEKnoweights <- RankAggreg(table_matrix, 20, method="CE",
distance="Kendall", N=1960, convIn=30, rho=.1)
The Borda count, also known as the Borda-Kendall (BK) method108
already
described in Chapter 2 (section 2.2.2.2) was then used to convert ranks into
weights.
3.2.2.9 Performance of the sensory panel A brief analysis of the panel’s performance was carried out using ANOVA and
consonance analysis with PCA. The percentage agreement of assessors, assessors’
contribution (%) to variability, and potential errors in assessment were identified.
The percent agreement is the variability carried by the first principal axis of a
descriptor’s PCA (Assessors/Fabrics PCA). The performance of the present
sensory panel was compared to that of the panel utilized in Chapter 2 (section
2.2.2.1) of this thesis.
3.2.2.10 Sensory relationships and the dissimilarity between
cotton and functionalized PET woven fabrics Using PCA, analysis of correlations, and the Euclidean distance, sensory patterns
and dissimilarities between fabrics were elucidated. In particular, the Euclidean
distance was used to determine the changes in the disparity between cotton and
PET fabrics following the NaOH and softening treatments. The Euclidean
distance computed in the first sensory study, based on six fabrics, was compared
with the current distance computed with 20 fabrics. The type of functionalization
and corresponding parameters that yielded the highest bridging between cotton
and PET fabrics were then identified. Using the squared Euclidean distance and
the weighted pair-group average, unsupervised AHC was used to create sensory
clusters and profiles. The algorithm for AHC was executed using XLSTAT, an
add-in for Excel116
. The dissimilarity and agglomeration method used for AHC
were the squared Euclidean distance and weighted pair-group average
respectively. Regression models (Nonlinear and partial least squares) were

41
computed to predict the descriptor crisp, as a response variable with soft, natural,
regular and heavy as predictors.
3.2.2.11 Performance and physical properties of functionalized
PET fabrics NaOH and softener treated PET fabrics were characterized for selected properties
to study the impact of the applied functionalization on sensory and performance
attributes. Comparisons were also done with both cotton and untreated PET
fabrics. All fabric tests were preceded by standard conditioning according to
ISO 139:2005 Textiles— Standard atmospheres for conditioning and testing106
at
20oC (±2
oC) and 65% RH (±4%) for 24 hours.
3.2.2.11.1 Fabric weight (mass per unit area) The fabric weight was determined according to ASTM D3776 / D3776M -
09a(2017): Standard Test Method for Mass Per Unit Area (Weight) of Fabric,
Option C(on swatches)130
. A circular fabric cutter of area 100 cm2 was used to cut
five specimens which were weighed on an electronic balance MS205DU (Mettler-
Toledo, France) to the precision 0.01 mg. The final weight was the average of the
five specimens recorded in g/m2.
3.2.2.11.2 Thickness and surface thickness
The thickness of fabrics was determined according to ASTM D1777 - 96(2015)-
Standard test method for thickness of textile taterials131
. Ten specimens were
measured on a K094 thickness gauge (SDL Atlas, Rock Hill, USA) of foot area 20
cm2 with an applied pressure of 1kPa and the average thickness was recorded in
mm (±0.02 mm). The surface thickness of the fabrics was determined by the
SiroFAST (Fabric assurance by simple testing) sytem125
, using the FAST-1
Compression Meter (CSIRO, Sydney, Australia). Using three obtained
thicknesses T2, T20 and T100; T2 is thickness measured with a pressure load of 2
gf/cm2 (196 Pa), T20 is the thickness measured with a pressure load of 20 gf/cm
2
(1.96 kPa), T100 is the thickness measured with a pressure load of 100 gf/cm2
(9.81 kPa). The surface thickness is expressed as T2-T100 in mm. The surface
thickness can provide information about the handle and appearance of a fabric,
and also on the quality of a surface finish; large values of surface thickness imply
that a fabric is rough, while large changes after washing indicate poor adhesion of
a finish.
3.2.2.11.3 Abrasion resistance
The abrasion resistance of fabrics was determined according to ASTM D4966 -
12(2016) Standard Test Method for Abrasion Resistance of Textile Fabrics
(Martindale Abrasion Tester Method), Option n 1(revolutions needed for
breakage)132
using a Martindale Healink (James H. Heal & Co. Ltd, Halifax
England) at an applied pressure of 9kPa, with felt wool of weight 750 g/m2
and
thickness of 3 mm as the abradant. The method records the number of revolutions
taken for two or more yarn breakages to be detected.
3.2.2.11.4 Bursting strength and strain/elongation at break
The bursting strength of fabrics was determined according to ASTM D6797 - 15
Standard Test Method for Bursting Strength of Fabrics Constant-Rate-of-
Extension (CRE) Ball Burst Test using an Instron 6021/5500 tensile strength
tester (Instron, Norwood, USA) with a Ball Burt Attachment. The balls and ring

42
clamps used were of diameter 20 mm and 25 mm respectively. The average
bursting strength (N) for five specimens was recorded for each tested sample.
Strain values were also recorded along in mm, indicating the elongation at break.
3.2.2.11.5 Fabric extensibility
The FAST-3 Extension Meter (CSIRO, Sydney, Australia) was used to directly
measure the extension (%) in the warp and weft directions according to the
CiroFAST system125
. Six specimens of 200 mm by 50 mm were used for each
fabric. The instrument measures the length increase in a gauge length of 100 mm
when loads are exerted. A weight of 98.1 N/m was used to deliver a force of 100
gf/cm. The average extension in the warp and weft was recorded.
3.2.2.11.6 Air permeability
The air permeability (cm3/s/cm
2) was measured according to ASTM D737-96
133;
1SO 9237(11) using a Textest FX 3300 Air Permeability Tester (Textest AG,
Switzerland). The test volume was 10 l with a pressure drop of 100 Pa against a
test surface of 20cm2. The average of ten measurements made on each sample was
recorded.
3.2.2.11.7 Moisture management
Moisture management properties of fabrics were studied using the moisture
management test (MMT) device (SDL Atlas LLC, Charlotte, NC, USA) in
accordance with AATCC Test Method (TM) 195-2011– Liquid moisture
management properties of textile fabrics134–136
. The MMT provides objective
measurements and gives an overall evaluation of in-plane and off-plane
wettability of fabrics. A predetermined amount of conductive liquid dropped on
the top surface of the test fabric is evaluated for 120 seconds. The top and bottom
radial spreading and absorption behavior is recorded due to changes in the
electrical resistance of the specimen. Predetermined indices are used to grade and
classify the fabrics according to their moisture management behavior.
3.3 Results and discussion
3.3.1 Wetting of plasma modified PET
The average water contact angles (WCAs) of untreated PET fabrics SE and SK
were 79o and 101
o respectively. Regardless of the plasma power and sample
velocity, the WCAs following plasma oxidation averaged at 49o and 89
o for SE
and SK respectively. The microfiber fabric SE experienced increased wetting
compared to the twill weave fabric SK, of conventional filament yarn. Any
decrease in speed or increase in plasma power was of negligible consequence on
these WCAs. However, the capillary weight of plasma-treated PET samples
increased with respect to plasma power; the highest values of Mc (300 mg) were
obtained at the lowest velocities (1-3 m/min). This is because at low speeds,
fabrics stay longer between electrodes and allow higher plasma power to be
delivered per unit area, on fiber surfaces inside the fabric structure. Electrical
power between 400 W and 100 W at speeds between 1 m/min and 10 m/min was
sufficient enough to impart moisture polar groups to the surface of PET in order to
facilitate wetting. Plasma oxidation partially breaks chemical bonds and creates

43
polar groups, and facilitates the creation and growth of reactive free end
radicals137
which react with reactive species with a resulting increase in surface
energy. Particularly, plasma oxidation has been noted to increase the
concentration of oxygen atoms on the surface of PET fabrics138
, consequently,
enhancing the wetting of PET woven fabrics. Thus, plasma re-treatment preceded
the NaOH and softening treatments in order to enhance the absorption.
3.3.2 Stiffness of PET and cotton fabrics
The guiding objective of this study was to alter the stiffness of PET fabrics in
relation to cotton fabrics. Following the treatment of PET fabrics (SK, SE and
SA) with NaOH and Siligen softener SIO, 14 fabrics were realized by varying the
NaOH treatment temperature and time. The stiffness properties of NaOH treated
and softener treated fabrics are presented in Table 3.2 along with untreated PET
fabrics (SK, SA and SE), cotton fabrics (SC and SX) and blended fabric SG.
Table 3.2 Stiffness properties of NaOH and softener treated PET fabrics compared with cotton and untreated
PET fabrics
Fabric Weight g/m2 C warp (mm) C weft (mm) B Warp (µNm) B Weft (µNm)
SK 229.5 24.5 20 33.1 18.0
SK10 165.2 17.0 15 8.0 5.5
SK10S 169.8 18.0 15 9.7 5.6
SK15 141.0 17.0 14.5 6.8 4.2
SK15S 144.0 16.5 15.1 6.3 4.9
SK20 141.0 19.1 18.3 9.6 8.5
SK20S 148.0 16.3 15.8 6.3 5.7
SK25 94.9 15.0 13 3.1 2.0
SK30 80.4 12.5 11.1 1.5 1.1
SA 149.8 25.1 20.5 23.2 12.7
SA10 97.9 12.1 11.8 1.7 1.6
SA10S 96.0 12.0 11.5 1.6 1.4
SA20 67.5 11.9 10.9 1.1 0.9
SA20S 70.7 11.0 11 0.9 0.9
SE 96.0 21.3 16.1 9.1 3.9
SE20 86.4 14.2 12.2 2.4 1.5
SE30 84.7 16.7 12.2 3.9 1.5
SC 136.5 17.0 15.5 6.6 5.0
SX 131.5 18.0 17.5 7.5 6.9
SG 257.8 15.0 16 8.5 10.4
C is the bending length, B is the bending rigidity. The coding for treated fabrics e.g SK20S represents PET fabrics from which they were obtained, the temperature at which they
were treated, and S at the end if the softener was applied to the fabric. SC and SX are cotton fabrics; SG is a blend of cotton (67%) and PET (33%)

44
At 130oC, PET degrades and disintegrates in NaOH at the experimental
concentration of 3%. By comparison, untreated PET fabrics generally had higher
bending length, both for warp and weft, compared to cotton fabrics. Except SK30,
NaOH and softener treatment of SK yielded fabrics with bending lengths close to
values for cotton fabrics and the blended fabric SG. Further, the bending rigidity
for SK-derived fabrics were much closer to those of cotton fabrics compared to
other PET samples. NaOH treatment of SE yielded only SE30 with only the warp
bending length close to values for cotton fabrics. The weft bending lengths for SE
derived fabrics and the ensuing bending rigidity were much lower compared to
cotton fabrics. Sample SA had the most pronounced response to NaOH treatment.
The bending lengths, in both fabric directions and the bending rigidity of all SA-
derived fabrics were the lowest. The stiffness values reduced with increasing
NaOH treatment time. Application of the softener slightly lowered the bending
rigidity. Low values of bending rigidity (below 5 µNm) have been associated
with cutting difficulties during garment making. These measured values, however,
may not represent the perceived relative stiffness when judged with human
assessors.
In an earlier study, Dave’s research team35
found that the flexural rigidity of PET
fabrics decreased with concentration and time of NaOH treatment; the decrease
was higher at the initial treatment times and lowered as weight loss progressed.
Mousazadegan36
noted that the bending length related non-linearly with fabric
weight loss, and predicted that the yarn/fiber diameter was pertinent to the
bending length; and that bending stiffness decreased by the second order of
weight reduction rate during NaOH treatment. NaOH and softening treatment of
PET fabrics effectively altered the stiffness properties of PET fabrics, bridging
close to cotton fabric stiffness properties. A sensory analysis to evaluate the
impact of these treatments on the perceived difference between cotton and PET
fabrics was necessary.
3.3.3 Rank lists and rank aggregation
The sensory evaluation yielded 14 rank lists for each of the 11 descriptors. Table
3.3 shows, in descending order of magnitudes of sensations, the optimal rank lists
for all 11 descriptors obtained by the unweighted cross-entropy Monte Carlo
(CEKnoweight) algorithm.

45
Table 3.3 Aggregated rank lists of 20 fabrics; treated PET, cotton and untreated PET fabrics
Rank Stiff Soft Smooth Heavy Noisy Crisp Stretchy Drapy Regular Natural Compact
1 SA SK30 SK30 SG SK SA SE30 SA20 SK SG SK
2 SK SA20S SK25 SK SA SK SE20 SA20S SK10 SC SG
3 SC SA20 SK15S SA SE SE SK30 SA10 SK20 SA10S SK10
4 SG SA10 SK20S SK10 SX SC SK20S SK30 SE SA20 SK15S
5 SX SK25 SE30 SX SK10 SG SK25 SA10S SK25 SA10 SK20
6 SE SA10S SE20 SK10S SC SX SE SK25 SK15 SA20S SK10S
7 SK10 SK15S SK15 SC SG SK10 SA10S SE20 SK20S SX SK15
8 SK10S SE30 SA20S SK20 SK20 SK20 SK15S SK15S SK10S SK30 SK20S
9 SK20 SE20 SA20 SK20S SE20 SK10S SK15 SK15 SK15S SK25 SK25
10 SK20S SK20S SK10S SK15S SK10S SK15 SA20S SE30 SK30 SK15 SX
11 SK15 SK15 SA10S SK15 SE30 SE30 SK10 SK20S SA10 SK15S SE20
12 SE20 SK20 SA10 SE SK20S SE20 SK10S SK10 SX SE30 SK30
13 SK15S SK10S SK20 SK25 SK15S SK20S SK20 SK20 SA10S SK20S SE
14 SE30 SK10 SK10 SE20 SK15 SK15S SA20 SK10S SA SK20 SC
15 SK25 SX SX SE30 SK25 SK25 SA10 SX SA20 SK10 SE30
16 SA10 SE SE SA10S SK30 SA10 SK SG SE30 SE20 SA
17 SA10S SC SC SA10 SA10 SA10S SA SC SE20 SA SA20
18 SK30 SG SK SK30 SA10S SK30 SC SE SA20S SK10S SA10
19 SA20 SK SG SA20S SA20 SA20S SX SK SG SE SA10S
20 SA20S SA SA SA20 SA20S SA20 SG SA SC SK SA20S
The coding for treated fabrics e.g SK20S represents PET fabrics from which they were obtained, the temperature at which they were treated, and S at the end if the softener was
applied to the fabric. SC and SX are cotton fabrics; SG is a blend of cotton (67%) and PET (33%)
One prominent observation is that untreated PET fabrics lead in permutations of
stiff, crisp, noisy, regular and compact. Cotton fabrics were still perceived as more
natural, despite trailing in expected descriptors, such as soft, as was deduced in
the first part of this study. For several descriptors of tactility, treated PET fabrics
are perceived softer, smoother and drapy. These are explored further in the section
on clustering and profiling of fabrics. Softened fabrics were particularly perceived
soft (more for SA derived) and smooth (more for SK derived).
Table 3.4 presents the BK weights of ranks; (
.
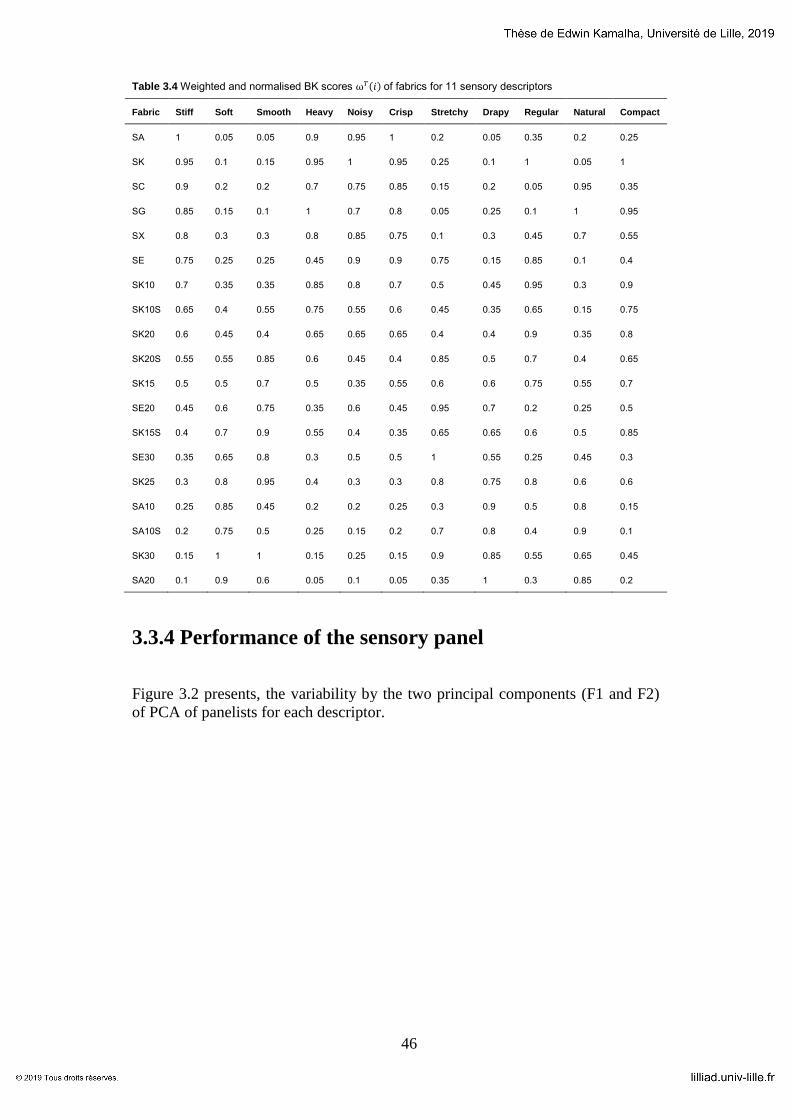
46
Table 3.4 Weighted and normalised BK scores of fabrics for 11 sensory descriptors
Fabric Stiff Soft Smooth Heavy Noisy Crisp Stretchy Drapy Regular Natural Compact
SA 1 0.05 0.05 0.9 0.95 1 0.2 0.05 0.35 0.2 0.25
SK 0.95 0.1 0.15 0.95 1 0.95 0.25 0.1 1 0.05 1
SC 0.9 0.2 0.2 0.7 0.75 0.85 0.15 0.2 0.05 0.95 0.35
SG 0.85 0.15 0.1 1 0.7 0.8 0.05 0.25 0.1 1 0.95
SX 0.8 0.3 0.3 0.8 0.85 0.75 0.1 0.3 0.45 0.7 0.55
SE 0.75 0.25 0.25 0.45 0.9 0.9 0.75 0.15 0.85 0.1 0.4
SK10 0.7 0.35 0.35 0.85 0.8 0.7 0.5 0.45 0.95 0.3 0.9
SK10S 0.65 0.4 0.55 0.75 0.55 0.6 0.45 0.35 0.65 0.15 0.75
SK20 0.6 0.45 0.4 0.65 0.65 0.65 0.4 0.4 0.9 0.35 0.8
SK20S 0.55 0.55 0.85 0.6 0.45 0.4 0.85 0.5 0.7 0.4 0.65
SK15 0.5 0.5 0.7 0.5 0.35 0.55 0.6 0.6 0.75 0.55 0.7
SE20 0.45 0.6 0.75 0.35 0.6 0.45 0.95 0.7 0.2 0.25 0.5
SK15S 0.4 0.7 0.9 0.55 0.4 0.35 0.65 0.65 0.6 0.5 0.85
SE30 0.35 0.65 0.8 0.3 0.5 0.5 1 0.55 0.25 0.45 0.3
SK25 0.3 0.8 0.95 0.4 0.3 0.3 0.8 0.75 0.8 0.6 0.6
SA10 0.25 0.85 0.45 0.2 0.2 0.25 0.3 0.9 0.5 0.8 0.15
SA10S 0.2 0.75 0.5 0.25 0.15 0.2 0.7 0.8 0.4 0.9 0.1
SK30 0.15 1 1 0.15 0.25 0.15 0.9 0.85 0.55 0.65 0.45
SA20 0.1 0.9 0.6 0.05 0.1 0.05 0.35 1 0.3 0.85 0.2
3.3.4 Performance of the sensory panel
Figure 3.2 presents, the variability by the two principal components (F1 and F2)
of PCA of panelists for each descriptor.

47
Figure 3.2 PCA plots of 11 descriptors showing factor loadings and relative correlation between assessors
For all the descriptors, significant proportions of assessors’ contributions were
carried by F1. In 55% of the descriptors, F1 carried more than 80% of the
variability. Moreover, in 67% of the descriptors, the variance for F1 was above
70%. Hence, it was also reasonable to retain the first principal component alone,
for further analysis. In this analysis however, F1 and F2 were considered to
compute other analyses. The highest percent agreement (93.6%) was recorded
A1
A2 A3
A4
A5
A6
A7 A8 A9 A10 A11
A12
A13 A14
-1
-0.75
-0.5
-0.25
0
0.25
0.5
0.75
1
-1 -0.75 -0.5 -0.25 0 0.25 0.5 0.75 1
F2 (3
.03
%)
F1 (90.55 %)
Stiff (F1 and F2: 93.58 %)
A1 A2 A3
A4 A5
A6
A7
A8 A9
A10 A11 A12 A13
A14
-1
-0.75
-0.5
-0.25
0
0.25
0.5
0.75
1
-1 -0.75 -0.5 -0.25 0 0.25 0.5 0.75 1
F2 (3
.76
%)
F1 (88.75 %)
Soft (F1 and F2: 92.51 %)
A1 A2
A3 A4 A5
A6
A7
A8 A9 A10
A11
A12 A13
A14
-1
-0.75
-0.5
-0.25
0
0.25
0.5
0.75
1
-1 -0.75 -0.5 -0.25 0 0.25 0.5 0.75 1
F2 (3
.82
%)
F1 (84.54 %)
Heavy (F1 and F2: 88.36 %)
A1
A2 A3 A4 A5
A6 A7
A8 A9 A10
A11
A12
A13
A14
-1
-0.75
-0.5
-0.25
0
0.25
0.5
0.75
1
-1 -0.75 -0.5 -0.25 0 0.25 0.5 0.75 1
F2 (5
.82
%)
F1 (82.57 %)
Crisp (F1 and F2: 88.38 %)
A1
A2
A3
A4
A5
A6 A7
A8 A9
A10
A11 A12 A13
A14
-1
-0.75
-0.5
-0.25
0
0.25
0.5
0.75
1
-1 -0.75 -0.5 -0.25 0 0.25 0.5 0.75 1
F2 (9
.64
%)
F1 (64.58 %)
Regular (F1 and F2: 74.23 %)
A1
A2
A3
A4
A5
A6
A7 A8
A9
A10 A11 A12
A13
A14
-1
-0.75
-0.5
-0.25
0
0.25
0.5
0.75
1
-1 -0.75 -0.5 -0.25 0 0.25 0.5 0.75 1
F2 (1
1.6
5 %
)
F1 (63.68 %)
Natural (F1 and F2: 75.33 %)
A1
A2 A3 A4 A5 A6 A7
A8
A9
A10
A11 A12
A13
A14
-1
-0.75
-0.5
-0.25
0
0.25
0.5
0.75
1
-1 -0.75 -0.5 -0.25 0 0.25 0.5 0.75 1
F2 (6
.62
%)
F1 (75.50 %)
Smooth (F1 and F2: 82.12 %)
A1 A2 A3
A4
A5
A6
A7
A8
A9
A10
A11
A12
A13
A14
-1
-0.75
-0.5
-0.25
0
0.25
0.5
0.75
1
-1 -0.75 -0.5 -0.25 0 0.25 0.5 0.75 1
F2 (1
0.0
7 %
)
F1 (72.06 %)
Noisy (F1 and F2: 82.13 %)
A1
A2 A3
A4
A5
A6
A7
A8
A9
A10 A11 A12 A13
A14
-1
-0.75
-0.5
-0.25
0
0.25
0.5
0.75
1
-1 -0.75 -0.5 -0.25 0 0.25 0.5 0.75 1
F2 (1
7.9
4 %
)
F1 (60.24 %)
Stretchy (F1 and F2: 78.18 %)
A1 A2
A3
A4
A5
A6
A7 A8
A9
A10 A11
A12
A13 A14
-1
-0.75
-0.5
-0.25
0
0.25
0.5
0.75
1
-1 -0.75 -0.5 -0.25 0 0.25 0.5 0.75 1
F2 (3
.37
%)
F1 (88.56 %)
Drapy (F1 and F2: 91.93 %)
A1
A2
A3
A4
A5
A6 A7 A8
A9
A10
A11 A12
A13
A14
-1
-0.75
-0.5
-0.25
0
0.25
0.5
0.75
1
-1 -0.75 -0.5 -0.25 0 0.25 0.5 0.75 1
F2 (5
.73
%)
F1 (80.71 %)
Compact (F1 and F2: 86.45 %)

48
with descriptor stiff. Table 3.5 presents a summary of the panel’s performance;
errors based on Figure 3.2, ANOVA, the percent agreement from PCA of
assessors, and the average contribution (%) of assessors on F1 and F2. Included
also, is the percent agreement from the first sensory evaluation (section 2.2.2.1).
Table 3.5 Summary of assessors’ performance: percent agreement, and assessors’ errors
Descriptor F *Pr > F
%
agreement
Initial %
agreement
Average
contribution
(%) of
assessors
on F1 and
F2
Assessors
below average
contribution on
F1 and F2
Assessors
with
crossover
errors
Assessors
with a
magnitude
error
Assessors
with a
sensitivity
error
Stiff 124 <0.0001 91 62 93.5 1,2,3,9,10,14 - - -
Soft 101 <0.0001 89 63 92.5 5,6,8,9,11,12,14 - - -
Smooth 40 <0.0001 76 57 82.1 1,5,6,8,9,14 - - -
Heavy 70 <0.0001 85 78 88.4 3,6,8,11 - - -
Noisy 31 <0.0001 72 73 82.1 3,5,7,9,10,14 7 -
Crisp 59 <0.0001 88 76 92.5 4,6,7,8,13 - 13,14 9
Stretchy 18 <0.0001 60 50 78.2 1,5,6,8,13 1,6,14 -
Drapy 100 <0.0001 89 66 91.9 3,4,9,10,11 - -
Regular 23 <0.0001 65 54 74.2 2,5,8,9,10 - 6,9 -
Natural 20 <0.0001 64 87 75.3 1,4,6,8,11 9 6 -
Compact 54 <0.0001 81 61 86.4 4,6,7,10 - - -
*The values were computed at significance level 0.05
The type III Sum of Squares analysis from ANOVA with a regression model
Y=mu+P+J+P*J (J and P*J are random factors) showed that, all the 11 descriptors
were significant and had product (fabric) effects at a significance level of 5%; as
all p-values were <0.0001 (Table 3.5).
Compared to the first sensory panel evaluation, the percent agreement notably
increased for eight attributes. The statistical significance for drapy and compact
also improved. The reduction in the percent agreement for natural and compact
could arise from the increased number of PET fabric samples with only a little
variation in the functionalization parameters. It appears that panelists well
evaluated hand attributes compared to appearance related attributes.
Cross-over errors (ratings’ inversion) are identified by observing assessors
clustering in opposite quadrants from the rest of the panel. There was no cross-
over error detected among panelists. Magnitude errors apply where a panelist
seems to use lower or higher estimations compared to other assessors. Magnitude
errors were noticed by large margins of variations in factor loading for some
panelists compared to the vast of the panel. However, in rank-based evaluations, it
is complex to identify magnitude errors since assessors do not use a rating scale.
Sensitivity errors are characterized by very short vectors or low total percent
contribution and low factor loading. Compared to the first sensory evaluation, the
number of errors was significantly reduced by 88%, 18% and 92% for sensitivity,
magnitude and crossover respectively.
Since each judge only evaluated each fabric once for a descriptor; as the panel
regression is based on ANOVA, it would require at least two observations of the
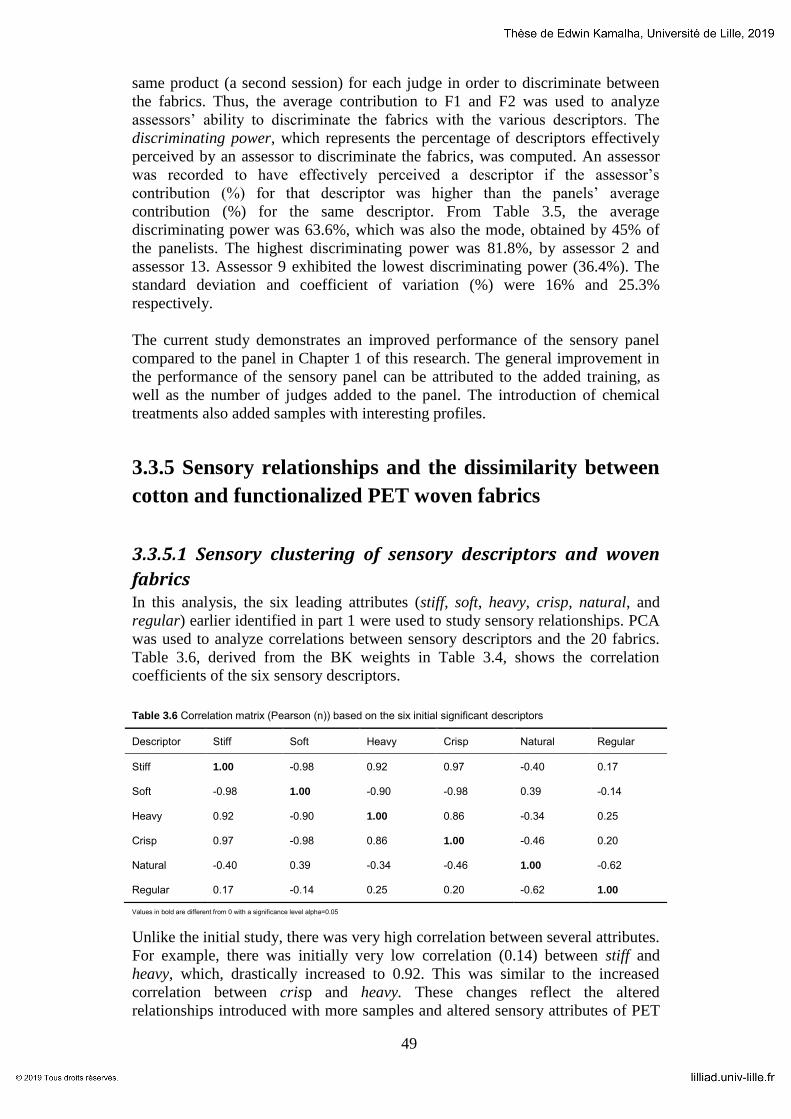
49
same product (a second session) for each judge in order to discriminate between
the fabrics. Thus, the average contribution to F1 and F2 was used to analyze
assessors’ ability to discriminate the fabrics with the various descriptors. The
discriminating power, which represents the percentage of descriptors effectively
perceived by an assessor to discriminate the fabrics, was computed. An assessor
was recorded to have effectively perceived a descriptor if the assessor’s
contribution (%) for that descriptor was higher than the panels’ average
contribution (%) for the same descriptor. From Table 3.5, the average
discriminating power was 63.6%, which was also the mode, obtained by 45% of
the panelists. The highest discriminating power was 81.8%, by assessor 2 and
assessor 13. Assessor 9 exhibited the lowest discriminating power (36.4%). The
standard deviation and coefficient of variation (%) were 16% and 25.3%
respectively.
The current study demonstrates an improved performance of the sensory panel
compared to the panel in Chapter 1 of this research. The general improvement in
the performance of the sensory panel can be attributed to the added training, as
well as the number of judges added to the panel. The introduction of chemical
treatments also added samples with interesting profiles.
3.3.5 Sensory relationships and the dissimilarity between
cotton and functionalized PET woven fabrics
3.3.5.1 Sensory clustering of sensory descriptors and woven
fabrics In this analysis, the six leading attributes (stiff, soft, heavy, crisp, natural, and
regular) earlier identified in part 1 were used to study sensory relationships. PCA
was used to analyze correlations between sensory descriptors and the 20 fabrics.
Table 3.6, derived from the BK weights in Table 3.4, shows the correlation
coefficients of the six sensory descriptors.
Table 3.6 Correlation matrix (Pearson (n)) based on the six initial significant descriptors
Descriptor Stiff Soft Heavy Crisp Natural Regular
Stiff 1.00 -0.98 0.92 0.97 -0.40 0.17
Soft -0.98 1.00 -0.90 -0.98 0.39 -0.14
Heavy 0.92 -0.90 1.00 0.86 -0.34 0.25
Crisp 0.97 -0.98 0.86 1.00 -0.46 0.20
Natural -0.40 0.39 -0.34 -0.46 1.00 -0.62
Regular 0.17 -0.14 0.25 0.20 -0.62 1.00
Values in bold are different from 0 with a significance level alpha=0.05
Unlike the initial study, there was very high correlation between several attributes.
For example, there was initially very low correlation (0.14) between stiff and
heavy, which, drastically increased to 0.92. This was similar to the increased
correlation between crisp and heavy. These changes reflect the altered
relationships introduced with more samples and altered sensory attributes of PET

50
fabrics. The descriptors natural and regular appear more independent and less
correlated to other attributes. Stiff, crisp and heavy were highly interdependent.
The Eigen decomposition (Table 8) and Figure 3 show that F1 and F2 carried a
significant amount of variability (91.1%) of the PCA to represent data on the six
descriptors.
Table 3.7 Eigenvalues and variability of five principal components
F1 F2 F3 F4 F5 F6
Eigenvalue 4.11 1.35 0.39 0.122 0.02 0.01
Variability (%) 68.52 22.53 6.44 2.03 0.26 0.22
Cumulative % 68.52 91.05 97.50 99.53 99.78 100
Figure 3.3 Visualization of correlations between descriptors and principle components F1 and F2
From Table 3.6 and Table 3.7, the factor loadings (correlation between descriptors
and factors), and squared cosines of descriptors were computed as in Table 3.8.
Table 3.8 Factor loadings and squared cosines of attributes on principal components F1 and F2
Descriptor
Factor loading Squared cosines Contribution (%) to F1
and F2
F1 F2 F1 F2
Stiff 0.9744 -0.1992 0.9495 0.0397 98.9
Soft -0.9671 0.2205 0.9354 0.0486 98.4
Crisp 0.9682 -0.1413 0.9374 0.0200 95.8
Regular 0.3439 0.7231 0.1183 0.7318 85.0
Natural -0.5595 0.8554 0.3130 0.4887 80.2
Heavy 0.9261 -0.1524 0.8577 0.0232 88.1
Values in bold indicate figures for which the factor loadings and squared cosines of attributes are the largest
The large values of the squared cosines as well as the factor loadings indicate that
the three descriptors; stiff, soft and crisp were very significant or the most
significant in the variability. The descriptor natural lost the initial position of
significance discovered in part 1 of this research. Natural and regular contributed
Stiff
Soft
Heavy Crisp
Natural
Regular
-1
-0.75
-0.5
-0.25
0
0.25
0.5
0.75
1
-1 -0.75 -0.5 -0.25 0 0.25 0.5 0.75 1
F2 (
22
.53
%)
F1 (68.52 %)
Variables (axes F1 and F2: 91.05 %)
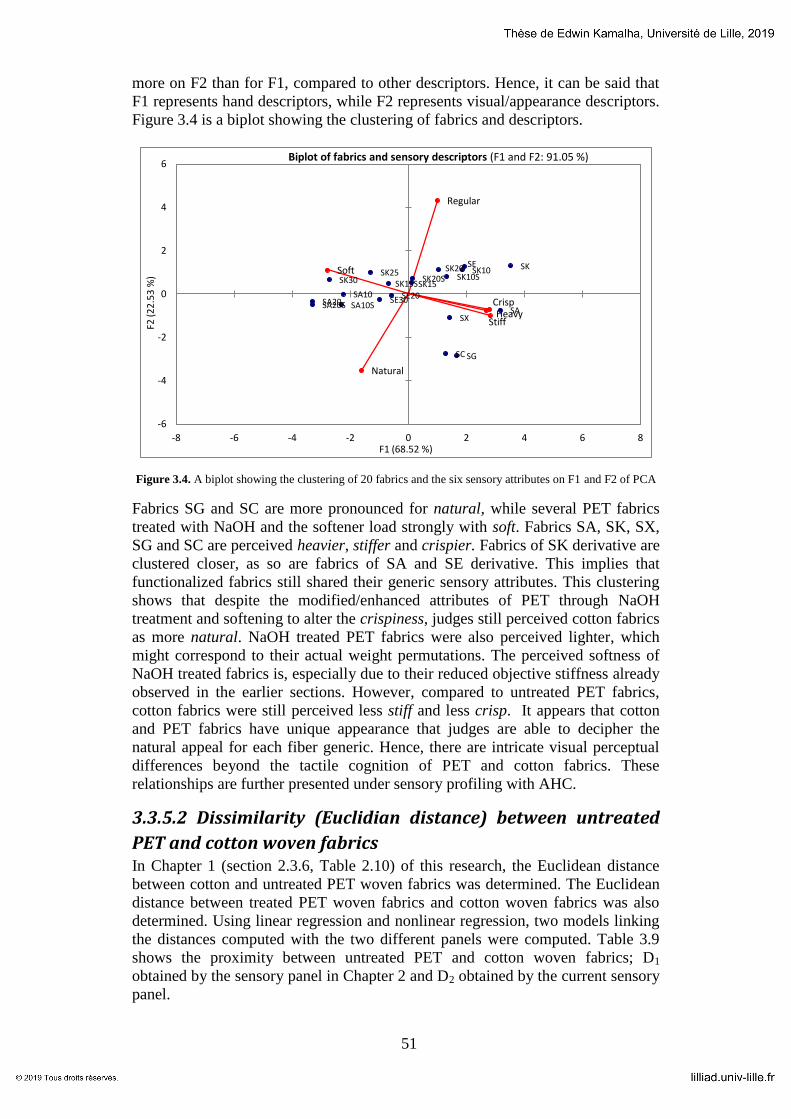
51
more on F2 than for F1, compared to other descriptors. Hence, it can be said that
F1 represents hand descriptors, while F2 represents visual/appearance descriptors.
Figure 3.4 is a biplot showing the clustering of fabrics and descriptors.
Figure 3.4. A biplot showing the clustering of 20 fabrics and the six sensory attributes on F1 and F2 of PCA
Fabrics SG and SC are more pronounced for natural, while several PET fabrics
treated with NaOH and the softener load strongly with soft. Fabrics SA, SK, SX,
SG and SC are perceived heavier, stiffer and crispier. Fabrics of SK derivative are
clustered closer, as so are fabrics of SA and SE derivative. This implies that
functionalized fabrics still shared their generic sensory attributes. This clustering
shows that despite the modified/enhanced attributes of PET through NaOH
treatment and softening to alter the crispiness, judges still perceived cotton fabrics
as more natural. NaOH treated PET fabrics were also perceived lighter, which
might correspond to their actual weight permutations. The perceived softness of
NaOH treated fabrics is, especially due to their reduced objective stiffness already
observed in the earlier sections. However, compared to untreated PET fabrics,
cotton fabrics were still perceived less stiff and less crisp. It appears that cotton
and PET fabrics have unique appearance that judges are able to decipher the
natural appeal for each fiber generic. Hence, there are intricate visual perceptual
differences beyond the tactile cognition of PET and cotton fabrics. These
relationships are further presented under sensory profiling with AHC.
3.3.5.2 Dissimilarity (Euclidian distance) between untreated
PET and cotton woven fabrics In Chapter 1 (section 2.3.6, Table 2.10) of this research, the Euclidean distance
between cotton and untreated PET woven fabrics was determined. The Euclidean
distance between treated PET woven fabrics and cotton woven fabrics was also
determined. Using linear regression and nonlinear regression, two models linking
the distances computed with the two different panels were computed. Table 3.9
shows the proximity between untreated PET and cotton woven fabrics; D1
obtained by the sensory panel in Chapter 2 and D2 obtained by the current sensory
panel.
SA
SK
SC SG
SX
SE SK10
SK10S SK20
SK20S SK15
SE20
SK15S
SE30
SK25
SA10 SA10S
SK30
SA20 SA20S
Stiff
Soft
Heavy Crisp
Natural
Regular
-6
-4
-2
0
2
4
6
-8 -6 -4 -2 0 2 4 6 8
F2 (2
2.5
3 %
)
F1 (68.52 %)
Biplot of fabrics and sensory descriptors (F1 and F2: 91.05 %)

52
Table 3.9 Euclidean distance between cotton and untreated PET fabrics computed with the two different panels
Fabric 1 SE SK SK SA SA SK SE SA SX
Fabric 2 SG SG SX SG SX SC SC SC SE
D 1 1.49 1.42 1.38 1.24 1.19 1.14 1.05 0.80 0.58
D 2 1.31 1.32 0.92 0.89 0.66 1.34 1.21 0.86 0.82
D1
is the Euclidean distance with the 1st sensory panel; D2 is the Euclidean distance with the 2nd sensory evaluation
From Table 3.9, the Euclidean distance computed from the two sensory panels is
different, for all sets of fabrics; despite the number of descriptors and criteria for
evaluation being the same. A Pearson correlation coefficient of 0.45 was found
between D1 and D2. The equation of the linear regression model (Eq 3.3) and
nonlinear regression models (Eq 3.4) were computed to relate the two distances
D1 and D2.
(Nonlinear
regression)
(Linear regression);
The observed inter panel differences could stem from the introduction of new
samples and some variation in the panel performances. Following the discovery of
discrepancy in the untreated PET fabric-cotton fabric distances from these two
sensory panels, our measure of the changes in the disparity between cotton and
PET woven fabrics was based on the second sensory panel.
3.3.5.3 Dissimilarity between fabrics after NaOH and softening
treatments In this analysis, dissimilarities were computed and treatments that bridged more
between PET and cotton fabrics were identified. Figure 3.5 shows the proximity
mapping of fabrics.
Figure 3.5 Mapping of the dissimilarity between fabrics based on the Euclidean distance
The mapping of fabrics (Figure 3.5) shows that generally, the disparity between
some PET fabrics and cotton fabrics was reduced by NaOH treatments or the
combination with softening. The largest Euclidean distance was between
SA
SK
SC SG
SX
SE SK10 SK10S
SK20 SK20S SK15
SE20
SK15S
SE30
SK25
SA10
SA10S
SK30
SA20 SA20S
-3
-2
-1
0
1
2
3
-4 -3 -2 -1 0 1 2 3 4
F2 (2
2.5
3 %
)
F1 (68.52 %)
Proximity map of fabrics(F1 and F2: 91.05 %)

53
untreated PET fabric SK and SA. The NaOH and/or softening treatment of SA
increased the disparity between SA and cotton fabrics. Cotton fabrics and the
blended fabric SG remained closely related, and in one cluster, while treated PET
fabrics also formed clusters with respect to their generic sources. The changes in
the Euclidean distance after functionalization of PET fabrics can be visualized by
the bar plots in Figure 3.6.
Figure 3.6 Euclidean distance: between untreated PET fabric SK and cotton fabrics, and between SK-derived
fabrics and cotton fabrics. The dark bars represent the Euclidean distance between SK and cotton fabrics (SC
and SX) and the blended fabric (SG)
The relative changes in the proximity due to the different treatment parameters
can be estimated by comparing the untreated fabrics’ bar plots with the treated
fabrics’ bar plots, for each fabric. Table 3.10 shows the percentage reduction in
the Euclidean distance between SK and cotton fabrics due to NaOH and softening
treatments.
Table 3.10 Percentage reduction in the Euclidean distance between cotton fabrics and SK, with
functionalization
SK-derived
fabric
Temp
(°C)
Time
(min)
Soften
er
Reduction (%)
SK/SC
Reduction (%)
SK/SG
Reduction (%)
SK/SX
SK15S 120 15 15.65 10.04 15.45
SK20 120 20 15.65 11.65 29.56
SK10 120 10 13.61 13.37 28.93
SK20S 120 20 18.85 13.96 27.90
SK10S 120 10 19.36 15.98 31.25
SK15 120 15 24.26 17.62 33.66
The temperature and time represent the conditions during the NaOH treatment of SK
Treated PET fabric SK15 had the lowest disparity with all cotton fabrics, and the
blended fabric SG. Thus, the NaOH treatment of SK at 120°C, for 15 minutes was
more effective in bridging between cotton fabrics and PET fabric SK. Fabric
SK15 was closely followed by SK10S and SK20S. The introduction of the
softener onto NaOH treated fabrics did enhance the reduction in the disparity
between cotton fabrics and PET fabric SK. For instance, with NaOH treatment
time of 10 minutes, the dissimilarity between SK and SC reduced by13.61% (with
fabric SK10). When the softener was added, the dissimilarity reduced by a further
6% (with SK10S). The dissimilarity between SC and SK also reduced with NaOH
treatment at 120°C for 20 minutes; reducing further upon softening. The trend of
changes in the Euclidean distance between SK and SG, and SX are not different
0.0
0.5
1.0
1.5
2.0
SK
SK30
SK25
SK10
SK20
SK15
S
SK20
S
SK10
S
SK15
SK
SK30
SK25
SK15
S
SK20
SK10
SK20
S
SK10
S
SK15
SK
SK30
SK25
SK15
S
SK20
S
SK10
SK20
SK10
S
SK15
SC SC SC SC SC SC SC SC SC SG SG SG SG SG SG SG SG SG SX SX SX SX SX SX SX SX SX
Eucl
idea
n d
ista
nce
Fabric pairs
Euclidean distance between PET fabric SK, treated SK fabrics and cotton fabrics

54
from trends with SC. Fabric SX has the closest proximity to SK treated fabrics,
compared to SC and blended fabric SG. The reduction in the proximity was also
highest with SX fabric, following funcionalization of SK fabric. As shown in
Figure 3.7, the functionalization of PET fabric SA did not reduce, but rather
increased the disparity with cotton fabrics.
Figure 3.7 Euclidean distance: between untreated PET fabric SA and cotton fabrics, and between SA-derived
fabrics and cotton fabrics. The dark bars represent the Euclidean distance between SA and cotton fabrics (SC
and SX) and the blended fabric (SG)
As earlier noted, SA-derived fabrics presented very low stiffness values,
compared to cotton fabrics. In contrast, SK-derived fabrics had stiffness values in
ranges close to those of cotton fabrics. This, in addition to structural, physical and
mechanical differences could explain these wide sensory differences. The section
on performance properties deeply explores these differences that might account
for different perceptions.
Regardless of the treatment parameters on SA, the Euclidean distance between the
resulting treated fabrics and cotton fabrics, increased consistently. This finding is
unique and exclusive to SA, suggesting differences in the interaction of the
substrate fabrics with the applied treatments. Especially, the structure and physical
properties of the substrate fabrics may have an impact. Figure 3.8 shows the
changes in the Euclidean distance between SE and cotton fabrics.
Figure 3.8 Euclidean distance: between untreated PET fabric SE and cotton fabrics, and between SE-derived
fabrics and cotton fabrics. The dark bars represent the Euclidean distance between SA and cotton fabrics (SC
and SX) and the blended fabric (SG).
The treatment of SE with NaOH at 100°C for 20 and 30 minutes reduced the
dissimilarity between SE and SC cotton fabric. A slight decrease in the Euclidean
0.0
0.2
0.4
0.6
0.8
1.0
1.2
1.4
1.6
1.8
SA SA20 SA20S SA10 SA10S SA SA20 SA20S SA10 SA10S SA SA20S SA20 SA10 SA10S
SC SC SC SC SC SG SG SG SG SG SX SX SX SX SX
Eucl
idea
n d
ista
nce
Fabric pairs
Euclidean distancebetween PET fabric SA, treated SA fabrics andcotton fabrics
0.0 0.2 0.4 0.6 0.8 1.0 1.2 1.4
SE SE20 SE30 SE SE20 SE30 SE SE20 SE30
SC SC SC SG SG SG SX SX SX
Eucl
idea
n d
ista
nce
Fabric pairs
Euclidean distance between PET fabric SE, treated fabrics and cotton fabrics

55
distance between SE and blended fabric SG was also achieved by NaOH
treatment of 20 and 30 minutes. However, the dissimilarity between SE and cotton
fabric SX slightly increased for all NaOH treatment times.
The dissimilarity between cotton fabrics and PET fabric SK was generally
consistently reduced by all NaOH and softening treatments, except for the NaOH
treatment lasting 25 and 30 minutes. Irrespective of the treatment parameters, PET
fabric SA got distant from all cotton fabrics, and the cotton/PET blended fabric.
The gap between cotton fabric SC and PET fabric SE reduced by about 18%, with
NaOH treatment for 20 and 30 minutes. The reduction in the Euclidean distance
between SE and SG was about 8% irrespective of the duration of the NaOH
treatment. It seems that, to achieve a systematic bridging between cotton and PET
fabrics, using NaOH treatment and softening, processes need to be optimized for
the different fabrics. Even at a macro scale, fabrics with different structures would
need to be processed differently.
3.3.5.4 Fabric sensory classes and profiles with AHC Considering the lowest within-class variance and the highest inter-class variance,
three classes from unsupervised AHC were realized (Table 3.11).
Table 3.11 AHC results by class
Class
Within-class
variance
Average distance
to centroid Fabrics
1 (6) 0.1899 0.3838 SA,SK,SE,SK10,SK10S,SK20
2(3) 0.1075 0.2634 SC,SG,SX
3 (11) 0.2101 0.4239
SK15,,SK15S,SK20S,SK25,SK30,SE20,SE30,SA10,SA10S,S
A20,SA20S
The fabrics were agglomeratively clustered by integrating the six sensory
attributes using the squared Euclidean distance between fabrics. Hence, fabrics in
the same class have close attributes. From Table 3.11, fabrics in class 2 have the
lowest variance within them. Apart from three fabrics (SK10, S10S and SK20), all
functionalized PET fabrics were classified together. Figure 3.9 shows the class
profiles and a dendrogram of the fabrics.
Figure 3.9 AHC profile plot (A) and dendrogram (B) of fabric sensory classes
Stiff Soft Heavy Crisp Natural Regular
0
0.2
0.4
0.6
0.8
1
1.2
Cla
ss c
entr
oid
s
Classes and sensory descriptors
A. Profile plot
1 2 3
Classes
1 3 2
SA20
SA
20S
SK30
SA
10
SA10
S SE
20
SE30
SK
25
SK15
S SK
20S
SK15
SX
SC
SG
SA
SK
SE
SK
10S
SK10
SK
20
0
0.2
0.4
0.6
0.8
1
1.2
1.4
1.6
1.8
2
Dis
sim
ilari
ty
B. Dendrogram
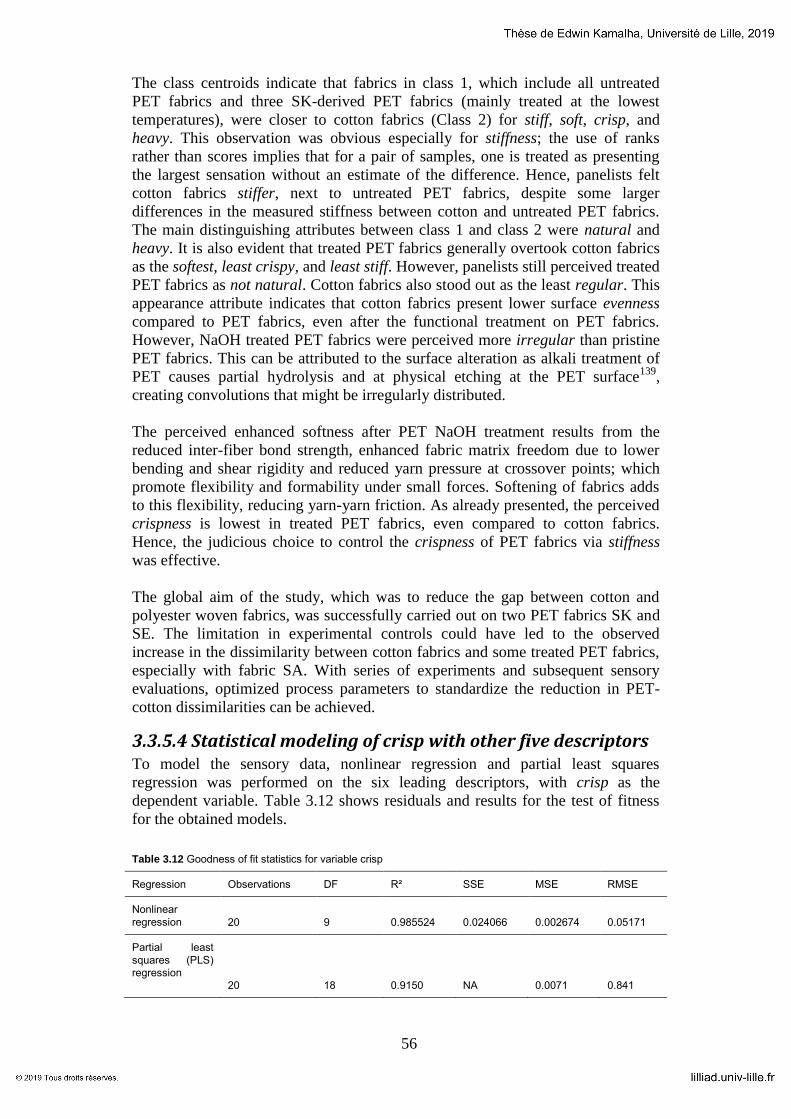
56
The class centroids indicate that fabrics in class 1, which include all untreated
PET fabrics and three SK-derived PET fabrics (mainly treated at the lowest
temperatures), were closer to cotton fabrics (Class 2) for stiff, soft, crisp, and
heavy. This observation was obvious especially for stiffness; the use of ranks
rather than scores implies that for a pair of samples, one is treated as presenting
the largest sensation without an estimate of the difference. Hence, panelists felt
cotton fabrics stiffer, next to untreated PET fabrics, despite some larger
differences in the measured stiffness between cotton and untreated PET fabrics.
The main distinguishing attributes between class 1 and class 2 were natural and
heavy. It is also evident that treated PET fabrics generally overtook cotton fabrics
as the softest, least crispy, and least stiff. However, panelists still perceived treated
PET fabrics as not natural. Cotton fabrics also stood out as the least regular. This
appearance attribute indicates that cotton fabrics present lower surface evenness
compared to PET fabrics, even after the functional treatment on PET fabrics.
However, NaOH treated PET fabrics were perceived more irregular than pristine
PET fabrics. This can be attributed to the surface alteration as alkali treatment of
PET causes partial hydrolysis and at physical etching at the PET surface139
,
creating convolutions that might be irregularly distributed.
The perceived enhanced softness after PET NaOH treatment results from the
reduced inter-fiber bond strength, enhanced fabric matrix freedom due to lower
bending and shear rigidity and reduced yarn pressure at crossover points; which
promote flexibility and formability under small forces. Softening of fabrics adds
to this flexibility, reducing yarn-yarn friction. As already presented, the perceived
crispness is lowest in treated PET fabrics, even compared to cotton fabrics.
Hence, the judicious choice to control the crispness of PET fabrics via stiffness
was effective.
The global aim of the study, which was to reduce the gap between cotton and
polyester woven fabrics, was successfully carried out on two PET fabrics SK and
SE. The limitation in experimental controls could have led to the observed
increase in the dissimilarity between cotton fabrics and some treated PET fabrics,
especially with fabric SA. With series of experiments and subsequent sensory
evaluations, optimized process parameters to standardize the reduction in PET-
cotton dissimilarities can be achieved.
3.3.5.4 Statistical modeling of crisp with other five descriptors To model the sensory data, nonlinear regression and partial least squares
regression was performed on the six leading descriptors, with crisp as the
dependent variable. Table 3.12 shows residuals and results for the test of fitness
for the obtained models.
Table 3.12 Goodness of fit statistics for variable crisp
Regression Observations DF R² SSE MSE RMSE
Nonlinear
regression 20 9 0.985524 0.024066 0.002674 0.05171
Partial least
squares (PLS)
regression
20 18 0.9150 NA 0.0071 0.841

57
The corresponding equations of the models are:
(Nonlinear
regression)
(PLS regression);
where, C is crisp, S is stiff, M is soft, H is heavy, N is natural, R is regular.
Considering the residuals for the two models, the R2 value suggests significant
quality and fitting to support the data.
3.3.6 Physical and performance properties of
functionalized PET fabrics
NaOH and softening treatment of PET fabrics as an attempt imitate cotton sensory
experiences involved several trade-offs which impact on performance and sewing
properties of PET fabrics. Fabric properties such as weight, thickness, strength,
dimensional stability and cohesiveness are bound to be affected. For instance, too
low values of stiffness, formability, and thickness would make it difficult to sew-
up garments. Also, pronounced loss in fabric weight would make the final product
costly as well as impact on product usability and durability. In this section, the
effect on selected performance properties of NaOH and softener treated PET
fabrics are reported. A comparison with cotton fabrics was also done for selected
properties.
3.3.6.1 Weight loss with NaOH treatment PET fabrics Following NaOH and softening treatments on SK, SA and SE, the weight and
accompanying weight loss of fabrics are presented in Table 3.13.
Table 3.13 Weight and weight loss (%) of functionalized PET fabrics from SK, SA and SE.
SK fabrics SA fabrics SE fabrics
Fabric
SK1
0
SK1
0S
SK1
5
SK15
S
SK2
0
SK20
S
SK2
5
SK3
0
SA1
0
SA10
S
SA2
0
SA20
S
SE2
0
SE3
0
Weight
(g/m2) 165 170 141 144 141 148 95 80 98 96 68 71 86 85
Temperatur
e 120
120 120 120 120 120 120 120
100 100 100 100 100 100
Weight loss
(%) 28 26 39 37 39 35 59 65 35 36 55 53 10 12
Time (mins) 10 10 15 15 20 20 25 30 10 10 20 20 20 30
NaOH concentration was fixed at 3%.
The weight loss increased with treatment time and varied with the fabric structure.
The microfiber fabric, which had the lowest basis weight (96 g/m2) and lowest
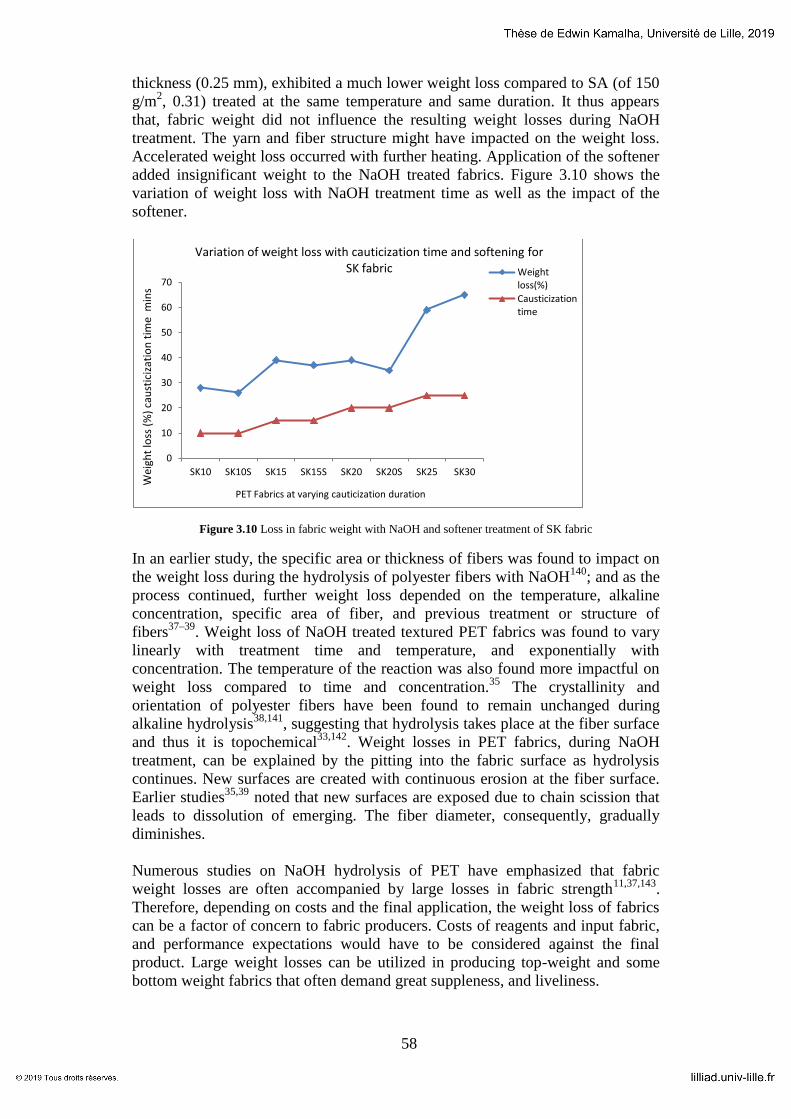
58
thickness (0.25 mm), exhibited a much lower weight loss compared to SA (of 150
g/m2, 0.31) treated at the same temperature and same duration. It thus appears
that, fabric weight did not influence the resulting weight losses during NaOH
treatment. The yarn and fiber structure might have impacted on the weight loss.
Accelerated weight loss occurred with further heating. Application of the softener
added insignificant weight to the NaOH treated fabrics. Figure 3.10 shows the
variation of weight loss with NaOH treatment time as well as the impact of the
softener.
Figure 3.10 Loss in fabric weight with NaOH and softener treatment of SK fabric
In an earlier study, the specific area or thickness of fibers was found to impact on
the weight loss during the hydrolysis of polyester fibers with NaOH140
; and as the
process continued, further weight loss depended on the temperature, alkaline
concentration, specific area of fiber, and previous treatment or structure of
fibers37–39
. Weight loss of NaOH treated textured PET fabrics was found to vary
linearly with treatment time and temperature, and exponentially with
concentration. The temperature of the reaction was also found more impactful on
weight loss compared to time and concentration.35
The crystallinity and
orientation of polyester fibers have been found to remain unchanged during
alkaline hydrolysis38,141
, suggesting that hydrolysis takes place at the fiber surface
and thus it is topochemical33,142
. Weight losses in PET fabrics, during NaOH
treatment, can be explained by the pitting into the fabric surface as hydrolysis
continues. New surfaces are created with continuous erosion at the fiber surface.
Earlier studies35,39
noted that new surfaces are exposed due to chain scission that
leads to dissolution of emerging. The fiber diameter, consequently, gradually
diminishes.
Numerous studies on NaOH hydrolysis of PET have emphasized that fabric
weight losses are often accompanied by large losses in fabric strength11,37,143
.
Therefore, depending on costs and the final application, the weight loss of fabrics
can be a factor of concern to fabric producers. Costs of reagents and input fabric,
and performance expectations would have to be considered against the final
product. Large weight losses can be utilized in producing top-weight and some
bottom weight fabrics that often demand great suppleness, and liveliness.
0
10
20
30
40
50
60
70
SK10 SK10S SK15 SK15S SK20 SK20S SK25 SK30
Wei
ght
loss
(%
) ca
ust
iciz
atio
n t
ime
min
s
PET Fabrics at varying cauticization duration
Variation of weight loss with cauticization time and softening for SK fabric Weight
loss(%)
Causticization time

59
3.3.6.1 Thickness and surface thickness The thickness of fabrics is useful during garment make up as it is important for
handling purposes as well as for particular applications. The surface thickness of
fabrics can give information about the roughness or smoothness of a fabric, and
garment sewability. According to the FAST system, fabrics with surface
smoothness below 0.2 mm are considered to be smooth. Also, the released surface
thickness can help in evaluating the quality of a finish, such as coating; by
assessing changes in the surface thickness when in-use testing is carried out.
Figure 3.11 presents the thickness and surface thickness of treated and untreated
PET fabrics, as well as cotton fabrics.
Figure 3.11 Thickness (mm) and surface thickness (mm) of treated and untreated PET fabrics and cotton
fabrics
The thickness of SK fabrics increased by between 19% and 33% with NaOH
treatment time and weight loss, up to 25 minutes, when it suddenly decreased by
11% at NaOH treatment time of 30 minutes. NaOH treatment of SE also led to an
increase in the fabric thickness by about 33% for both treatment times of 20
minutes and 30 minutes. However, the thickness of fabric SA decreased by an
average of 20% for all the NaOH treatment durations. The thickness of NaOH
treated PET fabrics slightly increased when the softener was added. The surface
thickness of PET fabrics generally increased with NaOH treatment time and
weight loss, thus. Generally, cotton fabrics had higher surface thickness compared
to PET fabrics— indicating that PET fabrics are relatively smoother than cotton
fabrics. However, the blended fabric SG had the highest surface thickness. This is
expected of fabric SG, being made of spun yarns that are often characterized by
short fibers and fuzzy appearance. NaOH treatment of PET fabrics increased the
surface thickness to almost that of the cotton fabrics.
The increase in thickness can be explained by the reduced compactness as the
fabric swells in the matrix and at the surface, increasing the yarn crimp.
Mousazadegan36
noted that the thickness, at low pressure, of micro fiber fabric
treated with NaOH increased with weight loss. The increased thickness is also
attributed to bulk resulting from swelling and crimping. Important to note are the
variations in the changes of thickness of the PET fabrics with respect to NaOH
treatment and weight loss for SA against SK and SE. The micro fiber fabric SE
presented increased thickness with NaOH treatment time and low weight loss;
also, the twill weave fabric SK recorded a positive linear increase in the thickness,
0
0.1
0.2
0.3
0.4
0.5
0.6
0.7
0.8
0.9
Thic
knes
s m
m, s
urf
ace
thic
knes
s m
m
Fabrics
Thickness and surface thickness of fabrics Thickness Surface thickness

60
which suddenly dropped after 25 minutes of NaOH treatment. However, SA
showed reduced thickness with NaOH treatment time and weight loss. The history
of handling/processing of the yarns, and the individual fabrics, such as partial of
full orientation of yarns, and other inherent properties might be responsible for the
isolated response by fabric SA. Figure 3.12 shows a comparison, for PET fabrics,
of the changes in surface thickness with thickness and NaOH treatment time, and
therefore, with weight loss.
Figure 3.12 Variation of surface thickness (mm) with respect to thickness (mm) of untreated and treated PET
fabrics
The drop in the thickness and surface thickness of SK at a certain time of
cauticization could result from irreversible degradation of the PET surface. The
large weight loss comes with heightened erosion of the PET surface such that
upon washing, the surface fibers fall off and leave a much smoother surface,
leading to low surface thickness as well. The application of the softener by, and
by padding, reduces the surface thickness of NaOH treated PET fabrics. The
micro-emulsion silicon softener is able to penetrate into the fabric and yarn
matrices, forming a smooth hydrophobic adhesion. During curing, the softener
cross-link entraps fibers within its matrix, thus improving the fabric smoothness
further. As shown in Figure 3.13, the surface roughness increased with surface
thickness, both representing the smoothness or roughness estimate of fabrics.
Figure 3.13 Variation of surface roughness with respect to surface thickness of fabrics
0
0.1
0.2
0.3
0.4
0.5
0.6
0.7
SK SK10 SK10S SK15 SK15S SK20 SK20S SK25 SK30 SA SA10 SA10S SA20 SA20S SE SE20 SE30
Thic
knes
s m
m, s
urf
ace
thic
knes
s m
m
Fabrics and treatment time
Surface thickness with thickness and caustic treatment time Surface thickness
Thickness
0
0.1
0.2
0.3
0.4
0.5
0.6
1 2 3 4 5 6
Surf
ace
thic
knes
s m
m, s
urf
ace
rou
ghn
ess
Surface roughness and surface thickness of fdabrics
Surface roughness
Surface thickness

61
3.3.6.2 Abrasion resistance The abrasion resistance values of PET fabrics after NaOH and softening
treatments are shown in Table 3.14. The method records the number of cycles
taken to wear a fabric sample by a rotating abrading cloth, denoted in Martindale.
The test equipment works in intervals of 5000 cycles totaling the wear number of
abrasion cycles that lead to the cloth being worn to a specific degree.
Table 3.14 Abrasion resistance of selected treated and untreated PET fabrics
SA fabrics SK fabrics SE fabrics
Fabric SA SA10 SA20 SA20S SK SK20 SK20S SK30 SE SE20 SE30
Abrasion resist
(Martindale) 23333 1000 1000 1000 50000 46667 25000 4333 21667 20000 20000
CV(%) 12.4 0 0 0 0 12.4 0 26.7 13.3 0 0
Loss (%) NA 96 96 96 NA 6.7 50 91 NA 7.7 7.7
Following NaOH treatment of SA for 10 and 20 minutes- with a weight loss of
35% and 55% respectively, the abrasion resistance diminished significantly, for
both treatment times. According to results in Table 15, addition of the softener to
SA20 did not yield quantitative improvement in the abrasion resistance. However,
a visual analysis and weighing of specimens after the abrasion resistance test
indicated that SA20S performed better than SA20, but lower than SA10. Hence,
the addition of the softener did improve the abrasion resistance of NaOH treated
fabrics. It should also be noted that a slight pill of the softener could easily be
interpreted as a breakage by the automated equipment; making the interpretation
unreliable. At a weight loss of 35%, the abrasion resistance of SK remained close
to the original value; considering fabric SK20. Figure 3.14 presents a plot of the
abrasion resistance for treated and untreated PET fabrics.
Figure 3.14 Abrasion resistance (Nartindale) of untreated and treated PET fabrics
The lowest abrasion resistance for SK was exhibited at the largest weight loss
(65%). Fabric SE exhibited the highest resistance to abrasion, after NaOH
treatment, losing about 8% of the original value. It is evident that the abrasion
resistance of PET fabrics reduced with weight loss due to NaOH treatment. As
hydrolysis of the PET surface takes place, the diameter is also affected, with
surface pitting at several points. Hence, the fiber surface is easily eroded, and
more susceptible to abrasion with further NaOH treatment. Musale and Shukla11
0
10000
20000
30000
40000
50000
60000
SA SA10 SA20 SA20S SK SK20 SK20S SK30 SE SE20 SE30
Ab
rasi
on
res
ista
nce
(M
arti
nd
ale)
Fabrics and treatment time
Abrasion resistance of fabrics

62
recently found similar results about abrasion resistance and weight loss of NaOH
treated PET fabrics; However, Dave’s group35
found that the flex abrasion life of
fabrics peaked at 8-9% of weight loss after which it sharply decreased as weight
loss increased. They argued that at lower levels of weight loss, alkaline hydrolysis
erodes the PET filaments’ surface with less pitting, exposing a relatively more
plastic inner layer, and thereby increases abrasion resistance. At higher weight
losses, increased pits at the fiber surface enhance flaws and cracking144
, hence
increased abrasion effect. The abrasion resistance was found to vary linearly with
weight loss and that fabric thickness was the main determinant in such behavior36
.
3.3.6.3 Bursting strength and strain/elongation at break The bursting strength was used to estimate the changes in strength of PET fabrics
with NaOH and softening treatments. Table 3.15 shows the bursting strength and
strain values of selected PET fabrics after NaOH and softening treatments. The
strain is a measure of the elongation at the point of break for the fabrics.
Table 3.15 Bursting strength and strain of selected untreated and treated PET fabrics
SK fabrics SA fabrics SE fabrics
Fabric SK SK20 SK20S SK30 SA SA10 SA20 SA20S SE SE20 SE30
Bursting strength N 1386 800 723 291 306 124 62 58 554 256 223
CV (%) 2.8 5.0 13.1 26.5 13.6 13.5 20.2 16.7 12.6 18.5 16.6
Loss (%) NA 42 48 80 NA 59 80 81 NA 54 54
Strain (%) 11 7.5 7.9 5.8 7.3 6.8 4.9 3.1 8.4 7.4 7.9
The strength of SK PET fabric decreased by about 57%, and 80% respectively at
treatment time of 20 S and 30 S. The strength of SA fabric lowered by 59% and
81% after 10 minutes and 20 minutes respectively, of NaOH treatment. While, the
strength of SE degraded by 54% and 81% after NaOH treatment time of 20
minutes and 30 minutes respectively. The rate of strength loss for all PET samples
was more pronounced during the initial NaOH treatment times. With softening
treatment, the strength of SK20 and SA20 reduced by 10% and 6.5% respectively.
The origin and mechanism of fabric strength degradation due to NaOH treatment
is most probably due to hydrolytic scission of ester linkages of the PET chains on
the fiber and the spreading of concentrated tensile stress at several flaws/pits on
the fiber surface. This, with reducing fiber denier, leads to rupture at much lower
total force. Core cavitations may also emerge in fibers— suggesting weakening in
the fiber interior. And, in woven PET fabric assembly, sequential tensile ruptures
contribute to overall lower fabric strength. The relative fabric strength loss due to
NaOH treatment of PET fabrics ranged from magnitudes of 0.9-2.3 times the
relative weight loss. A study on alkaline hydrolysis of PET35
found a linear
dependence of strength loss with weight loss and that weight loss and strength
loss were very strongly (r= 0.989); weight loss increased faster than weight loss.
3.3.6.4 Fabric extensibility The changes in the extensibility of PET fabrics after NaOH treatment and
softening are shown in Figure 3.15.

63
Figure 3.15 Extensibility values for untreated and treated PET fabrics
Fabric extensibility increased with NaOH treatment, more pronounced in the weft
direction. This means that PET fabrics became more elastic. The introduction of
the softener on already NaOH treated PET generally reduced the extensibility,
except for a meager increase, on SK NaOH treated for 15 minutes (SK15S).
Fabric extensibility and bending rigidity do affect the formability of fabrics.
Particularly, extensibility above 5% has been noted to affect the laying-up,
requiring extra work, such as use of pins during sewing. Extensibility also has
impact on fabric cutting, sewing and appearance. During laying-up, highly
extensible fabric can lead to distorted, stretched or compressed fabric affecting the
final cutting. Poor pattern matching has been noted during the sewing of long
seams with patterned highly extensible fabric; a hindrance that requires time and
costly special approaches. Extensibility below 2% is associated with overfeed
moulding during sewing. Moreover, variations in fabric extensibility also affect
the consistency of fabric overfeed for seams in automatic overfeed machines.
Although designing seams off the weft and warp directions has been found an
effective solution77,125
.
3.3.6.5 Air permeability Results in Figure 3.16 show that air permeability of PET fabrics increased with
NaOH treatment; surpassing cotton fabric values. Air permeability increased with
NaOH treatment time.
Figure 3.16 Air permeability of PET and cotton fabrics
Since air passes through fabric, the volume of fibers in the fabric matrix is
important. When PET fabrics are treated with sodium hydroxide, the
fiber/filaments diameter, volume and specific surface reduce36
yielding a more
revealing fabric structure. Inter fiber and inter yarn spaces in the fabric increase;
hence, increasing porosity gradually. The air permeability of the fabric
0
5
10
15
20
25 Eweft100 Ewarp100
0
20
40
60
80
100
120
140
160
SK
SK1
0
SK1
0S
SK1
5
SK1
5S
SK2
0
SK2
0S
SK2
5
SK3
0
SA
SA1
0
SA1
0S
SA2
0
SA2
0S SE
SE2
0
SE3
0
SC
SX
SG
Air
per
mea
bili
ty
(cm
3 /s/
cm2)
Fabrics
Air permeability

64
consequently increases. However, fabrics may also become too open/loose for
other performance properties if the openness is severe.
The softener slightly decreased the air permeability of NaOH treated fabrics as
shown by SK10S, SK15S, SK20S, SA10S and SA20S. This decrease may result
from softener particles binding onto fiber surfaces and partially blocking some
fiber pores within fibers and the fabric matrix. Umut and Sena4343
found that
softeners negatively affected the air permeability of PET knitted fabrics. This was
similar to a very recent finding by Badr145
who studied the effect of several silicon
softeners on air permeability of several fabrics. The study also noted that the air
permeability reduced with the concentration of the softener, and that micro
emulsion softeners had a higher impact compared to macro emulsion softeners.
On the other hand, Parthiban and Kumar146
found less effect on the air
permeability of polyester fabrics compared to cotton fabrics when studied after
repeated launderings. The exhaustion rate and applied process may contribute to
nature of results, with softening treatment.
3.3.6.6 Moisture management properties Table 3.16 presents moisture management profiles of all PET and cotton fabrics.
Table 3.16 Moisture management/wetting and wicking properties of PET and cotton fabrics
Fabric
TWT
(sec) BWT (sec)
TAR
(%/sec)
BAR
(%/sec)
TMWR
(mm)
BMWR
(mm)
TSS
(mm/s)
BSS
(mm/sec)
AOWTI
(%)
SK 3.2 120 40.9 0.0 5.0 0.0 1.5 0.0 -840.9
SK10 2.1 1.8 39.6 56.6 25.0 25.8 8.0 7.7 312.7
SK10S 3.5 120 41.6 0.0 5.0 0.0 1.4 0.0 -808.6
SK15 1.7 1.9 43.9 59.4 24.2 25.8 7.6 7.2 252.7
SK15S 3.4 120 46.4 0.0 5.0 0.0 1.4 0.0 -777.9
SK20 1.8 1.9 31.1 41.0 25.0 25.0 7.7 7.8 177.1
SK20S 3.9 120 42.1 0.0 5.0 0.0 1.3 0.0 -784.2
SK25 2.2 2.3 56.5 68.9 23.0 24.0 5.9 5.1 132.6
SK30 1.7 1.7 57.9 67.5 28.8 28.8 7.2 6.6 100.3
SA 2.9 6.5 38.0 9.8 10.0 10.0 2.2 1.7 -415.7
SA10 2.3 2.5 17.4 48.2 30.0 30.0 4.9 4.8 382.6
SA10S 3.7 10.6 71.5 60.6 8.8 7.5 1.4 0.6 454.6
SA20 2.0 2.2 22.3 41.9 30.0 30.0 6.7 6.5 273.4
SA20S 3.6 7.3 78.9 53.3 10.0 10.0 1.7 1.6 324.0
SE 3.2 9.2 45.4 24.3 21.3 23.8 3.4 3.6 -156.8
SE20 2.2 2.0 53.2 81.8 26.7 26.7 7.0 6.7 168.8
SE30 2.2 2.2 49.6 87.0 28.3 29.2 7.6 6.9 185.7
SC 1.9 1.7 59.2 71.7 30.0 25.0 7.3 7.1 191.4
SX 1.7 1.5 60.5 71.7 25.0 25.8 7.5 7.3 191.8
SG 4.7 5.0 49.1 63.5 18.0 18.0 3.6 3.3 174.4
TWT- Top wetting time, BWT- Bottom wetting time, TAR- Top absorption rate, BAR- Bottom absorption rate, TMWR- Top maximum wetted radius, BMWR- Bottom maximum wetted radius, TSS- Top spreading speed, BSS-
Bottom spreading speed, AOWTI- Accumulative one way transport index.

65
After NaOH hydrolysis, the top and bottom wetting time of all PET fabrics
reduced by at least 40%, for all treatment temperatures and time. However, the
addition of the softener imparted moisture proofing on SK NaOH treated fabrics
such that there was no bottom wetting, for the total test period (120 S). On the
other hand, the bottom wetted radius for SA NaOH treated fabrics reduced by
over 60% upon addition of the softener, reducing their moisture spreading ability.
This indicates that the silicon softener had a hydrophobic or repelling function.
Hence, it is preferable to apply such hydrophobic softener after dyeing in case of
goods to be colored. Untreated fabrics; SA, SK and SE were graded as: fast
absorbing slow drying, water proof, and fast absorbing quick drying respectively,
according to the MMT indices. Overall, NaOH treated fabrics, without the
softener, were graded as, moisture management, moisture penetration or fast
absorbing quick drying fabrics. The accumulative one way transport index for
NaOH-treated PET fabrics, without a softener, was comparable to or even higher
(better) than cotton fabrics SC and SX, and the blended fabric SG. Therefore,
NaOH treatment generally enhanced the wetting and moisture management
capability of PET fabrics. Similar to our finding, Parthiban and Kumar146
also
found that wicking properties of PET were negatively affected by silicon softener
treatments. A similar study by Chinta and Pooja147,148
found that the hydrophilic
ability of cotton and polyester fabrics decreased as the concentration of silicon
softener treatments. Hence, an alternative of using hydrophilic silicon softeners
would be preferable.
Some garments such as swim and bathing suits become completely wet while
being worn. Also, some localized areas of garments (such as arm pit and groin
regions) accumulate high moisture concentrations, compared to other garment
parts. Thus, fast wicking and quick drying would be important to keep the wearer
comfortable.
The hydrophilicity of sodium-hydroxide-treated polyester fabric has been argued
on: (a) enhanced surface roughness, increase in the number of hydrophilic groups
on the fiber surface due to chain scission, and increased accessibility of
hydrophilic groups on the fiber surfaces due to hydrolysis142
. Carboxyl and
hydroxyls are the eminent hydrophilic groups found in polyester. The ability of
polyester fabrics to transmit moisture through in-plane wicking is also improved
as carboxyl and hydroxyl groups increase at the surface. Consequently, PET
fabrics also attain faster drying ability when treated with NaOH. The imparted
hydrophilicility to PET, through NaOH reduction can be attributed to a function
of the chemical change in the surface of the fiber. The improved polyester fabric
moisture transport and holding properties can also be attributed to the increased
porosity of the hydrolysed fabric149
.
In several studies, it has been reported that the moisture-related properties of
NaOH treated polyester textiles indicated by water vapor transport, vertical
wicking height, water retention liquid water transport, drop absorbency, and
contact angle30,150–154
, exhibit significant improvements. However, it has been
reported in various research articles30,35
that the moisture regain of NaOH-treated
polyester fabric remains close to that of untreated fabric. Narita and Okuda149
reported contradicting results; that the moisture regain at 100% relative humidity
increased from 0.4% to 1.8%. This was attributed to an increase in carboxyl end-
groups of the NaOH-treated polyester from 25.4 to 67xl06 mol/g. Shenai and

66
Nayak155–157
noted an increase in the moisture regain of polyester fabrics with
increasing concentration of alkali, in the presence of quaternary ammonium
compounds.
Earlier investigations reported that NaOH-treated polyester fabrics exhibited an
increased dyeability which attributed to increased surface area after NaOH
treatment158. Dave’s research team
35 noted that at lower weight loss (1-2%), the
dye uptake of NaOH-treated polyester fabrics reduced; the dye uptake increased
to match the untreated fabric at 6-10% weight loss, and thereafter, the dye uptake
steadily increased. The low dye uptake at lower levels of weight loss was
attributed to the removal of some oligomer during the onset of hydrolysis. At
higher percentage of weight loss, the fiber surface is etched and pitted further,
creating more boundary areas between the dye solution and fibers. A related study
on dyeability of NaOH-treated polyester posted conflicting results, noting that the
coefficient of diffusion of dye, decreased as weight loss increased159
.
3.4 Conclusions
This study focused on two main areas: (1) the use of sensory analysis to
determining the reduced gap between cotton and polyester fabrics following the
reduction of the stiffness of polyester fabrics by NaOH and softening treatments;
(2) examining the effect of NaOH and softening treatment on PET fabrics.
The attempted functional treatments yielded changes in stiffness properties of
fabrics; particularly, the bending length and flexural rigidity. These modifications
to PET fabrics were reflected in both objective measurements and subjective
sensory evaluations. By the descriptor natural, panelists were still able to decipher
cotton fabrics from PET fabrics regardless of the functionalization. However, by
classification and clustering, some functionalized PET fabrics closely related with
cotton fabrics, unlike untreated PET fabrics. The gap between cotton and some
PET fabrics was effectively reduced, through the combined function of NaOH and
softening treatments. However, for reproducibility, series of trials and careful
management of NaOH hydrolysis would be needed.
At different levels of weight loss with NaOH hydrolysis, several properties of
polyester are significantly modified. The weight loss has bearing on most
performance and surface properties of NaOH hydrolyzed fabrics. While thermal
comfort properties (air permeability, wicking and absorption) may improve,
reduced strength and abrasion properties might be a concern. The observed
increase in thickness of some NaOH treated PET fabrics implies more volume and
bulk of fabrics; hence a lofty hand. The silicon softener enhanced the soft and
smooth perception of NaOH-treated polyester fabrics, depicted in the raw ranks.
The softener also added hydrophobicity to NaOH-treated PET fabrics.
Although some observed effects of NaOH treatment may be undesirable, the
modified fabrics may serve in some clothing such as ladies’ tops and night wear
where the performance would be acceptable. NaOH hydrolysis and softening
treatments are not new phenomenon. The main contribution of this study is the
application of these methods to the sensory evaluation and bridging between
polyester fabrics and cotton fabrics. Quantification of human perception can thus
be utilized in industrial design of fabrics with sensory function.

67
Chapter 4
Sensory analysis of cotton and
polyester knitted fabrics
4.1 Overview
In this chapter, the sensory analysis of knitted fabrics was undertaken, with an aim
of comparing results to woven fabrics’ sensory patterns. The study focuses on the
fabric macro-scale, including a brief look at the impact of the basic physical
parameters and structural properties on sensory perception. Ranks of fabrics
against sensory attributes were analyzed and relationships between various fabrics
and perceived attributes were drawn. Correlations, PCA and AHC were the main
tools used in this study. It is deduced that sensory perception of knitted fabrics is
divergent from that of woven fabrics. However, mechanical related perceptual
attributes are significant in both knitted and woven fabrics.
4.2 Materials and methods
4.2.1 Materials
4.2.1.2 Test fabrics and experimental conditions Five knitted fabrics (three 100% cotton, two 100% PET) of 20x30 sqcm, as shown
in (Figure 4.1) and of basic parameters as shown in Table 4.1 were labeled and
then conditioned in standard atmosphere (according to ISO 139:2005 Textiles—
Standard atmospheres for conditioning and testing)106
for 48 hours at 20°C (±2
°C)
and 65% RH (±4%). The sample fabrics were either bleached or grey (untreated),
without coloring or patterning.

68
Figure 4.1 Pictorial of the five knitted fabrics used in the study
Table 4.1 Basic structure and characteristics of five knitted fabrics used in the study
Fabric Structure Wales/
in
Courses/
in Stitch density(in
-²)
Thickness
(mm)
Weight
(g/m2)
Fiber Finish
SB Single Jersey 33 52.2 1723 0.58 1.56 Cotton None
SI Interlock 31.4 29.2 917 1.18 2.55 Cotton None
SF Single Jersey 38.2 46.6 1780 0.43 1.63 Cotton Bleach
SZ Interlock 30 33 990 1.13 2.38 PET Bleach
SH Interlock 31.6 35 1106 0.74 2.19 PET Bleach
4.2.2 Methods
4.2.2.1 Sensory panel, descriptors and sensory evaluation The sensory panel, sensory descriptors and sensory evaluation were composed of
details described in Chapter 2 (section 2.2.2.1). The 12 judges ranked the five
knitted fabrics for the 11 sensory descriptors (Stiff, Soft, Smooth, Heavy, Noisy,
Crisp, Stretchy, Drapy, Regular, Natural, and Compact), in ascending order
according to magnitudes of perceived sensations. Ranking of fabrics was done
using consensually discussed protocols already explained in 2.2.2.1 and the
Appendix.
4.2.2.2 Rank aggregation and rank weighting The unweighted cross-entropy Monte Carlo (CE) algorithm with Kendall’s tau
(CEKnoweight)109–111
already presented in Chapter 2 (section 2.2.2.2) was used to
aggregate the 12 rank lists, for each descriptor. The program below was used in
separate runs for each descriptor:
CEKnoweights <- RankAggreg(table_matrix, 5, method="CE",
distance="Kendall", N=250, convIn=30, rho=.1). The Borda-Kendall (BK)
method108
was then used to convert ranks into weights.

69
4.3.3 Significant attributes, dissimilarity, and profiles Using the percent agreement with PCA and correlation analysis, the number of
sensory descriptors was reduced to a significant five. The most distinguishing
attribute between cotton and PET knitted fabrics was identified using the squared
cosines of variables and factor analysis. At the same time, further relationships
and profiles were realized using AHC and PCA. The Euclidean distance between
different pairs of knitted fabrics was then computed to estimate the dissimilarity.
4.3 Results and discussion
4.3.1 Ranks and rank aggregation
Table 4.2 shows, in descending order of magnitudes of sensations, the optimal
rank lists from the CEKnoweights algorithm, for the 11 descriptors.
Table 4.2 Aggregated rank lists of the five knitted fabrics
Rank Stiff Soft Smooth Heavy Noisy Crisp Stretchy Drapy Regular Natural Compact
1 SI SH SH SI SI SI SI SF SF SI SI
2 SB SF SF SZ SB SB SZ SH SZ SB SZ
3 SZ SZ SZ SH SF SZ SH SZ SH SF SH
4 SH SB SB SB SZ SF SB SB SB SH SB
5 SF SI SI SF SH SH SF SI SI SZ SF
For subjective assessment, interlock fabrics presented the largest perception for
heavy, stretchy, and compact. Interlock fabrics also ranked high for stiff and crisp,
and low for soft. On the other hand, single jersey fabrics were perceived strongly
for soft, smooth, drapy and regular. The influence of fiber content can be argued
by the ranks of fabrics in several permutations where either cotton or PET fabrics
are closely ordered. For instance, cotton fabrics led in stiff, noisy, crisp and
natural, while trailing in smooth, soft, regular and compact. For further
computations, the fabric ranks transformed in weights by the BK technique are
presented in Table 4.3.
Table 4.3 Normalized weights of ranks of five knitted fabrics
Fabric Stiff Soft Smooth Heavy Noisy Crisp Stretchy Drapy Regular Natural Compact
SI 1 0.2 0.2 1 1 1 1 0.2 0.2 1 1
SZ 0.6 0.6 0.6 0.8 0.4 0.6 0.8 0.6 0.8 0.2 0.8
SF 0.2 0.8 0.8 0.2 0.6 0.4 0.2 1 1 0.6 0.2
SB 0.8 0.4 0.4 0.4 0.8 0.8 0.4 0.4 0.4 0.8 0.4
SH 0.4 1 1 0.6 0.2 0.2 0.6 0.8 0.6 0.4 0.6

70
4.3.2 Relationship between knitted fabric parameters and
subjective evaluation
Table 4.4, presents Spearman’s correlation coefficients between descriptors of
sensory perception and parameters of the knitted fabrics.
Table 4.4 Correlation coefficients between perceived attributes and knitted fabric parameters
Variables Stiff Soft Smooth Heavy Noisy Crisp Stretchy Drapy Regular Natural Compact
Wales/in -0.5 0.3 0.3 -0.9 0.1 -0.3 -0.9 0.5 0.3 0.3 -0.9
Courses/in -0.4 0.3 0.3 -0.9 -0.1 -0.3 -0.9 0.4 0.3 0.0 -0.9
Stitch density -0.7 0.5 0.5 -1.0 -0.2 -0.5 -1.0 0.7 0.6 -0.1 -1.0
Thickness 0.7 -0.5 -0.5 1.0 0.2 0.5 1.0 -0.7 -0.6 0.1 1.0
Weight 0.4 -0.3 -0.3 0.9 0.1 0.3 0.9 -0.4 -0.3 0.0 0.9
Descriptors heavy, stretchy, and compact were very strongly associated with all
the five knitted fabric parameters in Table 4.4. Noisy and natural were hardly
associated with any fabric parameters. Hand and visual descriptors- soft, smooth,
crisp, drapy were mainly associated with stitch density and thickness. The wales
per inch were averagely correlated with stiff and drapy. It appears that compared
to the fiber content, the structure of knitted fabrics has more influence on sensory
perception of knitted fabrics.
4.3.3 Significant sensory descriptors
To reduce the number of sensory descriptors to a few most significant, the percent
agreement and correlation analysis were used. The F1 variability (percent
agreement) extracted from PCA performed on fabrics/assessors for each
descriptor is shown in Table 4.5
Table 4.5 Percent agreement of sensory descriptors
Descriptor Stiff Soft Smooth Heavy Noisy Crisp Stretchy Drapy Regular Natural Compact
%agreement 65 74 82 68 78 69 63 70 56 68 68
A summary of Pearson correlation coefficients between sensory attributes is also
shown in Table 4.6.

71
Table 4.6 Proximity matrix (Pearson correlation coefficient) of descriptors
Stiff Soft Smooth Heavy Noisy Crisp Stretchy Drapy Regular Natural Compact
Stiff 1.0 -0.9 -0.9 0.7 0.7 0.9 0.7 -1.0 -0.9 0.6 0.7
Soft -0.9 1.0 1.0 -0.5 -0.9 -1.0 -0.5 0.9 0.7 -0.7 -0.5
Smooth -0.9 1.0 1.0 -0.5 -0.9 -1.0 -0.5 0.9 0.7 -0.7 -0.5
Heavy 0.7 -0.5 -0.5 1.0 0.2 0.5 1.0 -0.7 -0.6 0.1 1.0
Noisy 0.7 -0.9 -0.9 0.2 1.0 0.9 0.2 -0.7 -0.6 0.9 0.2
Crisp 0.9 -1.0 -1.0 0.5 0.9 1.0 0.5 -0.9 -0.7 0.7 0.5
Stretchy 0.7 -0.5 -0.5 1.0 0.2 0.5 1.0 -0.7 -0.6 0.1 1.0
Drapy -1.0 0.9 0.9 -0.7 -0.7 -0.9 -0.7 1.0 0.9 -0.6 -0.7
Regular -0.9 0.7 0.7 -0.6 -0.6 -0.7 -0.6 0.9 1.0 -0.7 -0.6
Natural 0.6 -0.7 -0.7 0.1 0.9 0.7 0.1 -0.6 -0.7 1.0 0.1
Compact 0.7 -0.5 -0.5 1.0 0.2 0.5 1.0 -0.7 -0.6 0.1 1.0
By concurrently considering the percent agreement, the correlation coefficients
between pairs of descriptors, and the objective measurability of the sensory
attributes, five descriptors were retained for further computations. When two
descriptors were strongly positively correlated, the descriptor with the largest
variability would be retained. However, the possibility that such a descriptor
could be measured or expressed objectively was also considered. The descriptors-
Stiff, smooth, heavy, drapy, and natural were subsequently retained.
To identify the most distinguishing perceived sensory attribute, the Eigen
decomposition of PCA for the five attributes was analyzed. The factor loadings
and squared cosines of descriptors were then computed (Table 4.7).
Table 4.7 Squared cosines and factor loadings of the significant descriptors
Descriptor
Squared cosines Factor loadings
F1 F2 F1 F2
Stiff 0.9685 0.0062 0.9841 0.1328
Smooth 0.8805 0.0292 -0.9384 0.2145
Heavy 0.4784 0.4514 0.6917 -0.0863
Drapy 0.9685 0.0062 -0.9841 -0.1328
Natural 0.4740 0.4443 0.6885 -0.0007
Values in bold correspond for each descriptor to the factor for which the factor loading and squared cosine is the largest
Descriptors stiff and drapy accounted for the largest variability of PCA. This
finding is similar to an earlier one in woven fabrics in which hand properties were
more significant. Hence, towards replacement with polyester, a precise profile
would be needed to determine the direction of modification of the drape or
stiffness of PET knitted fabrics.

72
4.3.4 Clustering and dissimilarity of knitted fabrics
The biplot in Figure 4.2 shows the clustering of the knitted fabrics with sensory
attributes on principal factors F1 and F2.
Figure 4.2 Biplot of five knitted fabrics and five sensory descriptors
With F1 and F2 accounting for 94% of variability, two factors were sufficient to
represent the knitted fabrics’ data. Except SZ, all the other fabrics contributed
largely on F1. Cotton fabrics SB and SI are grouped together and share common
attributes— natural and stiff. While, cotton fabric SF is grouped closer with PET
fabric SH for drapy and smooth perceptions. SB is a single jersey while SI is an
interlock structure. SF is a single jersey while SH is an interlock fabric. This
implies that the structure had no obvious influence on the sensory clustering of the
knitted fabrics. The fiber content and other physical parameters, especially
thickness and weight were significant. A factor for clustering cotton fabric SF
with PET fabric SH could arise from the added finishing (bleaching) that adds
luster and further softness to fabrics, which could enhance the perception of drape
and smoothness. It is also possible for a bias by assessors due to the difference in
appearance between cotton fabrics SI and SB and the rest of the fabrics.
The Euclidean distance (Table 4.8) shows the dissimilarity between different pairs
of fabrics, by subjective sensory evaluation.
Table 4.8 Proximity matrix (Squared Euclidean distance)
Fabric1 SI SI SI SF SZ SB SZ SI SZ SF
Fabric2 SF SH SZ SB SF SH SB SB SH SH
Dissimilarity 1.56 1.37 1.08 0.98 0.94 0.94 0.80 0.72 0.57 0.57
SB, SI, SF- 100% Cotton, SH,SZ- 100% PET
The largest dissimilarity between cotton and PET knitted fabrics exists between SI
and SH. The dissimilarity between different fabrics can be reduced by profiling
fabrics with sensory attributes in order to determine the direction of modification.
AHC profiles of the five fabrics are presented in Figure 4.3.
SI
SZ
SF SB
SH Stif Smooth
Heavy
Drapy
Natural -4
-3
-2
-1
0
1
2
3
4
5
-6 -5 -4 -3 -2 -1 0 1 2 3 4 5 6
F2 (1
8.7
5 %
)
F1 (75.40 %)
Biplot (axes F1 and F2: 94.14 %)

73
Figure 4.3 Sensory profiles (A) and a dendrogram (B) from subjective evaluation of the five knitted fabrics
Unlike cotton woven fabrics, cotton knitted fabrics were ranked and profiled
highest for stiff, and lowest for drapy and smooth. Also, PET knitted fabrics
ranked highest for drapy and smooth, and lowest for stiff unlike with PET woven
fabrics. Hence, approaches towards the replacement of cotton with polyester
would be different when considering woven fabrics and knitted fabrics. For
instance, while the reduction of the stiffness of PET woven fabrics was suggested,
an increase in the stiffness would be the approach for PET knitted fabrics. It can
be deduced that the sensory perception of woven fabrics is different from the
sensory perception of knitted fabrics. Via vision and touch, PET knitted fabrics
can be distinguished from cotton knitted fabrics.
4.4 Conclusions
A sensory study of knitted fabrics was undertaken. In addition to the fiber
content, the knitted fabric structure and physical properties are argued to influence
the sensory perception of knitted fabrics. Perceived sensory attributes of knitted
fabrics were found to mostly correlate with the stitch density and thickness.
Similar to woven fabrics, the visual and hand attributes were found dominant and
significant in differentiating between polyester and cotton knitted fabrics. The
sensory perception of knitted fabrics was noted to be distinct from that of woven
fabrics. Towards the replacement of cotton fiber with polyester, the modification
(increase) in the stiffness or drape of PET knitted fabrics has been suggested.
Stif Smooth Heavy Drapy Natural
0
0.2
0.4
0.6
0.8
1
1.2
Cla
ss c
entr
oid
s
A. Profile plot
1 2 3
1 2 3
SI
SB
SZ
SF
SH 0
0.2
0.4
0.6
0.8
1
1.2
1.4
Dis
sim
ilari
ty
B. Dendrogram

74
Chapter 5
Subjective Vs objective valuation of
cotton and polyester woven fabrics
5.1 Overview
Previous studies have largely focused on the effect of fabric construction,
finishing and mechanical properties on the perception of selected sensory
properties. Less emphasis has been directed towards the influence of fiber content
on sensory properties of fabrics. This study focuses on the relationship between
subjectively evaluated sensory attributes and objectively measured parameters that
relate to sensory behavior of PET and cotton woven fabrics. Correlation analysis
and classification to compare subjective and objective evaluation was performed.
This study utilized sensory evaluation descriptors, fabric samples, protocols and
some data already presented in Chapter 2. Through correlation analysis, only a
few sensory attributes were found to be precisely expressed by instrumental
measurements. Particularly, hand attributes were more expressed by fabric
mechanical and surface attributes. It is deduced that human perception cannot be
directly represented by instrumental measurements. The profiling of fabrics
indicates that conventional PET fabrics can be distinguished from conventional
cotton fabrics using selected subjective and objective attributes.
5.2 Materials and Methods
5.2.1 Materials
5.2.1.1 Woven fabric samples The six woven fabric samples used in this analysis, and their specifications have
been presented in Chapter 2 ( section 2.2.1.1; Table 2.1 and Figure 2.1); cotton

75
fabrics- SC and SX; PET fabrics- SA, SK and SE; and cotton/polyester blended
fabric SG
5.2.2 Methods
5.2.2.1 Sensory panel and sensory data The sensory panel described in Chapter 2 (section 2.2.2.1) and the ensuing
aggregated rank lists as presented in section 2.3.2, were used in this chapter. Table
2.3 in Chapter 2 was referred to for this analysis.
5.2.2.2 Objective measurements related to sensory perception
5.2.2.2.1 Bending length and flexural rigidity
The bending length of fabrics was determined using the Cantilever bending
principle described in British Standard- BS3356127
and ASTM D1388-14e1128
;
methods for determining the bending length and flexural/bending rigidity of
fabrics. A KFG-2000 Cantilever device (JA King, Charlotte, NC) was used to
measure the bending length in the warp and weft directions. The rigidity was
computed from the formula in Eq 5.1, for both the warp and weft directions:
where G is the flexural rigidity (µNcm), M is the fabric mass per unit area (g/m
2),
and C is the bending length (mm).
5.2.2.2.2 Elongation/ extensibility
The fabric elongation was measured as extensibility, both in the warp and weft
directions, using the method and device already described in Chapter 3; (section
3.3.11.5).
5.2.2.2.3 Drape coefficient
Drape is used to describe how a fabric or garment hangs and shapes gracefully
under its own weight. Fabric drape is a pertinent fabric feature, that affects
clothing appearance and comfort attributes such as handle. The drape coefficient
is used to express the drape of fabrics. The standard method BS5058, 1974160,161
was used to determine the drape coefficient, using a Cusick Drapemeter
(Rotrakote Converting Limited, New York, N.Y). In this method, a form of
overhead projector is used. A 10-in-diameter fabric specimen is draped over a 4-
in-diameter circular platform. A shadow of the specimen shape is then cast by
light and a lens situated below the specimen. The image is then traced onto a
paper and cut out. The Drape coefficient is expressed as the percentage of the area
of the annular ring of fabric (less the supporting ring) obtained by vertically
projecting the shadow of the drape specimen (less the supporting ring). Some
recent studies have used digital methods with image processing and reported
results statistically comparable to those obtained by conventional drape testing161–
164.

76
5.2.2.2.4 Roughness and waviness coefficients
The surface texture was characterized by the waviness and roughness coefficients
(RC and WC respectively) on a five 5 sq cm samples using a 3D surface
profiler— Profilm3D (Filmetrics, San Diego, CA).
5.2.2.2.5 Warp density, weft density and weave density
The warp, weft and weave densities were computed from the equations below:
∗ ∗ ……………Eq 5.2
∗ ∗ …………….Eq 5.3
……..Eq 5.4
5.2.2.2.6 Fabric weight
The fabric weight was determined using ASTM D3776 / D3776M- Standard Test
Methods for Mass per Unit Area (Weight) of Fabric, option A.
There were no objective measurements related to the descriptors natural and noisy
5.2.2.2.7 Ranking of fabrics with objective measurements
For each measured parameter, the six fabrics were ranked, in descending order
according to the magnitude. Then, weights were computed for each fabric, for
each parameter according to the position/rank in the rank lists.
5.3 Results and discussion
5.3.1 Objective measurements
Table 5.1 and Table 5.2 show results of objectively measured fabric parameters.
Weights of ranks of fabrics are based on magnitudes of objective measurements.
Table 5.1 Characteristics of the six fabrics measured objectively
Fabric C1 C2 Ei Pi D1 D2 WD Th Wt FM FC EM EC DC RC WC BC BM
SA 31 28 76 65 467 380 847 0.28 149 3.56 2.30 13.3 21.6 0.77 0.05 0.07 2.49 2.88
SK 38 38 97 53 660 361 1021 0.33 230 8.97 3.51 13.4 26.1 0.72 0.11 0.15 2.48 3.39
SC 19 20 84 75 366 335 702 0.35 136 2.39 1.17 5.3 20.0 0.51 0.10 0.12 2.05 2.60
SE 18 10 103 65 483 227 710 0.17 94 1.30 0.64 18.6 28.3 0.63 0.11 0.14 1.89 2.40
SG 36 32 98 102 597 586 1182 0.76 258 5.18 3.46 13.6 8.8 0.59 0.22 0.26 2.39 2.74
SX 21 20 82 81 376 362 738 0.22 131 1.25 1.37 9.7 15.8 0.55 0.13 0.17 2.19 2.12
C1- Warp Tex, C2- Weft Tex, Ei- Ends/inch, Pi- Picks/inch, D1-Warp density, D2-Weft density, WD- Weave density, Th- Thickness (mm), Wt- Weight (g/m2), FM- Flexural rigidity (mNcm) in the warp direction, FC- Flexural
rigidity (mNcm) in the weft direction, EM- Elongation (%) in the warp direction, EC- Elongation (%) weft direction, DC- Drape coefficient, RC- Roughness coefficient, WC- Waviness coefficient, BC- Bending length (cm) in the
weft direction, BM- Bending length (cm) in the warp direction
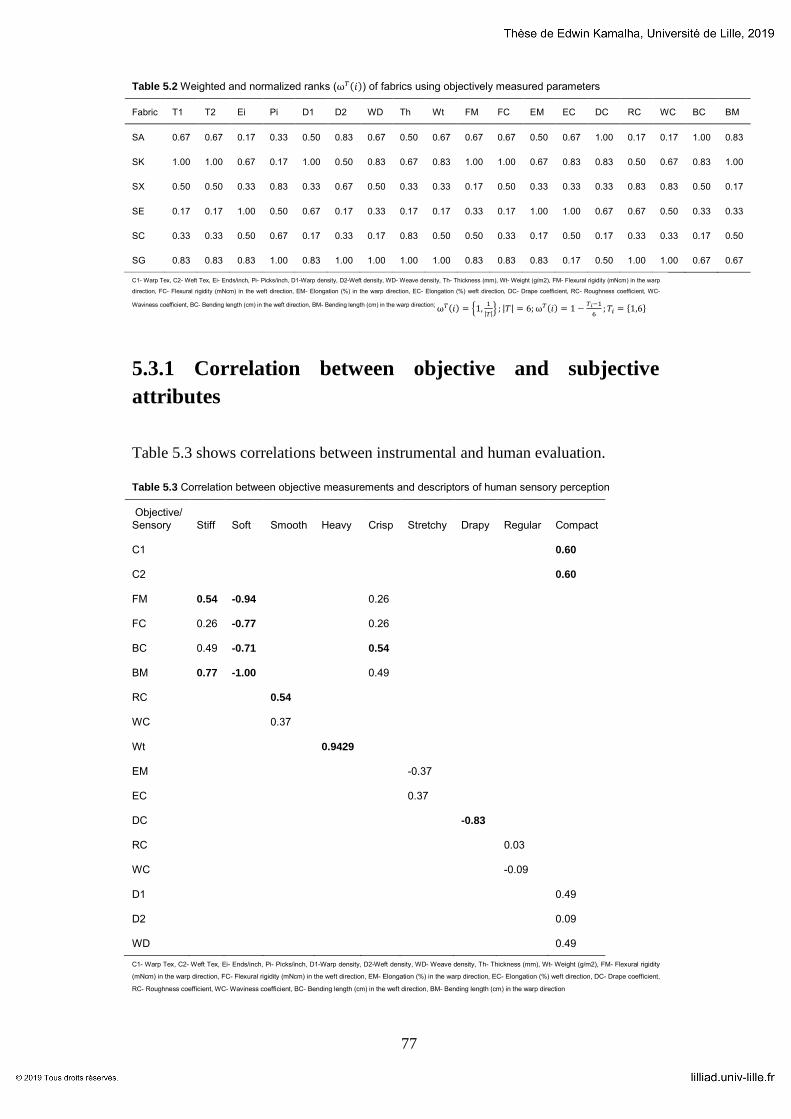
77
Table 5.2 Weighted and normalized ranks ( ) of fabrics using objectively measured parameters
Fabric T1 T2 Ei Pi D1 D2 WD Th Wt FM FC EM EC DC RC WC BC BM
SA 0.67 0.67 0.17 0.33 0.50 0.83 0.67 0.50 0.67 0.67 0.67 0.50 0.67 1.00 0.17 0.17 1.00 0.83
SK 1.00 1.00 0.67 0.17 1.00 0.50 0.83 0.67 0.83 1.00 1.00 0.67 0.83 0.83 0.50 0.67 0.83 1.00
SX 0.50 0.50 0.33 0.83 0.33 0.67 0.50 0.33 0.33 0.17 0.50 0.33 0.33 0.33 0.83 0.83 0.50 0.17
SE 0.17 0.17 1.00 0.50 0.67 0.17 0.33 0.17 0.17 0.33 0.17 1.00 1.00 0.67 0.67 0.50 0.33 0.33
SC 0.33 0.33 0.50 0.67 0.17 0.33 0.17 0.83 0.50 0.50 0.33 0.17 0.50 0.17 0.33 0.33 0.17 0.50
SG 0.83 0.83 0.83 1.00 0.83 1.00 1.00 1.00 1.00 0.83 0.83 0.83 0.17 0.50 1.00 1.00 0.67 0.67
C1- Warp Tex, C2- Weft Tex, Ei- Ends/inch, Pi- Picks/inch, D1-Warp density, D2-Weft density, WD- Weave density, Th- Thickness (mm), Wt- Weight (g/m2), FM- Flexural rigidity (mNcm) in the warp
direction, FC- Flexural rigidity (mNcm) in the weft direction, EM- Elongation (%) in the warp direction, EC- Elongation (%) weft direction, DC- Drape coefficient, RC- Roughness coefficient, WC-
Waviness coefficient, BC- Bending length (cm) in the weft direction, BM- Bending length (cm) in the warp direction;
5.3.1 Correlation between objective and subjective
attributes
Table 5.3 shows correlations between instrumental and human evaluation.
Table 5.3 Correlation between objective measurements and descriptors of human sensory perception
Objective/
Sensory Stiff Soft Smooth Heavy Crisp Stretchy Drapy Regular Compact
C1 0.60
C2 0.60
FM 0.54 -0.94 0.26
FC 0.26 -0.77 0.26
BC 0.49 -0.71 0.54
BM 0.77 -1.00 0.49
RC 0.54
WC 0.37
Wt 0.9429
EM -0.37
EC 0.37
DC -0.83
RC 0.03
WC -0.09
D1 0.49
D2 0.09
WD 0.49
C1- Warp Tex, C2- Weft Tex, Ei- Ends/inch, Pi- Picks/inch, D1-Warp density, D2-Weft density, WD- Weave density, Th- Thickness (mm), Wt- Weight (g/m2), FM- Flexural rigidity
(mNcm) in the warp direction, FC- Flexural rigidity (mNcm) in the weft direction, EM- Elongation (%) in the warp direction, EC- Elongation (%) weft direction, DC- Drape coefficient,
RC- Roughness coefficient, WC- Waviness coefficient, BC- Bending length (cm) in the weft direction, BM- Bending length (cm) in the warp direction

78
Softness, stiffness, elasticity and smoothness define fabric hand 165
. In this study,
the descriptor stiff was associated with stiffness properties of fabrics. As shown in
Table 5.3, only the bending length in the warp direction (BM) and the flexural
rigidity in the warp direction (FM) were significantly correlated (r=0.77 and
r=0.54 respectively) to the descriptor stiff. The weights of stiff increased as the
values of BM and FM increased. PET fabrics were generally perceived and
measured stiffer compared to cotton fabrics.
The descriptor soft was also associated with stiffness properties of fabrics. From
Table 5.3, it is also evident that there was strong negative correlation between the
perception of soft and all the measured stiffness properties; BM, BC, FM, and FC.
Objective and subjective evaluations generally presented PET fabrics, except
microfiber fabric SE, as stiffer and least soft than cotton fabrics. The ranking of
the cotton/polyester blended sample SG by subjectivity presented the largest
variation among objective measurements and human evaluation.
Representing the surface texture, the fabric roughness and waviness coefficients
were related to the descriptor smooth. RC was more correlated (r=0.54) to smooth
compared to WC (r=0.37). The ordinal ranking of fabrics for descriptor smooth
listed cotton fabrics and the microfiber fabric SE as the smoothest compared to
conventional PET fabrics SA and SK. Contrastingly, the roughness and waviness
measures had a random listing, with some cotton fabrics exhibiting more
roughness than PET fabrics. However, the roughness and waviness measurements
were closely related with r= 0.94.
Fabric weight was used to directly assess the perceptual evaluation of the
descriptor heavy. With a correlation coefficient of 0.94, it is deduced that
assessors’ perception of heavy was representative of objective measurements.
Moreover, the actual rank lists of fabrics by descriptor heavy and the objective
measurement (weight) were very close. Thus, fiber content was of inferior
significance on the perception of weight.
The descriptor crisp was also associated with stiffness properties of fabrics in the
warp and weft directions. Only the bending length in the weft direction (BC) was
significantly correlated (r=0.54) to the descriptor crisp. Correlations between stiff
and other stiffness properties were insignificant. Therefore, objective
measurements of stiffness were not representative of the perception by the
panelists.
Elongation measurements in the warp and weft directions (EM and EC) were used
to evaluate the descriptor stretchy. Findings show that there was low correlation
between the measured values and the human perception of stretchy. Moreover, the
fabric ranks for elongation measured in the warp and weft directions were also
different. Due to several interlacing points in plain weaves, threads in plain weave
fabrics portray extra length and stretch compared to twill weaves.
Behery165,166
reported about correlations between human perception of hand
attributes and objective measurements, considering different cotton and
cotton/polyester blended fabrics. The tensile linearity was negatively correlated
with the perception of softness, silkiness, smoothness, and thickness. Bending
rigidity was highly positively correlated with the perception of stiffness, crispness,
hardness and harshness. Fabrics with the highest cotton proportion in the blend
ratio presented the highest general hand factor (GHF). Correlation among
measured sensory attributes indicated that both shear rigidity and shear hysteresis

79
were highly correlated with weight and surface roughness, and negatively
correlated with compression resilience. The roughness (static friction coefficient)
of plain fabrics increased with the weft density.
Table 5.3 further shows that mechanical properties associated with hand, varied in
different directions. Bending rigidity has previously been reported to vary in the
warp and weft direction of the fabric due to variations in the warp and weft
densities. Particularly, the warp density is often higher than the weft density, for
example, bending rigidity in denim fabric can be different in the warp and weft
directions 167
. Yarn fineness may also differ for the weft and warp, leading to
different hand profiles in the two fabric direction. Chen et al168
reported low
values of roughness for plain weave silk and satin structure, but slightly different
in warp and weft directions.
The correlation coefficient between the descriptor drapy and the drape coefficient
(DC) was highly significant (r=-0.83). Fabrics with higher drape coefficients were
perceived less drapy; the draping quality of fabrics lowers with drape coefficient.
This implies that subjectively perceived drape was closely related to measured
drape values. This result is similar to findings by a number of studies169–174
; drape
values obtained instrumentally had significant correlation with subjective
evaluation. Fabric drape has been found to depend on fabric, yarn and fiber
properties. Other factors include, the environmental conditions as well as the
shape of the wearer/object175
. The current study noted that cotton fabrics exhibited
lower DC and were subjectively perceived strong for drapy compared to PET
fabrics. This study thus underscores the influence of fiber content on the drape
coefficient as well as on the human perceived drape of fabrics. For example, PET
micro fiber fabric SE had lower values of flexural rigidity and bending lengths
compared to some cotton fibers; however, the drape coefficients for all cotton
fabrics, and the cotton/PET blended fabric were still lower than for SE. Similar
findings on fiber content and drape were reported elsewhere175,176
. Ning’s group 177
classed 40 fabrics into three categories, according to their drape coefficient: 15
of pure cotton, 19 of cotton blend, and 6 synthetics fibers (5 PET and 1rayon).
The resulting correlations were: r = 0.838 within the pure cotton group, r = 0.554
for the cotton blend group and r = 0.545 for the synthetic group. They concluded
that fabric linear density was a better parameter to classify fabrics based on fabric
parameters influencing drape, compared to fiber content. Other studies recorded
that the drape coefficient highly correlates with; bending length and shear
stiffness 170
, fabric weight and shear hysteresis178
, bending rigidity and weight179
and bending resistance173
.
The surface waviness and roughness were also used to evaluate the descriptor
regular. In the evaluation protocol, regular was also defined as even. Computed
correlations indicate that there was a negligible correlation relationship between
the measured values and the perceived sensations for regular by panelists. The
descriptor compact was associated with the yarn count and the fabric weave
properties; warp/weft density, and weave density. These attributes also represent
the fabric cover factor. The warp density and the weave density presented low
correlations, below average, with the perceived sensation for compact. The weft
density, however exhibited very low correlation with the human perception of
compact. However, the linear density of yarns was more related to the perception
of compactness. The correlation coefficient between compact and the warp count
and weft count (Tex) was significant (r=0.6). Descriptors Natural and noisy could

80
not be represented with measurable attributes. The closest objective representation
of natural would be by the percentage of cotton fiber content. However, five
fabrics had ties in the cotton or PET fiber composition.
5.3.2 Sensory clustering and profiling by subjective versus
objective data
Considering the nine sensory descriptors used to identify sensory objective
measurements, PCA was carried out. Similarly, PCA was performed on objective
measurements that represent fabric sensory behavior. Table 5.4 shows the main
principal components needed to attain at least 80% of variability.
Table 5.4 Summary of variability of subjectively and objectively measured sensory parameters
PCA parameter
Subjective PCA Objective PCA
F1 F2 F1 F2 F3
Eigenvalue 4.51 2.96 8.56 4.28 3.09
Variability (%) 50.09 32.85 47.55 23.77 17.17
Cumulative % 50.09 82.94 47.55 71.31 88.48
Table 5.4 shows that the PCA variability was more significant with subjective
data. Only F1 and F2 were sufficient for subjective evaluation, compared to
objective evaluation, where three principal factors were needed. The analysis of
significant attributes was done by the squared cosines of variables (Table 5.5 and
Table 5.6), from PCA.
Table 5.5 Squared cosines of subjectively assessed sensory attributes
Stiff Soft Smooth Heavy Crisp Stretchy Drapy Regular Compact
F1 0.86 0.86 0.84 0.12 0.51 0.48 0.79 0.04 0.01
F2 0.02 0.12 0.07 0.85 0.37 0.14 0.11 0.79 0.49
Figures in bold indicate values for which the squared cosine is largest at p=0.05
From Table 5.5, it is evident that the descriptors of fabric hand (stiff and soft) are
the most significant, followed by heavy. Table 5.6 presents squared cosines of
objective measurements.
Table 5.6 Squared cosines of objectively evaluated fabric properties
C1 C2 Ei Pi D1 D2
W
D Th Wt FM FC EM EC DC RC
W
C BC BM
F
1
0.9
4
0.9
4
0.0
0
0.0
4
0.5
5
0.4
6
0.8
8
0.3
1
0.8
5
0.8
0
0.9
4
0.0
7
0.0
4
0.2
9
0.0
1
0.1
1
0.6
6
0.6
9
F
2
0.0
0
0.0
0
0.0
3
0.9
0
0.0
2
0.1
8
0.0
4
0.1
8
0.0
4
0.0
4
0.0
0
0.0
1
0.7
6
0.5
0
0.6
4
0.6
1
0.1
1
0.2
1
F
3
0.0
1
0.0
1
0.8
0
0.0
0
0.4
3
0.1
1
0.0
3
0.1
0
0.0
3
0.0
0
0.0
1
0.8
2
0.1
9
0.0
4
0.3
0
0.1
8
0.0
2
0.0
1
Figures in bold indicate values for which the squared cosine is largest at p=0.05

81
Table 5.6 shows that among the measured attributes, the warp and weft linear
density (C1 and C2 respectively), and the flexural rigidity were the most
significant. In relation to the human evaluated sensory attributes, the flexural
rigidity, which is a hand attribute, may represent descriptors soft and stiff. Thus,
hand attributes were significant by both human perception and objective
measurements.
5.3.3 Clustering of fabrics by subjective and objective
evaluation
5.3.3.1 Proximity measure (Euclidean distance) Table 5.7 shows the Euclidean distance between pairs of fabrics by both
subjective evaluation data and objective measurements.
Table 5.7 Euclidean distance between pairs of fabrics by objective and subjective evaluation
Fabric 1 SA SK SA SK SK SE SX SA SK SA SE SX SA SX SC
Fabric 2 SX SX SG SE SG SG SG SE SC SC SC SC SK SE SG
EDS 1.71 1.71
1.6
5
1.5
5
1.5
3
1.5
1
1.3
8
1.3
1
1.2
0
1.1
8
1.0
3
1.0
1
1.0
0
0.8
0
0.7
1
EDO 1.73 2.12
1.9
3
2.1
9
1.5
3
2.3
9
1.7
9
2.0
1
2.1
9
1.7
4
1.6
2
1.2
6
1.2
8
1.6
0
2.1
8
EDS- Euclidean distance from subjective evaluation, EDO- Euclidean distance from objective evaluation
Data on the Euclidean distance shows a general variation in values obtained from
the two approaches. The maximum and minimum Euclidean distances were
different, and between different pairs of fabrics, for each fabric evaluation
method. For example, the maximum Euclidean distance recorded under objective
evaluation was 2.39 (between SE and SG); compared to 1.71 (between SA and
SX, and between SK and SX). Pearson correlation coefficient between EDS and
EDO was 0.31.
The two distances, EDS and EDO were modeled by linear regression (Eq 5.4),
with a resulting R2 of 0.11 and p-value 0.23 (significance level 5%):
∗
The test for significance and goodness of fit indicate that this linear regression
model is weak. The PCA clustering by subjective data shows that fabrics are
generally clustered by their fiber composition, except for modified fabrics SE and
SX. Figure 5.1 shows the proximity and clustering of fabrics by objective and
subjective data.
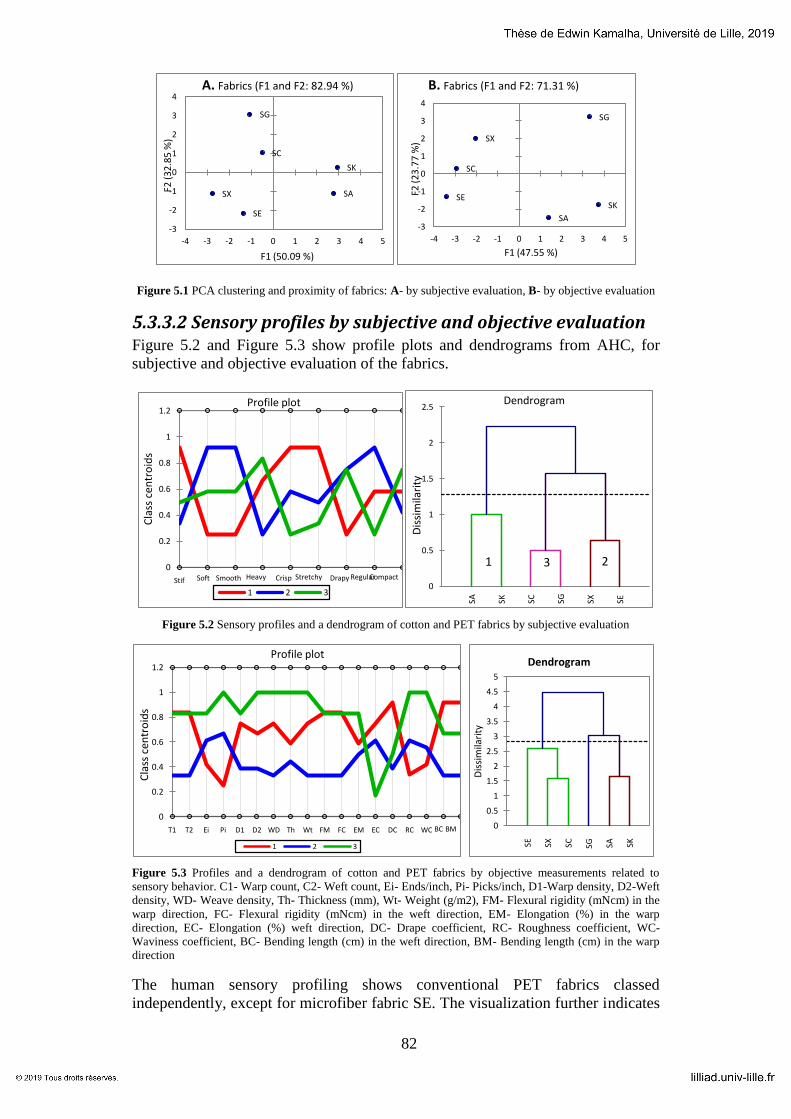
82
Figure 5.1 PCA clustering and proximity of fabrics: A- by subjective evaluation, B- by objective evaluation
5.3.3.2 Sensory profiles by subjective and objective evaluation Figure 5.2 and Figure 5.3 show profile plots and dendrograms from AHC, for
subjective and objective evaluation of the fabrics.
Figure 5.2 Sensory profiles and a dendrogram of cotton and PET fabrics by subjective evaluation
Figure 5.3 Profiles and a dendrogram of cotton and PET fabrics by objective measurements related to
sensory behavior. C1- Warp count, C2- Weft count, Ei- Ends/inch, Pi- Picks/inch, D1-Warp density, D2-Weft
density, WD- Weave density, Th- Thickness (mm), Wt- Weight (g/m2), FM- Flexural rigidity (mNcm) in the
warp direction, FC- Flexural rigidity (mNcm) in the weft direction, EM- Elongation (%) in the warp
direction, EC- Elongation (%) weft direction, DC- Drape coefficient, RC- Roughness coefficient, WC-
Waviness coefficient, BC- Bending length (cm) in the weft direction, BM- Bending length (cm) in the warp
direction
The human sensory profiling shows conventional PET fabrics classed
independently, except for microfiber fabric SE. The visualization further indicates
SA
SK
SX
SE
SC
SG
-3
-2
-1
0
1
2
3
4
-4 -3 -2 -1 0 1 2 3 4 5
F2 (3
2.8
5 %
)
F1 (50.09 %)
A. Fabrics (F1 and F2: 82.94 %)
SA
SK
SX
SE
SC
SG
-3
-2
-1
0
1
2
3
4
-4 -3 -2 -1 0 1 2 3 4 5
F2 (2
3.7
7 %
)
F1 (47.55 %)
B. Fabrics (F1 and F2: 71.31 %)
Stif Soft Smooth Heavy Crisp Stretchy Drapy Regular Compact 0
0.2
0.4
0.6
0.8
1
1.2
Cla
ss c
entr
oid
s
Profile plot
1 2 3
1 3 2
SA
SK
SC
SG
SX
SE
0
0.5
1
1.5
2
2.5 D
issi
mila
rity
Dendrogram
T1 T2 Ei Pi D1 D2 WD Th Wt FM FC EM EC DC RC WC BC BM
0
0.2
0.4
0.6
0.8
1
1.2
Cla
ss c
entr
oid
s
Profile plot
1 2 3 SE
SX
SC
SG
SA
SK
0
0.5
1
1.5
2
2.5
3
3.5
4
4.5
5
Dis
sim
ilari
ty
Dendrogram
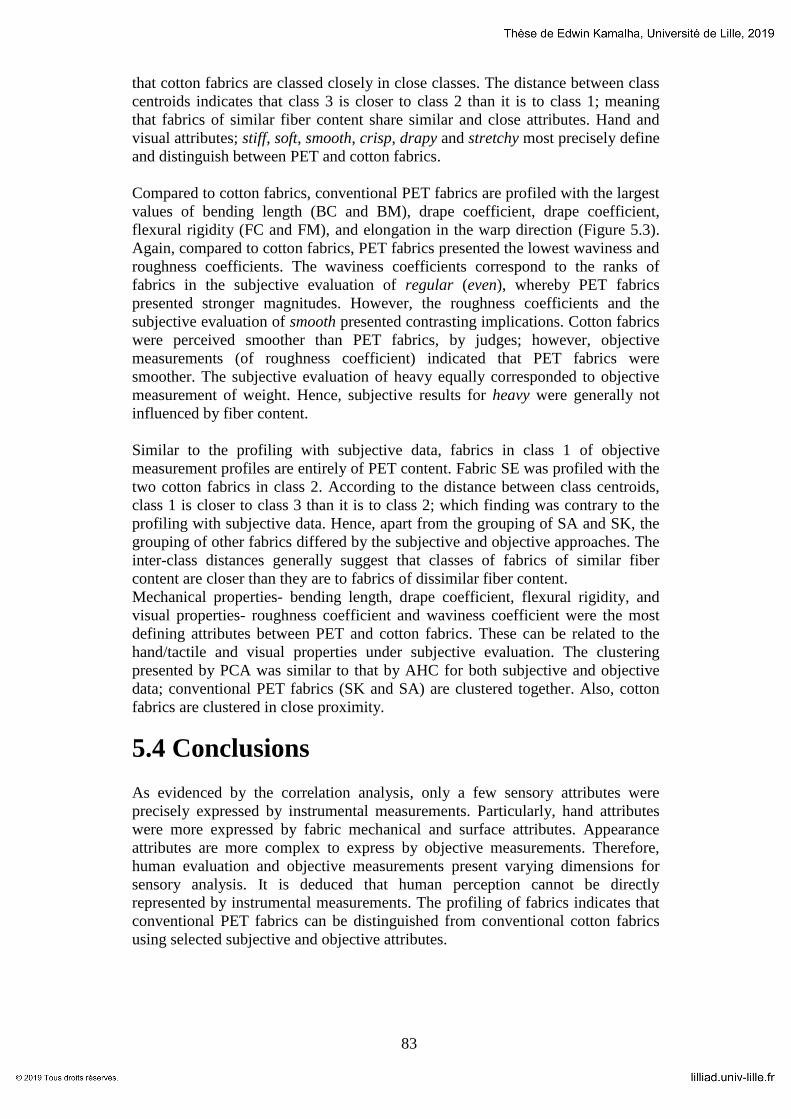
83
that cotton fabrics are classed closely in close classes. The distance between class
centroids indicates that class 3 is closer to class 2 than it is to class 1; meaning
that fabrics of similar fiber content share similar and close attributes. Hand and
visual attributes; stiff, soft, smooth, crisp, drapy and stretchy most precisely define
and distinguish between PET and cotton fabrics.
Compared to cotton fabrics, conventional PET fabrics are profiled with the largest
values of bending length (BC and BM), drape coefficient, drape coefficient,
flexural rigidity (FC and FM), and elongation in the warp direction (Figure 5.3).
Again, compared to cotton fabrics, PET fabrics presented the lowest waviness and
roughness coefficients. The waviness coefficients correspond to the ranks of
fabrics in the subjective evaluation of regular (even), whereby PET fabrics
presented stronger magnitudes. However, the roughness coefficients and the
subjective evaluation of smooth presented contrasting implications. Cotton fabrics
were perceived smoother than PET fabrics, by judges; however, objective
measurements (of roughness coefficient) indicated that PET fabrics were
smoother. The subjective evaluation of heavy equally corresponded to objective
measurement of weight. Hence, subjective results for heavy were generally not
influenced by fiber content.
Similar to the profiling with subjective data, fabrics in class 1 of objective
measurement profiles are entirely of PET content. Fabric SE was profiled with the
two cotton fabrics in class 2. According to the distance between class centroids,
class 1 is closer to class 3 than it is to class 2; which finding was contrary to the
profiling with subjective data. Hence, apart from the grouping of SA and SK, the
grouping of other fabrics differed by the subjective and objective approaches. The
inter-class distances generally suggest that classes of fabrics of similar fiber
content are closer than they are to fabrics of dissimilar fiber content.
Mechanical properties- bending length, drape coefficient, flexural rigidity, and
visual properties- roughness coefficient and waviness coefficient were the most
defining attributes between PET and cotton fabrics. These can be related to the
hand/tactile and visual properties under subjective evaluation. The clustering
presented by PCA was similar to that by AHC for both subjective and objective
data; conventional PET fabrics (SK and SA) are clustered together. Also, cotton
fabrics are clustered in close proximity.
5.4 Conclusions
As evidenced by the correlation analysis, only a few sensory attributes were
precisely expressed by instrumental measurements. Particularly, hand attributes
were more expressed by fabric mechanical and surface attributes. Appearance
attributes are more complex to express by objective measurements. Therefore,
human evaluation and objective measurements present varying dimensions for
sensory analysis. It is deduced that human perception cannot be directly
represented by instrumental measurements. The profiling of fabrics indicates that
conventional PET fabrics can be distinguished from conventional cotton fabrics
using selected subjective and objective attributes.

84
Chapter 6
Radically photo-grafted PET
woven fabric; Moisture, surface
and dyeing properties
6.1 Overview
In this chapter, the hydrophilic potential and efficacy of two vinyl monomers
radically photo-grafted on the surface of polyethylene terephthalate (PET) fabric
was investigated. Poly-(ethylene glycol) diacrylate (PEGDA) and [2-
(methacryloyloxy) ethyl]-trimethylammonium chloride (METAC), and a radical
photo initiator 2-hydroxy-2-methyl-1-phenyl-1-propanone (HMPP) were utilized.
The grafting of the monomers on PET was studied by X-ray photoelectron
spectroscopy (XPS) and Energy Dispersive Spectroscopy (EDS). Water contact
angle (WCA) measurements and dynamic moisture management tests (MMT)
indicate that PEGDA and METAC induce complete wetting of PET at
concentrations 0.1-5% (v:v). The grafted PET fabrics remain hydrophilic
following ad hoc testing using washing and rubbing fastness tests. PEGDA
grafted fabrics perform better, as static water contact angles of METAC grafted
fabrics increase after washing. Colorimetric measurements (K/S and
CIELAB/CH) and color fastness tests on dyed PET fabrics suggest that both
monomers greatly improve the dyeing efficacy of PET. Grafted PET fabrics
presented strong fastness properties, slightly better than the reference PET fabric.
The hand and appearance of grafted PET fabrics remains largely unchanged,
following drycleaning and laundering procedures. This study demonstrates the
potential of PEGDA and METAC for a hydrophilic function in conventional
textiles utilizing UV grafting. It is suggested that PEGDA and METAC generate
hydrophilic radicals/groups on PET; the macroradicals are in a form of vinyl
structures which form short chain grafts and demonstrate hydrophilic function at
the tested concentrations.

85
6.2 Materials and methods
6.2.1 Materials
6.2.1.1 Fabrics and polymerization reagents Mill-bleached polyester twill-5 fabric of weight 230 g/m
2 and 0.325 mm thickness
was supplied by Atmosphere Tissus (59800 Lille- France). METAC (75 wt% in
water, Mn 207.7) and PEGDA (Mn 700) were supplied by Sigma-Aldrich S.r.l.
(Milano-Italy), in liquid and gel form respectively. The photo initiator 2-hydroxy-
2-methyl-1-phenyl-1-propanone (HMPP) 99%, was supplied by BASF Kaisten
AG (Hardmatt, Kaisten- Switzerland), in liquid form. Ethanol- CH3CH2OH
(99.5%) (Sigma-Aldrich S.r.l., Milano-Italy) was used as solvent. The chemical
structure of the monomers and the photo-initiator are reported in Figure 6.1.
Figure 6.1 Structure of: A. PEGDA, Mn 700; B. METAC, 75% Wt in water; and C. HMPP
6.2.1.2 Light source for polymerization Ultraviolet initiating light for all UV treatments was provided by a 400 W metal
halide lamp (Dymax ECE 5000- Dymax Corporation, Torrington, USA) of
optimum intensity of 225 mWcm-2
at wavelength 365 nm (±5 nm ), in the UVA
domain. The UV intensity was measured using an irradiance meter- UV Power
Puck II (EIT Inc, Sterling, VA, USA).
6.2.1.3 Dyeing materials for PET The following materials were used in the dyeing process: a commercial acid-
stable red disperse dye Anocron Rubine S-2GL (Shanghai Anoky Group Co.,
Ltd), acetic acid 99.5% and MW 60.05 (Guangzhou Congzhongxiao Chemical

86
Technolog Co., Ltd), high temperature leveling agent- styrene phenol
polyoxyethylene ether ammonium sulfate (SPPEAS) 100% (Suzhou Eastion New
Material & Technology Co., Ltd), and NNO (C21H14Na2O6S2) of MW 472.44
(Guangzhou Congzhongxiao Chemical Technology Co., Ltd) as dispersant.
Reducing agent sodium hydrosulfite (Na2S2O4) and NaOH were used for washing.
6.2.1.4 Dyeing equipment A precision electronic balance BL-500F (Tianjin Danaher Sensors & Controls
Engineering Co., Ltd) with an accuracy of 0.001 g was used for weighting
dyestuff and auxiliaries, a pH meter PHS-3E (Shanghai Leici Co., Ltd) was used
to check the dyeing liquor pH and a Mathis Labomat (Wuxi Yangbo Textile
Equipment Co., Ltd) for dyeing.
6.2.2 Methods
6.2.2.1 Fabric preparation To eliminate any surface active agents and prior spinning and weaving oils, the
polyester fabric was Soxhlet-extracted using a Soxhlet- apparatus (Carlo Erba-
Milan, Italy) for 4 hours in petroleum ether, in the weight ratio of 1:5
(fabric:petroleum ether). After extraction, and drying, the fabric was then
conditioned (according to ISO 139:2005 Textiles— Standard atmospheres for
conditioning and testing)106
at 20°C (±2°C) and 65% RH (±4%) for 24 hours.
Then, a preliminary wetting test was carried out on the fabric according to the test
method AATCC 79, 2007- Absorbency of textiles135
; which estimates the time
taken for a water drop of 0.2 ml to be fully absorbed by a fabric. Sixteen PET
woven fabric samples were then obtained and characterized for static water
contact angles recorded over time180,181
using a KRUSS drop shape analyzer–
DSA100 (KRUSS, Hamburg- Germany). The fabric was also tested for dynamic
liquid transport properties (AATCC Test Method 195-2011- Moisture management
properties of textile fabrics)135
using a moisture management test (MMT) device
(SDL Atlas LLC, Charlotte, NC, USA).
6.2.2.2 UV-radical grafting The working distance between the UV lamp and the fabric platform was set at 6
cm for all UV treatments, delivering irradiance (intensity) of 145 mWcm-2
(UVA)
and 135 mWcm-2
(UVV). Firstly, the effect of UV irradiation (without any
chemicals) on the untreated PET fabric was evaluated to assess any change of
PET hydrophilicity after exposure to UV light. Five fabric samples of dimension 5
x 5 sqcm were exposed to the UV lamp for different durations (5, 10, 15, 20 and
25 minutes). After UV exposure, the static water contact angle for each specimen
was measured.
The grafting treatment of PET with PEGDA or METAC in the presence of the
photo-initiator and UV irradiation was then carried out according to the following
procedure. In one experiment, PEGDA was dissolved in ethanol at concentrations
between 0.1%-5% v/v. Then, the photo initiator at concentration of 0.1% with
respect to ethanol was added. After thorough agitation, 5x5 sqcm PET fabric
specimens were soaked in the bath for 10 minutes and then padded to squeeze out
excess solution before air-drying under room conditions. The two sides of the

87
monomer-soaked fabrics were then irradiated for one minute with intensity 280
mWcm-2
. Gaseous nitrogen was introduced in the irradiation chamber to create an
inert atmosphere, avoid oxygen inhibition and prevent ozone formation. Fabrics
were washed, ten minutes after removal from the irradiating chamber.
In a second set of experiments, the PET fabric specimens were treated with
METAC following the same procedure as for PEGDA. The add-on, which can
reflect the percentage of monomer grafted on the fabric, was obtained by Eq 6.1:
where WGrafted and WPristine are the weights of the pristine and grafted PET fabrics
respectively.
The weight of the PET samples and reagents was measured with an accuracy of
0.001 g on an analytical balance (ME104- Mettler Toledo, Milan-Italy)
6.2.2.3 Wetting and durability tests on grafted PET fabrics Using the sessile drop technique,
182–184 static water contact angles (WCAs) of the
grafted PET fabrics were measured after grafting. Moreover, the MMT device
was used to study fabric dynamic moisture attributes based on the AATCC Test
Method (TM) 195-2011– Liquid moisture management properties of textile
fabrics.135
To ascertain the durability of the grafted monomers, the grafted PET fabrics were
evaluated for appearance, hand and static WCAs after laboratory washing,
drycleaning and rubbing (crocking).
Washing was carried out twice, for each sample, following standard home
laundering conditions described in ISO 6330- Domestic washing and drying
procedures for textile testing (similar to AATCC Monograph (M) 6135
-
Standardization of home laundering conditions), using 4 g/l distilled water
solution of ECE non-phosphate detergent (A) without optical brighteners (SDL
Atlas, UK), with a modification in the equipment; a high temperature laboratory
machine (Labomat) was used, with stainless steel balls added in the washing
beakers. The washing beakers rotated during washing. Washing was performed at
a temperature of 40 oC (rising at a 1.5
oC per sec) with a fabric to liquor ratio of
1:20 for 30 minutes. The changes in hand and appearance after washing were
evaluated using the rating scale described in AATCC 86-2013135
.
Drycleaning was carried out once on each fabric sample, following AATCC 86-
2013- Durability of Applied Designs and Finishes135
, with a modification;
petroleum ether was used as the solvent and in a Soxhlet apparatus (Carlo Erba,
Milan-Italy). The changes in hand and appearance of drycleaned samples was
evaluated using the rating scale described in AATCC 86-2013. Since major loss of
finish material occurs in the first washing or dry cleaning, a single application of
the test was assumed to furnish a good indication of the effect of repeated
operations.
Rubbing/crocking test (wet and dry) was carried out using a crockmeter described
in AATCC Test Method 08, 2005135
. Ten strokes were applied on grafted fabric
and tests for WCAs were carried out.

88
6.2.2.4 Surface characterization of fabrics by EDS-SEM and XPS The surface elemental composition and morphology of treated and untreated
samples were studied using a ZEISS Merlin field emission scanning electron
microscope (ZEISS, Oberkochen- Germany) equipped with an energy dispersive
X-ray spectroscope. The microscope was operated at a voltage of 5 kV, pressure
of 200 Pa, and working distance of 5.8 mm. X-ray photoelectron spectroscopy
(XPS) was used to complement results from EDS, following inconclusive findings
on METAC-g-PET. XPS analysis was carried out by a PHI 5000 Versaprobe
(Physical Electronics, Chanhassen, MN, USA) of monochromatic Al K-α X-ray
source with a power of 25.2 W. A scan area of 100 μm2 was used to collect the
photoelectron signal while placed between the gold electrodes. A pass energy value of
187.85 eV was used for survey spectra, while 23.5 eV was used for high resolution
peaks.
6.2.2.5 Dyeing of untreated and monomer grafted PET A dyebath consisting 2% (w.o.f) of dye, fabric to liquor ratio of 1:20 w/v, 1g/l of
leveling agent (SPPEAS) and 1 g/l of dispersant (NNO) was prepared. Using
acetic acid, pH of the dyebath was adjusted to 5. A washing bath consisting 2 g/l
of Na2S2O4 and 2 g/l of NaOH was also prepared. Grafted and ungrafted PET
fabric samples of 5 g each were then introduced into beakers containing the dye
bath and later mounted onto the dyeing machine. With temperature rising at
2°C/min, dyeing was carried out at 130
°C (temperature rise of 1.5
°C per sec) for
60 minutes followed by cooling at 4°C /min. The dyed PET fabrics were then
washed in the washing bath with a fabric to liquor ratio 1:30 w/v at 80°C for 15
minutes. The washed fabrics were then rinsed in distilled water before drying at
room temperature.
6.2.2.6 Color measurements and fastness properties The colorimetric parameters of the dyed PET fabrics were determined on an
UltraScan PRO UV/VIS reflectance spectrophotometer D65 (HunterLab, Reston,
VA, USA) with a 10o standard observer. The K/S (color strength) was determined
by applying the Kubelka-Munk equation185,186
(Eq 6.2):
where R is the reflectance of colored samples, while, K and S are the absorption
and scattering coefficients respectively. Ro is a decimal fraction of the reflectance
of the undyed fabric standard reference. The CIE color scale represented by
codes- L* (Lightness), a*(+ a*=red, - a*=green), b*(+b*=yellow, - b*=blue), C*
(chroma or saturation), and h (hue angle; 0°=red, 90
°=yellow, 180
°=green,
270°=blue)
187,188 were used to elaborate color differences between the dyed
fabrics. Mean values from six measurements were recorded for each color
parameter on each fabric sample.
Color fastness to washing was evaluated using test method- BS EN ISO 105-
C08:2002+A1:2008: Colour fastness to domestic and commercial laundering
using a non-phosphate reference detergent incorporating a low temperature
bleach activator (similar to AATCC 61-2013 2A accelerated machine
laundering)42,135,189–191
. The test specimens were washed with a fabric to liquor

89
ratio of 1:20, for 30 minutes in 4 g/l distilled water solution of ECE non-
phosphate detergent (A) without optical brighteners (SDL Atlas, UK) at 40°C
(rising at a 1.5°C per sec) in a Labomat laboratory machine with stainless steel
balls added in the washing beakers. The washing beakers rotated during washing.
Color fastness to rubbing (wet and dry crocking) was evaluated using test method
AATCC 8-2007: AATCC crockmeter method. The colorfastness and ratings were
read using the AATCC Gray Scale for Color Change and the AATCC Gray Scale
Staining.
6.3 Results and discussion
6.3.1 Wetting of untreated fabrics
The liquid drop test (AATCC Test Method 79-2007)135
, showed that the untreated
PET fabric was non-absorbent as the water drop took an average of 56 seconds
(SD 9.6s and CV 17.2%) for total spreading. Figure 1 shows static WCAs
measured on untreated PET fabric.
Figure 6.2. Univariate plots of static WCAs (degrees) measured against water drop contact time on 16
untreated PET fabrics. The water drop contact time denotes the time after the water drop is deposited on the
fabric specimen.
Static WCAs measured between 0-5 seconds of water deposition ranged from 85°
to 124° (T0 in Figure 6.2). The average static WCAs were 100
° (CV 13%), 95
°
(CV 13%), and 88° (CV 19%) after 30, 60 and 90 seconds respectively (T30, T60
and T90 in Figure. 1). With the hydrophobic threshold being 90°, the untreated
PET fabric can be deemed hydrophobic. The average WCA of polyester fabrics
has been recorded between 72 and 140° depending on the fabric structure and
surface properties.192–195
The higher WCAs measured in this work on the
untreated PET fabric can be partly attributed to the tight packing of the twill-5
configuration, which also increases fabric roughness.196–198
Evidenced by the
CV% of the WCAs, the untreated fabric exhibited a heterogeneous wetting
profile. The wetting and adhesion behavior of a fabric surface is a function of both
the chemical and topographical properties.199
Young-Dupre’s equation (Eq 6.3) is
a common reference for defining equilibrium at the interfaces of solid-vapour,
T0 T30 T60 T90
50
60
70
80
90
100
110
120
130
140
Wat
er c
on
tact
an
gle
(deg
rees
)
Water drop contact time
Plots of WCAs with drop contact (duration) time on fabric Mean
Minimum/Maximum

90
solid-liquid and liquid-vapor.181
The Young’s contact angle θY is the result of
interfacial tensions γsv, γsl and γlv.
Young’s equation is based on a chemically homogenous and topographically
smooth surface. However, on a real surface, the actual contact angle is the angle
between the tangent to the liquid-vapor interface and the actual, local surface of
the solid. Hence, surface roughness is very important in wettability of fabrics.
Particularly, twill weaves present series of successive grooves that are formed by
the weft on the fabric surface- increasing surface roughness. Wenzel200
noted that
the hydrophobicity of hydrophobic materials increases with further surface
roughness. Hence, the hydrophobic character of polyester is expected to increase
when made into a twill-5 weave compared to basic weaves. This finding was also
presented by other authors196–198
who studied topography and structure of woven
fabrics and their effect on wetting.
6.3.2 Effect of UV irradiation on the wettability of PET
fabrics
PET fabric samples exposed to UV only, without any other chemicals, showed
reduction in WCAs, more noticeable with increasing exposure time, as shown in
Table 6.1.
Table 6.1 Static WCAs θ of PET fabrics for different UV exposure time
Water drop contact time (s)
UV irradiation time (min) and θ±standard deviation
0 5 10 15 20 25
5 106±5 100±3 100±9 98±4 90±8 86±6
30 102±8 97±7 95±7 89±9 82±9 84±5
60 99±4 90±5 89±4 87±8 71±6 73±9
90 99±5 89±6 87±7 86±8 70±8 70±7
In all cases, contact angles of UV-treated samples were lower than those of the
untreated sample. Nevertheless, no considerable wetting was achieved as WCAs
remained well above 70° for all UV exposure duration. The decrease of PET
WCAs after UV irradiation exposure can be attributed to photo-degradation or
photo-oxidation of PET, caused by photon absorption, which causes fracturing in
molecular structures (photo-dissociation).
6.3.3 Effect of PEGDA and METAC grafting on the
wettability of PET fabric
The add-on and wettability of PET fabrics grafted with PEGDA (PEGDA-g-PET)
are shown in Table 6.2.

91
Table 6.2 Add-on and static WCAs θ of PEGDA-g-PET fabric
PEGDA conc. (% v/v) HMPP conc. (% v/v) Irradiation time (min) Add-on (%) θ in 0-5s
5 0.1 1 2.7 0
3 0.1 1 2.4 0
2 0.1 1 1.6 0
1 0.1 1 0.9 0
0.5 0.1 1 0.9 0
0.2 0.1 1 0.3 0
0.1 0.1 1 0.2 0
For all PEGDA concentrations, there was complete wetting on the PEGDA-g-PET
fabrics. Hence, PEGDA was very effective in inducing hydrophilicity to the PET
fabric, even at low concentrations. As expected, the monomer add-on increased
with PEGDA concentration in ethanol.
The add-on and wettability of PET fabrics grafted with METAC (METAC-g-
PET) are shown in Table 6.2. Similar to PEGDA, the monomer add-on increased
with METAC concentration in ethanol. Complete wetting was achieved for all the
five METAC concentrations, with the highest contact angle of 36° at
concentration 0.5%. By comparing the results in Table 6.2 and Table 6.3, it can be
observed that compared to METAC, PEGDA was more effective in making PET
hydrophilic.
Grafting of PEGDA or METAC on PET creates moisture polar sites on the
surface of PET. Therefore, grafting of PEGDA or METAC on PET is expected to
increase the hydrophilic performance of the PET fabric since the grafted PET can
form plenty of hydrogen bonds with water molecules. Additionally, the grafting
reduces surface roughness by reducing surface troughs. The reduction in surface
roughness and the enhanced surface moisture polarity reduce the surface tension
at the liquid-fiber interface. These factors subsequently increase the wettability of
the PET fabric. Further, with the penetration of the grafting monomer in the pore
structure of PET fibers and yarns, wicking and porosity are improved. Static water
contact angles are particularly lowered by increased porosity with time
dependence.
Table 6.3 Add-on and static WCAs θ of METAC-g-PET fabric
METAC conc. (% v/v) HMPP conc. (% v/v) Irradiation time
(min) Add-on (%) θ in 0-5s θ in 30s
5 0.1 1 2.1 0 0
3 0.1 1 0.89 5 0
2 0.1 1 0.62 7 0
1 0.1 1 0.45 10 5
0.5 0.1 1 0.15 36 0
0.2 0.1 1 0.08 34 10
0.1 0.1 1 0.05 45 15

92
The grafting of PEGDA and METAC did not alter the stiffness of the PET fabrics,
which remained as pliable as the pristine ones, upon manual handling. However,
PEDGA performed better with the hydrophilic function on PET. The different
effects of the monomers on wettability can be discussed in terms of the add-on,
which is considerably lower for METAC than PEGDA. The differences in
grafting yield may result from different reaction kinetics with the photo-initiator,
and UV light. For instance, higher concentrations of the photo-initiator and longer
UV irradiation time may be required to enhance radical activity and lifetime and
monomer reaction. Differences in polymerization rates have also been found to
contribute to disparities in grafting yields in UV-grafting. Monomer
homopolymerization201
instead of grafting polymerization has also been noted to
impact on grafting efficiency of some monomers.202,201
Earlier, it was found that
acrylic acid photografting of PET resulted in a more hydrophilic effect compared
to acrylonitrile for equivalent amount of grafts.203
Hence, the number of imparted
polar groups may also vary with each monomer.
The moisture management test (MMT) method135
attempts to provide objective
measurements and an evaluation of liquid moisture management properties of
textile fabrics. The MMT takes into account the water resistance, water repellency
and water absorption characteristics as influenced by the fabric structure and the
wicking characteristics. Moreover, MMT measurements provide an overall
evaluation of in-plane and off-plane wettability, giving the information of the time
for water to penetrate through the fabric thickness and reach the bottom surface. A
predetermined amount of conductive solution that facilitates the measurement of
electrical conductivity is automatically dropped onto the surface of the fabric
specimen held flat between upper and lower arrays of concentric electric sensing
pins. The liquid drop behavior is evaluated for 120 seconds. The test device is
used to monitor the top and bottom radial spreading of the conductive liquid drop,
as well as the moisture absorption from the top surface to the bottom surface of
the specimen. During the test, changes in electrical resistance of the specimen are
used to calculate changes in the fabric liquid moisture content that quantify
dynamic liquid moisture transport characteristics in the three directions of the
specimen. Predetermined indices are used to grade the fabric moisture
management behavior basing on the measurements as in Table 6.4.
Table 6.4 Dynamic moisture management properties of pristine and selected grafted PET fabric
Fabric TW
(s)
BW
(s)
TA
(%/s)
BA
(%/s)
TM
(mm)
BM
(mm)
TS
( mm/s)
BS
(mm/s) AOT
SK 3.5 120 29.2 0.0 5.0 0.0 1.4 0.0 -834
SKU5 2.5 120 40.9 0.0 5.0 0.0 1.8 0.0 -893
SKU10 2.9 120 41.3 0.0 5.0 0.0 1.6 0.0 -828
SKP 3.0 5.8 39.5 25.0 13.8 22.5 3.0 3.6 -43.9
SKP1 2.6 2.3 46.5 37.3 17.5 27.5 4.5 6.5 214
SKM 3.5 5.6 32.2 19.7 10.0 15.0 1.9 2.0 -242
SKM5 3.0 4.5 36.7 23.8 15.0 17.0 2.3 2.1 -136
TW- Top wetting time, BW- Bottom wetting time, TA- Top absorption rate, BA- Bottom absorption rate, TM- Top maximum wetted radius, BM- Bottom maximum wetted radius, TS-
Top spreading speed, BS-Bottom spreading speed, AOT- Accumulative one-way transport index; SK- Pristine PET, SKU5- UV-treated 5 min, SKU10- UV-treated 10 min, SKP-
0.2% PEGDA-g-PET, SKP1- 1% PEGDA-g-PET, SKM- 1% METAC-g-PET, SKM5- 5% METAC-g-PET.

93
Results of BW, BA, BM, and BS (Table 6.4) suggest that the test liquid was not
absorbed through the bottom side of untreated PET fabric as well as PET fabrics
exposed to UV only. These tests are consistent with the WCA and the drop test
results which indicate that the PET fabric is hydrophobic. UV treatment alone had
only a notable effect on top wetting properties. The grafting of PEGDA and
METAC enhanced the moisture absorption and spreading rates of PET fabric.
Particularly, PEGDA had the most significant impact on bottom wetting
properties with higher monomer concentration imparting a pronounced
hydrophilic effect. The transfer of moisture from the top to the bottom of fabric
represents how fast a fabric would transfer sweat from the wearer to the outer part
of clothing. This has an effect on the wearing comfort. Based on standard MMT
scaling, the 1% PEGDA-g-PET fabrics posted a very good grading (4/5), and the
best for one-way transport ability. Figure 6.3 is a visual presentation of the MMT
result. The light blue areas indicate the wetted areas on the top and bottom
surfaces of the fabric at the end of the test. The standard test duration is
usually120 seconds after dosing the 2 ml water drop on the fabric top surface.
PEGDA imparted complete wetting of both sides while METAC imparted partial
wetting of the top and bottom sides of PET fabric. The effect of UV irradiation
only can be visualized by comparing discs in Figure 6.3 A and B for the bottom
wetting; slight bottom absorption was achieved for UV treated (B) unlike for the
untreated fabric (A). The effect of monomer concentration is also reflected by the
depth and area of the absorbed liquid; higher monomer concentration showed
deeper and wider absorption. The most impacted were the bottom moisture
properties, given that the untreated fabric showed no bottom wetting at all. This
wetting behavior is consistent with the earlier result from the WCA and water
drop tests. With only-UV treatment, bottom dynamic properties remained largely
unchanged.
Figure 6.3 Schemes of top and bottom wetted radius for the tested fabrics: A-Pristine PET; B- UV-treated 5
min; C-1% PEGDA-g-PET; D- 0.2% PEGDA-g-PET; E-5% METAC-g-PET; F-1% METAC-g-PET

94
The observed effect of UV treatment alone on top wetting properties indicates
degradation from photo activity of UV energy. MMT results, showing good off-
plane liquid transport from the top to the bottom surface, demonstrated that UV
grafting was able to partly penetrate the inner structure of the fabric, modifying
PET substrate to allow water to go through the fabric thickness. The
multidirectional nature of MMT evaluation can depict moisture movement in
clothing such as ease of drying, during sweating and perspiration on the human
skin. The spreading speed also depicts the wicking properties of a fabric. Moisture
management balance is not often achieved and highly absorbing fabrics tend to
post low wicking due to moisture retention. Wicking provides the most needed
route to achieve a feeling of comfort by the wearer. Through wicking, moisture
from the skin is spread through the fabric while evaporating off to give the wearer
a cool and dry feel.
6.4.4 Durability of grafted monomers
Table 5 shows WCAs of PEGDA-g-PET after washing with a standard acqueous
detergent solution and Soxhlet extraction in petroleum ether. To notice the
changes in WCAs of PEGDA-g-PET, reference should be made to Table 6.2
which shows WCAs of PEGDA-g-PET.
Table 6.5 Static WCAs θ of PEGDA-g-PET after washing and Soxhlet extraction
PEGDA conc.
(% v/v)
after two washing cycles after Soxhlet extraction
θ in 0-5s θ in 30s θ in 0-5s θ in 30s θ in 60s
5 0 0 31 0 0
3 0 0 12 0 0
2 0 0 19 0 0
1 0 0 32 0 0
0.5 5 0 28 0 0
0.2 33 5 25 5 0
0.1 43 0 64 21 0
Washing with detergent solution affected fabrics grafted with the lowest PEGDA
concentrations of 0.1% and 0.2%; however, the grafted fabric remained
hydrophilic. On the other hand, WCAs for PEGDA-g-PET increased after Soxhlet
extraction, for all concentrations of PEGDA, albeit maintaining wetting
thresholds. Table 6.6 shows WCAs of METAC-g-PET after washing with
detergent solution and Soxhlet extraction. To notice the changes in WCAs of
METAC-g-PET, reference should be made to Table 6.3 which shows WCAs of
METAC-g-PET.

95
Table 6.6 Static WCAs θ of METAC-g-PET after washing and extraction
METAC conc. (%v/v) After two washing cycles after Soxhlet extraction
θ in 0-5s θ in 30s θ in 60s θ in 0-5s θ in 30 θ in 60s
5 103 42 0 27 15 0
3 103 61 0 18 0 0
2 100 55 0 22 5 0
1 83 30 0 55 37 0
0.5 101 20 0 85 35 30
0.2 98 51 22 89 56 27
0.1 88 50 28 80 30 25
WCAs of METAC-g-PET increased after washing in aqueous detergent (Table
6.6). However, wetting was attained within 30 seconds for all monomer
concentrations. Relatively lower increase of WCAs was noted for METAC-g-PET
after Soxhlet extraction. It is reasonable to suspect an interruption on the grafted
monomer matrix due to washing and extracion. Table 6.7 shows results of the
rubbing fastness test (wet and dry) on PEGDA-g-PET. Rubbing had negligible
effect for all monomer concentrations as PEGDA-g-PET remained completely
wettable.
Table 6.7 Static WCAs θ of PEGDA-g-PET after the rubbing test
PEGDA conc. (% v/v) after dry rubbing after wet rubbing
θ in 0-5s θ in 30s θ in 0-5s θ in 30s
5 0 0 0 0
3 0 0 0 0
2 0 0 5 0
1 7 0 0 0
0.5 0 0 0 0
0.2 10 0 15 5
0.1 0 0 10 0
Table 6.8 shows static WCAs of METAC-g-PET after both rubbing tests.
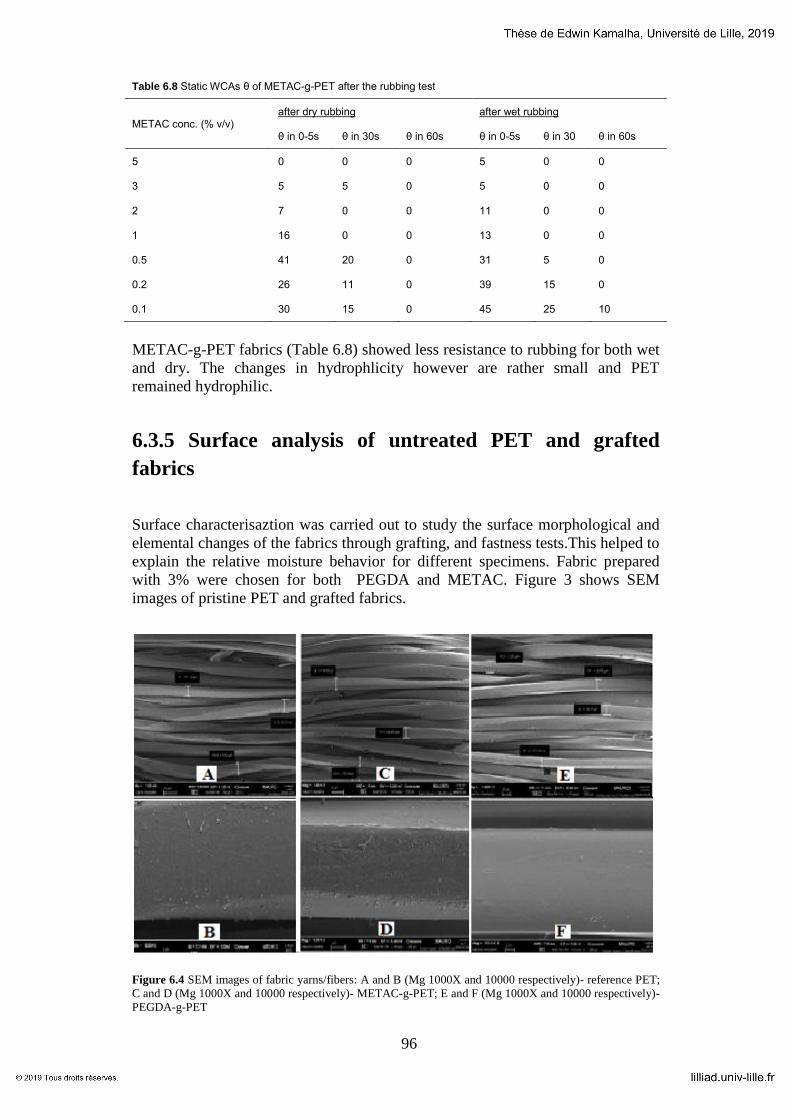
96
Table 6.8 Static WCAs θ of METAC-g-PET after the rubbing test
METAC conc. (% v/v) after dry rubbing after wet rubbing
θ in 0-5s θ in 30s θ in 60s θ in 0-5s θ in 30 θ in 60s
5 0 0 0 5 0 0
3 5 5 0 5 0 0
2 7 0 0 11 0 0
1 16 0 0 13 0 0
0.5 41 20 0 31 5 0
0.2 26 11 0 39 15 0
0.1 30 15 0 45 25 10
METAC-g-PET fabrics (Table 6.8) showed less resistance to rubbing for both wet
and dry. The changes in hydrophlicity however are rather small and PET
remained hydrophilic.
6.3.5 Surface analysis of untreated PET and grafted
fabrics
Surface characterisaztion was carried out to study the surface morphological and
elemental changes of the fabrics through grafting, and fastness tests.This helped to
explain the relative moisture behavior for different specimens. Fabric prepared
with 3% were chosen for both PEGDA and METAC. Figure 3 shows SEM
images of pristine PET and grafted fabrics.
Figure 6.4 SEM images of fabric yarns/fibers: A and B (Mg 1000X and 10000 respectively)- reference PET;
C and D (Mg 1000X and 10000 respectively)- METAC-g-PET; E and F (Mg 1000X and 10000 respectively)-
PEGDA-g-PET
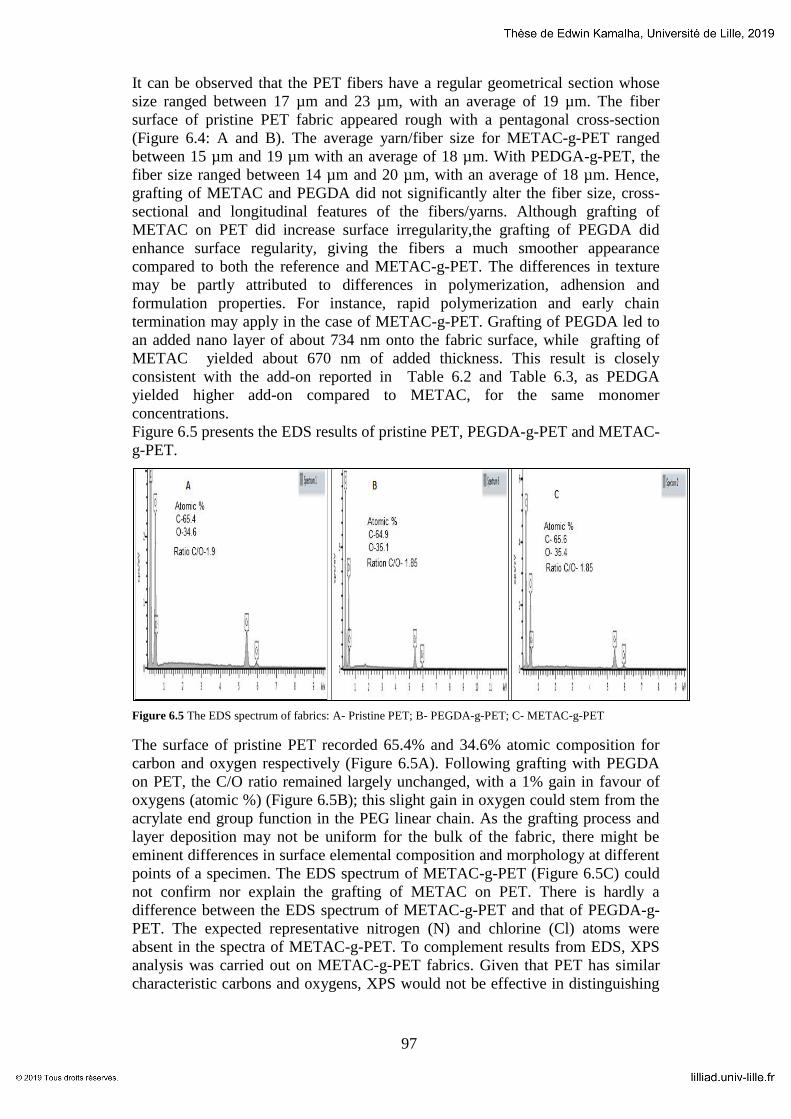
97
It can be observed that the PET fibers have a regular geometrical section whose
size ranged between 17 µm and 23 µm, with an average of 19 µm. The fiber
surface of pristine PET fabric appeared rough with a pentagonal cross-section
(Figure 6.4: A and B). The average yarn/fiber size for METAC-g-PET ranged
between 15 µm and 19 µm with an average of 18 µm. With PEDGA-g-PET, the
fiber size ranged between 14 µm and 20 µm, with an average of 18 µm. Hence,
grafting of METAC and PEGDA did not significantly alter the fiber size, cross-
sectional and longitudinal features of the fibers/yarns. Although grafting of
METAC on PET did increase surface irregularity,the grafting of PEGDA did
enhance surface regularity, giving the fibers a much smoother appearance
compared to both the reference and METAC-g-PET. The differences in texture
may be partly attributed to differences in polymerization, adhension and
formulation properties. For instance, rapid polymerization and early chain
termination may apply in the case of METAC-g-PET. Grafting of PEGDA led to
an added nano layer of about 734 nm onto the fabric surface, while grafting of
METAC yielded about 670 nm of added thickness. This result is closely
consistent with the add-on reported in Table 6.2 and Table 6.3, as PEDGA
yielded higher add-on compared to METAC, for the same monomer
concentrations.
Figure 6.5 presents the EDS results of pristine PET, PEGDA-g-PET and METAC-
g-PET.
Figure 6.5 The EDS spectrum of fabrics: A- Pristine PET; B- PEGDA-g-PET; C- METAC-g-PET
The surface of pristine PET recorded 65.4% and 34.6% atomic composition for
carbon and oxygen respectively (Figure 6.5A). Following grafting with PEGDA
on PET, the C/O ratio remained largely unchanged, with a 1% gain in favour of
oxygens (atomic %) (Figure 6.5B); this slight gain in oxygen could stem from the
acrylate end group function in the PEG linear chain. As the grafting process and
layer deposition may not be uniform for the bulk of the fabric, there might be
eminent differences in surface elemental composition and morphology at different
points of a specimen. The EDS spectrum of METAC-g-PET (Figure 6.5C) could
not confirm nor explain the grafting of METAC on PET. There is hardly a
difference between the EDS spectrum of METAC-g-PET and that of PEGDA-g-
PET. The expected representative nitrogen (N) and chlorine (Cl) atoms were
absent in the spectra of METAC-g-PET. To complement results from EDS, XPS
analysis was carried out on METAC-g-PET fabrics. Given that PET has similar
characteristic carbons and oxygens, XPS would not be effective in distinguishing

98
between pristine PET and PEGDA-g-PET fabrics,similarly as observed with EDS
results in Figure 6.5.
Figure 6.6 presents the XPS chemical shifts of pristine PET fabric. The
characteristic C1s peaks at binding energy 288.66 eV, 284.6 eV and 284.7 eV
represent the carboxyl (COOH), hydroxyl (OH) and aromatic (C=C) groups of
PET respectively. The O1s detected between binding energy levels 531 eV and
533.22 relate to hydroxyl and carbonyl carbons. The experimental ratio of carbon
atoms to oxygen atoms on pristine PET is 2.8, which is very close to the
theoretical value of 2.5, for PET. The traces of fluorine (0.7%) may be considered
a contamination.
Figure 6.6 XPS spectrum of pristine PET fabric.
Figure 6.7 shows the spectrum of METAC-g-PET.
Figure 6.7 XPS spectrum of METAC-g-PET fabric
sampleA_0001_1.SPE: survey Company Name
2017 Mar 17 Al mono 25.2 W 100.0 µ 45.0° 187.85 eV 1.3507e+004 max 7.51 min
SUR/Area1/1 (SG5 SG5)
0200400600800100012000
5000
10000
15000sampleA_0001_1.SPE
Binding Energy (eV)
c/s
Atomic %
C1s 73.0
O1s 26.3
F1s 0.7
-O
KL
L
-O
KL
L
-O
1s
-C
1s
-F
KL
L2 -
F K
LL
1
-F
KL
L
-F
2s
-F
2p
-F
1s
sampleB_0001_1.SPE: survey Company Name
2017 Mar 17 Al mono 25.2 W 100.0 µ 45.0° 187.85 eV 3.2093e+003 max 7.51 min
SUR/Area1/1 (SG5 SG5 SG5)
0200400600800100012000
500
1000
1500
2000
2500
3000
3500sampleB_0001_1.SPE
Binding Energy (eV)
c/s
Atomic %
C1s 70.0
O1s 25.4
N1s 4.0
Cl2p 0.6
-N
KL
L
-O
KL
L -
O K
LL
-O
1s
-N
1s
-C
1s
-C
l2s
-C
l2p

99
The grafting of METAC is confirmed by the presence of N1s (nitrogen) and Cl2p
(chlorine) signals with atomic composition of 4% and 0.7% respectively. The
peak N1s chemical shift at binding energy 401.8 eV represents an ammonium salt,
usually falling between binding energy range 400.4 eV-403.2 eV. The detected
CI2p signals at 198.7 eV are the attribute of an alkali chloride; in this case, the
most relevant is the ammonium chloride. Inaccuracies have been noted during
quantitative analysis of certain samples by the EDS technique due to their
complex composition and that only chemical elements with atomic number Y ≥
11 are considered for computation of atomic concentrations.204,205
The atomic
numbers of fluorine, chlorine, and nitrogen are 9, 17, and 7 respectively. It is also
suggested that by EDS, only elements with concentrations above 1% can be
included in mapping by EDS.206
Hence, even with a high atomic number, chlorine
atoms had very low concentration to be detected by EDS. The mass-sensitivity of
EDS analysis can thus be said to significantly rely on the ratio of peak signal to
emission background.
On account of EDS and XPS results, it is fair to confirm the grafting of METAC
and PEGDA on the PET fabric; the grafted monomers were responsible for the
relative changes in PET wettability already discussed.
6.3.6 Surface analysis of fabrics after washing and wet
rubbing
Figure 6.8 shows SEM images of grafted fabrics before and after the washing and
wet rubbing tests. As observed, wet rubbing did not have a significant impact on
the surface of grafted fabrics (Figure 6.8: F and J). However, washing did alter the
grafted fabric surface significantly (Figure 6.8: G and K); more so, for METAC-g-
PET. This surface alteration could explain the reversed hydrophilicty of grafted
PET after washing particularly for METAC-g-PET fabric, presented earlier in
Table 6.6.
Figure 6.8 SEM images of: E- METAC-g-PET; F and G- METAC-g-PET after wet rubbing and washing
respectively; I- PEGDA-g-PET; J and K- PEGDA-g-PET after wet rubbing and washing respectively
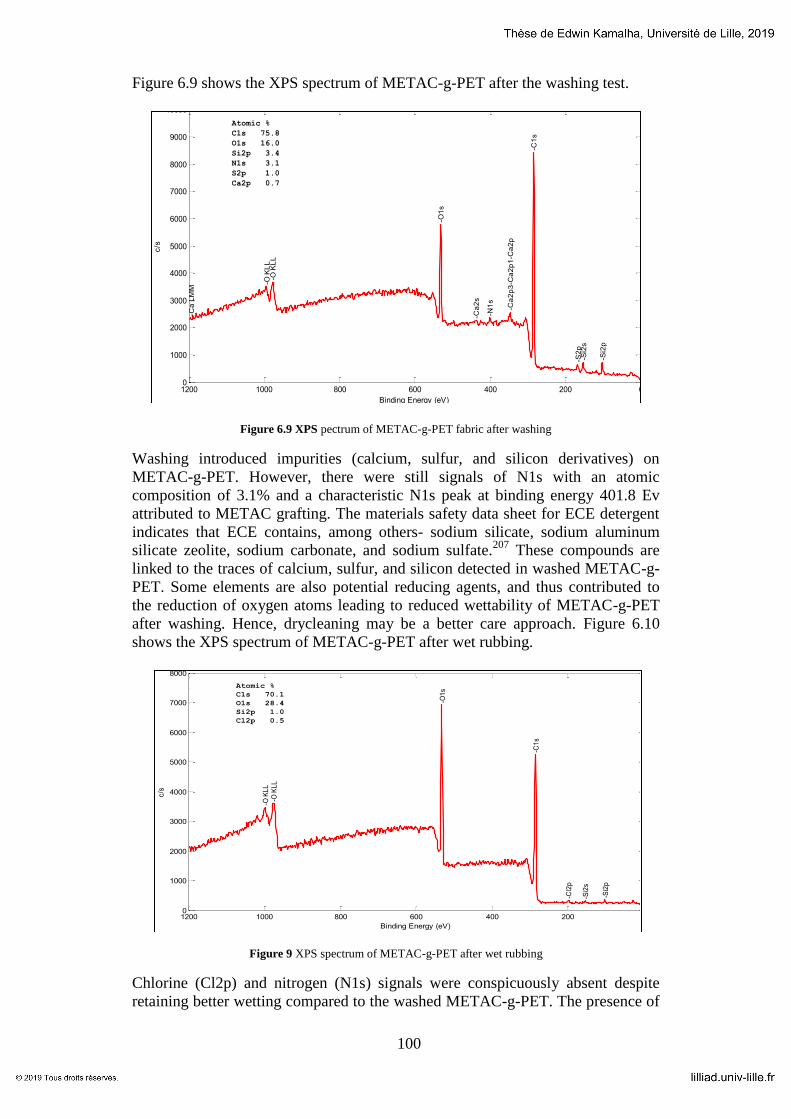
100
Figure 6.9 shows the XPS spectrum of METAC-g-PET after the washing test.
Figure 6.9 XPS pectrum of METAC-g-PET fabric after washing
Washing introduced impurities (calcium, sulfur, and silicon derivatives) on
METAC-g-PET. However, there were still signals of N1s with an atomic
composition of 3.1% and a characteristic N1s peak at binding energy 401.8 Ev
attributed to METAC grafting. The materials safety data sheet for ECE detergent
indicates that ECE contains, among others- sodium silicate, sodium aluminum
silicate zeolite, sodium carbonate, and sodium sulfate.207
These compounds are
linked to the traces of calcium, sulfur, and silicon detected in washed METAC-g-
PET. Some elements are also potential reducing agents, and thus contributed to
the reduction of oxygen atoms leading to reduced wettability of METAC-g-PET
after washing. Hence, drycleaning may be a better care approach. Figure 6.10
shows the XPS spectrum of METAC-g-PET after wet rubbing.
Figure 9 XPS spectrum of METAC-g-PET after wet rubbing
Chlorine (Cl2p) and nitrogen (N1s) signals were conspicuously absent despite
retaining better wetting compared to the washed METAC-g-PET. The presence of
sampleC_0001_1.SPE: survey Company Name
2017 Mar 17 Al mono 25.2 W 100.0 µ 45.0° 187.85 eV 8.4205e+003 max 7.51 min
SUR/Area1/1 (SG5 SG5)
0200400600800100012000
1000
2000
3000
4000
5000
6000
7000
8000
9000
10000sampleC_0001_1.SPE
Binding Energy (eV)
c/s
Atomic %
C1s 75.8
O1s 16.0
Si2p 3.4
N1s 3.1
S2p 1.0
Ca2p 0.7
-O
KL
L -
O K
LL
-O
1s
-N
1s
-C
1s
-S
2p
-S
i2s
-S
i2p
-C
a L
MM
-C
a2
s
-C
a2
p3
-Ca
2p
1 -C
a2
p
sampleD_0001_1.SPE: survey Company Name
2017 Mar 17 Al mono 25.2 W 100.0 µ 45.0° 187.85 eV 6.9263e+003 max 7.51 min
SUR/Area1/1 (SG5 SG5)
0200400600800100012000
1000
2000
3000
4000
5000
6000
7000
8000sampleD_0001_1.SPE
Binding Energy (eV)
c/s
Atomic %
C1s 70.1
O1s 28.4
Si2p 1.0
Cl2p 0.5
-O
KL
L -
O K
LL
-O
1s
-C
1s
-C
l2p
-S
i2s
-S
i2p

101
1% silicon in rubbed METAC-g-PET is attributed to contamination since the
pristine PET and METAC-g-PET did not present this element. Thus, the changes
in the hydrophilic behavior of both METAC-g-PET and PEGDA-g-PET can be
explained by the surface changes occuring due to removal of unreacted monomer
or alteration due to the physical activity on the surface of fabrics. With several
washes or continuous rubbing, this effect could be pronounced especially with
METAC-g-PET.
6.3.7 Color strength parameters of dyed PET fabrics
Figure 10 shows color strength (K/S) values of dyed PET fabrics measured over
the UV-VIS spectral range 350 nm- 700 nm.
Figure 6.11 K/S for dyed PET fabrics at different wavelengths: SK is pristine PET, KP1 and KP3 are
PEGDA-g-PET at 1% and 3% monomer concentration respectively, KM1 and KM3 are METAC-g-PET at
1% and 3% monomer concentration respectively.
Pristine PET fabric exhibited the lowest K/S values for wavelengths 350 nm- 425
nm, and had the lowest, next to METAC-g-PET of monomer concentration 1%,
for wavelengths 425 nm- 650 nm. Hence, grafted fabrics generally presented
higher color intensity compared to the ungrafted fabric. The color strength
especially increased with monomer concentration and was highest for PEGDA
grafted PET. The significance of the grafted monomers on the dyeing efficiency
of PET can also be elaborated from the CIE color measurements185
: L*, a*, b*, c,
and h.
Table 6.9 shows the means of six measurements for CIE color
parameters.185
Table 6.9 Colorimetric measurements of disperse dye red Anocron Rubine on PET fabrics
Fabric L* a* b* C* h
SK 40.52 51.53 8.53 53.22 9.22
KM1 38.46 51.97 8.27 53.66 8.79
KM3 37.64 52.21 7.77 53.79 8.46
KP1 38.61 52.60 7.71 53.47 8.34
KP3 37.77 52.32 6.64 54.76 7.35
SK is pristine PET fabric, KP1 and KP3 are PEGDA grafted PET at 1% and 3% concentration respectively, KM1 and KM3 are METAC grafted PET at 1% and 3% concentration
respectively.
0
2
4
6
8
10
12
14
16
18
300 400 500 600 700 800
K/S
Wavelength nm
SK
KP3
KM3
KM1
KP1

102
The grafting of PEGDA and METAC on PET fabrics reduced the lightness,
increased the redness, enhanced the chroma, and reduced the hue angle.
Especially, there were significant differences (P< 0.05) for K/S, L*, a*, b*, C*,
and hue angle, suggesting enhanced color depth due to monomer grafting. The
differences in L* between SK and the monomer grafted fabrics ranged between
5%-7%, towards darkness. The yellowness reduced by 3%-22%; higher values
were recorded for PEGDA-g-PET. The chroma, which represents the color
saturation, increased more for KP3 by about 3%. Figure 6.12 shows a
visualization of the colorimetric differences among the dyed PET fabrics.
Figure 6.12 Color parameters of disperse dye red Anocron Rubine on PET fabrics: SK is pristine fabric, KP1
and KP3 are PEGDA grafted PET at 1% and 3% concentration respectively, KM1 and KM3 are METAC
grafted PET at 1% and 3% concentration respectively
The wettability of fabrics is a very significant function in dictating the state of the
molecular polymer chains. When the polarity is increased by monomer grafting,
the speed of the segment polymer chains and moisture during dyeing is increased;
the dyeing transition temperature is subsequently decreased. Hence, the rate of
diffusion, and spreading of disperse dye molecules into the PET fabric is
enhanced with potential increase in color strength. It is deduced that the rate of
dye uptake and the total dye uptake, increase increasing hydrophilicity.
6.3.8 Appearance and hand of grafted fabrics after
laundering and drycleaning
Table 6.10 Appearance and hand grades of grafted fabrics
Fabric Laundering
Hand Appearance
Dry cleaning
Hand
Appearance
KM1 B5 A5 B4 B4
KM3 B5 A5 B5 B5
KP1 B5 A5 B5 B5
KP3 B5 A5 B5 B5
0
10
20
30
40
50
60
L* a* b* C* h
Val
ues
Colour parameters
Values of color parameters for dyed fabric samples SK
KM1
KM3
KP1
KP3

103
The observed results in Table 6.10 indicate that all tested grafted fabrics were not
affected by laundering, according to the subjective handle and appearance result.
Except for KM1, the changes in hand and appearance were negiligible for the dry
cleaning test. According to the evaluation protocol, B5 is the highest grade for
hand, while, A5 is the highest grade for appearance, indicating a no change in the
perceived change.
6.3.9 Colourfastness of dyed fabrics
Table 6.11 presents colour fastness results on grafted PET fabrics.
Table 6.11 Color fastness grades of dyed fabrics
Fabric Dry rubbing Wet rubbing Washing-Colour change Washing- Staining
SK 4 3.5 4 4
KM1 4 3.5 4.5 4.5
KM3 4.5 4 4.5 4.5
KP1 4.5 4 4.5 4
KP3 5 4.5 5 4.5
Colorfastness results indicate that PEGDA grafted PET fabrics had better
colorfastness, generally. Additionally, grafted fabrics had better colorfastness
compared to the reference fabric SK. Particularly, fabrics obtained from grafting
with higher monomer concentration showed stronger colorfastness. These results
are related to color strength properties, indicating that higher concentrations of
monomer during grafting, lead to grafting of more hydrophilic groups on the
surface of PET.
6.4 Conclusions
This study explored the surface grafting of two vinyl monomers to PET using
photochemistry. The add-on, which represents the grafting yield, increased with
monomer concentration in the solvent, more remarkably for PEGDA than for
METAC. Surface quantification by EDS and XPS confirmed the grafting of
PEGDA and METAC respectively. With either of the two monomers complete
wetting was achieved. However, PEGDA offers a more sustainable hydrophilic
functionality, both in terms of durability and economy as low monomer
concentrations were required. Washing and solvent extraction reduced the wetting
effect of METAC-g-PET. The grafting of PEGDA and METAC enhanced the
color strength of PET fabric dyed with a disperse dye. Grafted PET fabrics
presented strong fastness properties, slightly better than the reference PET fabric.
The hand and appearance of grafted PET fabrics remains largely unchanged,
following drycleaning and laundering procedures. This study demonstrates the
potential of PEGDA and METAC for a hydrophilic function in conventional
textiles utilizing UV grafting. It is suggested that PEGDA and METAC generate
hydrophilic radicals/groups on PET; the macroradicals are in a form of vinyl

104
structures which form short chain grafts and demonstrate hydrophilic function at
the tested concentrations.

105
Chapter 7
General conclusions and future
work
7.1 General conclusions
The potential of polyester as a possible substitute to cotton fiber was motivated by
the available literature already surveyed. The global fiber market survey indicates
that the future of cotton fiber supply, against the growing demand is
unpredictable. Meanwhile, consumer surveys indicate a large preference towards
cotton, in many countries. Global cotton fiber demand for 2017/2018 was
projected to increase by 5% to 120.4 million bales, compared to 2016/2017
figures. Through available literature, it was also noted that polyester currently
dominates the global fiber market share at about 60%, against cotton’s share of
about 30%, which was about 80% in the 1980’s. A further projection is that
polyester will peak to about 70% in 2025, against cotton’s global share of about
21%. Meanwhile, polyester trades the largest in global synthetic fiber market,
which peaked at 82% in 2015 and currently at about 80%. These statistics portray
abundance of polyester fiber on a global scale. However, available literature also
suggests that polyester has inadequate preference and usage in conventional
apparel. Polyester and cotton have been compared for ecological sustainability.
Researchers have argued against conventional cotton production, processing and
handling; which poses strong bearing on ecological footprints. Moreover,
polyester is also well priced compared to cotton. Through experimental studies
and consumer surveys, inferior sensory properties, mass and heat transfer
properties (moisture and thermal behavior) have largely been argued for the low
exclusive use of polyester in apparel.
Therefore, this research explored the sensory and moisture properties of polyester
and cotton fabrics. Sensory analysis of cotton and polyester woven fabrics was
used to quantitatively determine and reduce the gap between the two fiber
generics.
Using a sensory panel data, the largest dissimilarity was found between fabrics of
dissimilar generic. The descriptor crisp was found to account for the highest

106
variability between PET and cotton fabrics (p≤0.05). Crisp, was strongly
associated with descriptor stiff. Hence, towards cotton replacement via this
sensory approach, the modification of stiffness of polyester woven fabrics has
been judiciously suggested. For the fabrics studied, sensory perception can be
expressed via vision and touch, and that PET and cotton fabrics can be
distinguished by appearance via vision. Important to note is also the superiority of
intelligent computing in rank aggregation methods.
The use of NaOH and an amino-functional polysiloxane softener, with
atmospheric air plasma pre-oxidation, to modify the stiffness of polyester was
attempted. NaOH and softening treatment of polyester bridged between cotton
and polyester woven fabrics studied. NaOH and softening treatment on PET
fabrics yield fabrics perceived soft, smooth, less crisp, and less stiff compared to
untreated polyester fabrics. However, cotton fabrics are perceived natural
compared to any treated polyester fabrics. NaOH-treatment on polyester fabrics
enhance air permeability and hydrophilicity, although it induces loss in weight—
accompanied with loss in abrasion resistance and bursting strength. NaOH-treated
polyester fabrics become hydrophobic and less air-permeable when treated with a
silicon based softener. It is deduced that characterization by human perception can
play a vital role in human centered production and processing of fabrics. A better
understanding of fabric sensory perceptions was realized by integrating sensory
analysis data with objective measurements data.
The sensory study of knitted fabrics indicates that fiber content, the knitted fabric
structure and physical properties influence the sensory perception of knitted
fabrics. Perceived sensory attributes of knitted fabrics were found to mostly
correlate with the stitch density and thickness. The sensory perception of knitted
fabrics was noted to be distinct from that of woven fabrics. However, similar to
woven fabrics, the visual and hand attributes were found to dominate in
differentiating between polyester and cotton knitted fabrics. Towards the
replacement of cotton fiber with polyester, the modification (increase) in the
stiffness or drape of PET knitted fabrics has been suggested.
Comparing instrunmental measurement and subjectiveevaluation of sensory
attributes, this study noted that only a few sensory attributes were precisely
expressed by instrumental measurements. Particularly, hand attributes were more
expressed by fabric mechanical and surface measurements. It is deduced that
human perception cannot be directly represented by instrumental measurements.
The profiling of fabrics indicates that conventional PET fabrics can be
distinguished from conventional cotton fabrics using selected subjective and
objective attributes.
The hydrophilic activity of two vinyl monomers Poly-(ethylene glycol) diacrylate
(PEGDA) and [2-(methacryloyloxy) ethyl]-trimethylammonium chloride
(METAC), on PET was studied. Grafting polymerization was carried out with
UV, using a radical photo initiator 2-hydroxy-2-methyl-1-phenyl-1-propanone
(HMPP). Water contact angle (WCA) measurements and dynamic moisture

107
management tests (MMT) indicate that PEGDA and METAC induce complete
wetting of PET at concentrations 0.1-5% (v:v). The grafted PET fabrics remain
hydrophilic following testing using washing and rubbing fastness tests. PEGDA
grafted fabrics perform better, as static water contact angles of METAC grafted
fabrics increase after washing. Colorimetric measurements (K/S and
CIELAB/CH) and color fastness tests on dyed PET fabrics suggest that both
monomers significantly improve the dyeing efficacy of PET. The grafting of
PEGDA and METAC enhanced the color strength of PET fabric dyed with a
disperse dye. Grafted PET fabrics presented stronger fastness properties,
compared to the reference PET fabric. The hand and appearance of grafted PET
fabrics remained largely unchanged, following drycleaning and laundering tests.
The potential of PEGDA and METAC for a hydrophilic function in conventional
textiles utilizing UV grafting has therefore been demonstrated. It is suggested that
PEGDA and METAC generate hydrophilic radicals/groups on PET; the
macroradicals are in a form of vinyl structures which form short chain grafts and
demonstrate hydrophilic function at the tested concentrations.
These studies demonstrate the potential to functionalize PET woven fabrics using
the studied methods. Physiochemical and performance studies indicate that, with
controlled processing parameters, optimal products with enhanced moisture
management and improved sensory perception can be obtained.
7.3 Recommendations for future work
As the study ensued, some presented elements were identified for further
improvement.
The sample selection wasn’t based on a uniform structure and pattern of fabrics. A
future study could consider a set of plain weave fabrics, twill fabrics, or still
uniform weave density, fabric weight and yarn linear density. In this case, the
main varying parameter would be fiber content. In the same vein, more blended
fabrics could be considered, unlike in this study, where one blended woven fabric
was considered. This would give a view on effect of cotton/polyester blend ratios
on sensory perception.
In this study, all sensory evaluation panelists had at least some background
knowledge of textiles and clothing attributes. This could pose potential emergence
of bias as professionals and novices could easily recognize and profile some
fabrics. Although training was carried out, in a future study, panelists could be
pooled from a general population without such prior knowledge of products being
evaluated.
The sensory evaluation utilized only one session. However, it is recommended
that a future study does consider two sessions, and average values obtained. Also,
through the available literature, the use of rank-based evaluation has some
limitations; it is not possible to precisely estimate magnitudes and differences in
perception for sensory attributes, between different samples. The use of score
based scales would offer such estimates. Further, the sensory evaluation of woven
fabrics and knitted fabrics in the same experiment could give an interesting
dimension, instead of different sets of sensory panels for the two different fabric
structures.

108
To arrive at some findings and conclusions, this study involved longer
computations such that errors are likely. Some soft computing approaches such as
fuzzy computing might lend credence in reducing these stages.
This study mainly considered fabric modification through chemical treatments
and surface photo-grafting. The sensory functionalization of PET fabrics could
also be considered on the point of view of polymerization, fiber spinning stages,
yarn modification (e.g during staple spinning, blending and texturizing) and fabric
structures.
Due to limitations in the scope of study, the sensory functionalization of knitted
fabrics was not undertaken. A future study could consider this gap so as to
compare approaches for knitted and woven fabrics.
The hydrophilic enhancement of PET fabrics through surface grafting could
consider further studies on:
- Effect of different photo-initiators
- Efficacy of other grafting approaches e.g evaporative
- Effect of other hydrophilic monomers
- Performance properties of grafted PET fabrics e.g physical, mechanical,
comfort and aesthetics; and sensory evaluation of grafted fabrics
- Cationic or ionic dyeing of grafted PET fabric as the fabric surface is
modified
- Antimicrobial activity of METAC

109
References
1. Arthur F. Cotton Demand to Hit All-Time High, Prices Stabilize Amid
China Tariffs. Sourcing Journal, 2018https://sourcingjournal.com/market-
data/cotton-data/cotton-prices-2-114107/ (2018).
2. Oerlikon Textile. The Fiber Year 2015. A World Survey on Textile and
Nonwovens Industry. Arbon, 2015.
3. Mills J. Polyester & Cotton: Unequal Competitors. Tecnon OrbiChem
presentation. In: Association Française Cotonnière (AFCOT).
Deauvillehttps://www.afcot.org/l-afcot/ (2011).
4. Oerlikon Textile. The Fiber Year 2014. A World Survey on Textile and
Nonwovens Industry. Arbon, 2014.
5. Johnson J, Macdonald S, Meyer L, et al. The world and United States
cotton outlook. 2014.
6. ICTSD. Cotton: Trends in Global Production, Trade and Policy;
Information Note. Geneva, 2013.
7. USDA Economic Research Service. Consumption exceeding production in
the global cotton industry for second consecutive year. Washington
DChttps://www.ers.usda.gov/data-products/chart-gallery/gallery/chart-
detail/?chartId=82597 (2017).
8. USDA Economic Research Service. World cotton mill use is forecast to
reach a new record in 2018/19. Washington DC, 2018.
9. Fibre2Fashion. World cotton mill use is forecast to reach a new record in
2018/19. Fashion Network,
2018http://us.fashionnetwork.com/news/Global-cotton-consumption-rising-
in-2017-18,969053.html#.W65ONM4zZdh (2018).
10. Laijiu Z, Shin-ichi K, Huawu L, et al. Study on the Pore Structure of
Cotton-Like Polyester Knitted Fabrics. Adv Mater Res 2013; 821–822:
270–273.
11. Musale RM, Shukla SR. Weight reduction of polyester fabric using sodium
hydroxide solutions with additives cetyltrimethylammonium bromide and
[BMIM]Cl. J Text Inst; 108. Epub ahead of print 2017. DOI:
10.1080/00405000.2016.1171029.
12. Plastina A. Revisiting the Relationship between Cotton, Polyester and Oil
Prices. Cotton: Review of the World Situation, 2010, pp. 12–14.
13. Salfino C. Cotton Clothing Among Consumers’ Favorite Things. Sourcing
Journal, 2015https://sourcingjournal.com/topics/lifestyle-monitor/cotton-
clothing-among-consumers-favorite-things-salfino-28747/ (2015).
14. Delta FarmPress. Global survey reveals consumers prefer cotton.
FarmProgress.
15. Terhaar A. COTTON VERSUS SYNTHETICS – THE CONSUMER
PERSPECTIVE. In: 31st International Cotton Conference.
Bremenhttps://baumwollboerse.de/konferenz/vortraege/ (2012).
16. Udale J. Textiles And Fashion. Elsevier. Epub ahead of print 2008. DOI:
10.1016/B978-1-84569-931-4.00028-3.
17. Saricam C, Kalaoglu F, Ozduygu YS, et al. Apparel product evaluation and
quality perception of turkish consumers. In: International Conference:
Textiles & Fashion. 2012.

110
18. Muthu SS. Handbook of Life Cycle Assessment (LCA) of Textiles and
Clothing. 2015.
19. Van Der Velden NM, Patel MK, Vogtländer JG. LCA benchmarking study
on textiles made of cotton, polyester, nylon, acryl, or elastane. Int J Life
Cycle Assess 2014; 19: 331–356.
20. Rana S, Karunamoorthy S, Parveen S, et al. Life cycle assessment of cotton
textiles and clothing. In: Handbook of Life Cycle Assessment (LCA) of
Textiles and Clothing. 2015, pp. 195–216.
21. Kalliala EM, Nousiainen P. Environmental profile of cotton and polyester-
cotton fabrics. Autex Res J 1999; 1: 8–20.
22. Yamashita H, Nakano Y. Polyester: Properties, Preparation and
Applications. 2009.
23. Venkatachalam S, G. S, V. J, et al. Degradation and Recyclability of Poly
(Ethylene Terephthalate). In: Polyester. 2012. Epub ahead of print 2012.
DOI: 10.5772/48612.
24. Kamalha E, Zeng Y, Mwasiagi JI, et al. The Comfort Dimension; a Review
of Perception in Clothing. J Sens Stud 2013; 28: 423–444.
25. Butola BS. Advances in functional finishes for polyester and polyamide-
based textiles. In: Polyesters and Polyamides. 2008, pp. 325–353.
26. East AJ. Polyester fibres. In: Synthetic Fibres: Nylon, Polyester, Acrylic,
Polyolefin. 2004, pp. 95–166.
27. Kamalha E, Koehl L, Campagne C. Classification and measure of
quantitative difference between polyester and cotton fabrics based on
sensory analysis. In: Uncertainty Modelling in Knowledge Engineering and
Decision Making - Proceedings of the 12th International FLINS
Conference, FLINS 2016. 2016. Epub ahead of print 2016. DOI:
10.1142/9789813146976_0158.
28. Sülara V, Öner E, Okur A. Roughness and frictional properties of cotton
and polyester woven fabrics. Indian J Fibre Text Res 2013; 38: 349–356.
29. Leroux F, Perwuelz A, Campagne C, et al. Atmospheric air-plasma
treatments of polyester textile structures. J Adhes Sci Technol 2006; 20:
939–957.
30. Sanders EM, Zeronian SH. An analysis of the moisture‐ related properties
of hydrolyzed polyester. J Appl Polym Sci 1982; 27: 4477–4491.
31. Norum PS, Ha-Brookshire JE. Consumer Trade-Off Analysis and Market
Share Estimation for Selected Socially Responsible Product Attributes for
Cotton Apparel. Cloth Text Res J 2011; 29: 348–362.
32. Kamalha E, Zeng Y, Kyatuhaire S, et al. The comfort dimension in
clothing; A review of perception in clothing. J Sens Stud 2013; 28: 423–
444.
33. Gupta D, Chaudhary H, Gupta C. Topographical changes in polyester after
chemical, physical and enzymatic hydrolysis. J Text Inst 2015; 106: 690–
698.
34. Deopura BL, Alagirusamy R, Joshi M, et al. Polyesters and Polyamides.
2008. Epub ahead of print 2008. DOI: 10.1533/9781845694609.
35. Dave J, Kumar R, Srivastava HC. Studies on modification of polyester
fabrics I: Alkaline hydrolysis. J Appl Polym Sci 1987; 33: 455–477.
36. Mousazadegan F, Saharkhiz S, Maroufi M. Weight reduction of microfibre
polyester fabric and the effect on its physical and mechanical properties. J
Text Inst 2010; 101: 716–728.
37. Zeronian SH, Collins MJ. Surface modification of polyester by alkaline

111
treatments. Text Prog 1989; 20: 1–26.
38. Latta BM. Improved Tactile and Sorption Properties of Polyester Fabrics
Through Caustic Treatment. Text Res J 1984; 54: 766–775.
39. Ibrahim NA. Effect of alkali on selected properties of PET fabric. Am Dyest
Report; 79.
40. Teli MD. Softening finishes for textiles and clothing. In: Functional
Finishes for Textiles: Improving Comfort, Performance and Protection.
2014, pp. 123–152.
41. Hou A, Chen B, Zhang K. The effects of functional polysiloxane resins on
the color gamut and color yield of dyed polyester. Color Res Appl 2012;
37: 72–75.
42. Hou A, Chen H, Xie K. Effect of functional polysiloxanes modified with
perfluorocarbon groups on the color of dyed cellulose fiber. In: ICAFPM
2009 - Proceedings of 2009 International Conference on Advanced Fibers
and Polymer Materials. 2009.
43. Sahin U, Cimilli Duru S. Effects of softener applications on air and water
vapor permeability of cotton knitted fabrics produced with different yarns.
Tekst ve Konfeksiyon 2017; 25: 275–282.
44. Schindler WD, Hauser PJ. Chemical Finishing of Textiles. 2004. Epub
ahead of print 2004. DOI: 10.1533/9781845690373.
45. Leroux F, Perwuelz A, Campagne C, et al. Atmospheric air-plasma
treatments of polyester textile structures. J Adhes Sci Technol 2006; 20:
939–957.
46. Takke V, Behary N, Perwuelz A, et al. Studies on the atmospheric air-
plasma treatment of pet (polyethylene terephtalate) woven fabrics: Effect of
process parameters and of aging. J Appl Polym Sci 2009; 114: 348–357.
47. Chaudhary AK, Beckman EJ, Russell AJ. Enzymes for Polyester Synthesis.
1998.
48. Wei R, Oeser T, Zimmermann W. Synthetic polyester-hydrolyzing
enzymes from thermophilic actinomycetes. Adv Appl Microbiol 2014; 89:
267–305.
49. Haernvall K, Zitzenbacher S, Wallig K, et al. Hydrolysis of Ionic Phthalic
Acid Based Polyesters by Wastewater Microorganisms and Their Enzymes.
Environ Sci Technol 2017; 51: 4596–4605.
50. Hseih, YL, Hartzell, MM, Clarkson, KA, Kollier, KDM, Graycar T, &
Larenas E. Enzyme treatment to enhance wettability and absorbency of
textiles. US 6066494 A.
51. El-Shemy NS, El-Hawary NS, El-Sayed H. Basic and Reactive-Dyeable
Polyester Fabrics Using Lipase Enzymes. J Chem Eng Process Technol;
07. Epub ahead of print 2015. DOI: 10.4172/2157-7048.1000271.
52. Yelin ER, Hendrix EJ, Villiers FR. POLYESTER MODIFICATION WITH
AN OXIDIZING CHEMICAL. 3,837,798, USA: UNITED STATES
PATENTS, 1974.
53. Haiwen M, Gaoming J, Xuhong M, et al. Post-treatment and evaluation of
polyester filament cotton-like fabric. Fibers Polym 2016; 17: 1735–1740.
54. Farkas E, Meszena ZG, Toldy A, et al. Polymer Degradation and Stability.
Polym Degrad Stab 2008; 93: 1205–1213.
55. Shanmugharaj AM, Kim JK, Ryu SH. Modification of rubber surface by
UV surface grafting. Appl Surf Sci 2006; 252: 5714–5722.
56. Fouassier JP, Allonas X, Burget D. Photopolymerization reactions under
visible lights: Principle, mechanisms and examples of applications.

112
Progress in Organic Coatings 2003; 47: 16–36.
57. Xiao P, Zhang J, Dumur F, et al. Visible light sensitive photoinitiating
systems: Recent progress in cationic and radical photopolymerization
reactions under soft conditions. Prog Polym Sci 2015; 41: 32–66.
58. Blok AJ, Chhasatia R, Dilag J, et al. Surface initiated polydopamine grafted
poly([2-(methacryoyloxy)ethyl]trimethylammonium chloride) coatings to
produce reverse osmosis desalination membranes with anti-biofouling
properties. J Memb Sci 2014; 468: 216–223.
59. Wang P, Tan KL, Kang ET. Surface modification of
poly(tetrafluoroethylene) films via grafting of poly(ethylene glycol) for
reduction in protein adsorption. J Biomater Sci Polym Ed 2000; 11: 169–
186.
60. Zhang MC, Kang ET, Neoh KG, et al. Consecutive graft copolymerization
of glycidyl methacrylate and aniline on poly(tetrafluoroethylene) films.
Langmuir 2000; 16: 9666–9672.
61. Kim HY, Ryu JH, Chu CW, et al. Paclitaxel-incorporated nanoparticles
using block copolymers composed of poly(ethylene glycol)/poly(3-
hydroxyoctanoate). Nanoscale Res Lett 2014; 9: 525.
62. Neugebauer D. Graft copolymers with poly(ethylene oxide) segments.
Polym Int 2007; 56: 1469–1498.
63. Goel NK, Rao MS, Kumar V, et al. Synthesis of antibacterial cotton fabric
by radiation-induced grafting of [2-
(Methacryloyloxy)ethyl]trimethylammonium chloride (MAETC) onto
cotton. Radiat Phys Chem 2009; 78: 399–406.
64. Uchida E, Uyama Y, Ikada Y. Antistatic Properties of Surface-Modified
Polyester Fabrics. Text Res J 1991; 61: 483–488.
65. Zellander A, Kadakia-Bhasin a, Mahksous M, et al. Mechanical Diversity
of Porous Poly (Ethylene Glycol) Diacrylate. Adv Biomed Eng Res 2013; 1:
9–15.
66. Kwak NS, Yang JR, Hwang CW, et al. The effect of a molecular weight
and an amount of PEGDA (poly(ethylene glycol)diacrylate) on a
preparation of sodium methallyl sulfonate-co-PEGDA microspheres and
sorption behavior of Co(II). Chem Eng J 2013; 223: 216–223.
67. Song M-K, Cho J-Y, Cho BW, et al. Characterization of UV-cured gel
polymer electrolytes for rechargeable lithium batteries. J Power Sources
2002; 110: 209–215.
68. Wang S, Konduri MKR, Hou Q, et al. Cationic xylan-METAC copolymer
as a flocculant for clay suspensions. RSC Adv; 6. Epub ahead of print 2016.
DOI: 10.1039/c6ra05223a.
69. Chowdhury P, Mondal P, Roy K. Synthesis of cross-linked graft copolymer
from [2-(methacryloyloxy)ethyl] trimethylammonium chloride and
poly(vinyl alcohol) for removing chromium(VI) from aqueous solution.
Polym Bull 2010; 64: 351–362.
70. De Klerk HM, Lubbe S. Female consumers’ evaluation of apparel quality:
exploring the importance of aesthetics. J Fash Mark Manag 2008; 12: 36–
50.
71. Kamalha E, Koehl L, Campagne C. CLASSIFICATION AND MEASURE
OF QUANTITATIVE DIFFERENCE BETWEEN POLYESTER AND
COTTON FABRICS BASED ON SENSORY ANALYSIS. In: Zeng X, Lu
J, Kerre E, et al. (eds) Uncertainty Modelling in Knowledge Engineering
and Decision Making (FLINS 2016). Roubaix: World Scientific, 2016, pp.
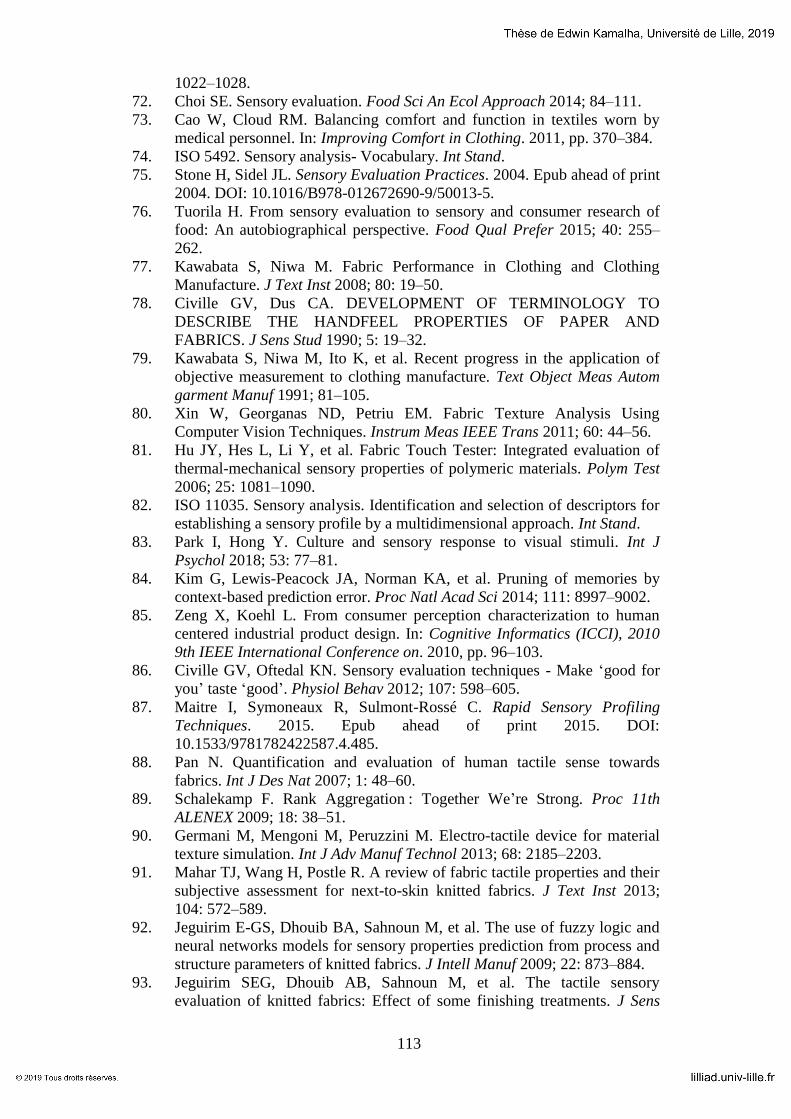
113
1022–1028.
72. Choi SE. Sensory evaluation. Food Sci An Ecol Approach 2014; 84–111.
73. Cao W, Cloud RM. Balancing comfort and function in textiles worn by
medical personnel. In: Improving Comfort in Clothing. 2011, pp. 370–384.
74. ISO 5492. Sensory analysis- Vocabulary. Int Stand.
75. Stone H, Sidel JL. Sensory Evaluation Practices. 2004. Epub ahead of print
2004. DOI: 10.1016/B978-012672690-9/50013-5.
76. Tuorila H. From sensory evaluation to sensory and consumer research of
food: An autobiographical perspective. Food Qual Prefer 2015; 40: 255–
262.
77. Kawabata S, Niwa M. Fabric Performance in Clothing and Clothing
Manufacture. J Text Inst 2008; 80: 19–50.
78. Civille GV, Dus CA. DEVELOPMENT OF TERMINOLOGY TO
DESCRIBE THE HANDFEEL PROPERTIES OF PAPER AND
FABRICS. J Sens Stud 1990; 5: 19–32.
79. Kawabata S, Niwa M, Ito K, et al. Recent progress in the application of
objective measurement to clothing manufacture. Text Object Meas Autom
garment Manuf 1991; 81–105.
80. Xin W, Georganas ND, Petriu EM. Fabric Texture Analysis Using
Computer Vision Techniques. Instrum Meas IEEE Trans 2011; 60: 44–56.
81. Hu JY, Hes L, Li Y, et al. Fabric Touch Tester: Integrated evaluation of
thermal-mechanical sensory properties of polymeric materials. Polym Test
2006; 25: 1081–1090.
82. ISO 11035. Sensory analysis. Identification and selection of descriptors for
establishing a sensory profile by a multidimensional approach. Int Stand.
83. Park I, Hong Y. Culture and sensory response to visual stimuli. Int J
Psychol 2018; 53: 77–81.
84. Kim G, Lewis-Peacock JA, Norman KA, et al. Pruning of memories by
context-based prediction error. Proc Natl Acad Sci 2014; 111: 8997–9002.
85. Zeng X, Koehl L. From consumer perception characterization to human
centered industrial product design. In: Cognitive Informatics (ICCI), 2010
9th IEEE International Conference on. 2010, pp. 96–103.
86. Civille GV, Oftedal KN. Sensory evaluation techniques - Make ‘good for
you’ taste ‘good’. Physiol Behav 2012; 107: 598–605.
87. Maitre I, Symoneaux R, Sulmont-Rossé C. Rapid Sensory Profiling
Techniques. 2015. Epub ahead of print 2015. DOI:
10.1533/9781782422587.4.485.
88. Pan N. Quantification and evaluation of human tactile sense towards
fabrics. Int J Des Nat 2007; 1: 48–60.
89. Schalekamp F. Rank Aggregation : Together We’re Strong. Proc 11th
ALENEX 2009; 18: 38–51.
90. Germani M, Mengoni M, Peruzzini M. Electro-tactile device for material
texture simulation. Int J Adv Manuf Technol 2013; 68: 2185–2203.
91. Mahar TJ, Wang H, Postle R. A review of fabric tactile properties and their
subjective assessment for next-to-skin knitted fabrics. J Text Inst 2013;
104: 572–589.
92. Jeguirim E-GS, Dhouib BA, Sahnoun M, et al. The use of fuzzy logic and
neural networks models for sensory properties prediction from process and
structure parameters of knitted fabrics. J Intell Manuf 2009; 22: 873–884.
93. Jeguirim SEG, Dhouib AB, Sahnoun M, et al. The tactile sensory
evaluation of knitted fabrics: Effect of some finishing treatments. J Sens
114
Stud 2010; 25: 201–215.
94. El-ghezal Jeguirim S, Dhouib AB, Sahnoun M, et al. The use of fuzzy logic
and neural networks models for sensory properties prediction from process
and structure parameters of knitted fabrics. J Intell Manuf 2011; 22: 873–
884.
95. Park S, Yun C, Kim J, et al. The effects of the fabric properties on fabric
movement and the prediction of the fabric movements in a front-loading
washer. Text Res J 2013; 83: 1201–1212.
96. Lundahl DS, Mcdaniel MR. INFLUENCE OF PANEL INCONSISTENCY
ON THE OUTCOME OF SENSORY EVALUATIONS FROM
DESCRIPTIVE PANELS. J Sens Stud 1991; 6: 145–157.
97. Anzanello MJ, Fogliatto FS, Rossini K. Data mining-based method for
identifying discriminant attributes in sensory profiling. Food Qual Prefer
2011; 22: 139–148.
98. Lundahl DS, Mcdaniel MR. THE PANELIST EFFECT - FIXED OR
RANDOM? J Sens Stud 1988; 3: 113–121.
99. Kermit M, Lengard V. Assessing the Performance of a Sensory Panel -
Panelist monitoring and tracking. J Chemom 2005; 19: 154–161.
100. Abdi H, Williams LJ. Principal component analysis. Wiley
Interdisciplinary Reviews: Computational Statistics 2010; 2: 433–459.
101. Bro R, Smilde AK. Principal component analysis. Anal Methods 2014; 6:
2812.
102. Kamalha E, Kiberu J, Nibikora I, et al. Clustering and Classification of
Cotton Lint Using Principle Component Analysis, Agglomerative
Hierarchical Clustering, and K-Means Clustering. J Nat Fibers. Epub ahead
of print 2017. DOI: 10.1080/15440478.2017.1340220.
103. Shlens J. A Tutorial on Principal Component Analysis. Tutorial, Salk Inst
2009; 1–12.
104. Bouguettaya A, Yu Q, Liu X, et al. Efficient agglomerative hierarchical
clustering. Expert Syst Appl 2015; 42: 2785–2797.
105. Addinsoft. Principal component analysis (PCA) in Excel |
XLSTAThttps://help.xlstat.com/customer/en/portal/articles/2062222-
principal-component-analysis-in-excel-pca-tutorial (2016, accessed 3 June
2017).
106. ISO 139. Textiles -- Standard atmospheres for conditioning and testing. Int
Stand.
107. Society of Sensory Professionals. Free Choice
Profilinghttps://www.sensorysociety.org/knowledge/sspwiki/Pages/Free
Choice Profiling.aspx (2014, accessed 3 May 2016).
108. Rajkumar A, Agarwal S. A Statistical Convergence Perspective of
Algorithms for Rank Aggregation from Pairwise Data. Proc 31st Int Conf
… 2014; 32: 9.
109. Pihur V, Datta S, Datta S. RankAggreg, an R package for weighted rank
aggregation. BMC Bioinformatics 2009; 10: 62.
110. Pihur V, Datta S, Datta S. Weighted rank aggregation of cluster validation
measures: A Monte Carlo cross-entropy approach. In: Bioinformatics.
2007, pp. 1607–1615.
111. Lin S, Ding J. Integration of ranked lists via cross entropy Monte Carlo
with applications to mRNA and microRNA studies. Biometrics 2009; 65:
9–18.
112. Didehvar F, Eslahchi C. An algorithm for rank aggregation problem. Appl
115
Math Comput 2007; 189: 1847–1858.
113. Klementiev A, Roth D, Small K. Unsupervised rank aggregation with
distance-based models. Icml2008 2008; 472–479.
114. Kassambara A. Practical Guide to Principal Component Methods in R.
Princ Compon methods R Pract
Guidhttp://www.analyticsvidhya.com/blog/2016/03/practical-guide-
principal-component-analysis-python/ (2017).
115. STDHA. Principal Component Analysis: How to reveal the most important
variables in your data? - R software and data
mininghttp://www.sthda.com/english/wiki/print.php?id=204 (2016,
accessed 2 February 2016).
116. Addinsoft. Agglomerative Hierarchical Clustering (AHC) | statistical
software for
Excelhttps://www.xlstat.com/en/solutions/features/agglomerative-
hierarchical-clustering-ahc (2015, accessed 3 May 2017).
117. Dwork C, Kumar R, Naor M, et al. Rank aggregation methods for the Web.
Proc 10th Int Conf World Wide Web 2001; 613–622.
118. Renda ME, Straccia U. Web Metasearch: Rank vs. Score Based Rank
Aggregation Methods. Proc 2003 ACM Symp Appl Comput - SAC ’03
2003; 841–846.
119. Xue Z, Zeng X, Koehl L, et al. Interpretation of Fabric Tactile Perceptions
through Visual Features for Textile Products. J Sens Stud 2016; 31: 143–
162.
120. Varela P, Chen J, Fiszman S, et al. Crispness assessment of roasted
almonds by an integrated approach to texture description: Texture,
acoustics, sensory and structure. J Chemom 2006; 20: 311–320.
121. Roudaut G, Dacremont C, Vallès Pàmies B, et al. Crispness: A critical
review on sensory and material science approaches. Trends in Food
Science and Technology 2002; 13: 217–227.
122. Vincent JFV. The quantification of crispness. J Sci Food Agric 1998; 78:
162–168.
123. SZCZESNIAK AS. THE MEANING OF TEXTURAL
CHARACTERISTICS ‐ CRISPNESS. J Texture Stud 1988; 19: 51–59.
124. Chowdhury KP. Effect of Special Finishes on the Functional Properties of
Cotton Fabrics. J Text Sci Technol 2018; 04: 49–66.
125. De Boos AG, Tester DH, De Boos AG, et al. SiroFast, Fabric Assurance
by Simple Testing : a system for fabric objective measurement and its
application in fabric and garment manufacture. CSIRO Division of Wool
Technologyhttps://catalogue.nla.gov.au/Record/290180 (1997, accessed 18
June 2018).
126. Shanmugasundaram OL. Objective measurement techniques for fabrics.
Asian Text J 2008; 17: 63–67.
127. BSI. BS 3356:1990 Method for determination of bending length and
flexural rigidity of fabrics. BSI. Epub ahead of print 1990. DOI:
10.3403/00220852U.
128. ASTM International. ASTM D1388 - 14e1 Standard Test Method for
Stiffness of Fabrics. ASTM Annual Book of Standards. Epub ahead of print
2014. DOI: 10.1520/D1388-14E01.
129. De Oliveira RRL, Albuquerque DAC, Cruz TGS, et al. Atomic Force
Microscopy - Imaging, Measuring and Manipulating Surfaces at the
Atomic Scale. InTech 2012; 147–174.

116
130. ASTM International. ASTM D3776 / D3776M - 09a(2017) Standard Test
Methods for Mass Per Unit Area (Weight) of Fabric. ASTM Annual Book of
Standards. Epub ahead of print 2017. DOI: 10.1520/D3776_D3776M-
09AR17.
131. ASTM International. ASTM D1777 - 96(2015) Standard Test Method for
Thickness of Textile Materials. ASTM Annual Book of Standards. Epub
ahead of print 2015. DOI: 10.1520/D1777-96R15.
132. ASTM International. ASTM D4966 - 12(2016) Standard Test Method for
Abrasion Resistance of Textile Fabrics (Martindale Abrasion Tester
Method). ASTM Annual Book of Standards. Epub ahead of print 2016.
DOI: 10.1520/D4966-12R16.
133. ASTM International. ASTM D737 - 04(2012) Standard Test Method for
Air Permeability of Textile Fabrics. ASTM Annual Book of Standards.
Epub ahead of print 2012. DOI: 10.1520/D0737-04R12.
134. Jin Lee J, Sun Ji D. Evaluation of liquid moisture management properties
on hemp woven fabrics treated with liquid ammonia. Text Res J 2017; 87:
1752–1764.
135. AATCC American Association of Textile Chemists and Colorists AATCC.
AATCC - Technical Manual. 2015.
136. American Association of Textile Chemists and Colorists (AATCC).
AATCC 195 : Liquid Moisture Management Properties of Textile
Fabricshttps://global.ihs.com/doc_detail.cfm?document_name=AATCC
195 (2011, accessed 19 July 2016).
137. Kamalha E, Ferri A, Monica P, et al. UV assisted radical graft
polymerization on poly-(ethylene terephthalate) for hydrophilic
functionality. In: AATCC 2017 - 2017 AATCC International Conference
Proceedings. 2017.
138. Donegan M, Milosavljević V, Dowling DP. Activation of PET using an RF
atmospheric plasma system. Plasma Chem Plasma Process 2013; 33: 941–
957.
139. Gorrafa AAM. Caustic Treatment of Polyester Filament Fabrics.:
Discovery Service for Soochow Univ. Text Chem Color 1980; 12: 33–37.
140. Datye K V., Palan BH. Effect of alkali on filaments of poly(ethylene
terephthalate) and its copolyesters. J Appl Polym Sci 1989; 38: 1447–1468.
141. Haghighat KM, Youscfi M. Alkaline Hydrolysis of Polyester Fibers -
StructuralHaghighat, K. M., & Youscfi, M. (1992). Alkaline Hydrolysis of
Polyester Fibers - Structural Effects. Iranian Journal of Polymer Science
Science and Technology, 1(2), 56–61. Effects. Iran J Polym Sci Sci
Technol 1992; 1: 56–61.
142. Zeronian SH, Wang HZZ, Alger KW. Further studies on the moisture-
related properties of hydrolyzed poly(ethylene terephthalate). J Appl Polym
Sci 1990; 41: 527–534.
143. Djonlagic J, Nikolic MS. Biodegradable Polyesters: Synthesis and Physical
Properties. In: A Handbook of Applied Biopolymer Technology: Synthesis,
Degradation and Application, pp. 149–196.
144. Ravens DAS, Ward IM. Chemical reactivity of polyethylene terephthalate.
Hydrolysis and esterification reactions in the solid phase. Trans Faraday
Soc 1961; 57: 150–159.
145. Alaa Arafa B. Performance of Knitted Fabrics Finished With Different
Silicone Softeners. J Eng Fiber Fabr 2018; 13: 47–59.
146. Parthiban M, Ramesh Kumar M. Effect of fabric softener on thermal

117
comfort of cotton and polyester fabrics. Indian J Fibre Text Res 2007; 32:
446–452.
147. Chinta SK, Gujar PD. SIGNIFICANCE OF MOISTURE MANAGEMENT
IN TEXTILES. Int J Innov Res Sci Eng Technol 2013; 2: 2104–2114.
148. Chinta SK, Gujar PD. Significance of Moisture Management for High
Performance Textile Fabrics. Int J Innov Res Sci Eng Technol 2013; 2:
814–819.
149. Narita H, Yoshimasa O. The change of end groups of polyester fiber by
caustic treatment. Fiber 1988; 44: 137–141.
150. Shet RT, Zeronian SH, Needles HL, et al. Modification of Polyester and
Polyester/ Cotton by Alkali Treatment. Text Chem Color 1982; 14: 21–25.
151. Needles HL, Brook DB. How Alkali Treatments Affect Selected Properties
Of Polyester, Cotton and Polyester/Cotton Fabrics. Text Chem Color 1985;
17: 23–26.
152. Davies M, Amirbayat J. The effect of weight reduction on the performance
of a polyester fiber satin bending, shear, drape and drop. J Text Inst 1992;
85: 376–382.
153. Soon L., Seon R. Alkaline softening of polyester fabrics treated with
aqueous NaOH solutions containing CTAB & EDA. In: Proceedings of 3rd
Asian Textile Conference, 1. 1995, pp. 256–261.
154. Zeronian S., Collins M. Improving the comfort of polyester fabrics. Text
Chem Color 1988; 20: 25–28.
155. Shenai V., Nayak N. Action of alkali on polyester fibres. Text Asia 1982;
13: 59.
156. Shenai V., Nayak N. Silk like polyesters. Text Asia 1982; 13: 59–60.
157. Ravens DAS, Ward IM. Chemical reactivity of polyethylene terephthalate.
Hydrolysis and esterification reactions in the solid phase. Trans Faraday
Soc. Epub ahead of print 1961. DOI: 10.1039/TF9615700150.
158. Waters E. The dyeing of terylene polyester fibre. J Soc Dye Color 1950;
66: 609–615.
159. Kuriki T, Kamide K. Changes in Supermolecular structure and dyeability
of PET fibres dyeable under atmospheric pressure during treatment in
aqueous sodium hydroxide. J.ournal Text Mach Soc Japan 1985; 38: 201–
207.
160. British Standard Institute (BSI). BS 5058:1973. Method for the assessment
of drape of fabrics. BS 5058:1973,
UKhttps://www.techstreet.com/standards/bs-5058-
1973?product_id=1103265#product (1973).
161. Kenkare N, May-plumlee T. Fabric Drape Measurement: A Modified
Method Using Digital Image Processing. J Text Apparel, Technol Manag
2005; 4: 1–8.
162. Kown ES., Yoon SY., Sul IH., et al. A quantitative fabric drape evaluation
system using image-processing technology, Part 2: Effect of fabric
properties on drape parameters. J Test Eval;
38https://www.scopus.com/inward/record.uri?eid=2-s2.0-
77953400920&partnerID=40&md5=d77779faf2ba600024210a31133e1928
(2010).
163. Choudhary AK, Bansal P. Drape measurement technique using manikins
with the help of image analysis. In: Manikins for Textile Evaluation. 2017,
pp. 173–195.
164. Robson D, Long CC. Drape analysis using imaging techniques. Cloth Text

118
Res J 2000; 18: 1–8.
165. Behery HM. Effect of mechanical and physical properties on fabric hand.
2005. Epub ahead of print 2005. DOI: 10.1533/9781845690984.
166. Behery HM. Effect of yarn factors on fabric hand. In: Effect of Mechanical
and Physical Properties on Fabric Hand. 2005, pp. 219–238.
167. Mäkinen M, Meinander H, Luible C, et al. Influence of Physical
Parameters on Fabric Hand. Proceeding HAPTEX ’05 Work Haptic Tactile
Percept Deform Objects 2005; 8–16.
168. Chen PL, Barker RL, Smith GW, et al. Handle of Weft Knit Fabrics. Text
Res J 1992; 62: 200–211.
169. Chu CC, Cummings CL, Teixeira NA. Mechanics of Elastic Performance
of Textile Materials: Part V: A Study of the Factors Affecting the Drape of
Fabrics—The Development of a Drape Meter. Text Res J 1950; 20: 539–
548.
170. Cusick G. he dependence of fabric drape on bending and shear stiffness.
ournal Text Inst 1965; 56: T596–T606.
171. Cusick G. The Measurement of Fabric Drape. J Text Inst 1968; 59: 253–
260.
172. Gaucher ML, King MW, Johnston B. Predicting the Drape Coefficient of
Knitted Fabrics. Text Res J 1983; 53: 297–303.
173. Sudnik Z. Objective measurement of fabric drape: Practical experience in
the laboratory. Text Inst Ind 1972; 10: 14–18.
174. Morooka H, Niwa M. Relation between Drape Coefficients and Mechanical
Properties of Fabrics. J Text Mach Soc Japan 1976; 22: 67–73.
175. Sanad R, Cassidy T. Fabric Objective Measurement and Drape. Text Prog
2016; 47: 317–406.
176. Kenkare N, May-plumlee T. Evaluation of drape characteristics in fabrics.
Int J Cloth Sci Technol 2005; 17: 109–123.
177. Ning P, Chengwei L a, Jun X b, et al. A New Method for Measuring Fabric
Drape with a Novel Parameter for Classifying Fabrics. Preprints 2018; 1–
32.
178. Collier BJ. Measurement of Fabric Drape and Its Relation to Fabric
Mechanical Properties and Subjective Evaluation. Cloth Text Res J 1991;
10: 46–52.
179. Chaudhary C. Prediction of drape coefficient by weaving parameters.
Maharaja Sayajirao University of Baroda (MSU), 1980.
180. Miyama M, Yang Y, Yasuda T, et al. Static and Dynamic Contact Angles
of Water on Polymeric Surfaces. Langmuir 1997; 13: 5494–5503.
181. Marmur A. Soft contact: measurement and interpretation of contact angles.
Soft Matter 2006; 2: 12–17.
182. Srinivasan S, McKinley GH, Cohen RE. Assessing the accuracy of contact
angle measurements for sessile drops on liquid-repellent surfaces.
Langmuir 2011; 27: 13582–13589.
183. Chang YY, Lin SY. Surface tension measurement of glass melts using
sessile or pendant drop methods. J Taiwan Inst Chem Eng 2011; 42: 922–
928.
184. Yuan ZF, Mukai K, Takagi K, et al. Surface tension and its temperature
coefficient of molten tin determined with the sessile drop method at
different oxygen partial pressures. J Colloid Interface Sci 2002; 254: 338–
345.
185. HunterLab. CIE L*C*h Color Scale. Insight Color.
119
186. Bullock L. Reflectance spectrophotometry for measurement of colour
change. Natl Gall Tech Bull 1978; 2: 49–55.
187. Hunter Laboratories. Measuring Color using Hunter L, a, b versus CIE
1976 L*a*b*. Hunt Lab. Epub ahead of print 2012. DOI:
10.1128/AEM.02997-13.
188. Schanda J. CIE Colorimetry. In: Colorimetry: Understanding the CIE
System. 2007, pp. 25–78.
189. British Standards. Textiles — Tests for colour fastness. Calc colour Differ
(ISO 2010; 3: 545–575.
190. ISO 105-C06. ISO Textiles - test for color fastness - part C06: Colour
Fastness to Domestic and Commercial Laundering. Int Organ Stand 2010;
2010: 1–11.
191. Bide M. Colour measurement and fastness assessment. In: Colour
Measurement: Principles, Advances and Industrial Applications. 2010, pp.
196–217.
192. Hsieh Y-L. Surface Characteristics of Polyester Fibers. In: Christopher MP,
Kiekens P (eds) SURFACE CHARACTERISTICS OF FIBERS AND
TEXTILES. New York: Marcel Dekker, Inc., 2001, pp. 33–57.
193. Patnaik A, Rengasamy RS, Kothari VK, et al. Wetting and Wicking in
Fibrous Materials. Text Prog 2006; 38: 1–105.
194. Bell MS, Shahraz A, Fichthorn KA, et al. Effects of Hierarchical Surface
Roughness on Droplet Contact Angle. Langmuir 2015; 31: 6752–6762.
195. Diversified Enterprises. Surface Energy Data for PET: Poly(ethylene
terephthalate), CAS # 25038-59-9. 2009; 1–3.
196. Hasan MMB, Calvimontes A, Synytska A, et al. Effects of topographic
structure on wettability of differently woven fabrics. Text Res J 2008; 78:
996–1003.
197. Hu J. Structure and Mechanics of woven Fabrics. 2004. Epub ahead of
print 2004. DOI: 10.1533/9781845690403.
198. Bachurová M, Wiener J. Theoretical Model of the Influence of Textile
Structure on Wetting Hysteresis. FIBRES Text East Eur 2013; 21: 80–83.
199. Yi Li, Qingyong Zhu. Simultaneous Heat and Moisture Transfer with
Moisture Sorption, Condensation, and Capillary Liquid Diffusion in Porous
Textiles. Text Res J 2003; 73: 515–524.
200. Wenzel RN. Resistance of solid surfaces to wetting by water. J Ind Eng
Chem (Washington, D C) 1936; 28: 988–994.
201. Decker C. Photoinitiated crosslinking polymerisation. Prog Polym Sci
1996; 21: 593–650.
202. Yagci Y, Jockusch S, Turro NJ. Photoinitiated polymerization: Advances,
challenges, and opportunities. Macromolecules 2010; 43: 6245–6260.
203. Kale PD, Lokhande HT, Rao KN, et al. Grafting on polyester fibers. J Appl
Polym Sci 1975; 19: 461–480.
204. Goldstein J, Newbury DE, Joy DC, et al. Scanning Electron Microscopy
and X-ray Microanalysis. 2003.
205. Pascarelli S, Mathon O, Mun??z M, et al. Energy-dispersive absorption
spectroscopy for hard-X-ray micro-XAS applications. Journal of
Synchrotron Radiation 2006; 13: 351–358.
206. Burgess S, Li X, Holland J. High spatial resolution energy dispersive X-ray
spectrometry in the SEM and the detection of light elements including
lithium | Microscopy and Analysis. Microscopy and Analysis 2013; S8–
S13.

120
207. Society for Dyers and Colourists. Material Safety Data Sheet for 706-652
& 706-653 - SDS ECE Non Phosphate Detergent A CLP
classification : James Heal - Application Support Help
Deskhttp://appsupport.james-
heal.co.uk/support/solutions/articles/5000741121-706-652-706-653-sds-
ece-non-phosphate-detergent-a-clp-classification (accessed 25 April 2018).
Appendix
Sensory evaluation tools
Individual identified fabric characteristics (descriptors of
perceptions)
Descriptor and meaning

121
1
2
3
4
5
6
7
8
9
10
11
12
13
14
15
16
17
18
19
20
Bridged listing of sensory descriptors
Descriptor and meaning
1
2
3
4
5
6
7
8
9
10
11

122
Ranking of fabrics for descriptors: knitted fabrics
Fabric ranks/rank lists
Perception Descriptor 1 2 3 4 5
Stiff
Soft
Smooth
Heavy
Noisy
Crispy
Stretchy
Drapy
Regular
Natural
Compact
Ranking of fabrics for descriptors: woven fabrics
Fabric ranks/rank lists
Perception Descriptor 1 2 3 4 5 6
Stiff
Soft
Smooth
Heavy
Noisy
Crispy
Stretchy
Drapy
Regular
Natural
Compact

123
Protocol for sensory evaluation
1. Smooth: We examine how smooth the fabric feels. The opposite of
rough/lumpy
Assessment: Feel the fabric placed flat on a table by gently running your
fingertips across the fabric surface once in all directions and assess the amount of
smoothness
2. Soft: We examine how soft a fabric feels. The fabric slips easily between the
fingers and thumb when rubbed; there is no resistance/drag. The opposite is hard
Assessment: Pick up the fabric and gently rub the fabric between fingers and
thumb of your hand and assess the amount of softness.
3. Stiff: The amount of stiffness the fabric sample has. How rigid/inflexible the
sample feels. The opposite is limpm or flexible
Assessment: Gather the fabric in hand applying some pressure to bend or
compress in your hand. Assess how stiff the fabric feels during manipulation.
4. Heavy: The perceived weight of the fabric. The opposite is light
Assessment: Look and hold the fabric and assess its weight by comparing.
5. Crisp: Fresh, firm; brittle; also related to how rigid the sample feels
Assessment: Observe the firmness, freshness of fabric and also how stiff and
brittle it feels upon bending
6. Drapy: How well the fabric drapes or hangs freely
Assessment: Using a pen or point finger let the fabric hang freely and observe
how gracefully it shapes or deforms
7. Noisy: The amount and quality of noisy when fabric is rubbed against another
surface
Assessment: Rub fabric to its other surface, also rub your fingers against the
fabric and note the kind and intensity of noise
8. Stretchy, resilient, elastic: Ease of stretching, and recovering back. The opposite
is nonstretchy
Assessment: Stretch with a small force, and see how much, and how easily the
fabric stretches and returns back. Again, press/wrinkle the fabric in your hands
and observe how easily it gets back to original shape
9. Regular/even: How even a fabric appears. The opposite is irregular
Assessment: Observe/touch the surface of the fabric for textural variations, lumps,
slabs, soiling, pills, and fluff. Less of these, means more regular. Not related to
variation in color shade or patterns
10. Compact/dense: The intensity of packing or closeness. The opposite is loose

124
Assessment: Observe the density of packing or tightness in the fabrics
11. Natural: Not synthetic; feeling of nature
Assessment: Observe, touch fabric to relate to natural or synthetic fiber. A more
natural appeal means it ranks higher
10. Dry: A feeling of dryness, no moisture. The opposite is damp. Feel the fabric
while fully gathered in your palms/hand
11. Bulky: Feeling of liveliness, springy, fullness and voluminous
Related Documents