TOWARDS HIGH-PERFORMANCE FACADE DESIGN AN OPTIMIZATION APPROACH FOR ENERGY EFFICIENT RESIDENTIAL BUILDING A dissertation presented by Rais Messaouda to Breuer Marcel Doctoral School of Architecture, University of Pecs, Faculty of Engineering and Information Technology for the degree of Doctor of Philosophy in Architectural engineering Supervised by Associate Prof. Dr. Halda Miklos Assistant Prof. Dr. Balint Baranyai March 2020

Welcome message from author
This document is posted to help you gain knowledge. Please leave a comment to let me know what you think about it! Share it to your friends and learn new things together.
Transcript

TOWARDS HIGH-PERFORMANCE FACADE DESIGN
AN OPTIMIZATION APPROACH FOR ENERGY EFFICIENT
RESIDENTIAL BUILDING
A dissertation presented
by
Rais Messaouda
to
Breuer Marcel Doctoral School of Architecture, University of Pecs, Faculty of Engineering
and Information Technology
for the degree of
Doctor of Philosophy in Architectural engineering
Supervised by
Associate Prof. Dr. Halda Miklos
Assistant Prof. Dr. Balint Baranyai
March 2020

ii
TOWARDS HIGH-PERFORMANCE FACADE DESIGN
AN OPTIMIZATION APPROACH FOR ENERGY EFFICIENT
RESIDENTIAL BUILDING
By
Rais Messaouda
Doctor of Philosophy in Architectural Engineering
University of Pecs, Hungary
Supervised by
Associate Prof. Dr. Halada Miklos
Assistant Prof. Dr. Balint Baranyai
Abstract
Preserving the environment is the most important issue of today’s world in which human
being has to reduce energy consumption. Over the last years, building energy efficiency has
worldwide considerable interest from the experts and researchers, since buildings are the
largest consumer of the final energy consumption.
During the last decade in Algeria, housing construction issues became one of the
development priorities. Policies and strategies were set up to tackle the housing demand and
to reorganize the sprawling slum areas, providing social houses for the low-income families,
the design and the constructional techniques of these buildings, are operated with over-
shorter project planning time, it is striving to minimize design costs, neglecting the climate
conditions and the sustainability concept. As a result, it has been reported that 37% of the
overall energy consumption was attributed to residential buildings.
Otherwise, the architectural facade design, technologies, and strategies, are the most
significant contributors to the energy performance and the comfort parameters of the
buildings. Thus, the main target of this research is investigating the possibilities of enhancing
the indoor thermal comfort, visual comfort, and indoor air quality with less energy
consumption through the building facade components, presenting a holistic evaluation and

iii
optimization approach. Besides, to provide an adaptive facade design to the local
environment, the Algerian hot and dry climate zone was the study context of this research. To
fulfill the set of objectives, this research applied an empirical methodology, using a dynamic
simulation through Vi-suite add-on for Blender 3D that controls the external application
Energy Plus and Radiance to conduct energy performance analysis. The Validation of the
modeling and simulation with this software is affected based on real field measurement to
determine the error percentage that can occur in the simulation. Furthermore, The existing
residential building façade design in Algeria is diagnosed in terms of energy consumption,
thermal comfort, visual comfort, and indoor air quality. Also, various facade alternative
configurations have been evaluated to define optimum design solutions, for this step a generic
virtual model has been created. The optimal combined solutions were applied in a typical
existing residential building.
Finally, As energy and other natural resources continue to be depleted, this study contributes
to the development of high energy-efficient residential building through the performance
facade design parameters that maintain indoor environment satisfaction while consuming
fewer of these resources.
Keywords: Facade, Residential Building, Energy optimization, indoor comfort, Hot dry
climate, visual comfort, thermal comfort, Energy Plus, Vi-suit

iv
ACKNOWLEDGMENTS
I would like to express my deepest gratitude to the Algerian ministry of higher education
and the Tempus Foundation for granting me a Stipendium Hungaricum scholarship that
supports my studies at the Architectural Engineering Ph.D. program at the University of Pecs.
I would also like to extend my deepest appreciation to my two supervisors Assistant
Professor Dr. Bálint Baranyai and Associate Prof. Dr. Halada Miklos, their kind support has
been a key to my academic development. Thanks should also go to the Marcel Breuer
Doctoral School’s professors and staff for their help and support during the study period.
Special thanks also to Dr. Sriti Leila and Dr.Kaona Tamas Janos for their helpful advice
since the initial research process. I would also than Dr. Bálint Baranyai and Dr. Kistelegdi
Isvtan for letting me join in the ‘Energia Design’ research group. The friendly active
atmosphere among the research group colleagues has made my research work more
interesting and productive.
I would also express my sincere gratitude to my family, especially my mother Bouchana
Ouarda, for her support and love all the time, my father Rais Djamel who passed away but he
left great lessons which helped me during all my life challenges. My deepest gratitude goes
also to my husband Adel Boumerzoug for his continuous motivation, help, and support.
Special thanks also to all my brothers and sisters; Halim, Nabil, Salah, Youcef, Sihem,
Fatima, and Sana. Also, I would thank all my friends and colleagues for their helpful support.

v
Table of Contents 1. INTRODUCTION ........................................................................................................... 1
1.1 Background of research ..................................................................................................... 1
1.2.1 geographical and climatic conditions ................................................................................ 2
1.2.2 Energy Production /consumption in Algeria .................................................................... 4
1.2.2.1 Primary energy production ................................................................................................ 4
1.2.2.2 National energy consumption ............................................................................................ 5
1.2 Climate Facade Design concept development, research, and applications ..................... 7
1.3.1 Climate design principles and strategies ........................................................................... 7
1.3.2 Building facade and energy design performance ........................................................... 10
1.3 Research problem ............................................................................................................. 16
1.4 Research objectives .......................................................................................................... 16
1.5 Research hypothesis ......................................................................................................... 17
1.6 Conceptual analysis ......................................................................................................... 17
1.7 Scope and limitations: ...................................................................................................... 18
2. RESEARCH METHODOLOGY OVERVIEW ................................................................ 18
2.1 First part: research scientific background ...................................................................... 19
2.2 Second part: Modeling and simulation validation .......................................................... 20
2.3 Third part: Energy performance diagnosis of the existing social houses in Algeria .... 20
2.4 Fourth part: Multi-objective Optimization approach for high-performance facade
design 20
2.5 Fifth part: Optimum results application on existing residential building ..................... 20
2.6 Research structure ........................................................................................................... 21
3. VALIDATION OF THE MODELING AND THE SIMULATION ACCURACY .................. 22
3.1 Measurement and dynamic simulation tools ................................................................... 22
3.2 Case study location and climate ...................................................................................... 23
3.3 Validation methodology process ...................................................................................... 25
3.4 Validation results and discussion .................................................................................... 25
4. BUILDING ENERGY PERFORMANCE DIAGNOSIS OF THE EXISTING RESIDENTIAL
BUILDING FACADE IN ALGERIA ....................................................................................... 31
4.1 Input data and boundary conditions for the simulation process .................................... 32
4.2 Simulation results evaluation and discussion ................................................................. 36
4.2.1 Energy consumption evaluation ...................................................................................... 36

vi
4.2.2 Thermal comfort analysis ................................................................................................ 38
4.2.3 Daylighting availability analysis ...................................................................................... 39
4.2.4 Indoor air quality analysis ............................................................................................... 41
4.2.5 Synthesis of the building energy diagnosis ..................................................................... 42
5. AN OPTIMIZATION APPROACH FOR HIGH-PERFORMANCE BUILDING FACADE
DESIGN .............................................................................................................................. 42
5.1 An optimization approach for the conventional wall structure ...................................... 44
5.1.1 Energy demand and thermal performance simulation results & discussion ................. 46
5.1.2 Performance analysis of the different wall materials ..................................................... 52
5.1.3 Optimum material determination .................................................................................... 53
5.2 An optimization approach for the Opening parameters ................................................. 56
5.2.1 Simulation results of the energy demand; the impact of orientations, WWR, Glazing
type 57
5.2.2 Simulation results of the thermal comfort; the impact of orientations, WWR, Glazing 61
5.2.3 Simulation results of the Daylight availability; the impact of orientations, WWR,
Glazing 63
5.2.4 Simulation results of the carbon dioxide (CO2) level .................................................... 65
5.2.5 Performance analysis of the best window parameters .................................................... 66
5.2.6 Holistic comparison for optimum balance between the different indoor comfort's
aspects 68
6.2 Combination of the optimum Façade design solutions .................................................. 70
6. General conclusion & main finding ............................................................................... 77
Bibliography ........................................................................................................................ 82

vii
List of figures
Figure 1.The location of Algeria in the world .............................................................................. 3
Figure 2. Koppen map climate classification of Algeria (Kottek et al., 2006) .................................. 3
Figure 3. Climate zoning in Algeria (Ould-Henia, 2003) .............................................................. 4
Figure 4.Primary energy production in Algeria ............................................................................ 5
Figure 5.National energy consumption of the produced primary energy ......................................... 5
Figure 6. Energy consumption in Algeria by sector ...................................................................... 6
Figure 7. The residential building demand in Algeria between 2006 and 2015 (Kamel Dali
APRUE.2017) ......................................................................................................................... 7
Figure 8. Climatic design typologies in the different climatic zones. (Hindrichs, 2007) ..................... 8
Figure 9. The three basic constituents of bioclimatic design (Košir, 2019) ..................................... 9
Figure 10. The different design principles of the bioclimatic concept ............................................. 9
Figure 11. Double skin facade classifications (Knaack et al., 2007). ............................................. 10
Figure 12. High-performance facade requirements (Knaack et al., 2007). ..................................... 11
Figure 13. Conceptual framework of the research study.............................................................. 18
Figure 14. The main interface of the decision-making tool blender 3D and the plug-in Vi-suite
(Southall and Biljecki, 2017)................................................................................................... 19
Figure 15. Research structure diagram for the topic ................................................................... 21
Figure 16. Data logger used for the Measurements collection (Author) ......................................... 23
Figure 17. Location of the case study ....................................................................................... 23
Figure 18. Climatic data of the representative city ( weather file Meteonorm 7’) ........................... 24
Figure 19. Contemporary residential building in Biskra, Algeria ( Author) ................................... 24
Figure 20. illustration of the apartment position (Author) ....................................................... 25
Figure 21. Comparison of the Dry-bulb temperature results in the entrance hall ............................ 26
Figure 22. Comparison of the Humidity results in the entrance hall.............................................. 26
Figure 23. Comparison of the Dry-bulb temperature results in Bedroom n°1 ................................. 27
Figure 24. Comparison of the Humidity results in Bedroom n°1 .................................................. 27
Figure 25. Comparison of the Dry-bulb temperature results in Bedroom n°2 ................................ 28
Figure 26. Comparison of the Humidity results in Bedroom n°2 .................................................. 28
Figure 27. Comparison of the Dry-bulb temperature results in the Kitchen ................................... 29
Figure 28. Comparison of the Humidity results in Kitchen .......................................................... 29
Figure 29. Comparison of the Dry-bulb temperature results in Living room .................................. 30
Figure 30. Comparison of the Humidity results in Living room ................................................... 30
Figure 31. a) Location of the building; b) Reference building model ............................................ 31
Figure 32. Plan and section of the social house reference ............................................................ 32
Figure 33. Diagnosis of energy performance process related to building facade components ........... 33
Figure 34. Sunlit time simulation results ................................................................................... 34
Figure 35. The energy consumption of the upper apartment in a whole year. ................................ 37
Figure 36. The cooling and heating consumption of all the simulated zones .................................. 37
Figure 37. The indices PMV for the living room ........................................................................ 38
Figure 38. PPD results for the living room and Room 1 .............................................................. 39

viii
Figure 39. Daylight illuminance comparison between bream standard and the Living room and Room
1 .......................................................................................................................................... 40
Figure 40. Daylight uniformity comparison between bream standard and the Living room and Roo1
........................................................................................................................................... 40
Figure 41. The CO2 concentration in the living room and Room 1 for the whole year. .................. 41
Figure 42. Simulation protocol for the optimization approach ..................................................... 43
Figure 43. Virtual model........................................................................................................ 43
Figure 44. Selection criteria for the wall structure alternatives ..................................................... 45
Figure 45. Cooling demand comparison for the different wall materials ....................................... 47
Figure 46. Heating demand comparison for the different wall materials ........................................ 47
Figure 47. The best thermal comfort hours during the year (8760h) (-1≥ PMV≤+1). ..................... 48
Figure 48. The unacceptable thermal comfort hours during the year (8760h) ............................... 49
Figure 49. Colors degree indices for the thermal properties analysis ........................................... 50
Figure 50. Correlation between the thermal mass and the thermal comfort .................................... 52
Figure 51. Correlation between the thermal conductivity and the energy demand .......................... 52
Figure 52. Interactive performance comparison between the different wall materials .................... 53
Figure 53.Performance classification of the selected materials .................................................... 56
Figure 54. Different WWR and orientations impact on cooling demand; case SG .......................... 58
Figure 55.Different WWR and orientations impact on heating demand; case SG ........................... 59
Figure 56. The cooling demand after the application DG ............................................................ 59
Figure 57. The cooling demand after the application TG ............................................................ 60
Figure 58. The heating demand after the application DG ........................................................... 60
Figure 59. The heating demand after the application TG ............................................................. 61
Figure 60. Comfort hours during the whole year (8670): case SG ................................................ 62
Figure 61. Comfort hours during the whole year (8670): case DG................................................ 62
Figure 62. Comfort hours during the whole year (8670): case TG ................................................ 63
Figure 63. Daylight availability comparison between the different WWR and orientation: Case SG . 64
Figure 64. Daylight availability comparison between the SG and DG........................................... 64
Figure 65. Daylight availability comparison between the SG and TG ........................................... 65
Figure 66. WWR impact on the CO2 level >1000 ppm during the whole year (8760h) .................. 66
Figure 67. Optimal window to wall ratio for each orientation ...................................................... 68
Figure 68. Thermal comfort comparison between the optimum facade and the existing building ..... 71
Figure 69. Heating demand comparison between the optimum facade and the existing model ......... 71
Figure 70. Cooling demand comparison between the optimum facade and the existing model ......... 72
Figure 71. Carbon dioxide level ≤1000 pmm comparison ........................................................... 72
Figure 72. Daylight availability comparison .............................................................................. 73
Figure 73. Average illuminance on 21 December ...................................................................... 74
Figure 74. Average illuminance on 21 June .............................................................................. 74
Figure 75. Compliance area with the required illuminance level on 21 December .......................... 75
Figure 76. Compliance area with the required illuminance level on 21 June .................................. 75
Figure 77. Uniformity ratio on 21 December ............................................................................. 76
Figure 78. Uniformity ratio on 21 June ..................................................................................... 76

ix
List of tables
Table 1 Datalogger properties ................................................................................................. 22
Table 2 Conventional wall Thermal properties .......................................................................... 32
Table 3. Conventional wall structure and materials .................................................................... 44
Table 4. Thermal and physical properties of the investigated alternative wall material ................... 45
Table 5 Correlation between the material thermal properties and energy/thermal performance ....... 50
Table 6 The percentage of reduction and increased energy consumption and thermal comfort in all
scenarios. ............................................................................................................................. 54
Table 7 Glazing Properties ...................................................................................................... 57
Table 8 The optimum WWT and glazing type for each aspect ..................................................... 67
Table 9 The classification of the indoor comfort requirements in the study context ........................ 69
Table 10 Holistic comparison between the different aspects ........................................................ 69

1
1. INTRODUCTION
1.1 Background of research
Human activities since the beginning of the industrial revolution in the mid-20th
century
caused global warming which driving climate changes impacting natural systems on all
continents and across the oceans. In addition, these activities increase the greenhouse
emissions results from the increased use of fossil fuels in transportation, manufacturing, and
communications (U.S. Global Change Research Program, 2009). Furthermore, buildings
provide shelter that facilitates our activities and interactions. The method by which we apply
technologies in the design and construction process of buildings has direct implications for
the amount of energy consumed, globally it is considered the largest consumer of the final
energy consumption, it accounts for more than 36% of global final energy use and 39% of
energy-related CO2 emissions in 2018.(“Global Status Report for Buildings and
Construction,” 2019). Thus, the issue of the environment resources preservation is considered
an important priority of today’s world in which human being has to reduce energy
consumption. In this context, initiatives and actions are set by different countries, it
contributes to the environmental protection, driving strategies and assessment methods for the
building stock to achieve the objectives in terms of energy efficiency and climate change.
(Díaz López et al., 2019).
During the last decade in Algeria, housing construction issues became one of the
development priorities. Policies and strategies were set up in order to tackle the housing
demand and to reorganize the sprawling slum areas, providing social houses for the low-
income families who live there (Saada, n.d.), (Hadjri, 1992). The design and constructional
techniques of these residential buildings, which operated with over-shorter project planning
time, it is striving to minimize design costs, neglecting the local climatic conditions, hence,
the internal environment of these buildings is artificially controlled to achieve occupant’s
desire of comfort, and this necessitates a considerable energy consumption. However,
performing buildings that maintain occupant’s comfort with less energy consumption requires
an architectural design that uses appropriate technologies and design principles which
respond and adapt accurately to the local climatic conditions (Semahi et al., 2019). Climate
adaptive facade is one of the promising concepts that play a key role in the planning of

2
buildings with optimized energy use, it behaves as our third skin, the outside of building
fulfills similar to those of human skin and or clothing. This means that facades are not simply
barriers between interior and exterior; rather, they are building systems that create
comfortable spaces by actively responding to the building’s external environment, and
significantly reduce buildings’ energy consumption (Aksamija, n.d.). However, in the
Algerian building sector, there is a lack of researches on optimizing the building facade
design, and more research is needed on synergies between all the facade components to
create energy-efficient buildings through the facade components. Research context
1.2.1 geographical and climatic conditions
Geographical and Climatic conditions represent the starting point of the climate-adaptive
design for any building, whereas understanding these conditions is crucial for the selection of
appropriate design approaches to improve building energy efficiency. The main research
context is focused on Algeria. In this section, the current status of the country, geographical,
and climatic conditions are introduced.
Algeria is a country located in North Africa, it is the tenth-largest country in the world and
the largest in Africa, it has a vast area of 2.381.741 km². With an estimated population of
over 42 million. The northeast has a border with Tunisia, the east with Libya, the west with
Morocco, the southwest with the Western Saharan territory, Mauritania, and Mali, the
southeast with Niger, and the north with the Mediterranean Sea. Figure.1.

3
Figure 1.The location of Algeria in the world
The climate of Algeria is varied because the country has a very large area, the northern part
has a Mediterranean climate (Classification of Köppen Csa), while the rest of the country has
a majority desert climate (Köppen classification BWh). However, between these two major
types of climates, there are transitional climates, notably the semi-arid climate (Classification
of Köppen BSk) which corresponds to a Mediterranean climate with a dryness no longer
limited only to the summer season but also in the rest of the year, it characterizes also by a
Mediterranean climate with mountain influences, a little more continental. Nevertheless,
Algeria is a country in the subtropical zone where the prevailing climate is hot and dry.
Figure.2.
Figure 2. Koppen map climate classification of Algeria (Kottek et al., 2006)
Furthermore, depending on (Ould Henia 2003) more than 85% of Algeria's total surface area
is characterized by a hot and dry climate, subdivided into three summer climate zones (E3,
E4, and E5) and a winter climate zone (divided into three sub-zones). zones H3a, H3b, and
H3c). All these regions are influenced by altitude. Figure.3. Illustrate the different zonings as
follows: Zone E3 (Presaharan and Tassili), the summers are very hot and very dry, the E4
zone of the Sahara, corresponding to summers more difficult than those of E3, The zone E5 is
the hottest in Algeria, Zone H3a (Presaharan), with an altitude of between 500 and 1000

4
meters, is characterized by very cold winters at night compared to the day, Zone H3b
(Sahara), altitude between 200 and 500 meters, the winters are there less cold than those in
zone H3a, Zone H3c (Hoggar), with an altitude above 500 meters, with severe winters similar
to those of zone H3a, but which persist even during the day.
Figure 3. Climate zoning in Algeria (Ould-Henia, 2003)
1.2.2 Energy Production /consumption in Algeria
This section presents the primary energy production and consumption in Algeria, all the data
are based on the balance sheet of the Algerian ministry of energy (“benational_2018-edition-
2019_5dac85774bce1.pdf,” n.d.).
1.2.2.1 Primary energy production
The structure of commercial primary energy production remains dominated by the natural gas
56% natural, followed by the oil, the natural gas condensate, Liquefied petroleum gas (LPG).
as illustrated in the graph below. In 2018 the primary electricity production increased from
635 to 783 GWh, driven by the increase of the hydraulic production sector, and 17% of solar
origin. The increase in hydroelectricity production follows very favorable rainfall in 2018,
where production was 117 GWh compared to 56 GWh in 2017. Figure.4.

5
Figure 4.Primary energy production in Algeria
1.2.2.2 National energy consumption
The structure of national energy consumption is dominated by natural gas (38%) followed by
electricity (28%) and liquid products (27%), as illustrated in Figure.5. Also, it is reported that
In 2018 the natural gas consumption increased by 17.4%, and the electricity consumption
4.9%, all driven by the growing needs of customers, particularly those of households.
Figure 5.National energy consumption of the produced primary energy
Structure of the primary energy production
Natural gaz Oil Natural gas condensate
LPG Primary electricity Solid fuel: Wood
National energy consumption
Natural gaz Oil products Electricity
LPG Oil productions in fields Natural gas condensate
Solid products: Wood, steel Others; Liquefied natural gas

6
1.2.2.3. National consumption by sectors
The structure of final energy consumption in Algeria is dominated by the “Households &
agriculture” sectors (46.6%), followed by transport (32%) and finally the “industry and public
works” sector 22% as it is reported by the Algerian ministry of energy. Furthermore, the
energy consumption of the residential building sector has steadily increased between 2017
and 2018 by 3%, it is responsible of 37% from the overall energy consumption, and 41 %
compared to the industrial and the transport sectors. Figure.6.
Figure 6. Energy consumption in Algeria by sector
Housing issues in Algeria became greater and actions had to be taken to face the
overwhelming crisis. Policies and strategies were set up to tackle the housing demand and to
reorganize the sprawling urban areas. (Saada, n.d.),(Bah et al., 2018). Although a lot is done
by the State in housing delivery, a greater demand is still expressed, nearly 200000 houses
are built annually. Figure.7. shows the development of the housing sector in Algeria from
2006 to 2015.
Moreover, a study from the national agency for the promotion and rationalization of the
energy used (APRUE) indicates that the needs of the residential sector will be multiplied by
2.7 in 2020 as it is concluded by the research of (Ghezloun et al., 2011).
National energy consumption per sector
industrial Transport Residential building

7
Figure 7. The residential building demand in Algeria between 2006 and 2015 (Kamel Dali
APRUE.2017)
1.2 Climate Facade Design concept development, research, and applications
This section reviews the important contents of studies on the architectural facade design. The
importance of the facade system is presented, focusing on the emerging climatic adaptiveness
concept and building energy efficiency, as well as the main design strategies. The main
features of the high-performance facade and its impacting parameters that provide comfort’s
occupants and building energy efficiency are highlighted. The influence of the orientations,
selection of window-to-wall ratio, shading elements, external wall structure are presented.
Finally, the related research gaps in the study context are identified.
1.3.1 Climate design principles and strategies
The main goal of architecture has always been the protection of human beings from the
exterior environmental conditions, attempting to achieve human comfort in the indoor
climate. The industrial revolution led to radical changes in the building design, new materials
and technologies were incorporated (Manvi, 2017). As a consequence, the massive use of
non-renewable energy that seeks to maintain comfort in modern buildings has an ecological
footprint (Hardy, 2003). Throughout history, climate adaptability can be found in the earliest
human settlements and buildings it has been termed “vernacular architecture”, which we still

8
find many worthy examples to study (Nguyen et al., 2019). The design of the basic house
varies greatly from region to region according to the natural resources available and the
prevailing climate. Figure.8.
Figure 8. Climatic design typologies in the different climatic zones. (Hindrichs, 2007)
Otherwise, the described approach was scientific popularized by Victor Olgyay in his seminal
work Design with Climate: Bioclimatic Approach to Architectural Regionalism (Olgyay,
1963), and a few years later by (Givoni, 1976) in his book Man, climate, and architecture,
Both studies believed that incorporating climate data as a basis for architectural design marks
a crucial milestone, it is the major determinant of the built form’s configuration, the facade
elements, the internal spatial organization, the external aesthetic and the identities.
Furthermore, the works contain many charts, graphs, and data for the analysis which is
necessary to use appropriate strategies to achieve human comfort within a building. This
approach called Bioclimatic design which refers to as “passive mode” design, being passively
responsive to the local climate to improve thermal comfort without the inclusion of any active
engineering environmental system. Figure.9.

9
Figure 9. The three basic constituents of bioclimatic design (Košir, 2019)
This approach contains a set of methods and principles used to capitalize on the advantages
of climatic conditions surrounding the buildings, making use of the physical–environmental
parameters (daily exterior temperature, solar radiation, and wind speed) and the building
design parameters (building form, transparency, orientation, thermal–physical material
properties and urban Canyon). Figure.10. These principles provide thermal and visual
comfort with less energy consumption, through cooling, heating, day-lighting and ventilation
strategies. (Guedes and Cantuaria, 2019).
Figure 10. The different design principles of the bioclimatic concept ( Misse, A. 2011)

10
1.3.2 Building facade and energy design performance
The term façade generally refers to the external side of the wall or the frontal part of a
building (Sandak et al., 2019). Building façades define the characteristics of the architecture;
the structures and the identities, as well as, it is a separator between the exterior and the
sheltered environment. Throughout history, the façade's design, functions, and integrated
elements have been changed responding to the growing technological abilities and the
people's new lifestyle (Herzog et al., 2012). Furthermore, facing the challenge of climate
change and to perform hight building energy efficiency; the prevailing trend in the façade is
its increasing complexity of the design requirements, more and more facade technologies
being developed to increase the user’s comfort level with low energy consumption (Knaack
et al., 2007). The main three general facade design trends are classified by (Aksamija, 2013);
the first, is the small-scale methods that developed to improve facade performance at the
micro-level, it includes the coatings, the advanced glazing technologies, and the smart
materials such as the Phase change material (PCM). The second consists of large-scale
innovations including the double-skin facades and all its various typologies ( Box window,
Corridor, Shaft box, and Multistory façade) as it is illustrated in Figure.11. The third trend is
to integrate alternative energy sources into the building façade such as the solar collectors,
the photovoltaic cells (PV), Wind powers, as well as the dynamically controlled façade.
(a) Box-window (b) Corridor facade (c) Shaft-box (d) Multistory
Figure 11. Double skin facade classifications (Knaack et al., 2007).
All these facade design trends must fulfill many functions, providing views to the outside,
resisting wind loads, supporting its dead load weight, allowing daylight to interior spaces,
blocking unwanted solar heat gain, protecting occupants from outside noise and temperature
extremes, and resisting air and water penetration (Aksamija, 2009). Figure.12. Additionally,

11
The facade becomes an integral part of the concept for adaptation of the building to the
climate conditions, thus the facade should behave as an energy-efficient passive or active
mechanical system, that can respond and adapt its properties and components with the
immediate environment and the climatic conditions. Furthermore, the most common external
factors associated with climate-adaptive façades are solar radiation together and outdoor
temperature. Because these factors have a direct impact on thermal, visual comfort, and on
the energy performance of buildings (Aelenei et al., 2016).
Figure 12. High-performance facade requirements (Knaack et al., 2007).
Moreover, many other research studies revealed that the internal room climate of buildings is
determined to a great extent by the facade elements and its orientation, the proportion of the
window area, solar screening design, and constructional wall material.
The orientation of a building determines its exposure to sunlight, Strategies for controlling
solar heat gain depending on the building’s orientation. As it is revealed by (Givoni, 1994)
the choice of the orientation depends on many considerations that affect the indoor
environment; the potential of solar penetration, and the wind directions. (Al-Anzi and
Khattab, 2010) also have reported that in a BWh climate during the peak months the large
glazing area orientated to the SE and SW achieves higher demands on total cooling loads
compared to new proposed building design that has more facades oriented to the North, and
South directions. Furthermore, heat loss and gain are often associated with the external wall

12
structure and materials, which makes its selection an important factor in designing high
thermal performance facades, it is one of the most effective energy conservation measures for
cooling and heating in buildings. Therefore, determining and selecting the optimum wall
structure is the main research field of many engineering investigations. (Bolattürk, 2008),
revealed that considerable energy savings for heating or air-conditioning can be obtained by
the limit transmission loads to/from the buildings. In this study, the optimum insulation
thicknesses on external walls of buildings were calculated based on both annual heating and
cooling loads in Turkey’s warmest zone. Also, (Aldawi et al., 2013), estimated the total
ongoing heating and cooling energy requirements for four (4) house wall system, the new
house wall systems have shown significantly higher energy efficiency in comparison with the
conventional house wall system for all Australian climate conditions. The conventional wall
is typically composed of brick veneer, air cavity, insulation foil, and timber frame, while the
new proposed system contains polystyrene insulation, reinforced concrete, the design differs
on changing the insulation position from inside to outside. Additionally, (Bevilacqua et al.,
2019) Investegrated the efficiency of the Trombe wall in the yearly building energy
requirements in warm and cold climates, the results revealed that the configurations of; the
external glass properties, vents geometry, position and the schedule for the activation of the
ventilation strategies have to be designed in terms of the climatic context to obtain best
results for both summer and winter periods.
Furthermore, Windows parameters are also an important element of the facade design, they
are often arranged for admission of the airflow, direct and indirect sunlight, and to provide
views. Therefore, window design optimization for thermal and daylight performance is
important in achieving energy conservation and increasing overall efficiency. When choosing
fenestration materials, specific properties should be considered; the windows to wall ratio
(WWR), the properties of glass such as U-values, SHGC, and visual transmittance. (AlAnzi
et al., 2009) in this study, applied a detailed parametric analysis indicates that the effect of
building shape on total building energy use depends on primarily three factors, the relative
compactness (RC), the window-to-wall ratio (WWR), and glazing type defined by its solar
heat gain coefficient, (SHGC). (Rathi, 2012) provides a method that optimizes the thermal
and daylight performance based on the fenestration parameters to achieve the overall
efficiency of buildings. The results revealed 10-15% reductions in the total energy use of
office buildings with an increase in overall. Furthermore, (Feng et al., 2017) studied the
influence of different glazing percentages (WWR) in the different orientations on energy
consumption for nearly zero energy building (NEZEB) in the severe cold area using energy

13
plus software for the simulation. The results showed that the WWR has a greater impact on
the orientation east and west compared to the south and the north respectively, as well as the
most energy-efficient WWR for NZEB in East, and West orientations is between 10%-15%,
south WWR is between 10%-22.5%, north WWR should be appropriately reduced taking into
consideration the lighting and ventilation conditions.
Moreover, The amount of incident solar radiation (insolation) admitted through the glazed
surfaces in the facade may show severe thermal and visual discomfort issues, to avoid
excessive solar gain and reduce energy consumption it is necessary to adopt suitable shading
device design, this strategy can help in overcoming the penalties of heat loss in winter and
excessive heat gain in summer. The protection of a facade from direct solar radiation induces
an important reduction of the solar energy absorbed. A shaded facade will then only have to
sustain the diffuse and reflected radiations as it is revealed by (Capeluto, 2003), this study
investigated the impact of the Solar Collection Envelope (SCE), this concept is used for the
generation of the self-shading envelope. The simulation results reveal that for all the
orientations there is an important improvement in the energy performance of the building
when designing according to the self-shading envelope. Similar results can be also obtained
for vertical facades using high-performance low-emissivity windows. The combination of the
building self-shading geometry and internal blinds provide the best solution, particularly for
east and west orientations. Furthermore, (Valladares-Rendón et al., 2017) Reviewed the
literature about energy savings by solar control techniques and optimal building orientation
for the strategic placement of façade shading systems, The results showed that the cases that
integrate this passive strategy have effectively lowered the insolation and achieved potential
energy savings of 4.64% to 76.57%. The strategies selected for six cases were suitable for
subtropical and temperate zones. The most recommended solutions were complex designs of
facade self-shadings and shading devices; their strategic placements and accurate designs can
further improve the building efficiency.(Planas et al., 2018) Analyzed different façade types
of office buildings in the Mediterranean climate, this study affirmed that the decisive
parameter that affects cooling demand is the incident solar radiation. This confirms that
climates with high solar radiation and relatively high temperatures, the design of facades with
a low overall solar factor is crucial to properly control the air conditioning demand.
Moreover, In the study context, also many research has been conducted to improve building
energy performance.(Berghout et al., 2014) have demonstrated the relationship between the
amount of energy absorbed by the wall and the interior temperature, which is closely related
to the orientation, also it has been found that for the Algerian hot and dry climate, the energy

14
requirements for air-conditioning depend on the orientation and, during the summer period
electricity consumption is higher, especially for the East and West orientations which should
be avoided in the building design, contrary to the South and North orientations. (Hamdani et
al., 2012) addressed the envelope impact on the interior temperature of a building in the
desert climate in Algeria. Three main feature has been analyzed; the orientation, the thermal
inertia, and the thermal insulation, it has been concluded that: the most effective measure to
achieve better results is the thermal insulation, however, the orientation of thermally isolated
external walls doesn't have a considerable impact on the interior temperature. Thermal inertia
of buildings may thus generate thermal comfort. It was revealed that adequate use of stone
thermal inertia is essential to achieve better building thermal comfort. Also, (Matari, 2015) In
this study three wall types are analyzed in terms of interior temperature variations in the hot
and dry climate; these materials are consist of an adobe wall, concrete block, and hollow
brick. it has been concluded that double brick walls and single adobe walls are significantly
more efficient compared to single concrete block walls. Besides, Adobe is a local product that
requires less polluting emissions during its production. Furthermore, (Khadraoui M A et al.,
2018) investigated the thermal behaviors of four different facade typologies of office
buildings; ventilated facade, curtain wall, earthen brick, and double skin facade, in Biskra
city in Algeria, assessing both the surface temperature and the operative temperature through
a field measurement and a dynamic simulation. It has been found that the earthen brick
facade system was more efficient followed by the ventilated facade, while the curtain wall
system and the double-skin facade that includes steel exterior layer have a negative effect.
Furthermore, (Latreche Sihem and Sriti Leila, 2018) examined the influence of constructive
choices on the ambient and surface temperature, air velocity, and humidity. 15 variates were
investigated including conventional wall systems; hollow brick, hollow concrete block, and
standard concrete block, the variations were applied for the wall dimensions and structure.
This experiment has shown that a judicious choice of materials can positively influence the
inner thermal comfort, as well as the double hollow brick wall system that includes the air
cavity was the best variant.
Additionally, in hot and dry climate the intense solar radiation the excess solar gains and
high outside temperatures, especially in summer, resulting in indoor discomfort. Minimizing
the glazed surfaces is always a recommended passive solution for these areas. (ZEMMOURI,
2005) examined a method based on daylight availability to determine window size
alternatives providing optimum conditions in terms of visual comfort and heat transfer. The
findings show that glass type represents a basic parameter to be considered to achieve good

15
indoor climatic and lighting conditions with minimal energy consumption. (Zekraoui, 2017)
studied the optimal choice of the window parameters in Algerian hot and dry climate,
including the window to wall ratio (25%,50%, 75%,100%) and different glazing type. As a
recommendation, this study stated that the optimal ratio for East, West directions in terms of
building energy consumption should be between 20-40% to avoid overheating. Additionally,
(Badeche and Bouchahm, 2020) Demonstrated that optimizing fenestration parameters
including the orientation, the window to wall ratio, the thermal conductivity of both the glass
and the frame, the solar heat gain coefficient (SHGC), can reduce energy loads in office
buildings for the three major climatic regions of Algeria (the Mediterranean, semi-arid, and
arid), and the importance of each paramtres vaired depending on the climatic conditions;
shading devices has greater affect on the energy load of the office especially in the hot and
dry climate. Also, (Bourbia, 2016) investigated the impact of the kinematic shading strategies
and solar control for the hot and dry climate in Algeria, This paper presents initial findings of
ongoing research about design optimization of the dynamic shading facades using the
parametric design tool. It has been found that the dynamic shading system contributes to a
significant reduction in energy consumption reaching 43%.
Throughout reviewing the literature, to help in formulating the research main problem and
aim, it is noteworthy that: first, The building sector in Algeria, partially the residential
buildings are the most energy consumer of the final energy consumption, which produced
from natural resources; Natural gas was the main produced and consumed primary energy.
Sustainable thinking and high building energy performance design should be promoted in the
country. Secondly, the building facade design is an important contributor to save energy and
provide thermal, visual comfort, and indoor air quality for the occupants in the indoor
environment, These aspects impact human health, activity, and production. Additionally,
Many façade design trends and technologies have been developed and tested, and it has been
proved that the facade components are the main impacting parameters of building energy
efficiency, including the window to wall ration, wall structure and materials, the shading
system, and the orientation. Although, in Algerian hot and dry climate which represent 89%
of the country, most of the studies dealing with the topic in a fragmented way, no holistic
optimization approach that deals with the facade parameters and its impact on the comfort
level of the occupants have been applied, also almost of the research when dealing with the
facade design, the studies are applied for the office buildings. Strict guidelines of the facade

16
design in this context are missing for the residential buildings. However, this gap in the body
of knowledge was identified and is being pursued in this research to be bridged.
1.3 Research problem
The thesis attempts to find a solution by finding answers to these research questions:
- Do current, residential social housing in Algeria provide indoor comfort of occupants,
which meets the building energy efficiency standard?
- Since the building facade is the most contributor element to the energy efficiency of
buildings. How a design guideline can be developed to enhance the building energy-
efficiency in terms of thermal comfort indoor air quality, and visual comfort?
- What is the optimal façade design interaction between all the facade components to
find the optimum thermal comfort, visual comfort, indoor air quality with less energy
consumption?
- What are the main decisive comfort levels/aspect to define the optimal solutions for the
facade design?
- What are the possible executable techniques for local builders/ context that can be
developed for optimizing the building facade design in Algeria?
1.4 Research objectives
The main aim of this research is to present an optimization approach for the building facade
design and to develop generic facade guidelines for the residential building in the hot and dry
climate of Algeria, that seeks to provide occupants thermal, visual comfort and indoor air
quality with minimum energy use. To fulfill this aim, the following objectives have set:
1. Review current literature on the building facade research and applications to define the
main impacting parameters on the inhabitants’ comfort and energy consumption.
2. Diagnose the current situation of the existing social housing in Algeria in terms of
building energy efficiency.

17
3. Investigate and find the optimal interaction between the several facade components
design, to balance thermal, visual comfort, and indoor air quality with less energy
consumption.
4. Define the most important aspects of comfort which are related to high building energy
efficiency in the study context.
5. Develop design guidelines for the building facade in a hot and dry climate to provide
high building energy efficiency with easily executable techniques for local builders/
context.
6. Determine recommendations considering the responsive facade design for helping the
designers/architects to improve the energy performance in a hot arid climate in the
early stage of designing.
1.5 Research hypothesis
Balancing thermal comfort, visual comfort, and indoor air quality (IDQ) by optimizing the
building facade design parameters passively can further improve building energy efficiency
in Algerian hot and dry climate.
1.6 Conceptual analysis
To concretize the concepts of the hypothesis and to fulfill the thesis’s main goal; the
conceptual analysis of this study is determined; it present on the one hand the facade design
strategies and parameters and the other hand the building energy performance concept. they
are transformed into observable and measurable indicators. All these variables are defined
based on the literature, and the problematic of the study context. Figure.13.

18
Figure 13. Conceptual framework of the research study
1.7 Scope and limitations:
This study is focused on investigating the possibilities of optimizing the building facade
design to improve building energy efficiency. The study is limited to the residential building
in the Algerian hot and dry climate. Although, some of the findings may be generalized.
Furthermore, the multiobjective optimization methodology can be applied in different
contexts and different building types. Moreover, Facade load-bearing and acoustic comfort
through the facade materials are not investigated in this study.
2. RESEARCH METHODOLOGY OVERVIEW
The research methodology of this work is applied research its goal is to solve a real problem,
it is deductive using quantitative and experimental methods. it is based on a quantitative
evaluation using a thermal dynamic simulation through the free and open-source VI-Suite, it
is a plugin that uses some built functionalities of Blender 3D software to control the external
applications Energy plus and Radiance to conduct energy and thermal performance
simulation, artificial and natural lighting analysis, advanced natural ventilation network
creation, glare analysis, and wind rose generation.. (Southall and Biljecki, 2017),(Sousa,

19
2012),(Crawley et al., 2000), (Ward, 1994). Figure.14. Shows the main interface of the
decision-making tool.
The Excel decision-making support tool was used to compare the results and to make the
decision on selecting the optimum models.
Figure 14. The main interface of the decision-making tool blender 3D and the plug-in Vi-
suite (Southall and Biljecki, 2017)
This methodology comprises four main parts. Namely, they are in order; the research outline
and scientific background. Validating the modeling, and the accuracy of the dynamic
simulation. Study case analysis and diagnosis of the existing building in terms of energy
efficiency. Multi-objective optimizing for indoor comfort performance and energy efficiency
in the study context. Finally applying the combined optimum results.
2.1 First part: research scientific background
A theoretical analysis of the current literature in this topic worldwide and the study context is
analyzed, all revolving on the building facade performance design, its main impacting
parameters, and the design trends. The main goal is to determine the main parameters that
will be used in the optimization approach for the study context.

20
2.2 Second part: Modeling and simulation validation
The validation methodology is carried out in a full apartment located in Biskra city-
Algeria in a hot and dry climate. First, a data logger Mi-sol, Model: WS-HP3001-8MZ
was used by installing five (5) sensors in the apartment to obtain the field measurements
data of dry bulb temperature and humidity, it is conducted from (25th to 29th July
2019). Secondly, a dynamic simulation with VI-Suite add on Blender 3D was affected for
the same apartment using the same meteorological data of the mentioned days. Finally,
the comparison between the field measurement results and the dynamic simulation is
applied to determine the simulation process accuracy.
2.3 Third part: Energy performance diagnosis of the existing social houses in Algeria
This part is based on a quantitative diagnosis of the energy performance of the building
(DEP), which provides information on the amount of energy consumed in terms of heating
and cooling together, with thermal comfort, daylight, and indoor air quality, using the
dynamic simulation tool. The goal is to define the strengths and weaknesses of the building
design in the study context to be optimized.
2.4 Fourth part: Multi-objective Optimization approach for high-performance facade
design
After defining the main impacting parameters of the building facade based on the literature,
as well as analyzing and defining the real problems of the case study. Multi-objective
optimization is headed, by examining the impact of the different facade components on the
building energy consumption, thermal comfort, visual comfort, and indoor air quality. The
key components considered for the optimization are; the parameters of the opening, the wall
structure, and the orientation. To fix the variables in this experience and to develop general
guidelines for building facades design, the application of this optimization is carried out on a
virtual model.
2.5 Fifth part: Optimum results application on existing residential building

21
In this part; the total convenient optimum interactions of the building facade components that
provide the best energy efficiency were summarized and applied in the diagnosed existing
buildings to compare the results of the energy consumption, the thermal comfort, the visual
comfort, and the indoor air quality.
2.6 Research structure
In the below Figure .15. the research structure is demonstrated in a diagrammatic form.
Figure 15. Research structure diagram for the topic

22
3. VALIDATION OF THE MODELING AND THE SIMULATION
ACCURACY
Currently, in the building energy efficiency design field, predictive numerical modeling has
been widely used. It is considered one of the most important decision-making tools in the
environmental design process of any building type. These tools are helping to determine the
appropriate passive design strategies, the Heating, ventilation, and air conditioning (HVAC)
systems, as well as to analyze the building's thermal and energy performance. Thus, the
research methodology is based on a virtual modeling and simulation process for applying
analysis and the optimization approach. Verifying and validating the accuracy of theses
process is necessary to determine the modeling and the programming errors which can occur
in the thermal dynamic simulation.
3.1 Measurement and dynamic simulation tools
The validation methodology is carried out by comparing the thermal dynamic simulation
results with the real field measurements; the simulation results are generated by the decision-
making tools; Blender 3D software for modeling and building information has been included
by the plugin VI-suite that controls the external application Energy Plus. Otherwise, The
measurements data were collected by installing a data logger Mi-sol, Model: WS-HP3001-
8MZ. Figure.16. This data logger provides field measurements data of dry bulb temperature
and humidity levels. Table.1. shows the properties of the used data logger.
Table 1 Datalogger properties
Temperature range Range: -40 - +60°C
Accuracy: +/- 1˚C
Resolution: 0.1˚C
Humidity range Range: 10% - 99%
Accuracy: +/- 5%

23
Figure 16. Data logger used for the Measurements collection (Author)
3.2 Case study location and climate
The study context is located in Algeria, in a Hot and dry climate region, because it represents
the major part of the country 89 % depending on the Köppen-Geiger climate classification,
this climate is characterized by very hot summers and mild winters. The city of Biskra was
selected as a representative city of this climate, it is located in north-eastern of Algeria on the
northern edge of the Sahara Desert at a latitude of 34°48' north and a longitude of 5°44' east,
it rises to an altitude of 86 meters. Figure.17.
Figure 17. Location of the case study
Based on ‘Biskra’ climate station from the weather file ‘Meteonorm 7’, during the year the
average temperatures in this city it is varied by 22.7 °C. The warmest month is July with an
average temperature of 40.2 °C. Moreover, January has the lowest average temperature of the

24
year at 16.7 °C. Furthermore, the highest relative humidity average is in December 60.7%,
while July represents the lowest relative humidity average, it is 26.5%. Figure.18.
(a) Average outside temperature (b) Average outside humidity
Figure 18. Climatic data of the representative city (weather file Meteonorm 7’)
Biskra city is characterized by different periodical and typological residential buildings. This
city is classified by four periods: Traditional, colonial, independence, and contemporary
building (SRITI, 2013). This study is focused on the contemporary Collective residential
building type in Algeria called Social housing. Figure. 19. shows a typical residential
building in the city.
Figure 19. Contemporary residential building in Biskra, Algeria ( Author)

25
3.3 Validation methodology process
The measurement was carried out in an apartment located in Biskra city-Algeria. It is located
on the second floor of a collective house, the exposed facades of the selected apartment are
oriented towards the Southe-East and South-West. The interior environment of this apartment
did not have any internal heat gain due to the absence of any equipment and the occupants,
besides the location, this was the main selection criterion of this apartment to obtain more
thermal precise results. Figure.20.
Furthermore, the measurements were collected by installing five (5) sensors in the apartment
( in the Living room, the two bedrooms, the kitchen, and the entrance hall). The process was
conducted from (25th
to 29th
July 2019), these days represent the hottest days of the
summer in this context.
Secondly, a thermal dynamic simulation with VI-Suite add on Blender 3D was affected for
the same apartment using the same meteorological data of the mentioned days to generate
dry-bulb temperature and humidity levels in the different zones. Finally, the comparison
between the field measurement results and the dynamic simulation was applied to verify the
agreement degree.
(a) plan of the floor (b) Plan of the apartment
Figure 20. illustration of the apartment position and plan (Author)
3.4 Validation results and discussion
The results in the entrance hall as it is illustrated in Figure.21. and Figure .22. shows
excellent agreement between both simulation and measurement data in all the measured days,
this is due to the façade configuration of the entrance hall that has an opening to the outside.

26
This means that the inputs of the simulation were nearly the same as the real build
environment.
Figure 21. Comparison of the Dry-bulb temperature results in the entrance hall
Figure 22. Comparison of the Humidity results in the entrance hall
The results of the bedroom n°1 as it is illustrated in Figures 23, 24 .show that there is a
difference in the dry-bulb temperature between the simulation and the measurements, the
simulation data was higher than the measurements. However, the 1st-day a small difference
was obtained because of the installation process of the sensors including; the opening of the
doors by the installers which were not considered in the simulation, as well as their metabolic
0
5
10
15
20
25
30
35
40
45
2019.07.25 0:00 2019.07.25 12:00 2019.07.26 0:00 2019.07.26 12:00 2019.07.27 0:00 2019.07.27 12:00 2019.07.28 0:00 2019.07.28 12:00 2019.07.29 0:00 2019.07.29 12:00 2019.07.30 0:00
Dry
-bu
lb t
emp
erat
ure
C°
Time/ day
ENTRANCE HALL- Temperature
T C° Measurements T C° simulation
0
5
10
15
20
25
30
35
40
2019.07.25 0:00 2019.07.25 12:00 2019.07.26 0:00 2019.07.26 12:00 2019.07.27 0:00 2019.07.27 12:00 2019.07.28 0:00 2019.07.28 12:00 2019.07.29 0:00 2019.07.29 12:00 2019.07.30 0:00
Dry
-bu
lb t
emp
erat
ure
C°
Time /day
ENTRANCE HALL- Humidity
Humidity Measurments Humidity simulation

27
rate impacted the humidity levels. Whereas, the humidity shows a good agreement in the last
4 days.
Figure 23. Comparison of the Dry-bulb temperature results in Bedroom n°1
Figure 24. Comparison of the Humidity results in Bedroom n°1
The Figures 25, 26 illustrate the results of the bedroom n°2, The same results have been
obtained as the bedroom n°1 for the dry-bulb temperature, whereas, the fluctuation of the
humidity in the simulation were slightly changed in the different days, which was not the
same for the real case.
34
34,5
35
35,5
36
36,5
37
37,5
38
38,5
39
2019.07.25 0:00 2019.07.25 12:00 2019.07.26 0:00 2019.07.26 12:00 2019.07.27 0:00 2019.07.27 12:00 2019.07.28 0:00 2019.07.28 12:00 2019.07.29 0:00 2019.07.29 12:00 2019.07.30 0:00
Dry
-bu
lb t
emp
erat
ure
C°
Time /day
ROOM 1 Temperature
T C° Measurements T C° Simulation
0
5
10
15
20
25
30
2019.07.25 0:00 2019.07.25 12:00 2019.07.26 0:00 2019.07.26 12:00 2019.07.27 0:00 2019.07.27 12:00 2019.07.28 0:00 2019.07.28 12:00 2019.07.29 0:00 2019.07.29 12:00 2019.07.30 0:00
Dry
-bu
lb t
emp
erat
ure
C°
Time /day
Room 1 Humidity
Humidity Measurments Humidy Simulation

28
Figure 25. Comparison of the Dry-bulb temperature results in Bedroom n°2
Figure 26. Comparison of the Humidity results in Bedroom n°2
Figures.27, 28 show the results of the kitchen, which illustrate a good agreement between
both the thermal simulation and the measurement data for all the different days.
34
34,5
35
35,5
36
36,5
37
37,5
38
38,5
39
2019.07.25 0:00 2019.07.25 12:00 2019.07.26 0:00 2019.07.26 12:00 2019.07.27 0:00 2019.07.27 12:00 2019.07.28 0:00 2019.07.28 12:00 2019.07.29 0:00 2019.07.29 12:00 2019.07.30 0:00
Dry
-bu
lb t
emp
erat
ure
C°
Time/day
ROOM 2 - Temperature
T C° Measurments T C° simulation
0
5
10
15
20
25
30
35
2019.07.25 0:00 2019.07.25 12:00 2019.07.26 0:00 2019.07.26 12:00 2019.07.27 0:00 2019.07.27 12:00 2019.07.28 0:00 2019.07.28 12:00 2019.07.29 0:00 2019.07.29 12:00 2019.07.30 0:00
Dry
-bu
lb t
emp
erat
ure
C°
Time /day
ROOM 2-Humidity
Humidity Measurments Humidity Simulation

29
Figure 27. Comparison of the Dry-bulb temperature results in the Kitchen
Figure 28. Comparison of the Humidity results in Kitchen
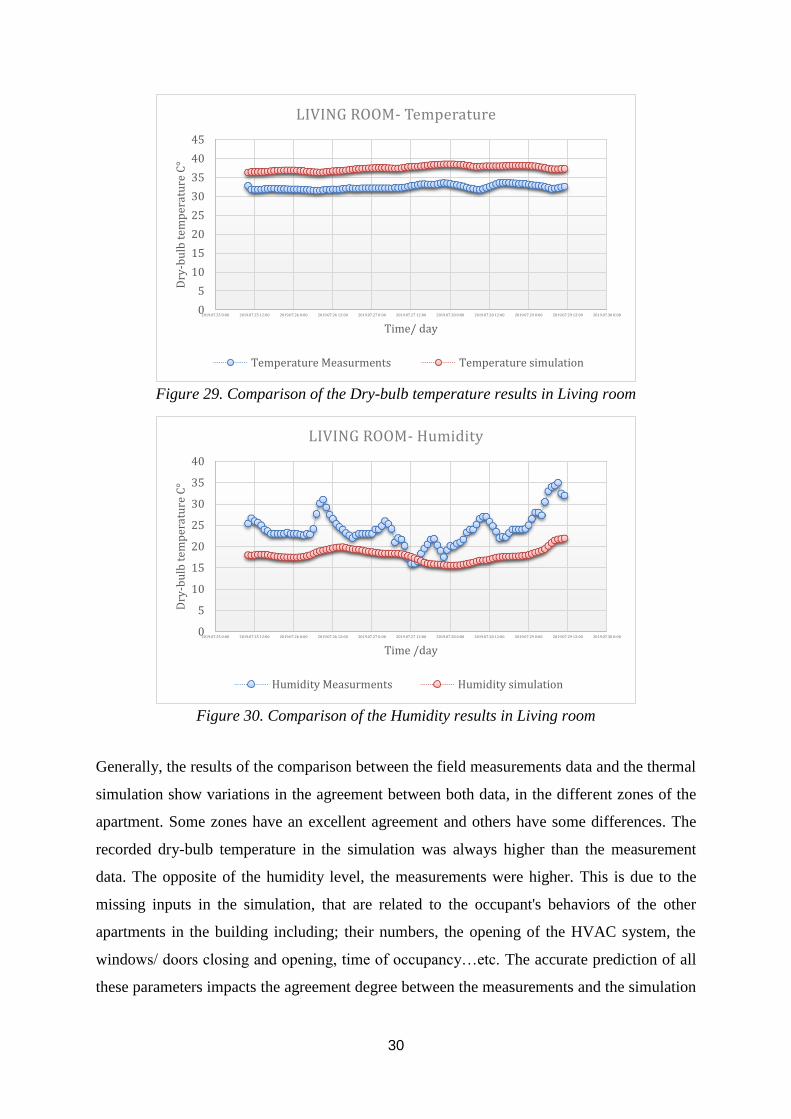
For the living room as it is illustrated in Figures 29, 30 shows a good agreement in terms of
temperature fluctuations, but there is a difference of 5 c° between the average temperature of
the simulation and the measurements. However, the humidity level shows that the
measurements were higher than the simulation.
0
5
10
15
20
25
30
35
40
45
2019.07.25 0:00 2019.07.25 12:00 2019.07.26 0:00 2019.07.26 12:00 2019.07.27 0:00 2019.07.27 12:00 2019.07.28 0:00 2019.07.28 12:00 2019.07.29 0:00 2019.07.29 12:00 2019.07.30 0:00
Dry
-bu
lb t
emp
erat
ure
C°
Time /day
KITCHEN- Temperature
T C° Measurments T C° Simulation
0
5
10
15
20
25
30
35
40
2019.07.25 0:00 2019.07.25 12:00 2019.07.26 0:00 2019.07.26 12:00 2019.07.27 0:00 2019.07.27 12:00 2019.07.28 0:00 2019.07.28 12:00 2019.07.29 0:00 2019.07.29 12:00 2019.07.30 0:00
Dry
-bu
lb t
emp
erat
ure
C°
Time /day
KITCHEN- Humidity
Humidity Measurments HUMIDITY SIMULATION
30
Figure 29. Comparison of the Dry-bulb temperature results in Living room
Figure 30. Comparison of the Humidity results in Living room
Generally, the results of the comparison between the field measurements data and the thermal
simulation show variations in the agreement between both data, in the different zones of the
apartment. Some zones have an excellent agreement and others have some differences. The
recorded dry-bulb temperature in the simulation was always higher than the measurement
data. The opposite of the humidity level, the measurements were higher. This is due to the
missing inputs in the simulation, that are related to the occupant's behaviors of the other
apartments in the building including; their numbers, the opening of the HVAC system, the
windows/ doors closing and opening, time of occupancy…etc. The accurate prediction of all
these parameters impacts the agreement degree between the measurements and the simulation
0
5
10
15
20
25
30
35
40
45
2019.07.25 0:00 2019.07.25 12:00 2019.07.26 0:00 2019.07.26 12:00 2019.07.27 0:00 2019.07.27 12:00 2019.07.28 0:00 2019.07.28 12:00 2019.07.29 0:00 2019.07.29 12:00 2019.07.30 0:00
Dry
-bu
lb t
emp
erat
ure
C°
Time/ day
LIVING ROOM- Temperature
Temperature Measurments Temperature simulation
0
5
10
15
20
25
30
35
40
2019.07.25 0:00 2019.07.25 12:00 2019.07.26 0:00 2019.07.26 12:00 2019.07.27 0:00 2019.07.27 12:00 2019.07.28 0:00 2019.07.28 12:00 2019.07.29 0:00 2019.07.29 12:00 2019.07.30 0:00
Dry
-bu
lb t
emp
erat
ure
C°
Time /day
LIVING ROOM- Humidity
Humidity Measurments Humidity simulation

31
results. Otherwise, since the agreement has been obtained in some zones in the apartment,
that means the modeling method with Vi-suit add on Blender 3D is precise enough and it can
be used to fulfill the research main goal, Therefore, all the other parameters in the other
apartments in the building will be neglected and considered as fix variables in the research
simulation methodology.
4. BUILDING ENERGY PERFORMANCE DIAGNOSIS OF THE
EXISTING RESIDENTIAL BUILDING FACADE IN ALGERIA
In this section, an analysis of the current situation of the existing residential buildings in the
study context in a hot and dry climate is presented to investigate the weakness and strength of
the Algerian building design in terms of building energy efficiency. A referential building has
been chosen, to carried out the diagnosis. Furthermore, to evaluate the energy consumption,
thermal comfort, indoor air quality, as well as visual comfort the simulation with Energy plus
and radiance software was used through Vi-suite add-on Blender 3D.
An existing building in Biskra city was selected as a referential model, it represents the most
widely constructed building typology in the city based on the study of (TIBERMACINE,
2016). Also, This building reference is located in an urban area, the implementation is
oriented within the axis North-east and South-west. This building is a multiple-dwelling unit,
that contains 8 apartments and all the apartments have a similar spatial distribution; living
room, two rooms, kitchen, laundry room, toilet, and bathroom. The total area of one
apartment is 92.13 m², with a ceiling height of 2.70 m. Figure.31. 32.
Figure 31. a) Location of the building; b) Reference building model

32
Figure 32. Plan and section of the social house reference
The materials applied for the facades are concrete blocks and plasterboard, the plaster is used
for the coating. Currently, these materials are less used in the Algerian residential building
factory, therefore the concrete blocks were replaced by double hollow brick in this study
because it is the most commonly used in the last years. Table.2. shows the detailed thermal
properties of the material used in the diagnosis based on the Algerian thermal regulation of
residential buildings (D.T.R C 3-2).(“12-DTR-C-3.2.pdf,” n.d.)
Table 2 Conventional wall Thermal properties
Material
(mm)
Conductivity(
W/m-K)
Thickn
ess
(mm)
Specific
Heat
capacity
(J/kg-K)
Densit
y
(kg/m3
)
Cement
Mortar 1.4 20 1080 2200
Hollow Brick 0.48 150 936 589
Air gap 0.026 50 1000 1
Hollow Brick 0.48 100 936 625
Plaster 0.35 20 936 875
4.1 Input data and boundary conditions for the simulation process
The current methodology is based on a quantitative diagnosis of the energy performance of
the building (DEP), it provides information on the amount of energy consumed in terms of
heating and cooling together, with thermal comfort, daylight, and indoor air quality. The
diagnosis is carried out by using dynamic simulation with Blender 3D software for modeling,

33
and building information has been included by the plugin VI-suite that controls the external
applications Radiance, Energy Plus. Figure.33. shows the diagnosis process used in this
study.
Figure 33. Diagnosis of energy performance process related to building facade components
The inputs of the climate data used in the simulation are based on ‘Biskra’ climate station
from the weather file ‘Meteonorm 7’.
Before running the diagnosis a sunlit-time simulation is applied in the selected building, the
aim is to define the worst apartment that has the highest level of solar gain. The results show
that the most exposed apartment to solar radiation is the apartment on the fourth floor which
oriented to the southwest. The exposure of this apartment during the day reached 70%, it is
the maximum level compared to other facade orientations. Figure.34.

34
Figure 34. Sunlit time simulation results
The assessment of the energy consumption is conducted by insertion of the Heating,
Ventilation, and Air conditioning system (HVAC); and it is applied in the upper apartment
which is the most exposed in the selected block. The simulation period has been carried out
in the whole year (from 01 January to 31 December). To analyze each space in the
apartment, the building boundary is specified in sixteen (16) zones; six (6) zones with an
HVAC system (hall, 2 bedrooms, living room, kitchen, and bathroom / WC) and eight (8)
zones without HVAC (laundry, entrance and the seven (7) other apartments in the building),
The analysis is carried out for the 6 zones that have an HVAC system. The balconies’ setting
was inserted as shading elements. Additionally, the building cooling-heating service system
setting was inserted based on the Algerian Regulatory technical document, the cooling
system turns on if the temperature is above 25 °C, while the heating system turns on when the
temperature is less than 20 c °. The selected building is built during the eighties (’80s), thus
the infiltration rate (ACH) was inserted 10.
Meanwhile, the analytical methodology adopted for thermal comfort is based upon the
Fanger’s model that includes Predicted Mean vote (PMV) and Predicted Percentage of
Dissatisfied (PPD) (Fanger, 1972). PMV refers to the thermal sensation scale that includes
seven (7) levels from (-3) to (+3) as follows; -3= Cold, -2 = Cool, -1= Slightly cool, 0=
Neutre, 1= Slightly warm, 2= Warm, 3= Hot, while In extreme real weather conditions, PMV

35
can be higher than +3 or lower than –3 (Mayer and Hoppe, 1987). The recommended
accepted PPD and PMV range for thermal comfort is introduced by the International
standard ISO 7730, five methods developed upon the Fanger comfort model. This standard
proposed three categories called A, B, and C for Category A, PMV is comprised in the
interval [-0.2, +0.2], PPD ≤ 6%; for Category B, in the interval [-0.5, +0.5], PPD ≤ 10%, and
for Category C, in the interval [-0.7, +0.7], PPD ≤ 15%. (Carlucci, 2013). Thes PMV ranges
have come from temperate climate countries, however, the occupants in warm climatic
conditions have different heat endurance capabilities. Consequently, (Ole Fanger and Toftum,
2002) proposed an extension of the PMV model for the warm climate countries for non-air
conditioning buildings, as a result, the extended thermal comfort range is between [-1, +1],
PPD= 80 % of people which satisfied within this range. Finally, this range will be used for
the analysis in the study context.
The potential of the simulation software has been used to calculate the PMV/PPD indices. In
this phase of the analysis, 2 zones (living room, Room 1) in the upper apartment were
specified to be analyzed, assuming two occupants and one occupant respectively, and no
mechanical system has been applied in the zones.
Furthermore, the diagnosis is concerning also on the daylight comfort which is related to the
window to wall ratio (WWR). Thus, two main factors have been used to assess the visual
comfort performance; the illuminance levels that concerning the amount of light that falls on
a surface per unit area, measured in lux (Lumen per square m²). Additionally, the light
uniformity, which is usually defined as the ratio of the minimal illuminance over the area-
weighted average illuminance, see equation (1).
𝑈 = 𝐸 𝑚𝑖𝑛÷ 𝐸 𝐴𝑣𝑒𝑟𝑎𝑔𝑒 (1)
The analysis is applied for the living room and Room 1in two design days (21 December and
21 June) form the sunrise to the sunset for both days. The results are compared with the
standard of Building Research Establishment Environment Assessment Method (BREEAM)
that provides information about the required daylight, to ensure best practice in visual
performance and comfort for building occupants. The recommended average daylight
illuminance over interspace should be At least 100 lux for 3450 hours per year or more, and
the minimum at the worst point At least 30 lux for 3450 hours per year or more, also the
minimum area to comply should be 100%. Besides the daylight uniformity at least 0.3.

36
Finally, the analysis of the indoor air quality (IDQ) is focused on evaluating the amount of
the carbon dioxide ( CO2) concentration, which considered one of the indicators of the air
quality within the indoor environment, The American Society of Heating, Refrigerating and
Air-Conditioning Engineers (ASHRAE) standard determined the optimal level of the CO2
concentration which should be ≥1000 ppm.
The analysis has been set up in two zones (the living and the Room 1), assuming 2 occupants
in the Livingroom and 1 occupant in the Room 1, and the windows opening/closing was set
up based on a normal family house activities. Those are open on weekdays between 7.20 am
to 7.30 am and from 16.20 to 16.30, as well as the unoccupancy time is defined between 7:30
to 16;20. On the weekends, it is assumed that the occupants are staying all the time in the
apartment and the windows are opened between (07:20 am to 07:30 am, 12:00 pm to 12:10
pm, and 16:20 to 16:30.).
4.2 Simulation results evaluation and discussion
4.2.1 Energy consumption evaluation
The simulation results of the energy consumption showed that 89% of the total energy
consumption was used on cooling, while 11 % was used on heating. Figure.35.
The comparison of the energy consumed in heating and cooling shows a variation in each
different zone, this is due to the zone’s position in the apartment, the different surface areas
that have direct contact with the outside and its orientation.
The bathroom has the highest cooling energy consumption, followed by the kitchen, the
living room, the hall, Room1, Room2 which includes the balcony has less consumed energy.
The cooling consumption in the bathroom reached 287.19 kW/m2, it has direct contact with
the entrance hall that has a fully glazed façade which increased the greenhouse effect in the
entrance hall and impacts directly the bathroom. In the kitchen, the assumed energy is 183.16
kWh/m2, the main façade of this zone is oriented to the south-west which has a higher solar
gain. The living room has 173.01 kWh/m 2, it has 2 facades one oriented to the south-east,
and the other is oriented to the south-west. The cooling consumption in the hall reached
172.37 kWh/m2 because it is surrounded by the different spaces, during the day the heat is
accumulated, which means there is no effective air circulation. The bedrooms are both
oriented to the north-west façade but the energy consumption in Room1is higher than
Room2, 158.09 kW/m2, 155.29 kW/m2 respectively, this is revealed that the balcony as a

37
shading element has an impact on minimizing the solar heat gain, therefore the energy
consumption. For the heating consumption, the kitchen has the highest heating energy
consumption 49.49 kWh/m2, followed by the Room 1; 23.02 kWh/m
2, and the Room 2;
22.92 kWh/m2, the bathroom 19.53 kWh/m2, the hall 18.61 kWh/m
2, and the living room that
has less heating consumption 8.96 kWh/m2. The heating and cooling consumption show
reversed results according to orientation and solar gain; the more exposed zone to solar gain,
the less heating, and more cooling it consumes. Figure.36.
Figure 35. The energy consumption of the upper apartment in a whole year.
Figure 36. The cooling and heating consumption of all the simulated zones

38
4.2.2 Thermal comfort analysis
The diagnosis of thermal comfort is also applied in the living room and the Room1. The
resulting analysis of the PMV/PPD indices for the given zones shows that; based on the PMV
people are feeling very hot almost all the summer period (June, July, August), in the winter
(January, February, and December) they are feeling cold to very be cold, the feelings are
approached the comfort zone in some days of the mouths (March, April, May, and October).
Furthermore, the comfort hours for the whole year are reached 1437 Hours and 1219 Hours
for the living room and Room 1 respectively. The comfort range is defined between -1< PMV
<+1, and the feelings above this range are uncomfortable, the discomfort hours are attained
7323 Hours in the living room and 7541 Hours in room 1, Figure.37. Illustrate the scale of
occupant's sensation from very cold feelings +6 to very hot -6, while zero expresses neutral
feelings.
Moreover, the PPD indicates that more than 90% of people are not satisfied almost all the
summer and winter periods, while in March and April it varied between 10 % to 70% for both
the living room and Room1. Figure.38.
(a) The PMV scale (b) the comfort/ discomfort hours -1< PMV <+1
Figure 37. The indices PMV for the living room

39
Figure 38. PPD results for the living room and Room 1
4.2.3 Daylighting availability analysis
The daylight analysis which carried out in the Room 1 and the living room in winter and in
summer shows that the minimum illuminance for the living room reached maximum 20 lux in
the summer and 10 lux in the winter, and the Room 1 reached in the summer 10 lux, while in
the winter 5 lux, both zones have less than the minimum illuminance required by the
BREEAM standard which is 30 lux at the worst point. Meanwhile, the optimal average
daylight illuminance in the BREEAM standard is 100 lux, both zones have more illuminance
levels than the standard, in summer, the living room reached 160 lux and the Room 1 reached
125 lux, while in winter both zones have less than the standard illuminance, the living room
87.5 lux, and the Room 1 62.5 lux. Figure.39. In addition, the results revealed that there is a
uniformity problem in the zones as is illustrated in the graphs of Figure.40. which indicates
that the uniformity of both zones in summer and winter is less than the uniformity value (0.3)
which is required by the BREEAM standard.

40
illuminance in the winter (December), (a) illuminance in the summer (June)
Figure 39. Daylight illuminance comparison between bream standard and the Living room
and Room 1
(a) uniformity in June, (b) uniformity in December
Figure 40. Daylight uniformity comparison between bream standard and the Living room
and Room 1 results

41
4.2.4 Indoor air quality analysis
The CO2 concentration analysis is applied in Room 1 and the living room and the results are
compared with the ASHRAE standard (American Society of Heating, Refrigerating, and Air-
Conditioning Engineers), that determined the optimal level 1000 ppm of CO2 concentration.
The results show that the living room has higher CO2 concentration levels than Room 1. The
levels are varied between 500 to 4000 PPM as a maximum level for the whole year.
A reduction of the CO2 concentration is presented during windows were open, it reached
1000 to 2500 ppm, while when the windows were closed, the concentration exceeded the
recommended value of 1000 ppm as it is indicated by the ASHRAE standard. Fig.8 illustrate
the variation of the CO2 concentration in the whole year. The best hours of CO2
concentration is reached 3647 Hours and 4009 Hours in the living room and the room1
respectively in the whole year, while the CO2 concentration that is above the standard 1000
ppm is reached 5113 Hours and 4751 Hours in the living room and the room1. Figure.41.
shows the CO2 concentration in the whole year together with the hours of
comfort/discomfort.
(a) CO2 concentration in the whole year, (b) CO2 ≥1000 ppm
Figure 41. The CO2 concentration in the living room and Room 1 for the whole year.
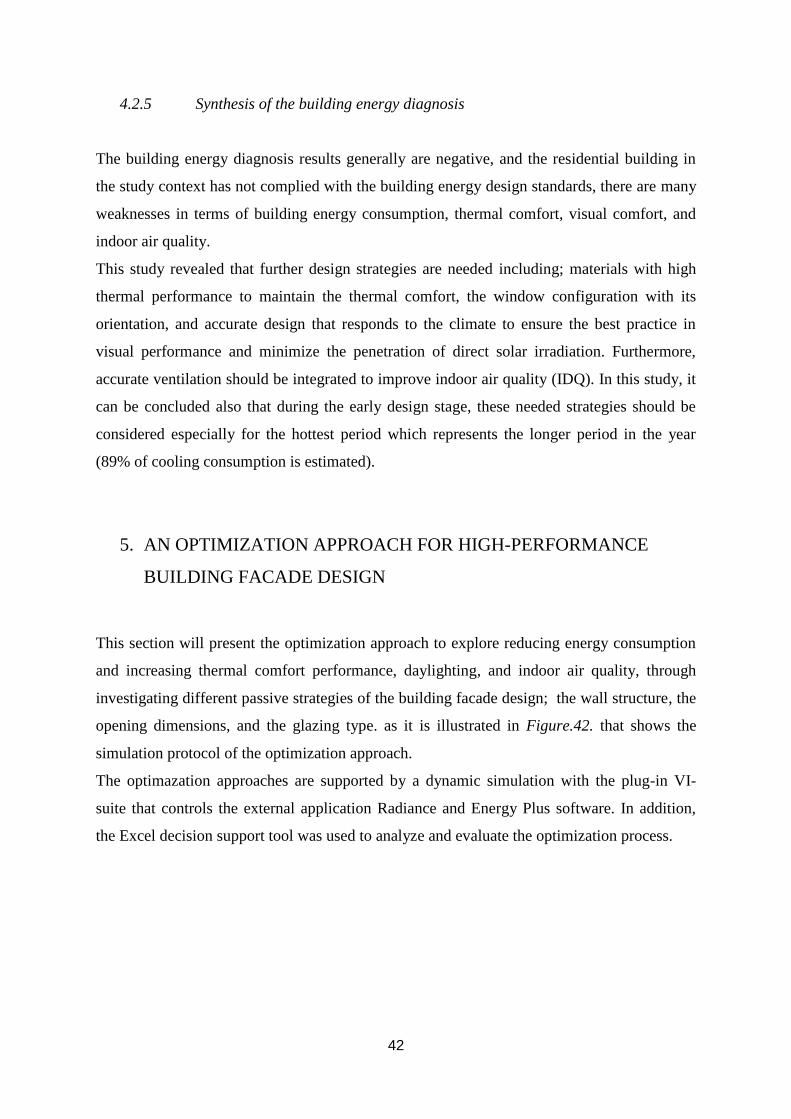
42
4.2.5 Synthesis of the building energy diagnosis
The building energy diagnosis results generally are negative, and the residential building in
the study context has not complied with the building energy design standards, there are many
weaknesses in terms of building energy consumption, thermal comfort, visual comfort, and
indoor air quality.
This study revealed that further design strategies are needed including; materials with high
thermal performance to maintain the thermal comfort, the window configuration with its
orientation, and accurate design that responds to the climate to ensure the best practice in
visual performance and minimize the penetration of direct solar irradiation. Furthermore,
accurate ventilation should be integrated to improve indoor air quality (IDQ). In this study, it
can be concluded also that during the early design stage, these needed strategies should be
considered especially for the hottest period which represents the longer period in the year
(89% of cooling consumption is estimated).
5. AN OPTIMIZATION APPROACH FOR HIGH-PERFORMANCE
BUILDING FACADE DESIGN
This section will present the optimization approach to explore reducing energy consumption
and increasing thermal comfort performance, daylighting, and indoor air quality, through
investigating different passive strategies of the building facade design; the wall structure, the
opening dimensions, and the glazing type. as it is illustrated in Figure.42. that shows the
simulation protocol of the optimization approach.
The optimazation approaches are supported by a dynamic simulation with the plug-in VI-
suite that controls the external application Radiance and Energy Plus software. In addition,
the Excel decision support tool was used to analyze and evaluate the optimization process.

43
Figure 42. Simulation protocol for the optimization approach
To fulfill the research’s main goal; as well as to have accurate control of the different
dependent and independent variables of the simulation protocol, a virtual model has been
designed based on standard room dimensions (3.00 m × 3.00 m × 4.30 m). All the different
scenarios are applied in this model. Figure.43.
Figure 43. Virtual model

44
5.1 An optimization approach for the conventional wall structure
After creating the base model. The first step in the optimization process was choosing
alternative materials and structures that have the potential of optimizing the thermal
performance of the existing wall structure of the Algerian residential building. Table.3. shows
the conventional wall structure and the materials used. Then, all the selected scenarios have
been simulated, and the simulation results have been compared with the base model, the
Excel tool was used for comparing the results with the base model.
Table 3. Conventional wall structure and materials
Wall layers Shema Image of the material
Cement mortar (0.2cm)
Hollow brick (15 cm)
Air gap (0.5cm)
Hollow brick (5 cm)
Plaster (0.2 cm)
In this investigation, the wall structure and materials are changed; the overall obtained
thickness of the wall is proposed to be (44 cm), adding (10 cm) between the two layers of the
hollow brick, as well as proposing other materials to replace the air gap. All these materials
are selected based on; their thermal characteristics, Ecological aspect, Availability aspect.
And smart material. Figure.44.

45
Figure 44. Selection criteria for the wall structure alternatives
As a result, these materials are including; various Brick types, Concrete, Stone, Sand, Phase
change material (PCM),Earth materials and thermals insulations. The materials which are
currently used and the potential to be used are systemized in Table.4. All the thermal
characteristics (Conductivity, Density, Specific Heat) are defined based on (ASHRAE
standard, Algerian thermal regulations).
Table 4. Thermal and physical properties of the investigated alternative wall material
Thickness (m) Conductivity Density
(Kg/m)
Specific heat
Solid Brick 0.15 1.00 1800.00 936.00
Honeycomb Brick 0.15 0.27 1700.00 1000.00
Unfired Clay Brick 0.15 0.90 2500.00 1426.00
Common Earth 0.15 1.28 1460.00 879.00
Rammed Earth 0.15 1.25 1540.00 1260.00
Hempcrete 0.15 0.09 330.00 2100.00
Sand Material 0.15 0.20 1500.00 700.00
Sandstone Block 0.15 1.83 2200.00 712.00
Limestone Block 0.15 1.30 2180.00 720.00
stone block 0.15 1.90 2350.00 792.00
Tuff Material 0.15 0.40 1400.00 800.00
Gravel 0.15 1.28 1460.00 879.00
Aerated Concrete
Block 0.15 0.24 750.00 1000.00

46
Inner Concrete Block 0.15 0.51 1400.00 1000.00
M02 150mm
Lightweight Concrete
Block 0.15 0.49 512.00 880.00
M14 150mm
Heavyweight Concrete
Block 0.15 1.95 2240.00 900.00
Screed ( Cement
Mortar) 0.15 0.41 1200.00 2100.00
Expanded polystyrene
(EPS) 0.15 0.04 15.00 1000.00
(PCM): DuPont
Energain 0.15 0.16 850.00 2500.00
Rockwool 0.15 0.04 300.00 1000.00
5.1.1 Energy demand and thermal performance simulation results & discussion
The first step of the analysis is to compare the impact of the different wall structures on the
cooling and heating demand. The various alternative materials are tested and compared to the
base model (conventional wall structure), using a thermal dynamic simulation tool Energy
Plus which is controlled by the Vi-suite Plug-in that uses the free open source Blend 3D. All
the obtained results of the colling and heating demand are illustrated in Figure.45. and 46.
The results showed that for both heating and cooling demand, the Rockwool and the
Expanded polystyrene (EPS) are the best in terms of energy demand.

47
Figure 45. Cooling demand comparison for the different wall materials
Figure 46. Heating demand comparison for the different wall materials
0 200 400 600 800 1000 1200 1400
Hollow Brick : Base model
Solid Brick
Honeycomb Brick
Unfired Clay Brick
Common Earth
Rammed Earth
Hempcrete
Sand Material
Sandstone Block
Limestone Block
stone block
Tuff Material
Gravel
Aerated Concrete Block
Inner Concrete Block
M02 150mm Lightweight Concrete Block
M14 150mm Heavyweight Concrete Block
Screed ( Cement Mortar)
Expanded polystyrene (EPS)
(PCM): DuPont Energain
Rock wool
Colling demand kWh
Wal
l mat
eria
l
0 50 100 150 200 250
Hollow Brick : Base model
Solid Brick
Honeycomb Brick
Unfired Clay Brick
Common Earth
Rammed Earth
Hempcrete
Sand Material
Sandstone Block
Limestone Block
stone block
Tuff Material
Gravel
Aerated Concrete Block
Inner Concrete Block
M02 150mm Lightweight Concrete Block
M14 150mm Heavyweight Concrete Block
Screed ( Cement Mortar)
Expanded polystyrene (EPS)
(PCM): DuPont Energain
Rock wool
Heating demand kWh
Wal
l mat
eria
l

48
The analytical methodology adopted for thermal comfort is based upon the model of Fanger
(PMV/PPD) that is described in the previous chapter. Using the potential of Energy plus
software. In this study, the thermal comfort is categorized into the best comfort hours, and the
unacceptable comfort hours, all compared in terms of the occupancy hours during the whole
year (8760h), the Comfort range is determined in this context between (25 °C and 30 °C)
which is represented in the scale (-1≥ PMV≤+1).
The results show that all the alternatives provide better thermal comfort than the base model.
As well as the aerated concrete block has more comfort hours that the other alternatives.
Figure.47.
Figure 47. The best thermal comfort hours during the year (8760h) (-1≥ PMV≤+1).
1363
1392
1404
1387
1376
1384
1401
1415
1381
1385
1377
1419
1376
1429
1412
1392
1375
1397
1377
1400
1385
10001050110011501200125013001350140014501500
Hollow Brick : Base model
Solid Brick
Honeycomb Brick
Unfired Clay Brick
Common Earth
Rammed Earth
Hempcrete
Sand Material
Sandstone Block
Limestone Block
stone block
Tuff Material
Gravel
Aerated Concrete Block
Inner Concrete Block
M02 150mm Lightweight Concrete Block
M14 150mm Heavyweight Concrete Block
Screed ( Cement Mortar)
Expanded polystyrene (EPS)
(PCM): DuPont Energain
Rock wool
Comfort hours
Wal
l mat
eria
l

49
For the unacceptable comfort hours, the results show that the heavyweight concrete block,
Earth and Gravel, Stone block, and the Expanded polystyrene (EPS) have the highest
unacceptable comfort hours in the year. Figure.48.
Figure 48. The unacceptable thermal comfort hours during the year (8760h)
The synthesis of the previous findings shows that the best material in terms of Energy
demand did not provide the best thermal comfort hours. This contradiction is due to the
thermal properties of the wall materials, as it is illustrated in Table.5. Similarity /unsimilarity
of the color’s degrees indicate the thermal relationship between the whole aspects; Thermal
mass, Specific heat, Density, saved energy demand, and the optimize thermal comfort.
Figure.49.
The analysis revealed that conductivity was the main influential parameter on the energy
demand; the material that has the lowest thermal conductivity provides the highest heating
7397
7368
7356
7373
7384
7376
7359
7345
7379
7375
7383
7341
7384
7331
7348
7368
7385
7363
7383
7360
7375
7000 7050 7100 7150 7200 7250 7300 7350 7400
Hollow Brick : Base model
Solid Brick
Honeycomb Brick
Unfired Clay Brick
Common Earth
Rammed Earth
Hempcrete
Sand Material
Sandstone Block
Limestone Block
stone block
Tuff Material
Gravel
Aerated Concrete Block
Inner Concrete Block
M02 150mm Lightweight Concrete Block
M14 150mm Heavyweight Concrete Block
Screed ( Cement Mortar)
Expanded polystyrene (EPS)
(PCM): DuPont Energain
Rock wool
Uncomfort hours
Wal
l mat
eria
ls

50
and cooling energy saving. However, Thermal mass, Density, and specific heat proprieties of
the materials did not provide a prediction for the material’s thermal performance during the
steady-state analysis.
Figure 49. Colors degree indices for the thermal properties analysis
Table 5 Correlation between the material thermal properties and energy/thermal
performance
Materials
Saved
Heating
Saved
Cooling
thermal
comfort
Conduc
tivity density
specific
heat
Therma
l mass
Solid Brick 9.45 -7.41 11.38 1 1800 936
303264
0
Honeycomb Brick 24.56 -19.47 6.91 0.27 1700 1000
306000
0
Unfired Clay Brick 14.35 -8.91 8.77 0.9 2500 1426
641700
0
Common Earth 6.17 -5.7 11.47 1.28 1460 879
231001
2
Rammed Earth 8.01 -6.21 10.79 1.25 1540 1260
349272
0
Hempcrete 49 -34.73 -1.77 0.09 330 2100
124740
0
Sand Material 34.73 -24.22 5.06 0.2 1500 700
124740
0
Sandstone Block 6.81 -5.78 11.38 1.83 2200 712
189000
0
Limestone Block 6.81 -5.78 11.21 1.3 2180 720
282528
0
stone block 4.84 -4.17 11.47 1.9 2350 792
335016
0

51
Tuff Material 20.91 -15.39 11.3 0.4 1400 800
201600
0
Gravel 28.17 -19.81 11.47 1.28 1460 879
231001
2
Aerated Concrete
Block 29.97 -21.59 8.43 0.24 750 1000
135000
0
Inner Concrete
Block 17.53 -12.91 11.72 0.51 1400 1000
252000
0
M02 150mm
Lightweight
Concrete Block 14.7 -12.6 10.29 0.49 512 880 811008
M14 150mm
Heavyweight
Concrete Block 5.03 -4.15 11.05 1.95 2240 900
362880
0
Screed ( Cement
Mortar) 23.57 -15.7 7.42 0.41 1200 2100
453600
0
Expanded
polystyrene (EPS) 64.67 -44.83 -9.02 0.04 15 1000 27000
(PCM): DuPont
Energain 41.56 -27.63 2.78 0.16 850 2500
382500
0
Rockwool 63.99 -44.38 -8.09 0.04 300 1000 540000
Figure.50. and 51. illustrate the above explication by a direct correlation between the
conductivity and the energy demand; as well as the thermal mass and the thermal comfort.
0,00
0,50
1,00
1,50
2,00
2,50
-10,00
0,00
10,00
20,00
30,00
40,00
50,00
60,00
70,00
Heating Cooling Conductivity

52
Figure 50. Correlation between the thermal mass and the thermal comfort
Figure 51. Correlation between the thermal conductivity and the energy demand
5.1.2 Performance analysis of the different wall materials
The performance analysis of the alternative wall materials is applied based on a comparison
with the base model regarding the energy performance, and thermal comfort aspects in an
interactive method.
The Rockwool insolation shows a significant reduction of the cooling energy demand reached
64 %, the heating demand 41%. Approximately the same results for the Expanded
polystyrene (EPS) isolation. Followed by the Hempcrete; 49 % of cooling reduction, 31 % of
heating demand reduction, the smart material PCM shows a reduction of 42 % of cooling
demand, while, 23 % of heating demand. Furthermore, The different types of brick material
results represent a variation on the reduction of the colling demand between 1 %, and 14 %,
while the heating between 10% and 26%. Also, the Sand materials; the energy-reduced is
between 10 %, 19% for cooling, 21%, 35% for heating. The concrete blocs' impact on the
cooling demand is estimated between 10%, 16%. while for heating between 5%, 30%. Earth
and Stone’s materials present a minimal reduction in the energy demand compared to the
other alternatives, while it has the best increase in thermal comfort. Otherwise, Due to the
severe climatic conditions in the hottest period, the thermal comfort is slightly optimized in
the whole year for all the investigated wall materials, instead of the heavyweight concrete, the
0,00
1,00
2,00
3,00
4,00
5,00
6,00
7,00
8,00
0,00
1000000,00
2000000,00
3000000,00
4000000,00
5000000,00
6000000,00
7000000,00
Thermal mass Comfort

53
stone block, the Limestone, sandstone block, and the earth which have a negative impact on
the thermal comfort and was the worst in terms of energy demand. Figure.52. illustrated the
interactive performance comparison between the three evaluated aspects (Thermal comfort,
Heating, and Cooling demand).
Figure 52. Interactive performance comparison between the different wall materials
5.1.3 Optimum material determination
The investigated alternatives showed contradictory results, in terms of thermal comfort and
energy demand aspects. To determine the optimum material, this section presents a crucial
step of the optimization approach, a virtual digital value from one to five was assumed to
-9,45
-24,56
-14,35
-6,17
-8,01
-49,00
-34,73
-6,81
-6,81
-4,84
-20,91
-28,17
-29,97
-17,53
-14,70
-5,03
-23,57
-64,67
-41,56
-63,99
-1,44
-14,28
-3,04
0,38
-0,17
-30,52
-19,34
0,29
0,29
2,00
-9,93
-14,64
-16,53
-7,30
-6,96
2,03
-10,26
-41,28
-22,97
-40,80
-4,27
-5,17
-3,90
-3,07
-3,67
-4,94
-5,99
-3,45
-3,75
-3,15
-6,29
-3,07
-7,04
-5,77
-4,27
-3,00
-4,64
-3,15
-4,87
-3,75
-120,00 -100,00 -80,00 -60,00 -40,00 -20,00 0,00 20,00
Solid Brick
Honeycomb Brick
Unfired Clay Brick
Common Earth
Rammed Earth
Hempcrete
Sand Material
Sandstone Block
Limestone Block
stone block
Tuff Material
Gravel
Aerated Concrete Block
Inner Concrete Block
M02 150mm Lightweight Concrete Block
M14 150mm Heavyweight Concrete Block
Screed ( Cement Mortar)
Expanded polystyrene (EPS)
(PCM): DuPont Energain
Rockwool
Heating Cooling uncomfort

54
classify the importance of the aspects. Since cooling, energy demand represents 89% of the
overall energy needed, while heating represents only 11% in the study context, the priority
aspect has been determined as follows respectively; Cooling demand, Thermal comfort,
Heating demand.
Table.6.illustrate the classification of the analyzed aspects, with the percentage of the energy
Savion for each alternative.
Table 6 The percentage of reduction and increased energy consumption and thermal comfort
in all scenarios.
Cooling Heating Thermal comfort
Numerical values 5 1 4
Hollow Brick: Base
model
Base variable Base variable Base variable
Solid Brick -13.69 -7.41 11.38
Honeycomb Brick -28.09 -19.47 6.91
Unfired Clay Brick -18.36 -8.91 8.77
Common Earth -10.56 -5.70 11.47
Rammed Earth -12.31 -6.21 10.79
Hempcrete -51.39 -34.73 -1.77
Sand Material -37.78 -24.22 5.06
Sandstone Block -11.17 -5.78 11.38
Limestone Block -11.17 -5.78 11.21
stone block -9.29 -4.17 11.47
Tuff Material -24.61 -15.39 11.30
Gravel -31.53 -19.81 11.47

55
Aerated Concrete
Block -33.24 -21.59 8.43
Inner Concrete
Block -21.38 -12.91 11.72
M02 150mm
Lightweight
Concrete Block -18.69 -12.60 10.29
M14 150mm
Heavyweight
Concrete Block -9.48 -4.15 11.05
Screed ( Cement
Mortar) -27.15 -15.70 7.42
Expanded
polystyrene (EPS) -66.32 -44.83 -9.02
(PCM): DuPont
Energain -44.30 -27.63 2.78
Cavity wall insul
0.15mm -65.67 -44.38 -8.09
As it is illustrated in Figure.53. EPS and Rockwool (0.15cm) was the best alternative nearly
283 points (P) are obtained, followed by Hempcrete 221 P, PCM 176 P, Sand 155 P, Aerated
concrete block 141 P, Honeycomb brick 117 P, Gravel 114 P. The reset of the material
obtained less than 100 points. It is assumed to be the worst alternatives.
Finally, since the Rockwool is more ecologic material than the EPS isolation. Thus,
Rockwool is the best alternative for this investigation.

56
Figure 53.Performance classification of the selected materials
5.2 An optimization approach for the Opening parameters
Windows configurations in the building facade distinguish the energy use and visual comfort
patterns in buildings; they provide an internal environment for lighting transmission and
allow visual communication with outdoors for the occupants of the building, the airflow,
direct and indirect sunlight. In hot and dry climates, it is hard to combine these functions in a
balanced way. Additionally, the building design is becoming more dynamic and complex in
this severe climate regions, the design of the openings, which is the main source of the heat
gain, becomes more complex to provide visual comfort and thermal comfort with less energy
consumption. A more detailed and comprehensive analysis of the different design factors for
windows is required. Furthermore, the Window to wall ratio (WWR) is an important factor
that impacts the heat transmission, solar gains in winter, and the solar penetration in summer.
As it is illustrated in the research literature review, in hot and dry regions (20% to 40%) is
determined as the best WWR for this climate zone in terms of energy consumption to avoid
overheating.
In this step of the optimization approach, presents an evaluation of the Opening parameters
and the facade orientations impact on the building energy demand, thermal comfort, daylight
availability, and indoor air quality (IDQ) in an interactive method to improve these aspects.
33,74
116,64
45,12
16,54
23,51
221,36
155,38
19,14
20,34
7,40
95,73
113,65
140,79
77,09
66,60
6,88
93,46
283,64
175,88
282,97
0,00 50,00 100,00 150,00 200,00 250,00 300,00
Solid Brick
Honeycomb Brick
Unfired Clay Brick
Common Earth
Rammed Earth
Hempcrete
Sand Material
Sandstone Block
Limestone Block
stone block
Tuff Material
Gravel
Aerated Concrete Block
Inner Concrete Block
M02 150mm Lightweight Concrete Block
M14 150mm Heavyweight Concrete Block
Screed ( Cement Mortar)
Expanded polystyrene (EPS)
(PCM): DuPont Energain
Rockwool

57
Besides, it defines the main decisive aspects that have the potential to determine the best
window dimensions and glazing material type for each orientation. The window to wall ratios
(WWR) 20 %, 25%, 30%, 35%, 40%, and 3 different glazing types are investigated; Single
pane glazing (SG) which is widely applied in the residential building in Algeria, then it is
compared with the Double pane glazing (DG), and the Tripe pane glazing (TG) as alternative
solutions. All the properties of the applied glazing are summarized in Table.7. The overall
investigated scenarios in this step are 120.
Table 7 Glazing Properties
Glazing type Clear 3mm
Optical Data Type SpectralAverage
Thickness 0.003
Solar Transmittance at Normal Incidence 0.837
Front Side Solar Reflectance at Normal Incidence 0.075
Back Side Solar Reflectance at Normal Incidence 0.075
Visible Transmittance at Normal Incidence 0.898
Front Side Visible Reflectance at Normal Incidence 0.081
Back Side Visible Reflectance at Normal Incidence 0.081
Infrared Transmittance at Normal Incidence 0
Front Side Infrared Hemispherical Emissivity 0.84
Back Side Infrared Hemispherical Emissivity 0.84
Conductivity 0.9
Dirt Correction Factor for Solar and Visible Transmittance 1
Solar Diffusing No
Gaz type Air
Thickness 0.014
5.2.1 Simulation results of the energy demand; the impact of orientations, WWR,
Glazing type
The first evaluation is applied with a Single pane glazing as a fixed variable, and the variant
variables are the orientation and the WWR. as it is illustrated in Figures 54 and 55. For

58
cooling demand in all over the orientations the more the percentage of the window is high,
the cooling demand is increased. Otherwise, the highest cooling energy demand is reached
when the facade orientation has faced the South-West (SW), followed by the South-East
(SE), South (S), West (W), East (E), North-West (NW), North-East (NE), North (N) which
has the minimum cooling demand.
Moreover, The South facade window is the best orientation in terms of Heating demand, and
it has approximately the same demand as the South-East, and the South-West, followed by
the West, the South, The Nouth-West, The North-East, The North. As a result, generally, the
orientations that have the best results on the cooling demand, are the worst on the heating
demand. For the WWR, facing the orientations; South-West, South-East, East, and West, the
high WWR the less heating is needed, due to the high heat gain that impacted by the amount
of the solar radiation in these orientations. While at the south orientation, the WWR had no
impact on the heating demand, the differences are almost nominal between the different
WWR. However, N orientation, NE, NW the heating demand is higher when the WWR is
increased.
Figure 54. Different WWR and orientations impact on cooling demand; case SG
0
500
1000
1500
2000
2500
N NE E SE S SW W NW
Co
oli
ng
dem
and
kW
h
Orientations
20 25 30 35 40

59
Figure 55.Different WWR and orientations impact on heating demand; case SG
Furthermore, the Simple pane glazing (SG) is compared with the two glazing type proposed
in this study; double-pane glazing DG, and Triple pane glazing TG. The overall results
revealed that applying DG or, TG decreases both cooling and heating demand compared
with the SG, while the TG was the best alternative. Moreover, the glazing type efficiency is
impacted by the orientations. For colling demand; the glazing type had a nominal impact in
the North orientation, while in the S, SW, SE orientations the reduction was higher followed
by E, W, NW, and NE. The results are illustrated in Figures 56 and 57.
Figure 56. The cooling demand after the application DG
0
20
40
60
80
100
120
140
160
180
N NE E SE S SW W NW
Hre
atin
g d
eman
d k
Wh
Orientation
20 25 30 35 40
-140
-120
-100
-80
-60
-40
-20
0
N NE E SE S SW W NW
Sav
ed c
oo
lin
g en
ergy
kW
h
Orientations
20 25 30 35 40

60
Figure 57. The cooling demand after the application TG
The opposite results are obtained for the heating demand; the glazing type had a nominal
impact in the S, SE, and SW orientations, while the N the heating was significantly reduced
flowed by the NW, NE, W, E orientations. Figures 58. And 59.
Figure 58. The heating demand after the application DG
-300
-250
-200
-150
-100
-50
0
N NE E SE S SW W NWSa
ved
co
oli
ng
ener
gy k
Wh
Orientations
20 25 30 35 40
-70
-60
-50
-40
-30
-20
-10
0
N NE E SE S SW W NW
Hea
tin
f d
eman
d k
Wh
Orientations
20 25 30 35 40

61
Figure 59. The heating demand after the application TG
5.2.2 Simulation results of the thermal comfort; the impact of orientations, WWR,
Glazing
A comparison of thermal comfort for the different WWR and orientations when applying SG
is illustrated in Figure.60. the results show that the S orientation provides the best results in
terms of comfort hours in the whole year ( 8760h) which are between the -1≥PMV≤ +1,
followed by the SE, SW, N, W, NE, NW, E which represent the highest comfort hours in the
year.
Furthermore, The WWR has a nominal impact on the thermal comfort hours in all the
orientations, instead of the South that represents a significant reduction in thermal comfort
when the WWR is higher. The comparison between the thermal comfort hours and the WWR
in the orientations N, NE, NW indicate that since the WWR is higher the comfort hours are
reduced, the inverse for the orientations SE, SW, W.
-80
-70
-60
-50
-40
-30
-20
-10
0
N NE E SE S SW W NWH
eati
ng
dem
and
kW
h
Orientations
20 25 30 35 40

62
Figure 60. Comfort hours during the whole year (8670): case SG
After applying the double and triple pane glazing as is illustrated in Figures.61. and 62. The
results show that the comfort hours has been increased depend on the orientation and the
WWR. However, the glazing type improves nominally the thermal comfort in all the
orientations.
Figure 61. Comfort hours during the whole year (8670): case DG
1000
1200
1400
1600
1800
2000
2200
2400
N NE E SE S SW W NW
Co
mfo
rt h
ou
rs
Orientations
20 25 30 35 40
1000
1200
1400
1600
1800
2000
2200
2400
N NE E SE S SW W NW
Co
mfo
rt h
ours
Orientations
20 25 30 35 40

63
Figure 62. Comfort hours during the whole year (8670): case TG
5.2.3 Simulation results of the Daylight availability; the impact of orientations,
WWR, Glazing
Daylighting studies in buildings play a major role in indoor environmental investigation and
can be conducted at the early stages of building design to ensure best practice in visual
performance, comfort, health for building occupants. Window parameters significantly
effects daylighting performance. The objective of this step is to investigate the impact of the
window’s orientation, glazing type, and WWR on visual comfort. The empirical methodology
has been used to fulfill this aim through a lighting simulation using Vi-suite add on Blender
3D software that controls the external application Radiance. To simulate the daylight
availability; illuminance (lux) levels are evaluated in the virtual room. This factor indicates
the total luminous flux incident on a surface, per unit area. It is a measure of how much the
incident light illuminates the surface.
Figure.63. Illustrate the illuminance levels in the whole year, it indicates the hours in which
100 lux or more is provided naturally in the zone. The results revealed that the E orientation
provides more daylight availability followed by W, NE, SE, SW, NW, S, N. Furthermore,
The hight the WWR the high daylight availability is provided, WWR of 40% is the best for
all the orientations.
1000
1200
1400
1600
1800
2000
2200
2400
N NE E SE S SW W NW
Co
mfo
rt h
ou
rs
Orientations
20 25 30 35 40

64
Figure 63. Daylight availability comparison between the different WWR and orientation:
Case SG
Figure64. and 65.iIllustrate the glazing type impact on the illuminance levels in the whole
year (8760 h). The results show that increasing the number of glazing panes minimizes
slightly the daylight availability. The simple pane glazing shows the best results in terms of
Ilumunance (lux) levels compared to the SG and TG.
Figure 64. Daylight availability comparison between the SG and DG
3800
3850
3900
3950
4000
4050
4100
4150
4200
4250
N NE E SE S SW W NW
Ho
urs
-Il
lum
inan
ce ≥
10
0 l
ux
Orientations 20 25 30 35 40
-90
-80
-70
-60
-50
-40
-30
-20
-10
0
N NE E SE S SW W NW
Ho
urs
Orientations
20 25 30 35 40

65
Figure 65. Daylight availability comparison between the SG and TG
5.2.4 Simulation results of the carbon dioxide (CO2) level
The building façade design plays an important role in providing effective ventilation
configuration and strategies, to provide efficient Indoor Air Quality (IQA), which usually
expressed by the Carbon Dioxide (CO2) concentration in the space and the air ventilation
rate. The connection between indoor air quality and indoor CO2 concentration originates
from the fact that high CO2 concentrations reduce our cognitive performance, health,
comfort, and productivity. The recommended level of the CO2 concentration in the indoor
space should be ≤ 1000 ppm as it is defined by ASHRAE.
In this step, the impact of WWR on the concentration of CO2 was assessed, the opening and
closing of the opening are inserted based on a normal family house activities.Figure.66.
illustrate the hours of the CO2 levels when they are ≤1000 ppm in the whole year. The results
show that the hours that exceed the recommended value of CO2 concentration during the year
decreased significantly when the WWR is higher. The WWR =40% is the best in providing
better indoor air quality compared to the other alternatives. This is due to the higher
ventilation rate that can be provided during the opening of a wider window surface.
-180
-160
-140
-120
-100
-80
-60
-40
-20
0
N NE E SE S SW W NWH
ou
rs
Orientations
20 25 30 35 40

66
Figure 66. WWR impact on the CO2 level >1000 ppm during the whole year (8760h)
5.2.5 Performance analysis of the best window parameters
After analyzing the impact of the opening parameters, it was found that the effect of the
WWR and glazing type varied depending on the orientation and the desired comfort;
(daylight, thermal comfort, energy demand, and IDQ). Therefore, this section presents a
holistic performance comparison between all the analyzed aspects. It is summarised in
Table.8. which illustrates the results of the best WWR with the glazing type for each desired
comfort. Thus, the WWR for providing better thermal comfort is 20% in N, NE. NW
orientations, 35% in E, SE, SW, W. In the S 25% was the best. The WWR for the heating
demand is 20% in N, NE. NW orientations, 35% in E, 30% in SE, 40% in SW and W
orientations. The 3 pane glazing was the best for all the orientations, while the S orientation
the simple pane glazing was optimal with 40% WWR. The cooling demand as it is revealed
in the previous results, it is increased since the WWR is higher. At this end, 20% was the best
alternative for all the orientations with 3 pane glazing. Otherwise, for the daylight availability
and indoor air quality, when the WWR is higher these aspects are better provided. 40% of
WWR was the best for all the orientations. The Figure illustrates all the obtained results
5200
5400
5600
5800
6000
6200
6400
6600
6800
7000
Co2 level
CO
2 ≥
10
00
pp
m
20 25 30 35 40

67
Table 8 The optimum WWT and glazing type for each aspect
WWR
Thermal comfort H
N NE E SE S SW W NW
20 1478 1275 1300 1634 2380 1630 1386 1299
25 1449 1238 1319 1776 2496 1787 1408 1254
TG 30 1430 1206 1359 1943 2374 1899 1425 1220
35 1418 1181 1370 1979 2167 1952 1439 1194
40 1412 1154 1355 1919 1720 1900 1426 1168
WWR Heating demand kWh
20 96.10498 91.73307 33.19468 7.98396 3.608888 12.4981 42.87786 94.68289
25 99.18169 93.70474 29.38821 6.69218 2.837367 9.675221 39.44223 96.84438
DG 30 102.7308 96.2115 27.56001 6.51206 2.420521 8.079092 37.42023 99.72205
35 106.8683 99.22353 27.29763 6.679795 2.127906 7.440422 36.50545 103.1631
40 111.5119 102.6858 27.89395 7.05038 1.864942 7.208603 36.35548 107.0413
20 87.84358 84.51907 33.05082 8.717704 4.295058 13.13009 41.37844 87.03976
25 88.79841 84.53064 28.56535 6.858816 3.276879 10.01058 37.28385 87.1566
TG 30 90.19872 85.17091 26.05561 6.516458 2.762613 8.214975 34.6674 88.04776
35 92.06218 86.26426 25.18613 6.631712 2.345361 7.405618 33.16598 89.4283
40 94.46393 87.74081 25.2686 6.944211 2.009512 7.086394 32.52231 91.26189
WWR Cooling demand kWh
20 955.5847 1103.614 1287.801 1385.429 1307.689 1385.522 1291.244 1104.414
25 1002.701 1187.934 1433.499 1550.905 1451.242 1550.091 1436.87 1189.106
TG 30 1049.612 1272.079 1580.588 1716.918 1596.582 1715.151 1583.188 1273.546
35 1096.486 1355.938 1728.582 1883.228 1744.708 1880.964 1729.692 1357.682
40 1143.373 1439.527 1876.846 2050.891 1901.427 2047.853 1876.224 1441.775
Daylight availability lux
20 3841 3892 3969 3934 3953 3899 3901 3865
25 3947 3993 4075 4031 4004 4012 4011 3960
SG 30 4020 4057 4135 4083 4027 4057 4113 4032
35 4027 4101 4177 4119 4038 4090 4155 4074
40 4030 4125 4221 4136 4050 4102 4174 4097

68
Figure 67. Optimal window to wall ratio for each orientation
5.2.6 Holistic comparison for optimum balance between the different indoor
comfort's aspects
To determine the optimum opening design solution that has the potential to balance the
different aspects (Thermal comfort, indoor air quality, daylight availability, heating, and
cooling demand), a comparison between the different WWR and glazing types with a base
model reference is applied in each orientation. The base model Opening parameters are
defined based on the existing building design that was identified and diagnosed in the
previous section, the WWR in the base model was 6% with single-pane glazing. The different
results of the simulation of the base model are summarized in (Appendix 1). These results are
compared with the different alternatives. (Appendix 2) illustrate the comparison results that
represent the percentage of increasing/ reduction of the thermal, visual comfort, energy
demand, and IDQ.

69
Then, The obtained results were multiplied by the numerical values that define the aspect
priority. Table .9. Shows the classification of each aspect.
The holistic comparison results are illustrated in Table.10. The green color indicates the
solutions that gain the highest points. This means the best solutions. The results revealed that
for all the orientations the 3 pane glazing was the best solution. The WWR in the N façade is
found to be 25 % together with the S, SE, SW, NW, while NE, E, W the WWR 20 % is the
best.
Table 9 The classification of the indoor comfort requirements in the study context
Comfort aspect Numerical value
Thermal comfort 4
Indoor air quality 6
Daylight availability 3
Heating demand 2
Cooling demand 5
Table 10 Holistic comparison between the different aspects
WWR Simple glazing pane
N NE E SE S SW W NW
20 -27.4996 -93.6624
-
118.051 31.60587 154.954 5.287128
-
133.131 -98.5624
25 -43.8608 -134.562
-
163.318 16.75524 128.488 3.062233
-
172.743 -135.055
30 -79.3133 -192.615
-
240.218 -37.031 18.90829 -48.2833 -232.21 -193.255
35 -129.148 -261.235
-
318.456 -106.61 -104.725 -120.414
-
308.629 -261.379
40 -180.258 -329.991
-
397.969 -191.396 -240.231 -212.992
-
398.012 -334.878
Double glazing pane

70
6.2 Combination of the optimum Façade design solutions
Based on the presented multi-objective optimization approach results, the alternative design
solutions for the building façade were chosen including; adding Rockwool (15 cm ) to the
conventional wall structure, the clear 3 pane glazing, and the WWR 20% for the orientations
NE, E, W and 25% for the orientations S, SE, SW, NW. These solutions are providing a
balanced design method between daylight availability, thermal comfort, IDQ, heating, and
cooling demand, based on the defined priority.
Subsequently, these solutions are applied to the existing building façade, and the simulation
results have been compared with the basic model.
20 53.10279 -19.9247
-
41.8932 92.68263 209.8937 71.60379
-
50.3627 -21.004
25 51.65654 -40.8599
-
64.9406 87.88442 186.1825 76.16447
-
69.5251 -44.6658
30 33.96129 -78.913
-
114.627 56.15636 76.42079 40.42128
-
123.099 -89.3164
35 2.963528 -135.481
-
183.322 -20.0627 -66.6621 -35.8545
-
188.466 -146.645
40 -35.9748 -192.019
-
270.023 -127.136 -230.071 -134.81
-
271.672 -207.362
Triple glazing pane
20 81.92703 20.5915
-
2.65477 121.6712 233.1238 101.0521
-
4.70796 19.94811
25 90.6758 8.879261 -12.815 129.7702 236.2058 117.1185
-
19.6084 4.477452
30 75.12032 -29.0998
-
52.1095 113.3314 154.5884 92.67903
-
62.1129 -33.589
35 54.75746 -71.9291
-
112.374 49.50472 41.15888 37.71056
-
118.692 -77.5244
40 31.32111 -120.129
-
186.637 -44.8643 -132.353 -51.2119
-
187.264 -124.334

71
The results of the thermal comfort show a significant increase in the number of comfort hours
by 51.72 % in the living room, 97 % in the ROOM1, and ROOM2. Figure.68. shows the
comparison per hour in the whole year (8760 h).
Figure 68. Thermal comfort comparison between the optimum facade and the existing
building
The heating demand results of the improved model showed a reduction of 48% in the living
room, 54% in the Kitchen, 46 % in the Room 2 that include the balconies, 52 % in the Room
2, 11 % in the Hall, and the bathroom 19%. Figure.69. illustrates the heating demand
comparison between the different spaces.
Figure 69. Heating demand comparison between the optimum facade and the existing model
0
500
1000
1500
2000
2500
3000
EN_LIVINGROOM EN_ROOM1 EN_ROOM2
Th
erm
al c
om
fort
ho
urs
: -1
≥P
MV
≤+
1
zones
Existing Optimized
0
50
100
150
200
250
300
EN_LIVINGROOM EN_KITCHEN EN_ROOM2 EN_BATHROOM+WC EN_HALL EN_ROOM1
Hea
tin
g d
eman
d k
Wh
Zones
Existing Optimized

72
The cooling demand results are increased nominally in the living room by 22%, Room2 that
has a balcony 0.4%, Room1 6%, while in the Kitchen the cooling is reduced 17%, Bathroom
15%, and the Hall 10%.
Figure 70. Cooling demand comparison between the optimum facade and the existing model
The indoor air quality has been optimized in the different spaces of the apartment, the Co2
concentration levels were reduced to 67% in the living room, 18% in the kitchen, in the Hall
39%. This means a good indicator of increasing the indoor air quality by a simple increase in
the opening size. Which accelerates the air change in the indoor climate.
Figure 71. Carbon dioxide level ≤1000 pmm comparison
0
500
1000
1500
2000
2500
3000
EN_LIVINGROOM EN_KITCHEN EN_ROOM2 EN_BATHROOM+WC EN_HALL EN_ROOM1
Co
oli
ng
dem
and
kW
h
Zones
Existing Optimized
0100020003000400050006000700080009000
10000
Co
2:
ho
urs
≤1
00
0 p
pm
Zones
Existing Optimized

73
The daylight availability was increased significantly in the apartment. Tow main spaces (
living room, and bedroom) are illustrated in Figure.72. which presents the comparison in
terms of Illuminance level differences.
Figure 72. Daylight availability comparison
Furthermore, to ensure the best practice of visual comfort inside the spaces, more detailed
and comprehensive analysis is applied, it is focused on assessing two main visual comfort
factors; the illuminance and the light uniformity in two design days (21 December and 21
June). The analysis is based on the BREAM standard. Two main zones are compared; the
existing living room (LR-E) and The optimized living room ( LR-O), as well as the existing
bedroom (R-E) and the optimized bedroom (R-O).
Figure.73. and 74. shows the comparison of average illuminance on 21 December and June,
the results revealed a significant improvement on the illuminance levels that complies with
the standard almost in the whole day in both design days.
3500
3600
3700
3800
3900
4000
4100
Existing Optimized
Illu
min
ance
: ho
urs
≥ 1
00
lux
Tengelycím
EN_LIVINGROOM EN_ROOM1

74
Figure 73. Average illuminance on 21 December
Figure 74. Average illuminance on 21 June
The area that complies the required average illuminance is also improved in both spaces to
reach 100% in the both deisign days. Figure 75. And 76. Shows the results of the comparison
between the difference zones in the two design days.
050
100150200250300350400450500
7:4
0:0
07
:58
:00
8:1
6:0
08
:34
:00
8:5
2:0
09
:10
:00
9:2
8:0
09
:46
:00
10
:04
:00
10
:22
:00
10
:40
:00
10
:58
:00
11
:16
:00
11
:34
:00
11
:52
:00
12
:10
:00
12
:28
:00
12
:46
:00
13
:04
:00
13
:22
:00
13
:40
:00
13
:58
:00
14
:16
:00
14
:34
:00
14
:52
:00
15
:10
:00
15
:28
:00
15
:46
:00
16
:04
:00
16
:22
:00
16
:40
:00
16
:58
:00
17
:16
:00
Illuminance (lux)
Time
LR-E-Average illuminance (lux) R-E-Average illuminance (lux)
LR-O-Average illuminance (lux) R-O-Average illuminance (lux)
0100200300400500600700800900
5:2
4:0
0
6:0
0:0
0
6:3
6:0
0
7:1
2:0
0
7:4
8:0
0
8:2
4:0
0
9:0
0:0
0
9:3
6:0
0
10
:12
:00
10
:48
:00
11
:24
:00
12
:00
:00
12
:36
:00
13
:12
:00
13
:48
:00
14
:24
:00
15
:00
:00
15
:36
:00
16
:12
:00
16
:48
:00
17
:24
:00
18
:00
:00
18
:36
:00
19
:12
:00
19
:48
:00
Illuminance (lux)
Time
LR-E-Average illuminance (lux) R-E-Average illuminance (lux)
LR-O-Average illuminance (lux) R-O-Average illuminance (lux)
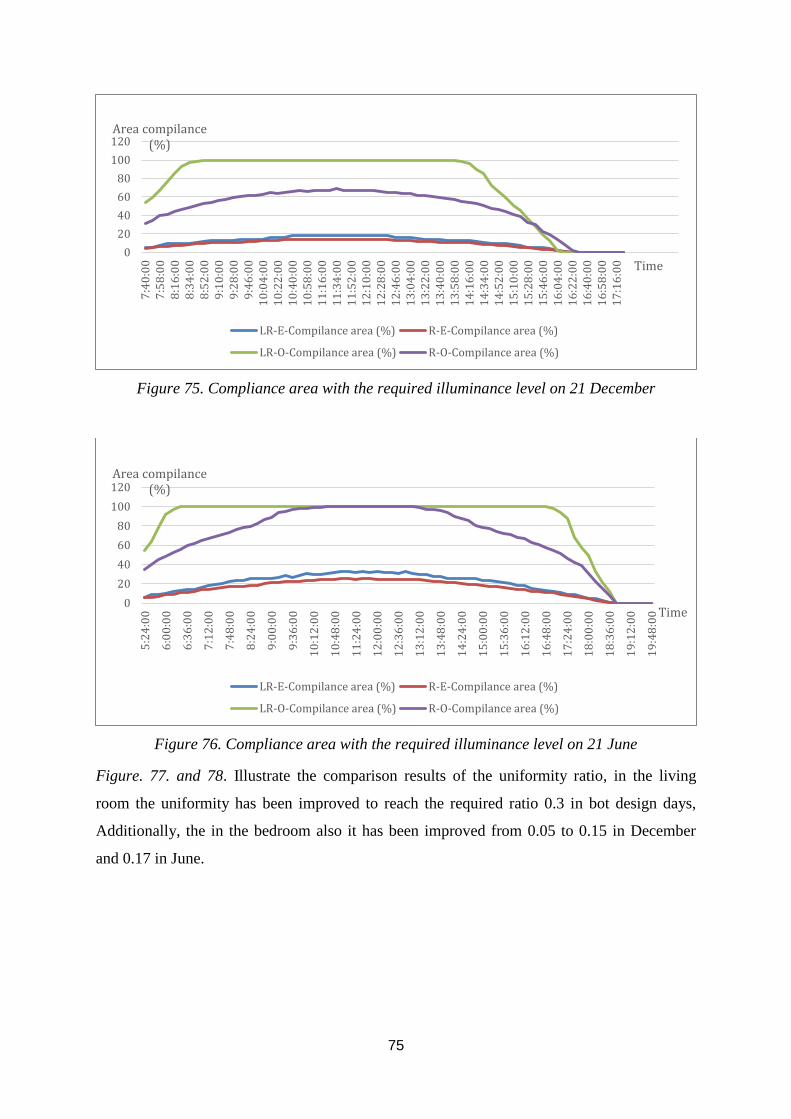
75
Figure 75. Compliance area with the required illuminance level on 21 December
Figure 76. Compliance area with the required illuminance level on 21 June
Figure. 77. and 78. Illustrate the comparison results of the uniformity ratio, in the living
room the uniformity has been improved to reach the required ratio 0.3 in bot design days,
Additionally, the in the bedroom also it has been improved from 0.05 to 0.15 in December
and 0.17 in June.
0
20
40
60
80
100
1207
:40
:00
7:5
8:0
08
:16
:00
8:3
4:0
08
:52
:00
9:1
0:0
09
:28
:00
9:4
6:0
01
0:0
4:0
01
0:2
2:0
01
0:4
0:0
01
0:5
8:0
01
1:1
6:0
01
1:3
4:0
01
1:5
2:0
01
2:1
0:0
01
2:2
8:0
01
2:4
6:0
01
3:0
4:0
01
3:2
2:0
01
3:4
0:0
01
3:5
8:0
01
4:1
6:0
01
4:3
4:0
01
4:5
2:0
01
5:1
0:0
01
5:2
8:0
01
5:4
6:0
01
6:0
4:0
01
6:2
2:0
01
6:4
0:0
01
6:5
8:0
01
7:1
6:0
0
Area compilance (%)
Time
LR-E-Compilance area (%) R-E-Compilance area (%)
LR-O-Compilance area (%) R-O-Compilance area (%)
0
20
40
60
80
100
120
5:2
4:0
0
6:0
0:0
0
6:3
6:0
0
7:1
2:0
0
7:4
8:0
0
8:2
4:0
0
9:0
0:0
0
9:3
6:0
0
10
:12
:00
10
:48
:00
11
:24
:00
12
:00
:00
12
:36
:00
13
:12
:00
13
:48
:00
14
:24
:00
15
:00
:00
15
:36
:00
16
:12
:00
16
:48
:00
17
:24
:00
18
:00
:00
18
:36
:00
19
:12
:00
19
:48
:00
Area compilance (%)
Time
LR-E-Compilance area (%) R-E-Compilance area (%)
LR-O-Compilance area (%) R-O-Compilance area (%)

76
Figure 77. Uniformity ratio on 21 December
Figure 78. Uniformity ratio on 21 June
00,05
0,10,15
0,20,25
0,30,35
0,47
:40
:00
7:5
8:0
08
:16
:00
8:3
4:0
08
:52
:00
9:1
0:0
09
:28
:00
9:4
6:0
01
0:0
4:0
01
0:2
2:0
01
0:4
0:0
01
0:5
8:0
01
1:1
6:0
01
1:3
4:0
01
1:5
2:0
01
2:1
0:0
01
2:2
8:0
01
2:4
6:0
01
3:0
4:0
01
3:2
2:0
01
3:4
0:0
01
3:5
8:0
01
4:1
6:0
01
4:3
4:0
01
4:5
2:0
01
5:1
0:0
01
5:2
8:0
01
5:4
6:0
01
6:0
4:0
01
6:2
2:0
01
6:4
0:0
01
6:5
8:0
01
7:1
6:0
0
Uniformity ratio
Time
LR-E-Uniformity ration (%) R-E-Uniformity ration (%)
LR-O-Uniformity ration (%) R-O-Uniformity ration (%)
0
0,05
0,1
0,15
0,2
0,25
0,3
0,35
5:2
4:0
0
6:0
0:0
0
6:3
6:0
0
7:1
2:0
0
7:4
8:0
0
8:2
4:0
0
9:0
0:0
0
9:3
6:0
0
10
:12
:00
10
:48
:00
11
:24
:00
12
:00
:00
12
:36
:00
13
:12
:00
13
:48
:00
14
:24
:00
15
:00
:00
15
:36
:00
16
:12
:00
16
:48
:00
17
:24
:00
18
:00
:00
18
:36
:00
19
:12
:00
19
:48
:00
Illuminance (lux)
Time
Uniformity ratio 21 June
LR-E-Uniformity ration (%) R-E-Uniformity ration (%)
LR-O-Uniformity ration (%) R-O-Uniformity ration (%)

77
6. General conclusion & main finding
I have presented a holistic multi-optimization approach that can provide a structured method
to define optimum design solutions for the high-performance façade design, and that can
provide a balance between visual comfort, thermal comfort, energy demand, and indoor air
quality through all the façade components. More precisely, the context of the optimization
was in the hot and dry climate.
For all steps of the optimization, a dynamic simulation was carried out using Blender 3D
software for modeling and building information has been included by the plugin VI-suite that
controls the external applications (software) Radiance and Energy Plus.
1. The building façade is considered not only an interface between the interior and the
exterior but also it acts as a skin that can provide a comfortable sheltered
environment, therefore the first step of my study was the determination of the main
Façade parameters that impact the thermal comfort, the energy demand, the visual
comfort, and the indoor air quality, throughout a theoretical analytical methodology; I
have found that the opening parameters together with the external wall structure and
materials were the most related to the façade performance design.
2. The research methodology is based on a virtual modeling and simulation process.
Thus, I have verified and validated the accuracy of theses process, to determine the
modeling and the programming errors which can occur in the thermal dynamic

78
simulation through a comparison of a field Measurements and the simulation. I have
found that The accurate inputs of all the parameters of the built environment impact
the agreement degree between the measurements and the simulation results,
including; the number of occupants and their behaviors, the HVAC system usage, the
windows/ doors closing and opening, time of occupancy. Otherwise, since the
agreement has been obtained in some zones in the apartment, the modeling method
with Vi-suit add on Blender 3D was precise enough and it was used to fulfill the
research main goal.
3. An analysis of the current situation of the existing residential buildings in the study
context in a hot and dry climate is presented, the weakness and strength of the
Algerian building design and standards in terms of building energy efficiency are
determined. for the diagnosis, a referential building has been chosen. Furthermore, to
evaluate the energy consumption, thermal comfort, indoor air quality, as well as
visual comfort. the computational simulation Energy plus and radiance software were
used. I have found that; the building energy diagnosis results generally were negative,
and the residential building in the study context has not complied with the building
energy design standards, there are many weaknesses in terms of building energy
consumption, thermal comfort, visual comfort, and indoor air quality.
4. The optimization approach to reduce energy consumption and increase thermal
comfort performance, daylighting and indoor air quality, through investigating
different passive façade design strategies of the building facade design are applied by
selecting different wall structures, opening dimensions (WWR), glazing type; For the
facade wall structure, several materials have been selected based on the availability
criteria, ecology, smart materials, and thermal/physical characteristics. The findings
show that the best material that improves Energy demand was not the best on
enhancing Thermal comfort. Besides, the analysis revealed that conductivity was the
main influential parameter on the energy demand; the material that has the lowest
thermal conductivity provides the highest heating and cooling energy saving.
However, steady-state analysis of Thermal Mass, Density, and specific heat
proprieties of the materials can not provide a precise prediction for the material’s
thermal performance. Thus, a dynamic simulation analysis is crucial to determine it.

79
5. For the openings, The impact of two main parameters have been investigated; the
WWR (from 20 % to 40%) and the glazing type ( Simple pane, Double pane, and
Triple pane). The impact of these parameters together with the orientation has been
evaluated in an interactive method to improve the building energy demand, thermal
comfort, daylight availability, and indoor air quality (IDQ). I have found that the
orientation and the glazing type and WWR have a significant impact on the cooling
and heating demand but in an inverse manner; the orientations that provide the best
heating demand were the worst for the cooling demand. Also, The comparison
between the thermal comfort hours and the WWR in the orientations N, NE, NW
indicate that since the WWR is higher the comfort hours are reduced, the contrary was
obtained for the orientations SE, SW, W. Finally, the visual comfort and the indoor air
quality was improved when the WWR was higher. Furthermore, the glazing type
efficiency was impacted by the orientations. For colling demand; the glazing type had
a nominal impact in the North orientation, while in the S, SW, SE orientations the
reduction was higher followed by E, W, NW, and NE. The heating demand revealed
inverse results.
6. The performance analysis of the impact of the different alternatives on the different
comfort aspects revealed that each nominated type of comfort; (daylight, thermal
comfort, energy demand, and IDQ) lead to a different window configuration (glazing
type, WWR). The WWR that provides better thermal comfort in each orientation is as
follows: 20% in N, NE. NW orientations, 35% in E, SE, SW, W. In the South, 25%
was the best. And for the heating demand 20% in N, NE. NW orientations, 35% in E,
30% in SE, 40% in SW and W orientations. The 3 pane glazing was the best for all
the orientations, while the South orientation the double-pane glazing was optimal with
40% WWR. The cooling demand increases as the WWR is higher, 20% was the best
alternative for all the orientations with 3 pane glazing. Otherwise, for the daylight
availability and indoor air quality, as soon as the WWR is higher these aspects offer
better results. And for these aspects, 40% of WWR was the best for all the
orientations.
7. The best design solutions in the study context were the clear 3 pane glazing for all
orientations, and the WWR of 20% for the orientations NE, E, W, and 25% for the

80
orientations S, SE, SW, NW. These results are based on the classification of the
desired indoor comfort as it follows; IDQ, Thermal comfort, Cooling demand,
Daylight availability, and Heating demand
8. Comparing the existing residential building, the optimal combination of the façade
design reduces 64 % of Heating demand, 3% of cooling demand, and improves 51 %
of indoor air quality. The thermal and visual comfort hours have been increased by
35%, 6 % respectively.
List of publications
Energy design performance diagnosis for the existing Algerian residential building
façade in the hot and dry climate
POLLACK PERIODICA: AN INTERNATIONAL JOURNAL FOR ENGINEERING AND
INFORMATION SCIENCES
Optimizing the cooling energy consumption by the passive traditional façade strategies
in a hot dry climate
POLLACK PERIODICA: AN INTERNATIONAL JOURNAL FOR ENGINEERING AND
INFORMATION SCIENCES 14- 1 pp. 177-188. , 12 p. (2019)
Optimum window position in the building façade for high daylight performance:
Empirical study in a hot and dry climate
POLLACK PERIODICA: AN INTERNATIONAL JOURNAL FOR ENGINEERING AND
INFORMATION SCIENCES
Published in conference proceedings

81
The impact of the formal and constructive choices on the climatic performance of the
facades.
1. 13th Miklós Iványi International PhD & DLA Symposium - Abstract Book:
Architectural, Engineering and Information Sciences. Pécs, Hungary: Pollack Press,
(2017) p. 110
Rais, Messaouda; Boumerzoug, Adel ; Halada, Miklós
Evaluating the effect of incident direct solar radiation on building facades-case study
Biskra-Algeria
2. Doctoral workshop: skill development in higher education and the labor market.
University of pécs 25th
-26th
November 2017 Pécs Hungary
3. 14th Miklós Iványi International PhD & DLA Symposium - Abstract Book:
Architectural, Engineering and Information Sciences. Pécs, Hungary: Pollack Press,
(2018) paper 3.
1 Adel Boumerzoug,
2 Messaouda Rais,
3 Leila Sriti
Thermal performance evaluation of the Algerian vernacular houses in the region of
Ziban-Biskra: Hot and dry climate
4. 14th Miklós Iványi International PhD & DLA Symposium - Abstract Book:
Architectural, Engineering and Information Sciences. Pécs, Hungary: Pollack Press,
(2018) paper 63.
Messaouda Rais, Baranyai, Balint, Halada, Miklós
Energy performance evaluation of the conventional wall materials applied on the
Algerian residential building facade-Hot and dry climate
5. 8th
international doctoral conference (IDK 2019) at the University of pécs- 24th
-25th
2019, P92
Energy consumption and thermal comfort analysis of the existing residential building in
Algerian hot and dry climate region
Messaouda Rais1 , Adel Boumerzoug2 , Balint Baranyai3 , Miklós Halada3
6. 15th Miklós Iványi International PhD & DLA Symposium - Abstract Book :
Architectural, Engineering and Information Sciences. Pécs, Hungary : Pollack Press,
(2019). P 33
Messaouda Rais, Adel Boumerzoug

82
Validation of a building environmental analysis tool based on real field measurements
in a Hot and dry climate region
7. International conference of Global Society for Research and Development
(GSRD)-Istanbul, Turkey, 20th - 21st November 2019.
Assessing the impact of local climate on the building energy design: case study Algeria-
Egypt in hot and dry regions.
Bibliography
2019 Global Status Report for Buildings and Construction, 2019. 41.
Aelenei, D., Aelenei, L., Vieira, C.P., 2016. Adaptive Façade: Concept, Applications,
Research Questions. Energy Procedia 91, 269–275.
https://doi.org/10.1016/j.egypro.2016.06.218
Aksamija, A., 2013. Sustainable Facades: Design Methods for High-Performance Building
Envelopes by Ajla Aksamija, 1 edition. ed. Wiley.
Aksamija, A., n.d. Sustainable Facades 316.
Al-Anzi, A., Khattab, O., 2010. Solar conscious house design in Kuwait 14.
AlAnzi, A., Seo, D., Krarti, M., 2009. Impact of building shape on thermal performance of
office buildings in Kuwait. Energy Conversion and Management 50, 822–828.
https://doi.org/10.1016/j.enconman.2008.09.033
Aldawi, F., Alam, F., Khan, I., Alghamdi, M., 2013. Effect of Climates and Building
Materials on House Wall Thermal Performance. Procedia Engineering 56, 661–666.
https://doi.org/10.1016/j.proeng.2013.03.175
Badeche, M., Bouchahm, Y., 2020. Design optimization criteria for windows providing low
energy demand in office buildings in Algeria. Environmental and Sustainability
Indicators 6, 100024. https://doi.org/10.1016/j.indic.2020.100024

83
Bah, E.M., Faye, I., Geh, Z.F., 2018. The Housing Sector in Africa: Setting the Scene, in:
Bah, E.M., Faye, I., Geh, Z.F. (Eds.), Housing Market Dynamics in Africa. Palgrave
Macmillan UK, London, pp. 1–21. https://doi.org/10.1057/978-1-137-59792-2_1
benational_2018-edition-2019_5dac85774bce1.pdf, n.d.
Berghout, B., Forgues, D., Monfet, D., 2014. Simulation du confort thermique intérieur pour
l’orientation d’un bâtiment collectif à Biskra, Algérie, in: eSIM 2014 Conference
Proceedings. International Building Performance Simulation Association, Ottawa,
ON, Canada.
Bevilacqua, P., Benevento, F., Bruno, R., Arcuri, N., 2019. Are Trombe walls suitable
passive systems for the reduction of the yearly building energy requirements? Energy
185, 554–566. https://doi.org/10.1016/j.energy.2019.07.003
Bolattürk, A., 2008. Optimum insulation thicknesses for building walls with respect to
cooling and heating degree-hours in the warmest zone of Turkey. Building and
Environment 43, 1055–1064. https://doi.org/10.1016/j.buildenv.2007.02.014
Bourbia, F., 2016. Effect of kinetic façades on energy efficiency in office buildings-hot dry
climates. 11th Conference on Advanced Building Skins.
Capeluto, I.G., 2003. Energy performance of the self-shading building envelope. Energy and
buildings 35, 327–336.
Carlucci, S., 2013. Thermal Comfort Assessment of Buildings, SpringerBriefs in Applied
Sciences and Technology. Springer Milan, Milano. https://doi.org/10.1007/978-88-
470-5238-3
Crawley, D.B., Lawrie, L.K., Pedersen, C.O., Winkelmann, F.C., 2000. EnergyPlus: Energy
Simulation Program. ASHRAE Journal 8.
Díaz López, C., Carpio, M., Martín-Morales, M., Zamorano, M., 2019. A comparative
analysis of sustainable building assessment methods. Sustainable Cities and Society
49, 101611. https://doi.org/10.1016/j.scs.2019.101611
Fanger, P.O., 1972. Thermal comfort: analysis and applications in environmental
engineering,. McGraw-Hill, New York.
Feng, G., Chi, D., Xu, X., Dou, B., Sun, Y., Fu, Y., 2017. Study on the Influence of Window-
wall Ratio on the Energy Consumption of Nearly Zero Energy Buildings. Procedia
Engineering 205, 730–737. https://doi.org/10.1016/j.proeng.2017.10.003
Ghezloun, A., Chergui, S., Oucher, N., 2011. Algerian energy strategy in the context of
sustainable development (Legal framework). Energy Procedia 6, 319–324.
https://doi.org/10.1016/j.egypro.2011.05.036

84
Givoni, B., 1994. Passive Low Energy Cooling of Buildings. John Wiley & Sons.
Givoni, B., 1976. Man, climate and architecture, 2nd edition. ed. Applied Science Publishers,
London.
Guedes, M.C., Cantuaria, G. (Eds.), 2019. Bioclimatic Architecture in Warm Climates: A
Guide for Best Practices in Africa. Springer International Publishing, Cham.
https://doi.org/10.1007/978-3-030-12036-8
Hadjri, K., 1992. Current Algerian housing policies affecting the methods for housing
provision. Habitat International 16, 71–78. https://doi.org/10.1016/0197-
3975(92)90064-6
Hamdani, M., Bekkouche, S.M.A., Benouaz, T., Cherier, M.K., 2012. Study and Effect of
Orientation Two Room of Buildings Located in Ghardaia, Algeria. Energy Procedia,
Terragreen 2012: Clean Energy Solutions for Sustainable Environment (CESSE) 18,
632–639. https://doi.org/10.1016/j.egypro.2012.05.076
Hardy, J.T., 2003. Climate Change: Causes, Effects, and Solutions. John Wiley & Sons.
Herzog, T., Krippner, R., Lang, W., 2012. Facade Construction Manual. Walter de Gruyter.
Hindrichs, D.U. (Ed.), 2007. Plusminus 20/40 Latitude: Sustainable Building Design in
Tropical and Subtropical Regions. Edition Axel Menges, Stuttgart ; London.
Khadraoui M A, Sriti L, Besbas S, 2018. The Impact Of Facade Materials On The Thermal
Comfort And Energy Efficiency Of Offices Buildings.
https://doi.org/10.5281/ZENODO.1285954
Knaack, U., Klein, T., Bilow, M., Auer, T. (Eds.), 2007. Fassaden: Prinzipien der
Konstruktion. Birkhäuser, Basel.
Košir, M., 2019. Climate Adaptability of Buildings: Bioclimatic Design in the Light of
Climate Change. Springer International Publishing, Cham.
https://doi.org/10.1007/978-3-030-18456-8
Kottek, M., Grieser, J., Beck, C., Rudolf, B., Rubel, F., 2006. World Map of the Köppen-
Geiger climate classification updated. metz 15, 259–263.
https://doi.org/10.1127/0941-2948/2006/0130
Latreche Sihem, Sriti Leila, 2018. The effect of building materials choice on the thermal
comfort in the auto-produced individual housing in Biskra. Journal of Building
Materials and Structures 4, 50–57. https://doi.org/10.5281/zenodo.1165204
Manvi, N., 2017. Impact of Industrialization on the Building 10, 5.
Matari, N., 2015. Effet de l’enveloppe du bâtiment sur le confort thermique. Application au
climat aride 8.

85
Mayer, H., H�ppe, P., 1987. Thermal comfort of man in different urban environments.
Theor Appl Climatol 38, 43–49. https://doi.org/10.1007/BF00866252
Nguyen, A.T., Truong, N.S.H., Rockwood, D., Tran Le, A.D., 2019. Studies on sustainable
features of vernacular architecture in different regions across the world: A
comprehensive synthesis and evaluation. Frontiers of Architectural Research 8, 535–
548. https://doi.org/10.1016/j.foar.2019.07.006
Ole Fanger, P., Toftum, J., 2002. Extension of the PMV model to non-air-conditioned
buildings in warm climates. Energy and Buildings 34, 533–536.
https://doi.org/10.1016/S0378-7788(02)00003-8
Olgyay, V., 1963. Design With Climate: Bioclimatic Approach to Architectural Regionalism,
Fourth Printing edition. ed. Princeton University Press, Place of publication not
identified.
Ould-Henia, A., 2003. Choix climatiques et construction: zones arides et semi-arides, maison
à cour de Bou-Saada.
Planas, C., Cuerva, E., Alavedra, P., 2018. Effects of the type of facade on the energy
performance of office buildings representative of the city of Barcelona. Ain Shams
Engineering Journal. https://doi.org/10.1016/j.asej.2017.04.009
Rathi, P., 2012. A thesis submitted to the College of Architecture and Environmental Design
(As of May 05) of Kent State University in partial fulfillment of the requirements for
the degree of Master of Architecture 142.
Saada, M.N., n.d. Housing Policy in Algeria 14.
Sandak, A., Sandak, J., Brzezicki, M., Kutnar, A., 2019. Bio-based Building Skin,
Environmental Footprints and Eco-design of Products and Processes. Springer
Singapore, Singapore. https://doi.org/10.1007/978-981-13-3747-5
Semahi, S., Zemmouri, N., Singh, M.K., Attia, S., 2019. Comparative bioclimatic approach
for comfort and passive heating and cooling strategies in Algeria. Building and
Environment 161, 106271. https://doi.org/10.1016/j.buildenv.2019.106271
Sousa, J., 2012. Energy Simulation Software for Buildings : Review and Comparison.
Southall, R., Biljecki, F., 2017. The VI-Suite: a set of environmental analysis tools with
geospatial data applications. Open geospatial data, softw. stand. 2, 23.
https://doi.org/10.1186/s40965-017-0036-1
SRITI, L., 2013. Architecture domestique en devenir. Formes, usages et représentations. - Le
cas de Biskra - (phd). Université Mohamed Khider – Biskra.

86
TIBERMACINE, I., 2016. L’IMPACT DE LA TYPOLOGIE DES HABITATS
COLLECTIFS SUR LES CONDITIONS THERMIQUES INTERIEURES ET
L’EFFICACITE ENERGETIQUE - CAS DE CLIMAT CHAUD ET SEC- (masters).
Université Mohamed Khider - Biskra.
U.S. Global Change Research Program (Ed.), 2009. Global climate change impacts in the
United States: a state of knowledge report. Cambridge University Press, Cambridge
[England] ; New York.
Valladares-Rendón, L.G., Schmid, G., Lo, S.-L., 2017. Review on energy savings by solar
control techniques and optimal building orientation for the strategic placement of
façade shading systems. Energy and Buildings 140, 458–479.
https://doi.org/10.1016/j.enbuild.2016.12.073
Ward, G.J., 1994. The RADIANCE lighting simulation and rendering system, in:
Proceedings of the 21st Annual Conference on Computer Graphics and Interactive
Techniques, SIGGRAPH ’94. Association for Computing Machinery, New York, NY,
USA, pp. 459–472. https://doi.org/10.1145/192161.192286
Zekraoui, D., 2017. L’impact de l’ouverture de la façade sur la consommation de l’énergie
dans les bâtiments à usage de bureau sous un climat chaud et sec (masters). Université
Mohamed Khider - Biskra.
ZEMMOURI, N., 2005. MODELLING ENERGY EFFICIENT WINDOWS IN HOT ARID
ZONES 8.

87
Appendix 1: The results of energy demand, thermal comfort, daylight, and IDQ of the Base
model
N NE E SE S SW W NW
Comfort hours /h
1386 1252 1354 1421 1764 1452 1396 1268
Heating energy demand / kWh
91.16021022 91.67488 62.82858 43.11146 29.98852 47.39641 67.30448 93.38394
Cooling energy demand/ kWh
829.3077 881.1064 912.7197 958.6385 931.7215 961.4138 915.2893 880.8315
Daylight availability / Illuminance (lux)
3770 3814 3875 3877 3888 3809 3811 3809
Carbone dioxide concentration / PPM
8760 8760 8760 8760 8760 8760 8760 8760
Appendix 2: Comparision between the base model and the proposed alternatives
N NE E SE S SW W NW
WWR Thermal comfort %
Simple pane glazing
20 1.803752 -0.31949 -10.9306 12.73751 32.53968 9.435262 -7.87966 0.315457
25 -0.21645 -3.27476 -11.8907 21.95637 37.52834 19.90358 -7.02006 -1.18297
30 -0.93795 -4.39297 -13.2939 28.43068 28.68481 25.89532 -4.94269 -2.28707
35 -1.5873 -5.59105 -11.6691 33.8494 19.55782 29.54545 -3.36676 -2.99685
40 -2.23665 -6.3099 -10.0443 36.03096 8.786848 29.13223 -4.29799 -4.57413
Double pane glazing
20 5.266955 -0.31949 -6.79468 15.69317 35.88435 13.70523 -3.08023 0.236593
25 2.958153 -2.63578 -4.87445 25.96763 39.3424 23.76033 -0.35817 -2.60252
30 1.948052 -3.91374 -2.8065 35.96059 28.00454 30.99174 0.358166 -4.653

88
35 0.793651 -6.46965 -1.10783 37.93103 11.56463 32.09366 1.217765 -7.80757
40 -1.0101 -8.54633 -3.24963 32.86418 -8.16327 28.30579 -0.50143 -10.5678
Triple pane glazing
20 6.637807 1.837061 -3.98818 14.98944 34.92063 12.25895 -0.71633 2.444795
25 4.545455 -1.11821 -2.58493 24.98241 41.4966 23.07163 0.859599 -1.1041
30 3.174603 -3.67412 0.369276 36.73469 34.5805 30.78512 2.077364 -3.78549
35 2.308802 -5.67093 1.181684 39.26812 22.8458 34.43526 3.080229 -5.83596
40 1.875902 -7.82748 0.073855 35.04574 -2.49433 30.85399 2.148997 -7.88644
WWR N NE E SE S SW W NW
Heating demand %
SG
20
-
37.09321469 -28.8948 31.69947 75.08561 84.60352 65.64377 17.99631 -31.4129
25
-
48.47773766 -38.1939 34.60461 77.60581 87.20039 70.93039 19.6838 -41.0245
30
-
60.36889263 -48.1501 34.58337 77.82503 87.51962 73.31441 19.30558 -51.3136
35
-
72.82382212 -58.5912 32.40238 76.71402 87.17632 74.25548 17.53745 -62.2272
40
-
85.84695699 -69.5463 28.96593 75.07656 86.38517 73.99743 14.701 -73.5865
DG
20
-
5.424259418 -0.06348 47.16628 81.48066 87.96577 73.6307 36.29271 -1.39098
25
-
8.799321935 -2.2142 53.22478 84.47703 90.53849 79.58659 41.39732 -3.70561
30
-
12.69263728 -4.9486 56.1346 84.89483 91.92851 82.95421 44.40158 -6.78716
35
-
17.23133455 -8.23416 56.55221 84.50576 92.90426 84.30172 45.76074 -10.472
40
-
22.32518536 -12.0108 55.60309 83.64616 93.78115 84.79082 45.98356 -14.6249
TG
20 3.638242683 7.805639 47.39524 79.77869 85.67766 72.2973 38.52053 6.793644
25 2.590824306 7.793019 54.53446 84.0905 89.07289 78.87902 44.60421 6.668532
30 1.054730276 7.094598 58.52905 84.88463 90.78776 82.66752 48.4917 5.714234
35
-
0.989435312 5.901966 59.91294 84.61729 92.17914 84.37515 50.72249 4.235885
40
-
3.624077667 4.29133 59.78169 83.89242 93.29906 85.04867 51.67883 2.272393
WWR N NE E SE S SW W NW
Cooling demand %
SG
20 -
19.0849 -
33.9953 -
54.8504 -
60.6345 -
55.7347 -
60.0153 -
54.7873 -34.1311
25
-25.5043
-45.3103
-73.5692
-81.1191
-74.4748
-80.3597
-73.4344 -45.5128

89
30 -
31.8202 -
56.4481 -
92.1444 -
101.346 -
93.1958 -
100.482 -
91.8415 -56.6853
35 -
38.0546 -
67.3868 -
110.527 -
121.366 -
112.311 -
120.382 -
109.997 -67.696
40 -
44.1985 -
78.1612 -
128.639 -141.28 -
132.267 -
140.256 -
127.896 -78.5554
DG
20
-17.4159
-29.6791
-48.1697
-52.7072
-47.9495
-52.2286
-48.1637 -29.809
25
-23.5387
-40.2145
-65.7625
-71.8294
-65.2131
-71.2003
-65.6878 -40.3921
30
-29.6056
-50.6637
-83.4172
-90.8944
-82.5731 -90.107
-83.1491 -50.8703
35
-35.6468
-61.0153
-101.052
-109.928
-100.425
-109.023
-100.544 -61.2719
40 -
41.6521 -
71.2884 -
118.599 -
129.059 -
119.432 -128.07 -
117.848 -71.6212
TG
20
-15.2268
-25.2532
-41.0949
-44.5205
-40.3519
-44.1129 -41.075 -25.3831
25
-20.9082
-34.8229 -57.058 -61.782
-55.7592
-61.2303
-56.9853 -34.9982
30
-26.5649
-44.3729
-73.1734
-79.0996
-71.3583
-78.3988
-72.9713 -44.5846
35 -32.217 -
53.8904 -89.388 -
96.4482 -
87.2563 -
95.6456 -
88.9776 -54.1364
40
-37.8708
-63.3772
-105.632
-113.938
-104.077
-113.004
-104.987 -63.6834
WWR N NE E SE S SW W NW
Daylight availability
SG
20 1.883289 2.045097 2.425806 1.470209 1.671811 2.362825 2.361585 1.470202
25 4.69496 4.693235 5.16129 3.972143 2.983539 5.329483 5.247966 3.964295
30 6.6313 6.371264 6.709677 5.313387 3.575103 6.510895 7.924429 5.854555
35 6.816976 7.524908 7.793548 6.24194 3.858025 7.377264 9.026502 6.957207
40 6.896552 8.154169 8.929032 6.680423 4.166667 7.692308 9.525059 7.56104
DG
20 0.238727 0.209754 0.851613 0.41269 0.308642 0.472565 0.314878 0.210029
25 2.572944 2.5957 3.174194 2.269796 2.134774 3.517984 3.384938 2.572854
30 5.066313 5.1914 5.677419 4.204282 3.009259 5.565765 6.008922 4.279338
35 6.604775 6.423702 6.864516 5.390766 3.575103 6.537149 8.396746 6.405881
40 6.763926 7.315155 8.025806 6.24194 3.832305 7.351011 8.974023 7.193489
TG
20 -1.67109 -1.78291 -1.75484 -1.496 -1.80041 -0.42006 -0.91839 -1.91651
25 1.485411 1.494494 2.116129 1.057519 1.157407 1.942767 1.758069 1.050144

90
30 2.917772 2.962769 3.612903 2.579314 2.366255 3.938041 4.355812 2.887897
35 5.30504 5.243838 5.780645 4.255868 3.009259 5.592019 6.586198 5.119454
40 6.578249 6.266387 6.993548 5.390766 3.575103 6.537149 8.344267 6.799685
WWR N NE E SE S SW W NW
CO2 concentration %
20 21.5411 21.5411 21.5411 21.5411 21.5411 21.5411 21.5411 21.5411
25 27.89954 27.89954 27.89954 27.89954 27.89954 27.89954 27.89954 27.89954
30 30.73059 30.73059 30.73059 30.73059 30.73059 30.73059 30.73059 30.73059
35 32.11187 32.11187 32.11187 32.11187 32.11187 32.11187 32.11187 32.11187
40 33.44749 33.44749 33.44749 33.44749 33.44749 33.44749 33.44749 33.44749
Related Documents