Towards an operational system for oil-spill forecast over Spanish waters: Initial developments and implementation test M.G. Sotillo a, * , E. Alvarez Fanjul a , S. Castanedo b , A.J. Abascal b , J. Menendez c , M. Emelianov d , R. Olivella d , E. Garcı ´a-Ladona d , M. Ruiz-Villarreal e , J. Conde f , M. Go ´mez a , P. Conde e , A.D. Gutierrez b , R. Medina b a Organismo Pu ´ blico Puertos del Estado (PdE), Av Parteno ´ n, 10, 28042 Madrid, Spain b Ocean and Coastal Research Group, IHCantabria, Universidad de Cantabria, Avda. de los Castros s/n, 39005 Santander, Spain c Sociedad de Salvamento y Seguridad Marı ´tima (SASEMAR). Centro Jovellanos, 33393 Veranes, Gijo ´ n, Spain d Departamento de Oceanografı ´a Fı ´sica, Instituto de Ciencias del Mar, CSIC, Passei Marı ´tim, 37-49, 08003 Barcelona, Spain e Instituto Espan ˜ol de Oceanografı ´a (IEO), Muelle de A ´ nimas s/n, 15001 A Corun ˜a, Spain f Instituto Nacional de Meteorologı ´a (INM), C/Leonardo Prieto Castro, 8, 28040 Madrid, Spain Abstract The ESEOO Project, launched after the Prestige crisis, has boosted operational oceanography capacities in Spain, creating new oper- ational oceanographic services and increasing synergies between these new operational tools and already existing systems. In conse- quence, the present preparedness to face an oil-spill crisis is enhanced, significantly improving the operational response regarding ocean, meteorological and oil-spill monitoring and forecasting. A key aspect of this progress has been the agreement between the scien- tific community and the Spanish Search and Rescue Institution (SASEMAR), significantly favoured within the ESEOO framework. Important achievements of this collaboration are: (1) the design of protocols that at the crisis time provide operational state-of-the- art information, derived from both forecasting and observing systems; (2) the establishment, in case of oil-spill crisis, of a new specialized unit, named USyP, to monitor and forecast the marine oceanographic situation, providing the required met-ocean and oil-spill informa- tion for the crisis managers. The oil-spill crisis scenario simulated during the international search and rescue Exercise ‘‘Gijo ´ n-2006”, organized by SASEMAR, represented an excellent opportunity to test the capabilities and the effectiveness of this USyP unit, as well as the protocols established to analyze and transfer information. The results presented in this work illustrate the effectiveness of the oper- ational approach, and constitute an encouraging and improved base to face oil-spill crisis. Ó 2008 Elsevier Ltd. All rights reserved. Keywords: Oil-spill; Operational oceanography; Real-time; Forecast; Spanish waters 1. Introduction The Prestige wreck and the ensuing major oil-spill crisis highlighted the limitations of the Spanish operational oceanography capability to respond effectively to a crisis of this nature. Despite the successful efforts of several groups and institutions to forecast the drift and spread of the oil-spill during and after the immediate crisis (Montero et al., 2003; Daniel et al., 2003; Hackett, 2004; Garcı ´a- Ladona et al., 2005; Castanedo et al., 2006), the event illus- trated the need to improve the operational oceanography infrastructure in Spain. Particular shortcomings were iden- tified, the lack of operational systems able to forecast cur- rents and transports being the most pressing one. In response, the ESEOO (Establecimiento de un Sistema Espan ˜ol de Oceanografı ´a Operacional) Project was estab- lished and funded by the Spanish Ministry of Science. The main objective of the ESEOO Project was to promote 0025-326X/$ - see front matter Ó 2008 Elsevier Ltd. All rights reserved. doi:10.1016/j.marpolbul.2007.12.021 * Corresponding author. Tel.: +34 91 5245500; fax: +34 91 5245504. E-mail address: [email protected] (M.G. Sotillo). www.elsevier.com/locate/marpolbul Available online at www.sciencedirect.com Marine Pollution Bulletin 56 (2008) 686–703

Welcome message from author
This document is posted to help you gain knowledge. Please leave a comment to let me know what you think about it! Share it to your friends and learn new things together.
Transcript
Available online at www.sciencedirect.com
www.elsevier.com/locate/marpolbul
Marine Pollution Bulletin 56 (2008) 686–703
Towards an operational system for oil-spill forecast overSpanish waters: Initial developments and implementation test
M.G. Sotillo a,*, E. Alvarez Fanjul a, S. Castanedo b, A.J. Abascal b, J. Menendez c,M. Emelianov d, R. Olivella d, E. Garcıa-Ladona d, M. Ruiz-Villarreal e, J. Conde f,
M. Gomez a, P. Conde e, A.D. Gutierrez b, R. Medina b
a Organismo Publico Puertos del Estado (PdE), Av Partenon, 10, 28042 Madrid, Spainb Ocean and Coastal Research Group, IHCantabria, Universidad de Cantabria, Avda. de los Castros s/n, 39005 Santander, Spain
c Sociedad de Salvamento y Seguridad Marıtima (SASEMAR). Centro Jovellanos, 33393 Veranes, Gijon, Spaind Departamento de Oceanografıa Fısica, Instituto de Ciencias del Mar, CSIC, Passei Marıtim, 37-49, 08003 Barcelona, Spain
e Instituto Espanol de Oceanografıa (IEO), Muelle de Animas s/n, 15001 A Coruna, Spainf Instituto Nacional de Meteorologıa (INM), C/Leonardo Prieto Castro, 8, 28040 Madrid, Spain
Abstract
The ESEOO Project, launched after the Prestige crisis, has boosted operational oceanography capacities in Spain, creating new oper-ational oceanographic services and increasing synergies between these new operational tools and already existing systems. In conse-quence, the present preparedness to face an oil-spill crisis is enhanced, significantly improving the operational response regardingocean, meteorological and oil-spill monitoring and forecasting. A key aspect of this progress has been the agreement between the scien-tific community and the Spanish Search and Rescue Institution (SASEMAR), significantly favoured within the ESEOO framework.Important achievements of this collaboration are: (1) the design of protocols that at the crisis time provide operational state-of-the-art information, derived from both forecasting and observing systems; (2) the establishment, in case of oil-spill crisis, of a new specializedunit, named USyP, to monitor and forecast the marine oceanographic situation, providing the required met-ocean and oil-spill informa-tion for the crisis managers. The oil-spill crisis scenario simulated during the international search and rescue Exercise ‘‘Gijon-2006”,organized by SASEMAR, represented an excellent opportunity to test the capabilities and the effectiveness of this USyP unit, as wellas the protocols established to analyze and transfer information. The results presented in this work illustrate the effectiveness of the oper-ational approach, and constitute an encouraging and improved base to face oil-spill crisis.� 2008 Elsevier Ltd. All rights reserved.
Keywords: Oil-spill; Operational oceanography; Real-time; Forecast; Spanish waters
1. Introduction
The Prestige wreck and the ensuing major oil-spill crisishighlighted the limitations of the Spanish operationaloceanography capability to respond effectively to a crisisof this nature. Despite the successful efforts of severalgroups and institutions to forecast the drift and spread of
0025-326X/$ - see front matter � 2008 Elsevier Ltd. All rights reserved.
doi:10.1016/j.marpolbul.2007.12.021
* Corresponding author. Tel.: +34 91 5245500; fax: +34 91 5245504.E-mail address: [email protected] (M.G. Sotillo).
the oil-spill during and after the immediate crisis (Monteroet al., 2003; Daniel et al., 2003; Hackett, 2004; Garcıa-Ladona et al., 2005; Castanedo et al., 2006), the event illus-trated the need to improve the operational oceanographyinfrastructure in Spain. Particular shortcomings were iden-tified, the lack of operational systems able to forecast cur-rents and transports being the most pressing one.
In response, the ESEOO (Establecimiento de un SistemaEspanol de Oceanografıa Operacional) Project was estab-lished and funded by the Spanish Ministry of Science.The main objective of the ESEOO Project was to promote
M.G. Sotillo et al. / Marine Pollution Bulletin 56 (2008) 686–703 687
operational oceanography in Spain, with a particular focuson the development and implementation of products,including the design of action protocols, suitable for usein marine emergencies at sea such as accidental oil spills(Alvarez Fanjul et al., 2007).
Many groups from several institutions and with very dif-ferent profiles and activities have been involved in this Pro-ject, generating a very stimulating and multi-disciplinaryframework that has definitely increased the synergybetween the groups more focused on basic research withthose more interested in the development and maintenanceof operational tools and systems. This collaboration frame-work has favoured the generation of state-of-the-art qual-ity operational products and an increase of the ESEOOparticipants’ potentialities. Furthermore, the participation,as an active member, of the Spanish office for rescue at Sea(SASEMAR), the institution responsible of fighting againstsea pollution at national level and therefore one of the mostimportant end-user of any operational oceanographicproduct, has ensured that the operational tools generatedare being designed targeting the requirements and specificneeds of this key final end-user.
In recent years, the inclusion in the protocols of infor-mation provided by hybrid environmental forecasting sys-tem, combination of operational oceanography systemsand oil-spill models has been demonstrated as a veryencouraging measure to minimize oil-spill impacts (Jordiet al., 2006). In that sense, the establishment of the ESEOORegional Ocean Forecast System, created to operationallyprovide ocean forecasts at regional scale (daily updatedforecasts available at http://www.eseoo.org) and the devel-opment of the TESEO transport System, as well as thecombination of both systems can be seen as especiallyremarkable ESEOO achievements towards the generationof useful operational services that help in the managementof oil-spill crisis occurred in Spanish waters.
Important efforts have been carried out in order toestablish this ESEOO Regional Ocean Forecast System(Sotillo et al., 2007). The system has three different spatialdomains, named ESEOAT, ESEOMED and ESEOCANthat all together completely cover the Spanish waters, pro-viding realistic predictions of oceanographic variables,such as currents, that are determinant in the tracking andforecasting of spillage trajectories (Varlamov et al., 1999).
With regards to the oil-spill models, it is worth mention-ing that there are a large number of oil-spill models avail-able today (see Reed et al., 1999, for a review). Thecapability of these models depends on their final goals.Some of them were developed for providing rapid andaccurate prediction to minimize environmental damagecaused by oil, whereas other models were created to beused in oil-spill contingency planning and/or training.
When oil is spilled into the sea it undergoes a number ofphysical and chemical changes that depend on oil proper-ties, hydrodynamic conditions and environmental condi-tions. Spill models are usually composed of mathematicalformulations to represent oil transport and fate processes
(advection due to current and wind, spreading, emulsifica-tion, evaporation, dissolution, etc.). The most sophisticatedcurrently available models consist of a set of algorithms tosimulate the transport and fate of oil in three dimensions:OILMAP (ASA, 1997), MOHID (Miranda et al., 2000),MOTHY (Daniel et al., 2003); MOSM (Tkalich et al.,2003) and a model by Chao et al. (2003). However, whena quick response is required, models like GNOME, awidely-used two dimensional oil-spill trajectory model thatsimulates oil movement due to winds, currents and tides(NOAA, 2002), becomes an excellent choice. A transportsystem with similar characteristics to those belonging tothis second group has been developed within the ESEOOProject framework. The TESEO (Transport model ofESEOO) System is based on a transport module whichderives from the two-dimensional Lagrangian transportmodel PICHI, developed by the University of Cantabriaas part of the operational forecasting system created torespond to the Prestige oil-spill (Castanedo et al., 2006).
Apart from the generation of the aforementioned oper-ational services useful to manage the oil-spill crisis, anothercrucial and valuable aspect of the ESEOO project has beenthe regular participation within real training exercisesorganised by SASEMAR. The engagement of the ESEOOteams in the development of such exercises, has on the onehand, allowed evaluating the capabilities, efficiency andcoordination of the aforementioned ESEOO operationaltools and, on the other hand, permitted the design andimplementation a specialized unit named USyP (Unidadde Seguimiento y Prediccion) to monitor and forecast themarine system.
This USyP Unit has been designed to be established incase of a crisis or emergency at sea, its main duty beingto provide detailed ocean and meteorological informationto the authorities and decision makers at the time of the cri-sis. This framework allows specialists from different techni-cal fields and working for different institutions to analyzethe available information (i.e. observations, climatologicaland simulated data) and synthesize it to provide the bestpossible, as in more informed, answer to the crisis.
The aforementioned exercises included rescue opera-tions and oil-spill scenarios simulated by means of drifterbuoys. They have represented excellent opportunities totest the capabilities, as well as the effectiveness, of the USyPUnit and the protocols established to analyze and to trans-fer information. Throughout the past two years, a series ofthree exercises were performed in different regions of theSpanish coast (Baleares-2005, Gijon-2006 and Finisterre-2006). These exercises allowed the identification of short-comings and potential lacks of the preliminary USyPdesigns, and consequently its upgrading and improvement.
The goal of this paper is to demonstrate the utility ofhaving a USyP Unit working in case of an emergency atsea, illustrating it through a comprehensive overview ofthe oil-spill Exercise Gijon-2006. Special emphasis is puton the efforts made to characterize the ocean and meteoro-logical conditions, as well as on operational aspects, such
688 M.G. Sotillo et al. / Marine Pollution Bulletin 56 (2008) 686–703
as information transfer, model nesting, availability of spe-cific in situ measurements, etc.
The organization of the paper is as follows. A briefdescription of the Gijon-2006 Exercise and the USyP Unitis provided in Section 2. Section 3 presents the oceanin situ monitoring performed during the Exercise. Follow-ing sections are devoted to describe the environmental con-ditions during the Exercise and how they were monitoredand forecasted (Section 4) and gives a measure of how effi-cient the ESEOO transport model was during the oil-spillExercise (Section 5). Finally, main conclusions are drawnin Section 6
2. The Gijon-2006 experiment
Since 1992, SASEMAR has been carrying out differentreal training exercises with the aim of being prepared todeal and manage any crisis derived of any emergency atsea. The performances of this kind of exercises at regularintervals are part of the international commitments ofSASEMAR with the UN-dependent International Mari-time Organization (IMO). In 1995, this organism approvedthe Oil Pollution Preparedness, Response and Co-opera-tion (OPRC) agreement that establishes recommendationsin terms of maritime security and accidental pollution at
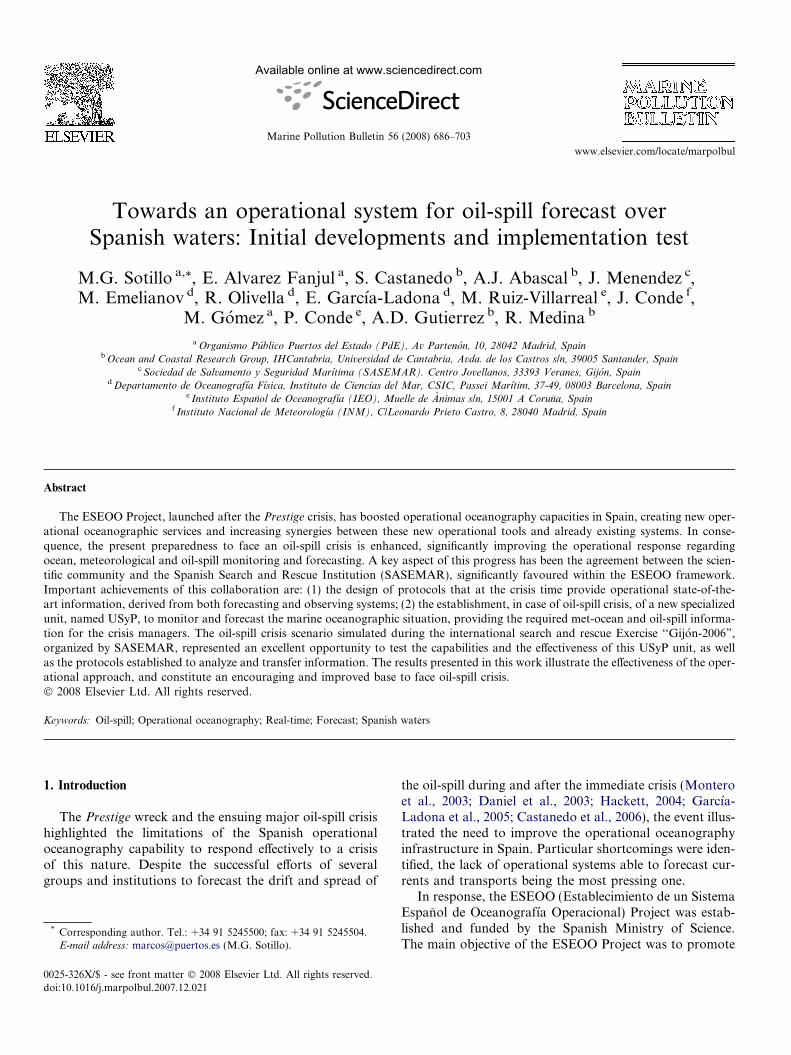
Fig. 1. The Gijon-2006 Exercise: geographical domain and details of the si(ESEOAT and local application). Numbers 1 and 2 represent the Navia andPenas buoy (43.730N, 6.170W).
sea. Additionally, by means of this agreement, the signingstates are urged to carry out an anti pollution exercise atleast once a year. The, Gijon-2006 Exercise presented here,is one of these OPRC Exercises.
The Gijon-2006 Exercise endeavours to represent a sim-ulated oil-spill crisis scenario, started by the collision, andhightened by the intense fog conditions existing in the zone,between a bulk carrier and an oil tanker (named ALFA) 10miles north from the Cape Torres (Gijon, Spain). The tan-ker is floating coastward up to a position located 1 milenorth from the Cape Torres where finally wreck. The colli-sion produces damages in the tanker and a consequent spillof 15,000 tones of Arabian-light oil. The Gijon-2006 Exer-cise started on the 23rd May 2006 at 10:00 local time. Here-after, the chronology of events will be referred to this date(day 1), and finished 3 days later, the 26th May 2006 (day4). A geographical description of the scenario is shown inFig. 1.
The tanker reports the details of the situation by radioto a coastal station producing the warning that triggersoff different alert mechanisms: The Coordination and Res-cue Center (Centro de Coordinacion y Salvamento, CCS) isalerted and it mobilizes the available air and marineresources and informs the National Rescue CoordinationCenter (Centro Nacional de Coordinacion de Salvamento,
mulated oil-spill scenario. Spatial domains of ocean model applicationsNalon mouths, respectively. Number 3 illustrates the location of the PdE
M.G. Sotillo et al. / Marine Pollution Bulletin 56 (2008) 686–703 689
CNCS) and the Marine Master’s Office (Capitania Marıti-ma). Then, the National Marine Pollution ContingencyPlan (Plan Nacional de contingencias por ContaminacionMarina Accidental), activated by the government as a pre-cautionary measure to fight against the pollution, and theOperation Center CECOMAR (Centro de Coordinacionde Actividades en la Mar), directed by an on-scene com-mander, are called and set up in Gijon to coordinate thewhole crisis. The CECOMAR makes a call to set up theUSyP Unit that acts during the crisis as a support groupto the CECOMAR Operation Center, providing environ-mental conditions and oil-spill predictions to the crisisroom.
3. The operational working environment: the USyP unit
As it was previously commented, the USyP unit is onlyset up in case of an oil-spill emergency. The main assign-ment of this Unit is to keep the CECOMAR managementteam informed at any time during the extent of the crisis onthe ocean and meteorological conditions prevailing in theaffected zone. Likewise, the Unit provides the CECOMARany available forecast on environmental conditions and oil-spill trajectories.
The first time that a USyP unit was call up to monitorand forecast the marine environment was during the Exer-cise Baleares-2005. This Mediterranean Exercise, also orga-nized by SASEMAR following the OPRC agreement, wasprior to the Gijon-2006 Exercise. Never before in the his-tory of the SASEMAR training exercises, was a technicalworking group with the characteristics of the one that con-figured that first USyP Unit utilized. The MediterraneanExercise highlighted the need for this novelty. Likewise thisexercise was useful to identify certain operational short-comings of this first USyP outline that should be improved
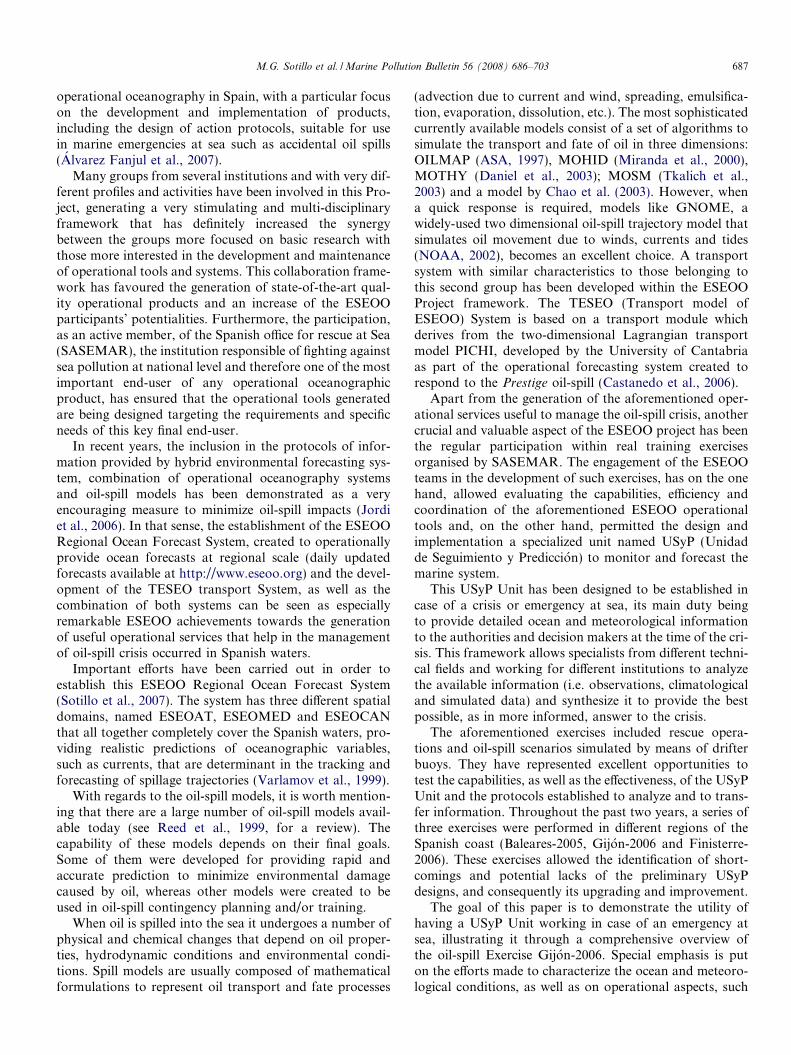
Fig. 2. The US
in the future. Thus, the acquired experience was quite valu-able to pre-configure the main activities of the USyP con-cept for the next SASEMAR Exercise: the here describedGijon-2006 Exercise.
During the Gijon-2006 Exercise, the USyP was made upby specialists from operational and research agencies andby university groups (Instituto Nacional de Meteorologıa,INM; Puertos del Estado, PdE; Universidad de Cantabria,UC; Consejo Superior de Investigaciones Cientıficas,CSIC; Instituto Espanol de Oceanografıa, IEO and SASE-MAR) which were participating in the ESEOO project.Additional collaboration was set-up with other non-Span-ish institutions, such as Meteo-France, Le Cedre, FOAMand Mercator.
Fig. 2 shows the conceptual scheme of the USyP Unit.All the involved institutions provide the ocean and meteo-rological information to the USyP both via internet and ftpservers, whereas the drift forecasts are running in-situ bythe UC and SASEMAR representatives. The results ofthese drift forecasts are integrated in a GIS tool used byCECOMAR to manage the crisis.
During an emergency, the core activity of the USyP isorganised around four technical tasks: (i) meteorologicaland wave forecasting, (ii) ocean forecasting, (iii) dispersionmodels and (iv) new data acquisition and monitoring dur-ing the event. The numerical models for forecasts maydepend on the region in which the emergency is occurring.In the following subsections, we describe the system thatoperated for the Gijon-2006 experiment.
3.1. Atmospheric and wave forecast systems
The forecasted atmospheric fields were produced by theWeather Forecast System, run by the Spanish Meteorolog-ical Institute (INM). This system is based on the 6.1.2
yP scheme.
690 M.G. Sotillo et al. / Marine Pollution Bulletin 56 (2008) 686–703
version of the HIRLAM model (Unden et al., 2002; HIR-LAM project: http://hirlam.org). It is a hydrostatic, prim-itive equations, high resolution, limited area model whichincludes a 3D-VAR data assimilation scheme. At present,the system is integrated, with a 0.16� spatial resolution,four times a day with 72 h horizon. The boundary condi-tions come from the ECMWF (European Centre for Med-ium range Weather Forecast) atmospheric global model.
The following near-surface diagnostic variables andsurface fluxes were specifically provided by this HIRLAM-based system for the Exercise: 10-m wind (speed anddirection); mean sea level pressure; 2 m air temperature;2 m relative humidity; total cloud cover; total amount ofprecipitation; sensible and latent heat fluxes; and long waveand short wave radiation fluxes. The atmospheric systemalso includes a verification procedure that compares fore-casts with observations to estimate the model skills by meansof some statistical parameters, as bias or mean square error.
The wave state information was provided by the WaveForecast System, developed by PdE, and currently opera-tionally run by the INM. This wave forecasting system isbased on two main applications of the WAM model (theWAMDI group, 1988) for the Atlantic Ocean and theMediterranean Sea and one application of the WAVE-WATCH model (Tolman, 1991) in the strait of Gibraltar.Both models are third generation wave models which solvethe wave transport equation explicitly without any pre-sumption on the shape of the wave spectrum. The WAVE-WATCH model solves the wave action balance equation inthe presence of currents.
The forecast system is driven with wind fields from theINM Weather Forecast System operated on a twice aday cycle with a 72 h horizon.
The parameters provided for the exercise by the PdE-INM System were: significant wave height, mean wavedirection, peak and mean periods, as well as informationrelated to swell and wind sea conditions. The provided datahas a variable spatial resolution, going from 1� in open deepwaters to 0.25� close to the continental shelf. This increase inresolution towards the coastal areas is available thanks tothe use of a two-way nesting scheme in the Atlantic applica-tion (further information at Gomez and Carretero, 2006).
The PdE-INM Wave System has different high-resolu-tion grids, covering different areas of the Spanish coastalareas, nested into the regional grid (the one used in the Exer-cise). The forecast outputs are routinely verified on real-timeusing observations from PdE Buoy Network. Taking intoaccount the higher accuracy of this local wave data, it wouldbe recommended to plan the inclusion of this local high-res-olution wave information in future exercises to evaluate theimpact that its use has on the characterization of the wavestate, and on the local transport model results.
3.2. Ocean circulation models
During the whole Gijon-2006 Exercise, the ESEOOOcean Forecast System (Sotillo et al., 2007) provided,
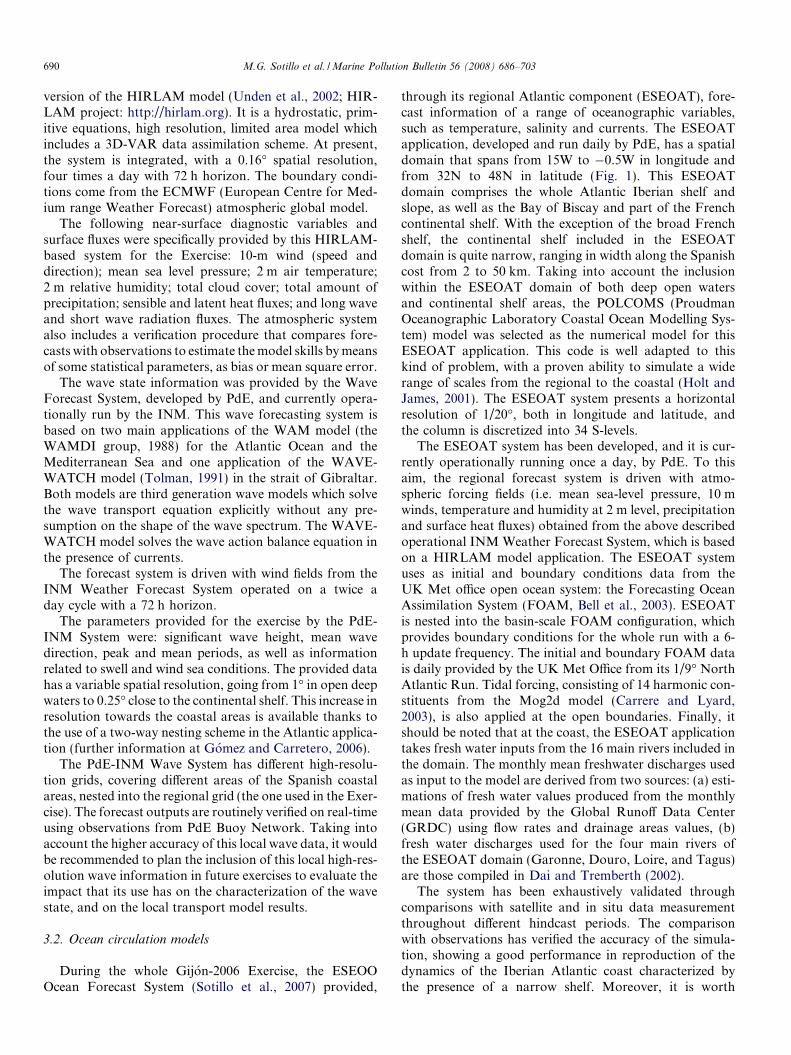
through its regional Atlantic component (ESEOAT), fore-cast information of a range of oceanographic variables,such as temperature, salinity and currents. The ESEOATapplication, developed and run daily by PdE, has a spatialdomain that spans from 15W to �0.5W in longitude andfrom 32N to 48N in latitude (Fig. 1). This ESEOATdomain comprises the whole Atlantic Iberian shelf andslope, as well as the Bay of Biscay and part of the Frenchcontinental shelf. With the exception of the broad Frenchshelf, the continental shelf included in the ESEOATdomain is quite narrow, ranging in width along the Spanishcost from 2 to 50 km. Taking into account the inclusionwithin the ESEOAT domain of both deep open watersand continental shelf areas, the POLCOMS (ProudmanOceanographic Laboratory Coastal Ocean Modelling Sys-tem) model was selected as the numerical model for thisESEOAT application. This code is well adapted to thiskind of problem, with a proven ability to simulate a widerange of scales from the regional to the coastal (Holt andJames, 2001). The ESEOAT system presents a horizontalresolution of 1/20�, both in longitude and latitude, andthe column is discretized into 34 S-levels.
The ESEOAT system has been developed, and it is cur-rently operationally running once a day, by PdE. To thisaim, the regional forecast system is driven with atmo-spheric forcing fields (i.e. mean sea-level pressure, 10 mwinds, temperature and humidity at 2 m level, precipitationand surface heat fluxes) obtained from the above describedoperational INM Weather Forecast System, which is basedon a HIRLAM model application. The ESEOAT systemuses as initial and boundary conditions data from theUK Met office open ocean system: the Forecasting OceanAssimilation System (FOAM, Bell et al., 2003). ESEOATis nested into the basin-scale FOAM configuration, whichprovides boundary conditions for the whole run with a 6-h update frequency. The initial and boundary FOAM datais daily provided by the UK Met Office from its 1/9� NorthAtlantic Run. Tidal forcing, consisting of 14 harmonic con-stituents from the Mog2d model (Carrere and Lyard,2003), is also applied at the open boundaries. Finally, itshould be noted that at the coast, the ESEOAT applicationtakes fresh water inputs from the 16 main rivers included inthe domain. The monthly mean freshwater discharges usedas input to the model are derived from two sources: (a) esti-mations of fresh water values produced from the monthlymean data provided by the Global Runoff Data Center(GRDC) using flow rates and drainage areas values, (b)fresh water discharges used for the four main rivers ofthe ESEOAT domain (Garonne, Douro, Loire, and Tagus)are those compiled in Dai and Tremberth (2002).
The system has been exhaustively validated throughcomparisons with satellite and in situ data measurementthroughout different hindcast periods. The comparisonwith observations has verified the accuracy of the simula-tion, showing a good performance in reproduction of thedynamics of the Iberian Atlantic coast characterized bythe presence of a narrow shelf. Moreover, it is worth
M.G. Sotillo et al. / Marine Pollution Bulletin 56 (2008) 686–703 691
mentioning that comparisons of ESEOAT hindcasted out-puts with observations from the PdE Penas buoy along thePrestige Year (September 2002 to August 2003) highlightedthe realistic performance of the ESEOAT system over theExercise area (Sotillo et al., 2007) in terms of reproducingsurface temperature, salinity and currents. Additionally,forecast outputs are currently verified on real-time, usingto this aim observations from the PdE Buoy Network.
The predictions of surface currents provided by theESEOAT application were used during the Exercise asforcing fields of the TESEO system to generate the fore-casts of oil-spill trajectories. Additionally to this opera-tional scheme based on the ESEOAT and TESEOsystems, the IEO run during the Exercise an extra localhigh resolution ocean application based on the ROMSmodel (Haidvogel et al., 2000) to provide a more completedescription of shelf and slope processes. To this aim, IEOset-up a ROMS application (ROMS-AGRIF version)equipped with a 1-way nesting capability (Penven et al.,2006). This ROMS-AGRIF version allows the simulationof open-ocean and coastal processes at an affordable com-putational cost. The local system is able to adequatelyaccount for features forced by larger scale dynamics likethe Iberian Poleward Current and for coastal high-resolu-tion features like river plumes and wind-driven shelfcurrents.
The domain of interest was simulated using the ROMSmodel in high resolution with a 1.8 km grid covering theCantabrian shelf and slope and adjacent ocean from CapeFinisterre to the easternmost side of the Bay of Biscay(Fig. 1). Climatological run-off of 12 rivers along the north-ern Spanish coast and southwestern French coast wasintroduced. The spin-up simulation was run since October2005 in order to account for a realistic freshwater budget inthe area (see Otero et al., 2007). In the domain of interest,Nalon and Navia river contributions were considered,based on estimations from April 2006 data. Nalon andNavia river plumes influence the shelf dynamics adjacentto the area where the exercise took place and the effectsof their plumes can be observed in the monthly monitoringcruises of the IEO Radiales program from autumn tospring (Valdes et al., 2002). During the spin-up phase, threenested grids were employed: a 15 km grid covering anextended area around Iberia accounting for larger scale
Input
Environmentaldata
Oil data
Numerica
Trajectoand
fate algor
Fig. 3. Schematic structure
effects, an intermediate 5 km grid and the mentioned1.8 km grid. Presently, the set-up can also be forced atthe open boundaries with results from the ESEOAT sys-tem, but this capability was not ready at the time of theExercise.
During the exercise, the local application was run daily,and a 72-h forecast run with meteorological forcing datafrom the HIRLAM 12:00 UTC was made available tothe USyP. However, the results shown in the present con-tribution correspond to outputs from a later reanalysis dri-ven by atmospheric forcing, constructed with analysis and+5 h forecast data from each of the 4 daily HIRLAM-INM executions that were provided to the USyP alongthe exercise.
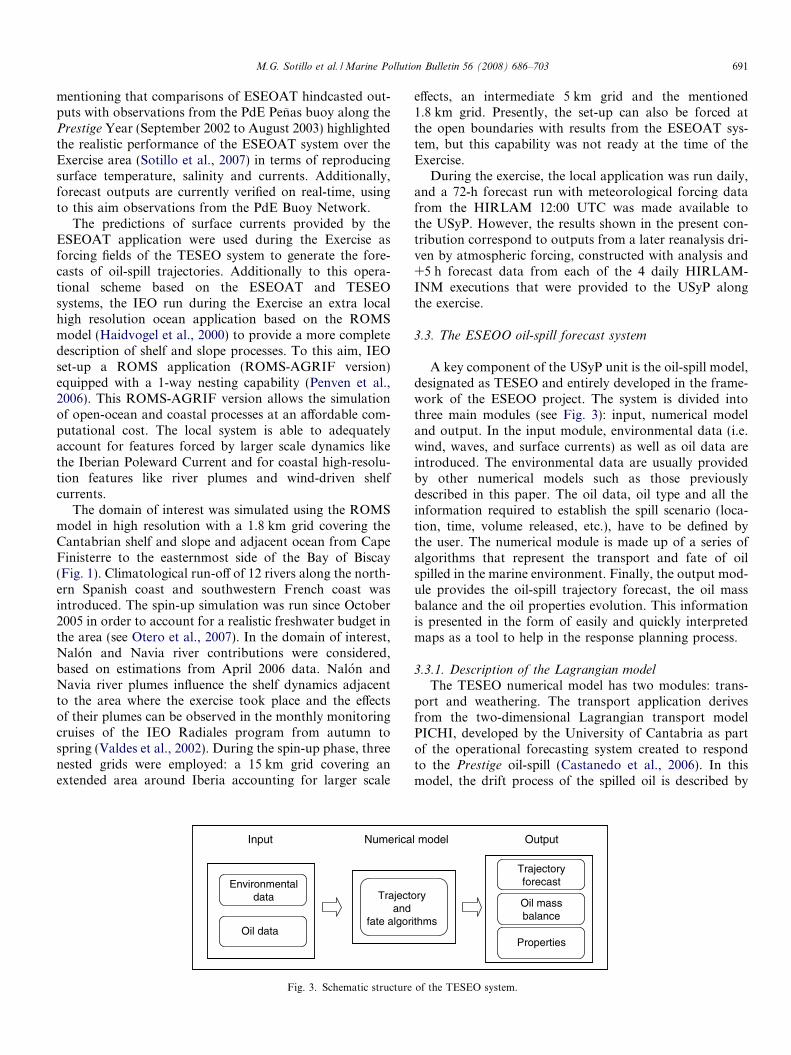
3.3. The ESEOO oil-spill forecast system
A key component of the USyP unit is the oil-spill model,designated as TESEO and entirely developed in the frame-work of the ESEOO project. The system is divided intothree main modules (see Fig. 3): input, numerical modeland output. In the input module, environmental data (i.e.wind, waves, and surface currents) as well as oil data areintroduced. The environmental data are usually providedby other numerical models such as those previouslydescribed in this paper. The oil data, oil type and all theinformation required to establish the spill scenario (loca-tion, time, volume released, etc.), have to be defined bythe user. The numerical module is made up of a series ofalgorithms that represent the transport and fate of oilspilled in the marine environment. Finally, the output mod-ule provides the oil-spill trajectory forecast, the oil massbalance and the oil properties evolution. This informationis presented in the form of easily and quickly interpretedmaps as a tool to help in the response planning process.
3.3.1. Description of the Lagrangian model
The TESEO numerical model has two modules: trans-port and weathering. The transport application derivesfrom the two-dimensional Lagrangian transport modelPICHI, developed by the University of Cantabria as partof the operational forecasting system created to respondto the Prestige oil-spill (Castanedo et al., 2006). In thismodel, the drift process of the spilled oil is described by
l model
ry
ithms
Output
Trajectoryforecast
Oil massbalance
Properties
of the TESEO system.
692 M.G. Sotillo et al. / Marine Pollution Bulletin 56 (2008) 686–703
tracking numerical particles equivalent to the oil slicks. Atevery time step, new positions of the particles are computedby the superposition of the transports induced by meanflow, tides, wind/waves and turbulent dispersion.
The numerical model solves the following vectorequation:
d~xdt¼~uað~xi; tÞ þ~udð~xi; tÞ ð1Þ
where ~xi is the particle position, and ~ua and ~ud are theadvective and diffusive velocities respectively in~xi.
The advective velocity, ~ua, is calculated as the linearcombination of currents and wind velocity and wave-induced Stokes drift, expressed as
~ua ¼ CC~uc þ CD~uw þ CH~uH ð2Þ
where ~uc is the surface current velocity; ~uw is the windvelocity at a height of 10 m over the sea surface; ~uH is thewave-induced Stokes drift, calculated as uH ¼ gH=8c,where g is the gravitational acceleration; H is the waveheight and c is the wave celerity (Dean and Dalrymple,1991). CD is the wind drag coefficient and CH is the wavecoefficient. Note, that Eq. (2) includes a coefficient affectingthe water current term, CC. This coefficient has been in-cluded to take into account the inherent uncertainty of sim-ulated currents.
The turbulent diffusive velocity, ~ud, is obtained using aMonte Carlo sampling in the range of velocities �~ud;~ud½ �that are assumed proportional to the diffusion coefficients(Maier-Reimer, 1982; Hunter et al., 1993). The velocityfluctuation for each time step is defined as the following:
j~udj ¼ffiffiffiffiffiffi6DDt
rð3Þ
where D is the diffusion coefficient, typically in the range of1–100 m2 s�1 (ASCE, 1996).
3.3.2. Weathering model description
Oil spilled in water is transported under forcing fromwind, waves and currents and it is affected by several phys-icochemical processes that depend on oil properties andenvironmental conditions: spreading, evaporation, emulsi-fication, dissolution, degradation, sedimentation andstranding. These processes are described in detail in severalstate-of-the-art reviews (Spaulding, 1988; ASCE, 1996;Reed et al., 1999). The mentioned oil-spill fate processeshave different time scales and different importance in termsof the oil mass balance. Therefore, process relevance willdepend on the time and spatial modelling scale. Taking thisinto account, in the TESEO regional system, the consid-ered oil fate processes are: evaporation and emulsification.
The oil evaporation is calculated based on an analyticalmodel proposed by Stiver and MacKay (1984) and thealgorithm proposed by MacKay et al. (1980) is used tocompute oil emulsification. The model also takes intoaccount oil stranding: if any oil particle reaches the shore-line, it is identified as ‘‘beached” and it is removed from the
computational process. Finally, changes in the oil densityand viscosity are computed based on temperature, evapo-rative loss and water uptake.
3.3.3. Transport model calibration
As it can be seen in Eq. (2) that , advective velocity,~ua,depends on currents, wind drift, and on the sea state. Nor-mally, the currents induced by winds and waves are repre-sented by the drift factors, CD and CH, usually empiricallydetermined. The model calibration consists of finding theoptimal values of these coefficients to minimize the differ-ences between numerical and actual trajectories as pro-vided by drifter observations.
The value of the wind drag coefficient, CD, varies from2.5% to 4.4%, with a mean value of 3–3.5% (ASCE,1996). Reed et al. (1994) suggest that, under weak windswithout breaking waves, a 3.5% of the wind speed in thedirection of the wind gives a good simulation of oil slickdrift in offshore areas. Usually wind and wave effects arelumped together and represented by the wind drag coeffi-cient. The specific role of waves in the slicks drift has beenpointed out by several authors. Sobey and Barker (1997)showed the importance of wave-driven transport in near-shore areas. They consider the wave-driven transport tobe a relevant process to be taken into account as it providesa natural mechanism for beaching of surface oil.
However, although it is possible to use coefficients thatrange between those reported in the bibliography, the workpresented in Abascal et al. (in press) shows the importanceof obtaining the best agreement model coefficients for theregion of interest. In the aforementioned work, wind andwave drag coefficients for the Bay of Biscay are determinedthrough an automatic calibration methodology based onthe Shuffled Complex Evolution method (Duan et al.,1992) developed by the University of Arizona. Accord-ingly, the oil-spill model calibration was formulated as anoptimization problem where an objective function that rep-resents the difference between the predicted trajectories andthe buoy paths has to be minimized. To do this, observa-tion data from 13 drifting buoys, deployed during the Pres-
tige accident (Garcıa-Ladona et al., 2005) were used. Oneof the main conclusions was that the optimal coefficientsare not constant, but a function of the numerical data usedfor the adjustment, the bathymetry, the buoys type, etc.This result was also found by Price et al. (2006). They sta-ted that the differences between the model and the observa-tions can be due to many factors: the input fields (winds,waves and currents) are provided by numerical modelswhich have their own errors, the oil-spill-simulating driftersmay contain location errors and also, one may questionwhether the used drifters behave as a real oil-spill.
In spite of all these sources of uncertainty, an opera-tional forecast system must predict the oil-spill trajectoriesin the most reliable way using the data available at themoment of an accident. To do this, and in order to improvethe operational system, the adjustment between the pre-dicted and the measured buoys trajectories has to be
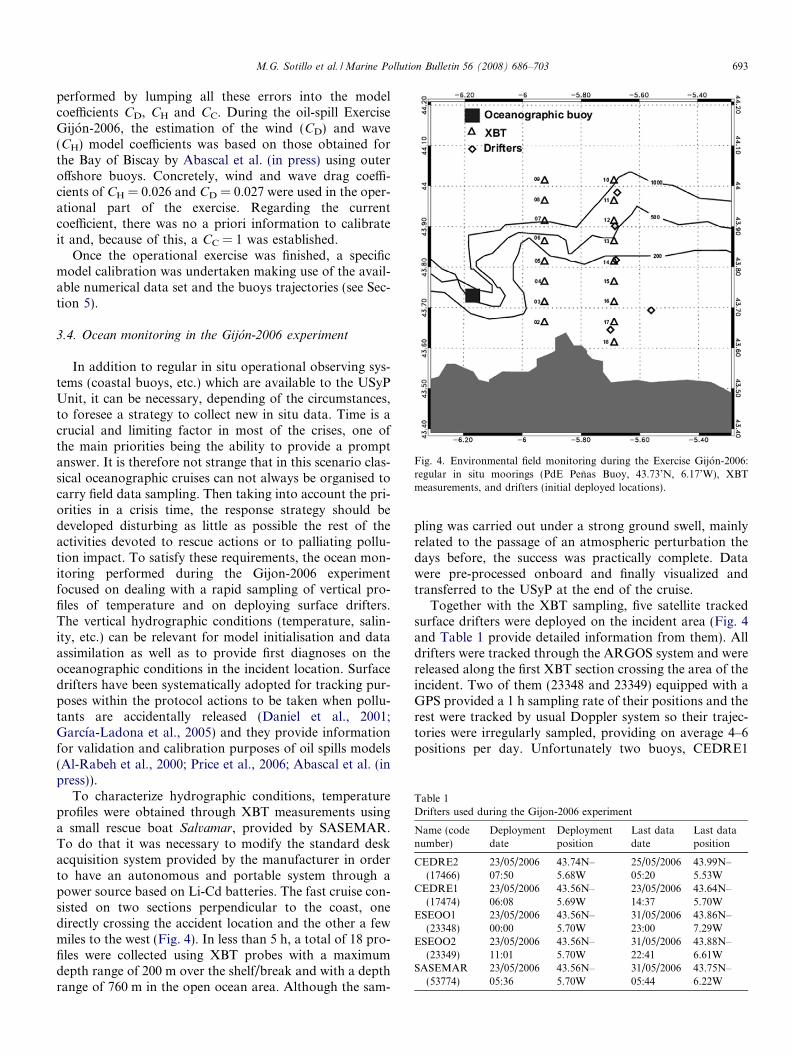
Fig. 4. Environmental field monitoring during the Exercise Gijon-2006:regular in situ moorings (PdE Penas Buoy, 43.73’N, 6.17’W), XBTmeasurements, and drifters (initial deployed locations).
Table 1Drifters used during the Gijon-2006 experiment
Name (codenumber)
Deploymentdate
Deploymentposition
Last datadate
Last dataposition
CEDRE2(17466)
23/05/200607:50
43.74N–5.68W
25/05/200605:20
43.99N–5.53W
CEDRE1(17474)
23/05/200606:08
43.56N–5.69W
23/05/200614:37
43.64N–5.70W
ESEOO1(23348)
23/05/200600:00
43.56N–5.70W
31/05/200623:00
43.86N–7.29W
ESEOO2(23349)
23/05/200611:01
43.56N–5.70W
31/05/200622:41
43.88N–6.61W
SASEMAR(53774)
23/05/200605:36
43.56N–5.70W
31/05/200605:44
43.75N–6.22W
M.G. Sotillo et al. / Marine Pollution Bulletin 56 (2008) 686–703 693
performed by lumping all these errors into the modelcoefficients CD, CH and CC. During the oil-spill ExerciseGijon-2006, the estimation of the wind (CD) and wave(CH) model coefficients was based on those obtained forthe Bay of Biscay by Abascal et al. (in press) using outeroffshore buoys. Concretely, wind and wave drag coeffi-cients of CH = 0.026 and CD = 0.027 were used in the oper-ational part of the exercise. Regarding the currentcoefficient, there was no a priori information to calibrateit and, because of this, a CC = 1 was established.
Once the operational exercise was finished, a specificmodel calibration was undertaken making use of the avail-able numerical data set and the buoys trajectories (see Sec-tion 5).
3.4. Ocean monitoring in the Gijon-2006 experiment
In addition to regular in situ operational observing sys-tems (coastal buoys, etc.) which are available to the USyPUnit, it can be necessary, depending of the circumstances,to foresee a strategy to collect new in situ data. Time is acrucial and limiting factor in most of the crises, one ofthe main priorities being the ability to provide a promptanswer. It is therefore not strange that in this scenario clas-sical oceanographic cruises can not always be organised tocarry field data sampling. Then taking into account the pri-orities in a crisis time, the response strategy should bedeveloped disturbing as little as possible the rest of theactivities devoted to rescue actions or to palliating pollu-tion impact. To satisfy these requirements, the ocean mon-itoring performed during the Gijon-2006 experimentfocused on dealing with a rapid sampling of vertical pro-files of temperature and on deploying surface drifters.The vertical hydrographic conditions (temperature, salin-ity, etc.) can be relevant for model initialisation and dataassimilation as well as to provide first diagnoses on theoceanographic conditions in the incident location. Surfacedrifters have been systematically adopted for tracking pur-poses within the protocol actions to be taken when pollu-tants are accidentally released (Daniel et al., 2001;Garcıa-Ladona et al., 2005) and they provide informationfor validation and calibration purposes of oil spills models(Al-Rabeh et al., 2000; Price et al., 2006; Abascal et al. (inpress)).
To characterize hydrographic conditions, temperatureprofiles were obtained through XBT measurements usinga small rescue boat Salvamar, provided by SASEMAR.To do that it was necessary to modify the standard deskacquisition system provided by the manufacturer in orderto have an autonomous and portable system through apower source based on Li-Cd batteries. The fast cruise con-sisted on two sections perpendicular to the coast, onedirectly crossing the accident location and the other a fewmiles to the west (Fig. 4). In less than 5 h, a total of 18 pro-files were collected using XBT probes with a maximumdepth range of 200 m over the shelf/break and with a depthrange of 760 m in the open ocean area. Although the sam-
pling was carried out under a strong ground swell, mainlyrelated to the passage of an atmospheric perturbation thedays before, the success was practically complete. Datawere pre-processed onboard and finally visualized andtransferred to the USyP at the end of the cruise.
Together with the XBT sampling, five satellite trackedsurface drifters were deployed on the incident area (Fig. 4and Table 1 provide detailed information from them). Alldrifters were tracked through the ARGOS system and werereleased along the first XBT section crossing the area of theincident. Two of them (23348 and 23349) equipped with aGPS provided a 1 h sampling rate of their positions and therest were tracked by usual Doppler system so their trajec-tories were irregularly sampled, providing on average 4–6positions per day. Unfortunately two buoys, CEDRE1
694 M.G. Sotillo et al. / Marine Pollution Bulletin 56 (2008) 686–703
(17474) and SASEMAR (53774), ceased to emit somehours after their deployment.
4. Environmental conditions during the Gijon-2006experiment
The exercise took place in oceanographic spring condi-tions. The mean seasonal ocean conditions in the area areinduced by seasonal changes in the prevailing winds, beingsouth-westerly during autumn-winter and north-easterlyduring spring-summer. From a climatological point ofview, during autumn and winter, a surface pole ward (east-ward along the Northern Iberian coast) flow is present inthe area, which turns to mainly westwards during spring–summer (Lavin et al., 2006; Ruiz-Villarreal et al., 2006a).However, the above described typical season pattern is asimplification, since noticeable variability in the circulationis introduced in response to high wind events. Indeed, the
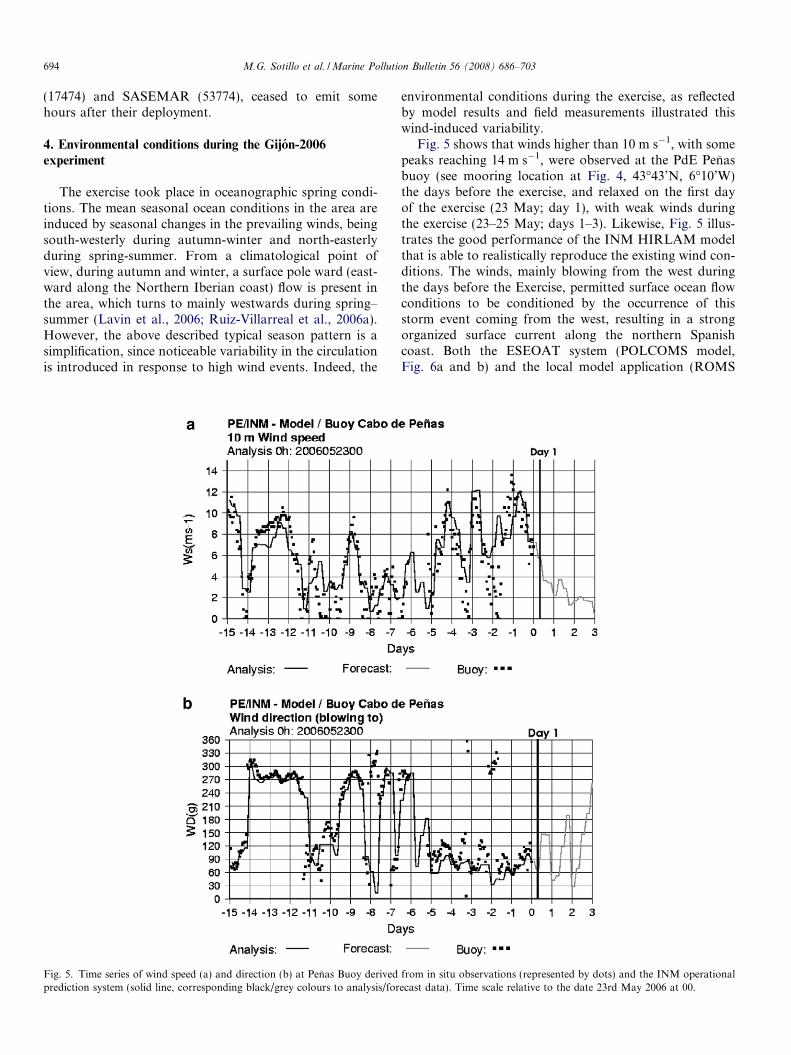
Fig. 5. Time series of wind speed (a) and direction (b) at Penas Buoy derivedprediction system (solid line, corresponding black/grey colours to analysis/for
environmental conditions during the exercise, as reflectedby model results and field measurements illustrated thiswind-induced variability.
Fig. 5 shows that winds higher than 10 m s�1, with somepeaks reaching 14 m s�1, were observed at the PdE Penasbuoy (see mooring location at Fig. 4, 43�43’N, 6�10’W)the days before the exercise, and relaxed on the first dayof the exercise (23 May; day 1), with weak winds duringthe exercise (23–25 May; days 1–3). Likewise, Fig. 5 illus-trates the good performance of the INM HIRLAM modelthat is able to realistically reproduce the existing wind con-ditions. The winds, mainly blowing from the west duringthe days before the Exercise, permitted surface ocean flowconditions to be conditioned by the occurrence of thisstorm event coming from the west, resulting in a strongorganized surface current along the northern Spanishcoast. Both the ESEOAT system (POLCOMS model,Fig. 6a and b) and the local model application (ROMS
from in situ observations (represented by dots) and the INM operationalecast data). Time scale relative to the date 23rd May 2006 at 00.
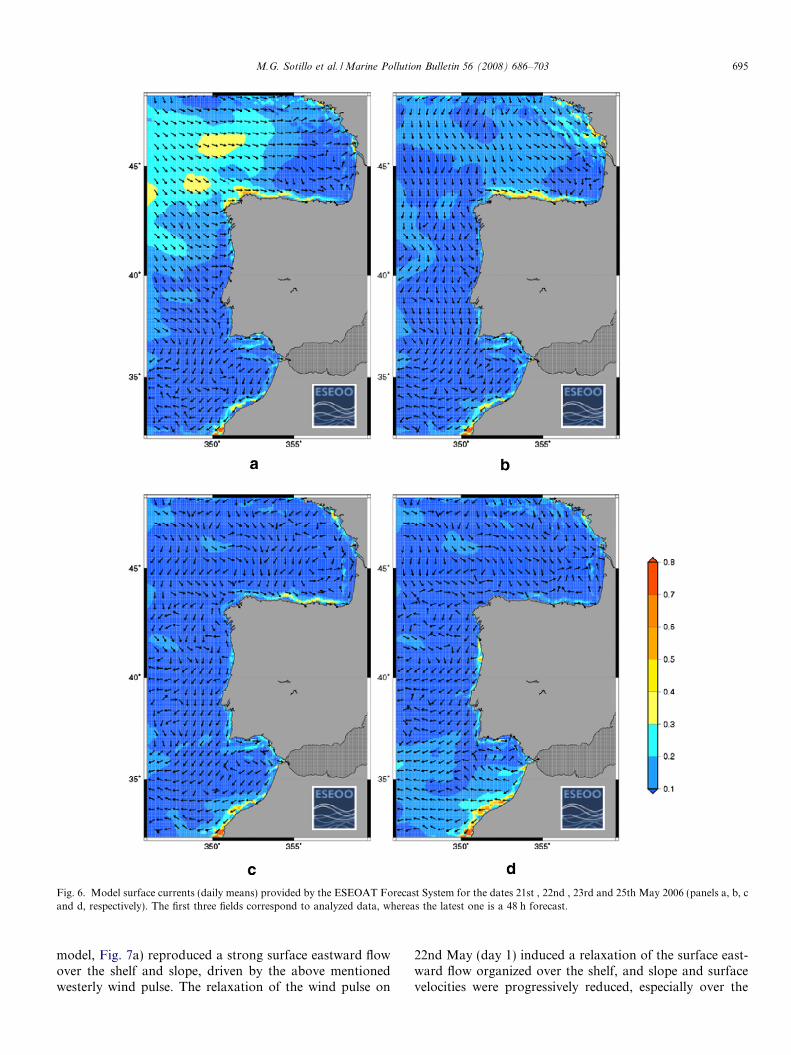
Fig. 6. Model surface currents (daily means) provided by the ESEOAT Forecast System for the dates 21st , 22nd , 23rd and 25th May 2006 (panels a, b, cand d, respectively). The first three fields correspond to analyzed data, whereas the latest one is a 48 h forecast.
M.G. Sotillo et al. / Marine Pollution Bulletin 56 (2008) 686–703 695
model, Fig. 7a) reproduced a strong surface eastward flowover the shelf and slope, driven by the above mentionedwesterly wind pulse. The relaxation of the wind pulse on
22nd May (day 1) induced a relaxation of the surface east-ward flow organized over the shelf, and slope and surfacevelocities were progressively reduced, especially over the
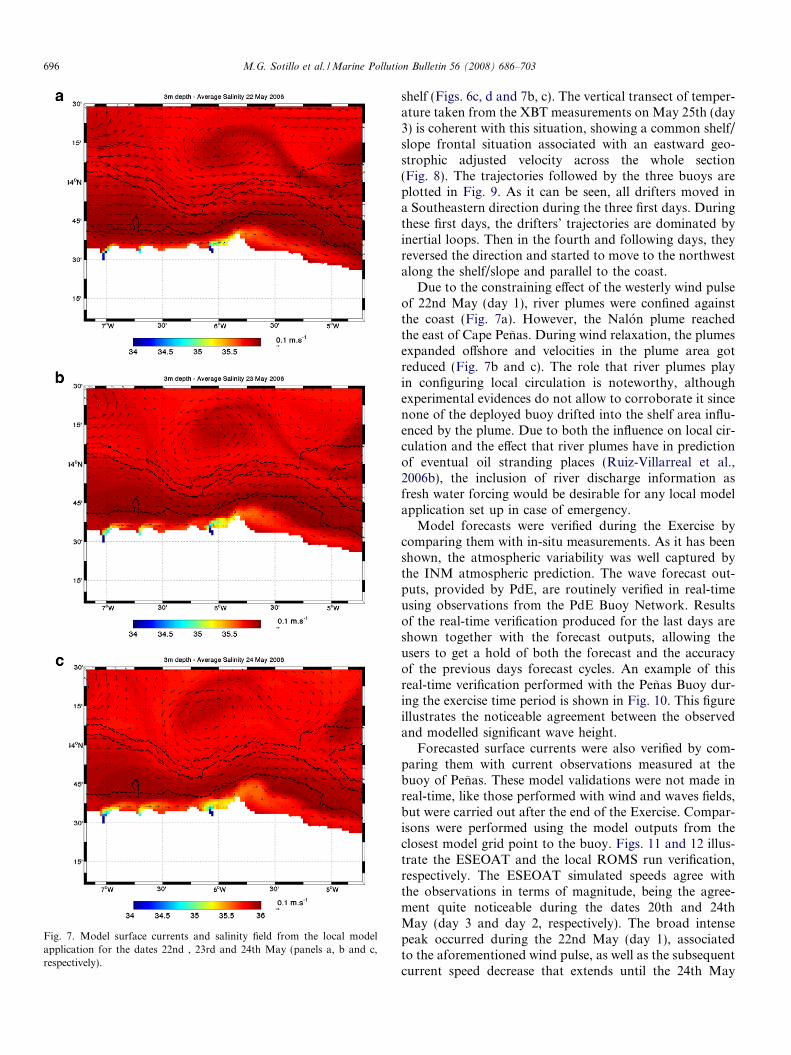
Fig. 7. Model surface currents and salinity field from the local modelapplication for the dates 22nd , 23rd and 24th May (panels a, b and c,respectively).
696 M.G. Sotillo et al. / Marine Pollution Bulletin 56 (2008) 686–703
shelf (Figs. 6c, d and 7b, c). The vertical transect of temper-ature taken from the XBT measurements on May 25th (day3) is coherent with this situation, showing a common shelf/slope frontal situation associated with an eastward geo-strophic adjusted velocity across the whole section(Fig. 8). The trajectories followed by the three buoys areplotted in Fig. 9. As it can be seen, all drifters moved ina Southeastern direction during the three first days. Duringthese first days, the drifters’ trajectories are dominated byinertial loops. Then in the fourth and following days, theyreversed the direction and started to move to the northwestalong the shelf/slope and parallel to the coast.
Due to the constraining effect of the westerly wind pulseof 22nd May (day 1), river plumes were confined againstthe coast (Fig. 7a). However, the Nalon plume reachedthe east of Cape Penas. During wind relaxation, the plumesexpanded offshore and velocities in the plume area gotreduced (Fig. 7b and c). The role that river plumes playin configuring local circulation is noteworthy, althoughexperimental evidences do not allow to corroborate it sincenone of the deployed buoy drifted into the shelf area influ-enced by the plume. Due to both the influence on local cir-culation and the effect that river plumes have in predictionof eventual oil stranding places (Ruiz-Villarreal et al.,2006b), the inclusion of river discharge information asfresh water forcing would be desirable for any local modelapplication set up in case of emergency.
Model forecasts were verified during the Exercise bycomparing them with in-situ measurements. As it has beenshown, the atmospheric variability was well captured bythe INM atmospheric prediction. The wave forecast out-puts, provided by PdE, are routinely verified in real-timeusing observations from the PdE Buoy Network. Resultsof the real-time verification produced for the last days areshown together with the forecast outputs, allowing theusers to get a hold of both the forecast and the accuracyof the previous days forecast cycles. An example of thisreal-time verification performed with the Penas Buoy dur-ing the exercise time period is shown in Fig. 10. This figureillustrates the noticeable agreement between the observedand modelled significant wave height.
Forecasted surface currents were also verified by com-paring them with current observations measured at thebuoy of Penas. These model validations were not made inreal-time, like those performed with wind and waves fields,but were carried out after the end of the Exercise. Compar-isons were performed using the model outputs from theclosest model grid point to the buoy. Figs. 11 and 12 illus-trate the ESEOAT and the local ROMS run verification,respectively. The ESEOAT simulated speeds agree withthe observations in terms of magnitude, being the agree-ment quite noticeable during the dates 20th and 24thMay (day 3 and day 2, respectively). The broad intensepeak occurred during the 22nd May (day 1), associatedto the aforementioned wind pulse, as well as the subsequentcurrent speed decrease that extends until the 24th May
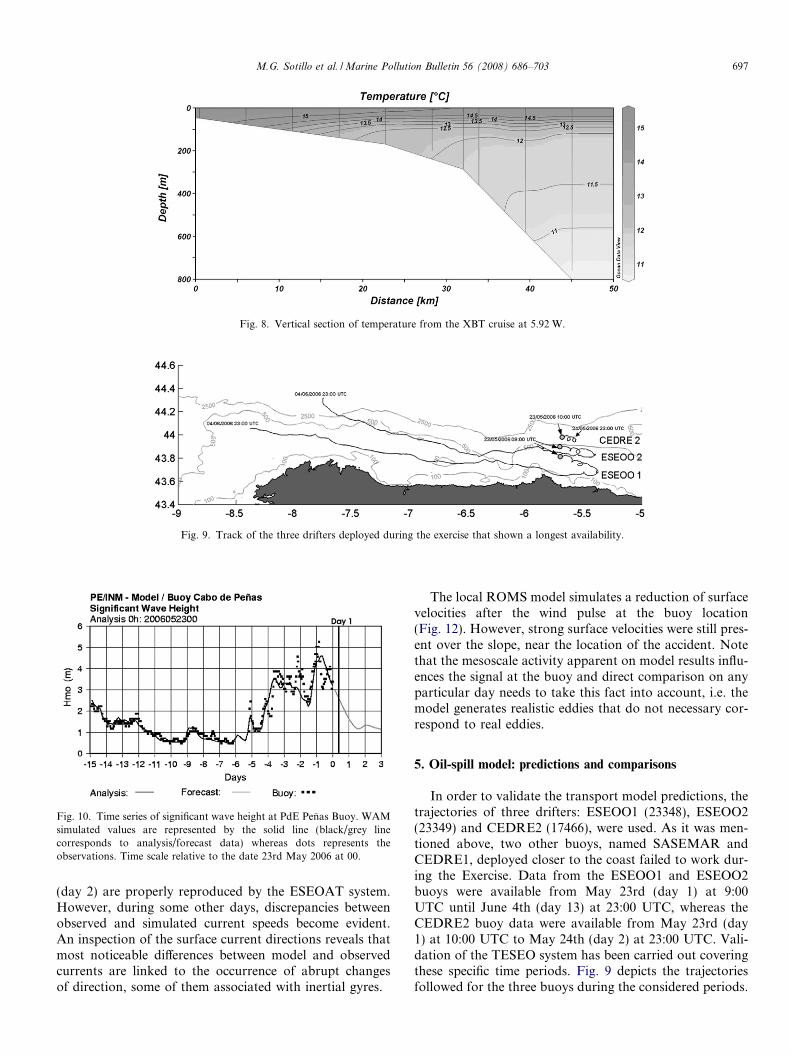
Fig. 8. Vertical section of temperature from the XBT cruise at 5.92 W.
Fig. 9. Track of the three drifters deployed during the exercise that shown a longest availability.
Fig. 10. Time series of significant wave height at PdE Penas Buoy. WAMsimulated values are represented by the solid line (black/grey linecorresponds to analysis/forecast data) whereas dots represents theobservations. Time scale relative to the date 23rd May 2006 at 00.
M.G. Sotillo et al. / Marine Pollution Bulletin 56 (2008) 686–703 697
(day 2) are properly reproduced by the ESEOAT system.However, during some other days, discrepancies betweenobserved and simulated current speeds become evident.An inspection of the surface current directions reveals thatmost noticeable differences between model and observedcurrents are linked to the occurrence of abrupt changesof direction, some of them associated with inertial gyres.
The local ROMS model simulates a reduction of surfacevelocities after the wind pulse at the buoy location(Fig. 12). However, strong surface velocities were still pres-ent over the slope, near the location of the accident. Notethat the mesoscale activity apparent on model results influ-ences the signal at the buoy and direct comparison on anyparticular day needs to take this fact into account, i.e. themodel generates realistic eddies that do not necessary cor-respond to real eddies.
5. Oil-spill model: predictions and comparisons
In order to validate the transport model predictions, thetrajectories of three drifters: ESEOO1 (23348), ESEOO2(23349) and CEDRE2 (17466), were used. As it was men-tioned above, two other buoys, named SASEMAR andCEDRE1, deployed closer to the coast failed to work dur-ing the Exercise. Data from the ESEOO1 and ESEOO2buoys were available from May 23rd (day 1) at 9:00UTC until June 4th (day 13) at 23:00 UTC, whereas theCEDRE2 buoy data were available from May 23rd (day1) at 10:00 UTC to May 24th (day 2) at 23:00 UTC. Vali-dation of the TESEO system has been carried out coveringthese specific time periods. Fig. 9 depicts the trajectoriesfollowed for the three buoys during the considered periods.
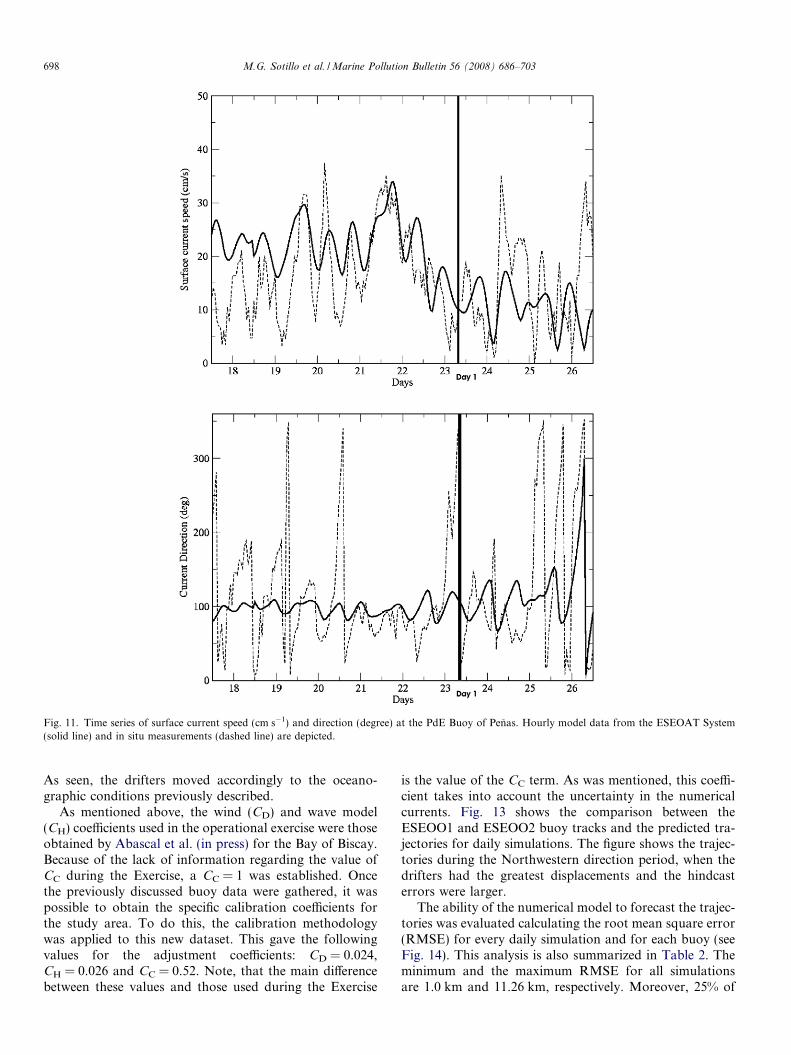
Fig. 11. Time series of surface current speed (cm s�1) and direction (degree) at the PdE Buoy of Penas. Hourly model data from the ESEOAT System(solid line) and in situ measurements (dashed line) are depicted.
698 M.G. Sotillo et al. / Marine Pollution Bulletin 56 (2008) 686–703
As seen, the drifters moved accordingly to the oceano-graphic conditions previously described.
As mentioned above, the wind (CD) and wave model(CH) coefficients used in the operational exercise were thoseobtained by Abascal et al. (in press) for the Bay of Biscay.Because of the lack of information regarding the value ofCC during the Exercise, a CC = 1 was established. Oncethe previously discussed buoy data were gathered, it waspossible to obtain the specific calibration coefficients forthe study area. To do this, the calibration methodologywas applied to this new dataset. This gave the followingvalues for the adjustment coefficients: CD = 0.024,CH = 0.026 and CC = 0.52. Note, that the main differencebetween these values and those used during the Exercise
is the value of the CC term. As was mentioned, this coeffi-cient takes into account the uncertainty in the numericalcurrents. Fig. 13 shows the comparison between theESEOO1 and ESEOO2 buoy tracks and the predicted tra-jectories for daily simulations. The figure shows the trajec-tories during the Northwestern direction period, when thedrifters had the greatest displacements and the hindcasterrors were larger.
The ability of the numerical model to forecast the trajec-tories was evaluated calculating the root mean square error(RMSE) for every daily simulation and for each buoy (seeFig. 14). This analysis is also summarized in Table 2. Theminimum and the maximum RMSE for all simulationsare 1.0 km and 11.26 km, respectively. Moreover, 25% of
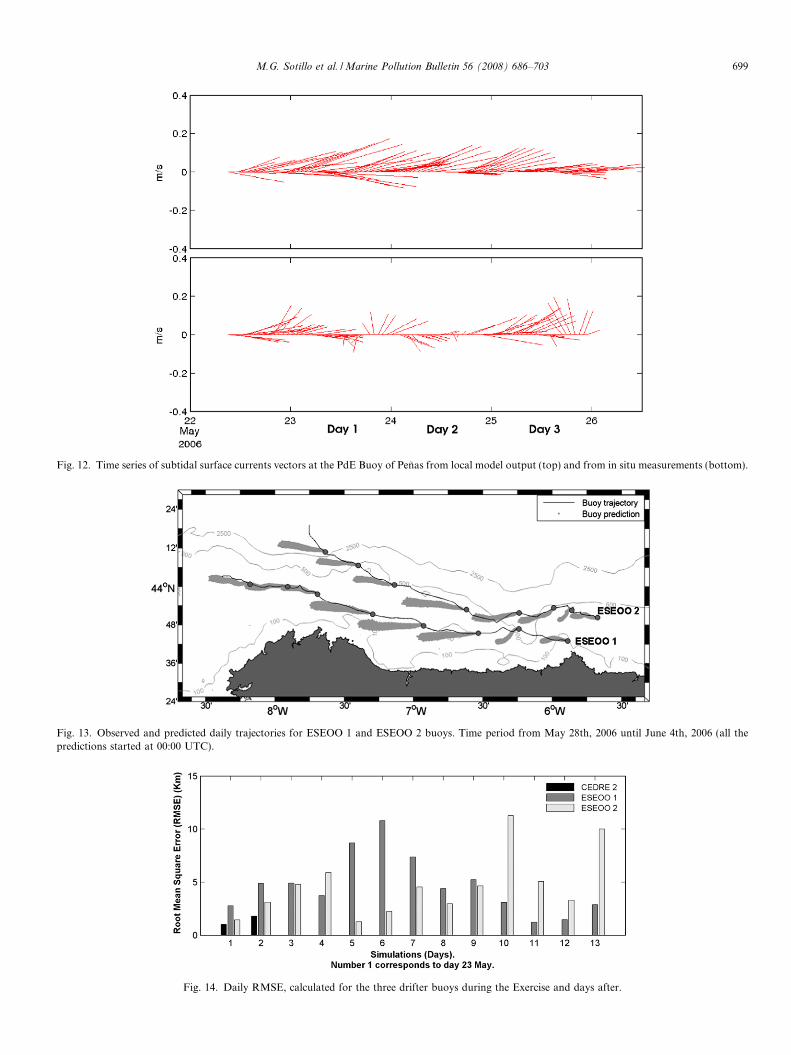
Fig. 12. Time series of subtidal surface currents vectors at the PdE Buoy of Penas from local model output (top) and from in situ measurements (bottom).
Fig. 13. Observed and predicted daily trajectories for ESEOO 1 and ESEOO 2 buoys. Time period from May 28th, 2006 until June 4th, 2006 (all thepredictions started at 00:00 UTC).
Fig. 14. Daily RMSE, calculated for the three drifter buoys during the Exercise and days after.
M.G. Sotillo et al. / Marine Pollution Bulletin 56 (2008) 686–703 699
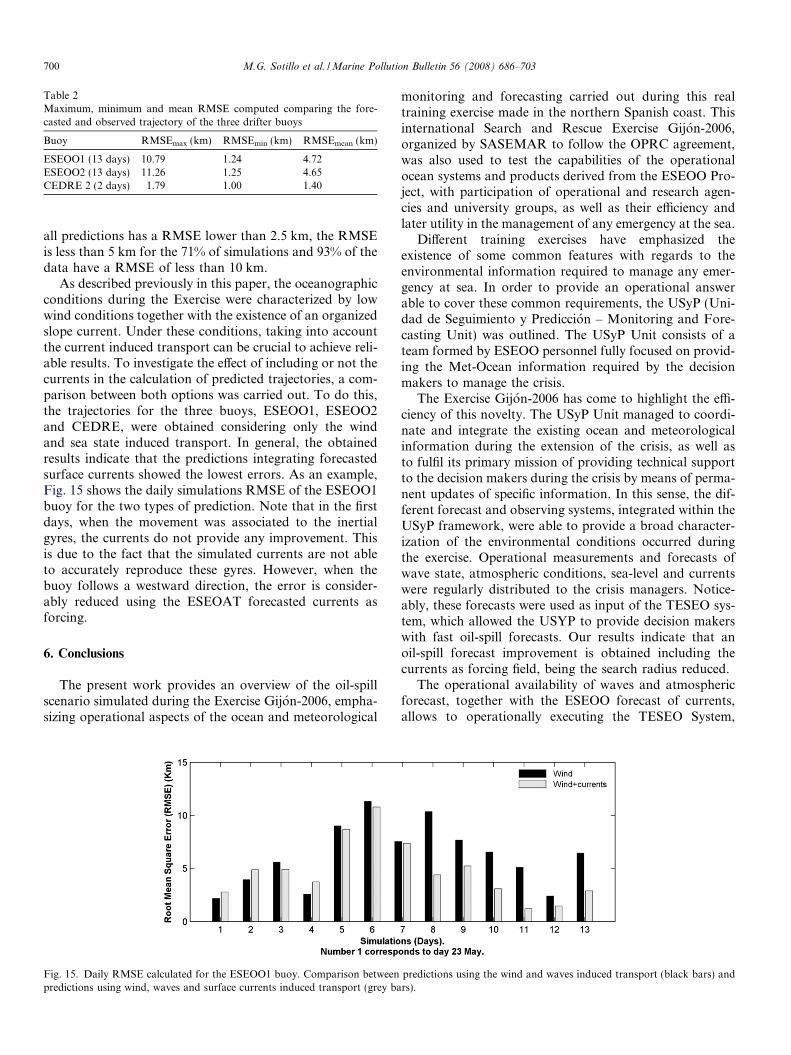
Table 2Maximum, minimum and mean RMSE computed comparing the fore-casted and observed trajectory of the three drifter buoys
Buoy RMSEmax (km) RMSEmin (km) RMSEmean (km)
ESEOO1 (13 days) 10.79 1.24 4.72ESEOO2 (13 days) 11.26 1.25 4.65CEDRE 2 (2 days) 1.79 1.00 1.40
700 M.G. Sotillo et al. / Marine Pollution Bulletin 56 (2008) 686–703
all predictions has a RMSE lower than 2.5 km, the RMSEis less than 5 km for the 71% of simulations and 93% of thedata have a RMSE of less than 10 km.
As described previously in this paper, the oceanographicconditions during the Exercise were characterized by lowwind conditions together with the existence of an organizedslope current. Under these conditions, taking into accountthe current induced transport can be crucial to achieve reli-able results. To investigate the effect of including or not thecurrents in the calculation of predicted trajectories, a com-parison between both options was carried out. To do this,the trajectories for the three buoys, ESEOO1, ESEOO2and CEDRE, were obtained considering only the windand sea state induced transport. In general, the obtainedresults indicate that the predictions integrating forecastedsurface currents showed the lowest errors. As an example,Fig. 15 shows the daily simulations RMSE of the ESEOO1buoy for the two types of prediction. Note that in the firstdays, when the movement was associated to the inertialgyres, the currents do not provide any improvement. Thisis due to the fact that the simulated currents are not ableto accurately reproduce these gyres. However, when thebuoy follows a westward direction, the error is consider-ably reduced using the ESEOAT forecasted currents asforcing.
6. Conclusions
The present work provides an overview of the oil-spillscenario simulated during the Exercise Gijon-2006, empha-sizing operational aspects of the ocean and meteorological
Fig. 15. Daily RMSE calculated for the ESEOO1 buoy. Comparison betweenpredictions using wind, waves and surface currents induced transport (grey ba
monitoring and forecasting carried out during this realtraining exercise made in the northern Spanish coast. Thisinternational Search and Rescue Exercise Gijon-2006,organized by SASEMAR to follow the OPRC agreement,was also used to test the capabilities of the operationalocean systems and products derived from the ESEOO Pro-ject, with participation of operational and research agen-cies and university groups, as well as their efficiency andlater utility in the management of any emergency at the sea.
Different training exercises have emphasized theexistence of some common features with regards to theenvironmental information required to manage any emer-gency at sea. In order to provide an operational answerable to cover these common requirements, the USyP (Uni-dad de Seguimiento y Prediccion – Monitoring and Fore-casting Unit) was outlined. The USyP Unit consists of ateam formed by ESEOO personnel fully focused on provid-ing the Met-Ocean information required by the decisionmakers to manage the crisis.
The Exercise Gijon-2006 has come to highlight the effi-ciency of this novelty. The USyP Unit managed to coordi-nate and integrate the existing ocean and meteorologicalinformation during the extension of the crisis, as well asto fulfil its primary mission of providing technical supportto the decision makers during the crisis by means of perma-nent updates of specific information. In this sense, the dif-ferent forecast and observing systems, integrated within theUSyP framework, were able to provide a broad character-ization of the environmental conditions occurred duringthe exercise. Operational measurements and forecasts ofwave state, atmospheric conditions, sea-level and currentswere regularly distributed to the crisis managers. Notice-ably, these forecasts were used as input of the TESEO sys-tem, which allowed the USYP to provide decision makerswith fast oil-spill forecasts. Our results indicate that anoil-spill forecast improvement is obtained including thecurrents as forcing field, being the search radius reduced.
The operational availability of waves and atmosphericforecast, together with the ESEOO forecast of currents,allows to operationally executing the TESEO System,
predictions using the wind and waves induced transport (black bars) andrs).
M.G. Sotillo et al. / Marine Pollution Bulletin 56 (2008) 686–703 701
and thus provided an operational oil-spill forecasts. Theavailability of this kind of prediction with a regularupdated represents a crucial tool for decision makers inorder to elaborate any answer to the crisis. In that sense,the results of this Exercise indicate that any furtherresearch that lead to a better simulation of currents overshelf and slope areas, marked by high circulation variabil-ity, as well as any improvement in terms of operationalavailability of forecasted products will lead to a noticeableenhancement of the information provided to the managersof any crisis situation.
The fact of having operationally disposal to model datatogether with in situ measurements allowed the USyP toprovide during the Exercise a complete picture of the envi-ronmental situation. Furthermore, the USyP performedand managed during the Exercise specific measurementcampaigns, consisted of deployment of satellite trackedsurface drifters and XBT measurements in a small rescueboat. These specific measurements provided a moreexhaustive knowledge of the prevailing hydrographicalconditions.
The exercise demonstrated that a data sampling cruisewith expendable probes can be carried out with minimumrequirements in terms of instrumentation and boat facili-ties, and does not interfere much with the rest of the activ-ities devoted to rescue actions or to palliate pollutionimpact. In this exercise, a rapid data acquisition cruise,consisting of two sections perpendicular to the coast, wasplanned and performed to obtain vertical profiles of tem-perature using XBT measurements. Moreover, the satellitetracked drifter buoys released during the Exercise helpedboth in the characterization of the oil-spill trajectoriesand in the evaluation of the capabilities of the codes usedto provide a correct forecast. The shown results illustratethe high level of agreement found between in-advance sim-ulations and actual buoy trajectories. The simulations car-ried out in the exercise and the later days show the benefitof including the ESEOO ocean currents information,reducing the search areas.
A second outcome is that such data observations mayprovide first diagnostics of environmental conditions andmay be used for model initialisation and data assimilation,surely having a potential impact in model forecasts. In par-ticular the uncertainties related with ocean current terms inthe TESEO model could benefit from a better knowledgeof current measurements either from direct observations,derived from altimetry or even inferred from the verticalthermohaline structure through just a limited sampling asthe one carried out during the Gijon-2006 (Emery, 1975;Maes, 1998). As an alternative direct data assimilation intothe hydrodynamic model would provide a better improve-ment of ocean currents at mesoscale which probablystrongly determine the short term forecast (Maes, 1999;Thacker et al., 2004). Altimetric data are suitable to resolveit but have some limitations concerning the signal qualityclose to the coast where often it is the most probably placefor a marine emergency to occur. Also, new recent
approaches to retrieve surface velocity fields from thermalimages (Turiel et al., 2005; Isern-Fontanet et al., 2006) arepromising but far from being ready for operational pur-poses. Nevertheless, all these options during the exercise herepresented were unfortunately unavailable but are alreadyplanned for further developments and implementations.
To summarize, the Gijon-2006 Exercise has been quiteuseful to integrate the operational ESEOO products andto demonstrate both its operational capabilities and abilityto serve as accurate tools for the fight against accidentalmarine pollution. In general terms, the Exercise Gijon-2006 has demonstrated the validity of the USyP as a helpfultechnical advisor, and at the same time it has provided apositive test of the real Spanish capabilities to face a futureoil-spill crisis, showing the noticeable improvement of oper-ational oceanography in Spain for the last years. Large mea-sure of the already proven USyP effectiveness is based on theactivities promoted within the ESEOO Project frameworkthat has resulted in operational systems and procedures thatare currently integrated in SASEMAR emergency proto-cols. The ongoing integration of the USyP unit in nationalplans for oil-spill response will ensure that this unit will beoperative in a real incident at any time of the year.
Finally, one must note that this USyP unit is a noveltythat comes to mostly fulfil the requirements, suggested byElliott and Jones (2000), to improve national responsesto major oil spills, making: (a) met-ocean forecasts morereadily available to the decision makers and to the scientificcommunity, (b) promoting a shift of the ocean and oil-spillmodels towards operational real-time forecasting and (c)creating a service, with proved operational protocols, ableto provide a state-of-the-art environmental forecasting andmonitoring at the time of the oil-spill. Furthermore, it canbe also concluded that the results here presented show thatregular operational exercises simulating real emergencies atsea are a fundamental tool to test, validate and quantify theadvantages and limitations of a service with this character-istics based on operational oceanography systems.
Acknowledgements
This work has been supported by the ESEOO Project(VEM2003-20577-C14-08), funded by the Spanish Ministryof Science and Technology. S. Castanedo would like tothank the Spanish Ministry of Science and Technologyfor the support under Ramon y Cajal Program. Crewsfrom the ships that participated in the Exercise Gijon-2006 are also gratefully acknowledged. The authors wouldlike to thank Carolina Echavarri for her valuable com-ments that helped to improve the use of the English in thispaper.
References
Abascal, A.J., Castanedo, S., Mendez, F.J., Medina, R., Losada, I.J., inpress. Calibration of a Lagrangian transport model using drifting
702 M.G. Sotillo et al. / Marine Pollution Bulletin 56 (2008) 686–703
buoys deployed during the Prestige oil spill. Journal of CoastalResearch. doi:10.2112/07-0849.1.
Al-Rabeh, A.H., Lardner, R.W., Gunay, N., 2000. Gulfspill version 2.0: asoftware package for oil spills in the Arabian Gulf. EnvironmentalModelling & Software 15, 425–442.
Alvarez Fanjul, E., Losada, I., Tintore, J., Menendez, J., Espino, M.,Parrilla, G., Martinez, I., Munuzuri, V.P., 2007. The ESEOO project:developments and perspectives for Operational Oceanography atSpain. In: Proceedings of ISOPE-2007: The 17th InternationalOffshore Ocean and Polar Engineering Conference. Lisbon, Portugal.
Applied Science Associates (ASA), 1997. OILMAP for Windows Tech-nical Manual. ASA Inc., Narrangansett, RI.
ASCE, 1996. State-of-the-art review of modelling transport and fate of oilspills, ASCE Committee on modelling oil spills. Water ResourcesEngineering Division. Journal of Hydraulic Engineering, 122, N11,594–609.
Bell, M.J., Barciela, R., Hines, A., Martin, M., McCulloch, M., Storkey, D.,2003. The forecasting ocean assimilation model (FOAM) system. In: H.Dahlin, N.C. Flemming, K. Nittis, S.E. Petersson (Eds.), Building TheEuropean Capacity In Operational Oceanography: Proceedings of theThird International Conference on EuroGOOS. Elsevier.
Carrere, L., Lyard, F., 2003. Modelling the barotropic response of theglobal ocean to atmospheric wind and pressure forcing. Comparisonswith observations. Geophysical Research Letters 30 (6), 1–8.doi:10.1029/2002GL01647.
Castanedo, S., Medina, R., Losada, I.J., Vidal, C., Mendez, F.J., Osorio,A., Juanes, J.A., Puente, A., 2006. The Prestige oil spill in Cantabria(Bay of Biscay). Part I: operational forecasting system for quickresponse, risk assessment and protection of natural resources. Journalof Coastal Research 22 (6), 1474–1489.
Chao, X., Shankar, J., Wang, S.S.Y., 2003. Development and applicationof oil spill model for Singapore coastal waters. Journal of HydraulicEngineering 129 (7), 495–503.
Dai, A., Tremberth, K.E., 2002. Estimates of freshwater discharge fromcontinents: latitudinal and seasonal variations. Journal of Hydrome-teorology 3, 660–687.
Daniel, P., Josse, P., Dandin, P., Gouriou, V., Marchand, M., Ctiercelin,S., 2001. Forecasting the Erika oil spills. In: Proceedings of the 2001International Oil Spill Conference, American Petroleum Institute,Washington, DC, pp. 649–655.
Daniel, P., Marty, F., Josse, P., Skandrani, C., Benshila, R., 2003.Improvement of drift calculation in Mothy operational oil spillprediction system. In: Proceeding of International Oil Spill Confer-ence, 6pp.
Dean, R.G., Dalrymple, R.A., 1991. In: Water Wave Mechanics forEngineers and Scientists. Advanced Series on Ocean Engineering, vol.2. World Scientific, Singapore.
Duan, Q., Sorooshian, S., Gupta, V., 1992. Effective and efficient globaloptimization for conceptual rainfall–runoff models. Water ResourcesResearch 28 (4), 1015–1031.
Elliott, J., Jones, B., 2000. The need for operational forecasting during oilspill response. Marine Pollution Bulletin 40, 110–121.
Emery, W.J., 1975. Dynamic height from temperature profiles. Journal ofPhysical Oceanography 5, 369–375.
Garcıa-Ladona, E., Font, J., del Rıo, E., Julia, A., Salat, J., Chic, O.,Orfila A., Alvarez, A., Basterretxea, G., Vizoso, G., Piro, O., Tintore,J., Gil, M., Herrera, J.L., Castanedo, S., 2005. The use of surfacedrifting floats in the monitoring of oil spills. The Prestige case. In:Proceedings of the 19 Biennial International Oil Spill Conference(IOSC), Miami, CD-ROM: 14718A.
Gomez, M., Carretero, J.C., 2006. Wave forecasting at the Spanish coasts.Journal of Atmospheric and Ocean Science 10 (4), 1–17.
Hackett, B., 2004. The impact of global ocean model forcing data on oilspill fate prediction: a comparative study of the Prestige accident.Technical Report No. 13-2004, Norwegian Meteorological Institute,Oslo, Norway, 26pp.
Haidvogel, D.B., Arango, K., Hedstrom, K., Beckmann, A., Malanotte-Rizzoli, P., Shchepetkin., 2000. Model evaluation experiments in the
North Atlantic basin: simulation in nonlinear terrain-following coor-dinates. Dynamics of Atmospheres and Oceans 32, 239–281.
Holt, J.T., James, I.D., 2001. An S co-ordinate density evolving model ofthe northwest European continental shelf. 1. Model description andstructure. Journal of Geophysical Research 106, 14015–14034.
Hunter, J.R., Craig, P.D., Phillips, H.E., 1993. On the use of random walkmodels with spatially variable diffusivity. Journal of ComputationalPhysics 106, 366–376.
Isern-Fontanet, J., Chapron, B., Klein, P., Lapeyre, G., 2006. Potentialuse of microwave SST for the estimation of surface ocean currents.Geophysical Research Letters 33, L24608.
Jordi, A., Ferrer, M.I., Vizoso, G., Orfila, A., Basterretxea, G., Casas, B.,Alvarez, A., Roig, D., Garau, B., Martınez, M., Fernandez, V.,Fornes, A., Ruiz, M., Fornos, J.J., Balaguer, P., Duarte, C.M.,Rodrıguez, I., Alvarez, E., Onken, R., Orfila, P., Tintore, J., 2006.Scientific management of Mediterranean coastal zone: a hybrid oceanforecasting system for oil spill and search and rescue operations.Marine Pollution Bulletin 53, 361–368.
Lavin, A., Valdes, L., Sanchez, F., Abaunza, P., Forest, A., Boucher, J.,Lazure, P., Jegou, A.M., 2006. The Bay of Biscay: the encountering ofthe ocean and the shelf. In: Robinson, A.P., Brink, K. (Eds.), The SeaVolume 14B: The Global Coastal Ocean. Interdisciplinary RegionalStudies and Syntheses. Harvard University Press, pp. 933–1001.
Mackay, D., Paterson, S., Trudel, K., 1980. A mathematical model of oilspill behaviour. Environmental Protection Service, Fisheries andEnvironment Canada, EE-7, 39p.
Maes, C., 1998. Estimating the influence of salinity on sea level anomaly inthe ocean. Geophysical Research Letters 25, 3551–3554.
Maes, C., 1999. A note on the vertical scales of temperature and salinityand their signature in dynamic height in the western Pacific Ocean.Implications for data assimilation. Journal of Geophysical Research104, 11037–11048.
Maier-Reimer, E., 1982. On tracer methods in computational hydrody-namics. In: Abbott, M.B., Cunge, J.A. (Eds.), . In: EngineeringApplication of Computational Hydraulics, vol. 1. Pitman, London(Chapter 9).
Miranda, F., Braunschweig, F., Leitao, P., Neves, R., Martins, F., Santos,A., 2000. MOHID 2000, a coastal integrated object oriented model. In:Hydraulic Engineering Software VIII. WIT Press.
Montero, P., Blanco, J., Cabanas, J.M., Maneiro, J., Pazos, Y., Morono,A., Balseiro, C., Caracedo, P., Gomez, B.P., Penabad, E., Perez-Munuzuri, V., Braumschweig, F., Fernandez, R., Leitao, P.C., Neves,R.J.J., 2003. Oil spill monitoring and forecasting on the Prestige-Nassau accident. In: Proceedings of 26th Artic and Marine Oil spillProgram (AMOP). Technical Seminar. Environment Canada, Ottawa,Canada, 2, 10013–10029.
NOAA, 2002. GNOME. General NOAA oil modeling environment.User’s manual. Office of Ocean Resources Conservation and Assess-ment. National Oceanic and Atmospheric Administration. Seattle,Washington.
Otero, P., Ruiz-Villarreal, M., Peliz, A., 2007. Variability of river plumesoff Northwest Iberia in response to wind events. Journal of MarineSystems. doi:10.1016/j.jmarsys.2007.05.016.
Penven, P., Debreu, L., Marchesiello, P., McWilliams, J.C., 2006.Evaluation and application of the ROMS 1-way embedding procedureto the central California Upwelling System. Ocean Modelling 12, 157–187.
Price, J.M., Reed, M., Howard, M.K., Johnson, W.R., Ji, Z., Marshall,C.F., Guinasso Jr., N.L., Rainey, G.B., 2006. Preliminary assessmentof an oil-spill trajectory model using a satellite-tracked, oil-spill-simulating drifters. Environmental Modelling & Software 21, 258–270.
Reed, M., Turner, C., Odulo, A., 1994. The role of wind and emulsifi-cation in modelling oil spill and surface drifter trajectories. SpillScience and Technology Bulletin 1 (2), 143–157.
Reed, M., Johansen, O., Brandvik, P.J., Daling, P., Lewis, A., Fiocco, R.,Mackay, D., Prentki, R., 1999. Oil spill modeling towards the close ofthe 20th century: overview of the state of the art. Spill Science andTechnology Bulletin 5 (1), 3–16.
M.G. Sotillo et al. / Marine Pollution Bulletin 56 (2008) 686–703 703
Ruiz-Villarreal, M., Gonzalez-Pola, C., Dıaz del Rıo, G., Lavın, A.,Otero, P., Piedracoba, S., Cabanas, J.M., 2006a. Oceanographicconditions in North and NortWest Iberia and their influence on thePrestige oil spill. Marine Pollution Bulletin 53 (5–7), 220–238.
Ruiz-Villarreal, M., Gonzalez-Pola, C., Otero, P., Dıaz del Rio, G., Lavın,A., Cabanas, J.M., 2006b. Circulation in Galicia-Southern Bay ofBiscay: reanalysis of the circulation influencing the Prestige oil spill.European Operational Oceanography: Present and Future, 342–348.
Sobey, R.J., Barker, C.H., 1997. Wave-driven transport of surface oil.Journal of Coastal Research 13 (2), 490–496.
Sotillo, M.G., Jordi, A., Ferrer, M.I., Conde, J., Tintore, J., Alvarez-Fanjul, E., 2007. The ESEOO regional ocean forecasting system. In:Proceedings of the ISOPE-2007: The 17th International OffshoreOcean and Polar Engineering Conference. Lisbon, Portugal.
Spaulding, M.L., 1988. A state-of-the-art review of oil spill trajectory andfate modeling. Oil and Chemical Pollution 4, 39–55.
Stiver, W., Mackay, D., 1984. Evaporation rate of spills of hydrocarbonsand petroleum mixtures. Environment Science & Technology 18, 834–840.
Thacker, W.C., Lee, S.K., Halliwell Jr., G.R., 2004. Assimilating 20 yearsof Atlantic XBT data into HYCOM: a first look. Ocean Modelling 7,183–210.
Tkalich, P., Huda, K., Gin, K.Y.H., 2003. A multiphase oil spill model.Journal of Hydraulic Research 41 (2), 115–125.
Tolman, H.L., 1991. A third-generation model for wind waves on slowlyvarying, unesteady and inhomogeneous depths and currents. Journalof Physical Oceanography 21, 782–797.
Turiel, A., Isern-Fontanet, J., Garcia-Ladona, E., Font, J., 2005.Multifractal method for the instantaneous evaluation of thestream function in geophysical flows. Physical Review Letters 95,104502.
Unden, P. et al., 2002. HIRLAM-5 Scientific Documentation.HIRLAM-5 Project, c/o Per Unden SMHI, SE-601 76. Norrkop-ing, Sweden.
Valdes, L., Lavin, A., Fernandez de Puelles, M.L., Varela, M., Anadon,R., Miranda, A., Caminas, J., Mas, J., 2002. Spanish Ocean Obser-vation System. IEO Core Project: studies on time series of oceano-graphic data. In: Flemming, N.C., Vallerga, N. (Eds.), OperationalOceanography: Implementation at the European and Regional Scales.Elsevier Science, pp. 99–105.
Varlamov, S., Yoon, J.H., Hirose, N., Kawamura, H., Shiohara, K., 1999.Simulation of the oil spill processes in the Sea of Japan with regionalcirculation model. Journal of Marine Science and Technology 4, 94–107.
Related Documents