Published Ahead of Print 11 August 2014. 2014, 196(20):3643. DOI: 10.1128/JB.01836-14. J. Bacteriol. Adam P. Arkin and Jeffrey M. Skerker Daniel R. Tarjan, Zhuchen Xu, Wenjun Shao, Dacia Leon, Adam Deutschbauer, Morgan N. Price, Kelly M. Wetmore, for Every Bacterial Gene Towards an Informative Mutant Phenotype http://jb.asm.org/content/196/20/3643 Updated information and services can be found at: These include: SUPPLEMENTAL MATERIAL Supplemental material REFERENCES http://jb.asm.org/content/196/20/3643#ref-list-1 at: This article cites 47 articles, 20 of which can be accessed free CONTENT ALERTS more» articles cite this article), Receive: RSS Feeds, eTOCs, free email alerts (when new http://journals.asm.org/site/misc/reprints.xhtml Information about commercial reprint orders: http://journals.asm.org/site/subscriptions/ To subscribe to to another ASM Journal go to: on September 18, 2014 by guest http://jb.asm.org/ Downloaded from on September 18, 2014 by guest http://jb.asm.org/ Downloaded from

Welcome message from author
This document is posted to help you gain knowledge. Please leave a comment to let me know what you think about it! Share it to your friends and learn new things together.
Transcript

Published Ahead of Print 11 August 2014. 2014, 196(20):3643. DOI: 10.1128/JB.01836-14. J. Bacteriol.
Adam P. Arkin and Jeffrey M. SkerkerDaniel R. Tarjan, Zhuchen Xu, Wenjun Shao, Dacia Leon, Adam Deutschbauer, Morgan N. Price, Kelly M. Wetmore, for Every Bacterial GeneTowards an Informative Mutant Phenotype
http://jb.asm.org/content/196/20/3643Updated information and services can be found at:
These include:
SUPPLEMENTAL MATERIAL Supplemental material
REFERENCEShttp://jb.asm.org/content/196/20/3643#ref-list-1at:
This article cites 47 articles, 20 of which can be accessed free
CONTENT ALERTS more»articles cite this article),
Receive: RSS Feeds, eTOCs, free email alerts (when new
http://journals.asm.org/site/misc/reprints.xhtmlInformation about commercial reprint orders: http://journals.asm.org/site/subscriptions/To subscribe to to another ASM Journal go to:
on Septem
ber 18, 2014 by guesthttp://jb.asm
.org/D
ownloaded from
on S
eptember 18, 2014 by guest
http://jb.asm.org/
Dow
nloaded from

Towards an Informative Mutant Phenotype for Every Bacterial Gene
Adam Deutschbauer,a Morgan N. Price,a Kelly M. Wetmore,a Daniel R. Tarjan,b,c Zhuchen Xu,d Wenjun Shao,a Dacia Leon,b,c
Adam P. Arkin,a,c,dJeffrey M. Skerkera,c,d
Physical Biosciences Division, Lawrence Berkeley National Laboratory, Berkeley, California, USAa; Earth Sciences Division, Lawrence Berkeley National Laboratory, Berkeley,California, USAb; Energy Biosciences Institute, University of California, Berkeley, California, USAc; Department of Bioengineering, University of California, Berkeley, California,USAd
Mutant phenotypes provide strong clues to the functions of the underlying genes and could allow annotation of the millions ofsequenced yet uncharacterized bacterial genes. However, it is not known how many genes have a phenotype under laboratoryconditions, how many phenotypes are biologically interpretable for predicting gene function, and what experimental conditionsare optimal to maximize the number of genes with a phenotype. To address these issues, we measured the mutant fitness of 1,586genes of the ethanol-producing bacterium Zymomonas mobilis ZM4 across 492 diverse experiments and found statistically sig-nificant phenotypes for 89% of all assayed genes. Thus, in Z. mobilis, most genes have a functional consequence under labora-tory conditions. We demonstrate that 41% of Z. mobilis genes have both a strong phenotype and a similar fitness pattern (cofit-ness) to another gene, and are therefore good candidates for functional annotation using mutant fitness. Among 502 poorlycharacterized Z. mobilis genes, we identified a significant cofitness relationship for 174. For 57 of these genes without a specificfunctional annotation, we found additional evidence to support the biological significance of these gene-gene associations, andin 33 instances, we were able to predict specific physiological or biochemical roles for the poorly characterized genes. Last, weidentified a set of 79 diverse mutant fitness experiments in Z. mobilis that are nearly as biologically informative as the entire setof 492 experiments. Therefore, our work provides a blueprint for the functional annotation of diverse bacteria using mutantfitness.
Assigning function to the millions of hypothetical and unchar-acterized genes identified by genome sequencing projects is a
substantial challenge in the postgenome era (1, 2). This problem iscompounded in bacteria due to the ease of genome sequencingand the vast reservoir of genetic diversity contained in pro-karyotes. Therefore, high-throughput experimental approachesare necessary to bridge the gap between genome sequencing andgenome characterization (3). One promising strategy is the use ofhigh-throughput mutagenesis to predict gene function based onthe observation that genes with similar functions tend to havesimilar growth phenotypes (4–9). In single-cell organisms, themost commonly used approach for large-scale mutagenesis andphenotyping involves pooling thousands of individual mutantstrains and parallel analysis of their abundance using either DNAmicroarrays (10, 11) or sequencing (12–14). These approaches areadvantageous because they produce quantitative measures of fit-ness for all nonessential genes in a single-pot assay. In the single-cell eukaryote Saccharomyces cerevisiae, assaying mutant fitnessfor all nonessential genes under hundreds of laboratory condi-tions (primarily growth in the presence of drugs and other small-molecule inhibitors) identified a significant phenotype for nearlyevery protein-coding gene (7). However, for bacteria, it remainsunclear what fraction of the genome has a phenotype under labo-ratory conditions, with estimates ranging from 50% in Escherichiacoli (8) to 70% in Shewanella oneidensis MR-1 (4). In addition, thenumber of genes with a pattern of mutant fitness that is biologi-cally interpretable for predicting gene function and the optimal setof experimental conditions for maximizing new gene annotationshave yet to be established.
To address these issues, we performed 492 genome-wide mu-tant fitness assays in Zymomonas mobilis ZM4, a fermentative,ethanol-producing bacterium (15). We find that 89% of all as-sayed Z. mobilis genes, including many genes without a specific
annotation, have a statistically significant phenotype when dis-rupted in the laboratory. However, many genes have subtle phe-notypes under just a few conditions, and it is not obvious howthese phenotypes relate to each gene’s function. To determinewhether our findings in Z. mobilis are generalizable to other bac-teria, we calculated the fraction of Shewanella oneidensis MR-1genes with a detectable phenotype by using the same experimentalstrategy. S. oneidensis has diverse respiratory abilities, includingmetal reduction, whereas Z. mobilis obtains energy only by fer-mentation, and the genome of S. oneidensis is substantially largerthan the genome of Z. mobilis (4,467 versus 1,892 protein-codinggenes). S. oneidensis also has a wider range of metabolic abilities:we have confirmed the growth of S. oneidensis on 25 carbonsources, compared to just 3 for Z. mobilis (16). By analyzing 296 S.oneidensis fitness experiments, we found that 75% of assayedgenes exhibited a significant phenotype.
Previous studies have noted that genes with related functionsoften have similar fitness patterns (4, 8), and we observed this inour data as well. Thus, to estimate the fraction of genes that have abiologically informative phenotype, we identified genes that havea strong mutant phenotype under at least one condition and also
Received 8 May 2014 Accepted 1 August 2014
Published ahead of print 11 August 2014
Address correspondence to Adam P. Arkin, [email protected], or Jeffrey M. Skerker,[email protected].
Supplemental material for this article may be found at http://dx.doi.org/10.1128/JB.01836-14.
Copyright © 2014, American Society for Microbiology. All Rights Reserved.
doi:10.1128/JB.01836-14
The authors have paid a fee to allow immediate free access to this article.
October 2014 Volume 196 Number 20 Journal of Bacteriology p. 3643–3655 jb.asm.org 3643
on Septem
ber 18, 2014 by guesthttp://jb.asm
.org/D
ownloaded from

have correlated fitness patterns (cofitness) with another gene.With these criteria, we found that 41% of Z. mobilis genes arecandidates for functional annotation using mutant fitness, includ-ing 174 genes currently without a specific annotation. For 57 ofthese poorly annotated genes, we used a combination of compar-ative genomics and homology evidence to demonstrate that thecofitness-derived gene-gene associations are biologically mean-ingful. Last, many of the 492 experiments were conducted undersimilar conditions and thus gave similar results. After removingredundant experiments, only 79 diverse mutant fitness experi-ments remained, and these sufficed to identify the majority ofstrong phenotypes and biological associations. Similarly, wefound that 296 fitness experiments for S. oneidensis could be re-duced to 61 experiments. In sum, this work provides a blueprintfor mutant fitness-based gene annotation in a wide range of bac-teria.
MATERIALS AND METHODSStrains and media. Zymomonas mobilis ZM4 (ATCC 31821) and She-wanella oneidensis MR-1 (ATCC 700550) were purchased from ATCC.For typical culturing, we grew Z. mobilis in rich ZRMG medium (25 g/literglucose, 10 g/liter yeast extract, and 2 g/liter KH2PO4) and S. oneidensis inLuria-Bertani broth (LB). When necessary, we added kanamycin to a finalconcentration of 100 �g/ml for Z. mobilis and 50 �g/ml for S. oneidensis.Unless indicated otherwise, we grew both bacteria aerobically at 30°C. Weused previously described transposon mutant collections for Z. mobilis(17) and S. oneidensis (4). These transposon mutants contain DNA barcodes (tags) that enable the pooling and parallel analysis of mutant fitness(11).
Pooled mutant fitness assays. Pooled mutant fitness assays were per-formed as previously described for both Z. mobilis (17) and S. oneidensis(4). Briefly, for each bacterium, we assayed two pools of transposon mu-tants per experimental condition, before and after growth (usually for sixto eight population doublings). For all experiments, DNA bar code abun-dance was monitored with an Affymetrix microarray (GenFlex_16K_v2)containing the tag sequence complements (18). In this study, the majorityof mutant fitness assays were performed in rich media with an inhibitorybut sublethal concentration of a single chemical. For each inhibitor, weidentified the appropriate concentration(s) for the pooled fitness assay bymeasuring the growth of the wild-type bacterium in a 96-well microplate.These prescreen assays were cultured in a microplate reader (either TecanSunrise or Infinite F200) with absorbance (optical density at 600 nm[OD600]) readings every 15 min. We typically aimed for a concentration ofinhibitor that resulted in a 50% reduction of wild-type growth rate. Inpractice, we often profiled the fitness of the mutants at multiple concen-trations of the same compound. Data sets S1 and S2 in the supplementalmaterial contain detailed information on all Z. mobilis and S. oneidensisfitness experiments. All data are available at http://genomics.lbl.gov/supplemental/phenotypes2013/.
Mutant fitness data analysis. Raw data processing, the calculation ofstrain fitness, the calculation of gene fitness, and data normalization wereperformed as previously described for Z. mobilis and S. oneidensis (4, 17).Briefly, for each experiment, we would like to estimate the functionalconsequence of disrupting each gene, given the data for various strainswith insertions in that gene. As we will show, independent insertions inthe same gene tend to give similar results, so we believe that most of theeffects that we observe reflect the consequence of disrupting the gene. Arelated concern is that insertions in a gene could affect the expression ofdownstream genes via polar effects, but we will show that polar effects donot predominate. Thus, to quantify the functional consequence of dis-rupting each gene, we calculate the “gene fitness,” which is the average ofeach mutant strain for the gene. The fitness of a strain is its change in log2
abundance during the course of an experiment (typically 6 to 8 genera-tions) and is analogous to a log2 ratio in expression experiments (4).
These fitness values are normalized so that a typical gene or strain hasa fitness of zero. We normalized the fitness values to control for effectsfrom chromosomal position, artifacts from mutant pool construction,and scaffold effects (plasmid versus chromosome). Additionally, for themain chromosome of both bacteria, we set the mode of the strain fitnessdistribution to zero. All fitness data for both Z. mobilis and S. oneidensisare publically available in MicrobesOnline (19) and are available as Datasets S3 and S4 in the supplemental material.
Because the strain fitness values for independent transposon inser-tions in the same gene are highly correlated (R � 0.86 for strains withcentral insertions in the 5 to 80% of coding region, average of 30 un-amended rich medium fitness experiments for Z. mobilis), our “gene fit-ness” values reflect the mutant fitness of the individual strains and theimpact of knocking out the gene, which is the focus of this study. Asanother test of the agreement of independent insertions in the same gene,we measured the correlation of fitness for pairs of strains with insertionsin the same gene (strain cofitness) across all 492 experiments in Z. mobilis.We found a strong correlation (median R � 0.61) for insertions in Z.mobilis genes with reduced fitness phenotypes (see Fig. S1 in the supple-mental material).
After the fitness values were normalized, we calculated a test statisticfor each gene in each experiment that takes into account the consistency ofmeasurements within that experiment, as previously described (4). Thetest statistic (t) was calculated as follows:
t � � ⁄ �V ⁄ n
V � {�2 � �(x � �)2} ⁄ n
where x is the measurement(s) for the gene, � is their average, n is thenumber of measurements, V is the variance of strain fitness, and � ismedian[STD(x)], the median across all genes with more than one mea-surement of the standard deviation (STD) of that gene’s measurements(4). This test statistic was transformed to P values using 17 independentstart experiments as a comparison; this was done separately for Z. mobilisand S. oneidensis. The test statistic was transformed independently forgenes with n � 1, 2, 3, or 4 or more. These P values represent the signifi-cance of the gene’s fitness within a single experiment.
To increase our sensitivity for detecting more mild phenotypes, wegrouped the fitness experiments (separately for each bacterium) by overallsimilarity. Specifically, fitness experiments were grouped using hierarchi-cal agglomerative clustering with complete linkage (hclust in R) and with“1 � correlation” as the distance metric. The clustering was cut at a depthof 0.25 (cutree in R), which corresponds to requiring that each pair ofexperiments in a group have a correlation of 0.75 or greater.
After the test statistic was transformed, the P value for a gene in a givenexperiment ranges from 0 to 1, with values close to 0 or 1 indicatingconfidence that the gene’s fitness was negative or positive, respectively. Toincrease the sensitivity for detecting phenotypes, the significance valuesfor each gene within a group were combined using Fisher’s combinedprobability test to give a combined P value (Pcomb). For each gene andeach group of experiments, we used a two-sided test and corrected for thenumber of experiment groups. Specifically, a gene’s phenotype wasconsidered significant if Pcomb � 0.05/(2 � number of groups) orPcomb � 1 – [0.05/(2 � number of groups)]. Because of uncertainty in thenormalization of the fitness data, which implies that the typical strain thathas no phenotype might be assigned a fitness slightly below or above zero,we also required that the average fitness of the gene within a group bebelow �0.2 or above 0.2.
As a second method to assess the significance of phenotypes in Z.mobilis, we used a two-tailed t test that does not depend on the test statisticor its transformation. For this analysis, we used the 54 Z. mobilis experi-mental groups with three or more experiments (see Data set S1 in thesupplemental material). The t test was used to generate a P value for thehypothesis that the average fitness value for a gene within that group isequal to zero. The source code used for all statistical analyses is available athttp://genomics.lbl.gov/supplemental/phenotypes2013/.
Deutschbauer et al.
3644 jb.asm.org Journal of Bacteriology
on Septem
ber 18, 2014 by guesthttp://jb.asm
.org/D
ownloaded from

Z. mobilis gene expression. We measured gene expression using high-density tiling Nimblegen microarrays for Z. mobilis grown in rich ZRMGand defined ZMMG media (17). We harvested total RNA during expo-nential growth using the RNeasy kit (Qiagen). For the tiling arrays, en-richment for mRNA, cDNA synthesis, labeling, and hybridization wereperformed as previously described (20). The tiling array data were nor-malized so that the median probe has a log level of zero (20). As most ofthe genome is expressed on one strand or the other, zero will correspondto the high end of background expression.
Comparative genomics. Orthologs between Z. mobilis ZM4 and Cau-lobacter crescentus NA1000 were determined using MicrobesOnline treeorthologs (19). Likewise, the analyses of conserved synteny and of Inter-Pro hits, including hits to Pfam domains that are annotated as domains ofunknown function (http://pfam.janelia.org/), are taken from Microbe-sOnline.
Microarray data accession number. The Z. mobilis tiling microarraydata are publically available (GEO accession no. GSE51870).
RESULTSEighty-nine percent of assayed Zymomonas mobilis genes have aphenotype. To determine the fraction of bacterial genes with anidentifiable phenotype, we used the alphaproteobacterium Zy-momonas mobilis ZM4, which has the advantages of a small ge-nome size (1,892 protein-coding genes) (21) and the availability ofa DNA bar-coded transposon mutant collection for the quantita-tive and parallel analysis of mutant fitness (17). Using two previ-ously described mutant pools of Z. mobilis covering 1,586 genes(83% of protein-coding genes) and genome-wide fitness data in202 growth experiments as the starting point (17, 22), we per-formed an additional 290 pooled fitness assays, including growthduring inhibition with various antibiotics, metals, and salts, andgrowth with alternative carbon and nitrogen sources, anaerobicgrowth, and survival after UV irradiation (for a full list and anno-tation of the 492 Z. mobilis experiments, see Data set S1 in thesupplemental material). The 290 additional Z. mobilis fitness ex-periments were chosen to be diverse, including stresses with dif-ferent modes of action, to maximize the likelihood of identifyingphenotypes for all genes. The entire Z. mobilis fitness data set isclustered and summarized as a heat map in Fig. 1A. Gene fitness isdefined as the log2 change in the abundance of strains with inser-tions in the gene: negative values indicate that the gene is benefi-cial for fitness and that strains with the mutated gene have reducedfitness, while positive fitness values indicate that mutating thegene leads to improved fitness relative to the typical strain in thepools and that the gene’s activity is detrimental to fitness.
As a representative illustration of the Z. mobilis mutant fitnessdata, a genome-wide comparison of “gene fitness” for two condi-tions, rich medium supplemented with the DNA-damaging agentcisplatin and rich medium with no supplements, is highlighted inFig. 1B. The nucleotide excision repair complex genes uvrABCD(23) and the RecA-mediated double-strand break repair genesrecFGORX (24) are beneficial for optimal fitness in the presence ofthe inhibitor but not in rich medium without cisplatin. In E. coli,strains with mutations in genes in both the double-strand breakrecombination and nucleotide excision repair pathways are alsohypersensitive to cisplatin (25). Z. mobilis recA mutants have re-duced fitness in both the presence and absence of cisplatin (Fig.1B), which likely reflects the multiple biochemical roles of RecAprotein in recombination, DNA repair, and regulation (26).
An examination of the Fig. 1A heat map reveals a large block of481 genes with strongly reduced fitness in nearly all experiments
(blue at the top of the heat map in Fig. 1A). The median gene inthis block has a strongly reduced-fitness phenotype (fitness lessthan �1) in 350 experiments (out of a possible 492). This blockincludes many ribosomal proteins and other genes that are ex-pected to be essential. Z. mobilis appears to be polyploid, andinsertions are as likely to occur in essential genes as in other genes(17). The mutants with insertions in essential genes do not havesegmental duplications; rather, they are unstable heterozygotes(17), which explains why these strains drop in abundance duringthe fitness experiment. The high rate of insertions in essentialgenes also implies that the 306 Z. mobilis genes without data arenot significantly enriched for essential genes but rather reflect alargely random group of genes that by chance we did not maptransposon mutants in (17). Many of these predicted essentialgenes are beneficial for fitness in nearly all experiments: 196 of the481 frequently beneficial genes in the blue block at the top of Fig.1A are predicted essential genes (based on orthology to essentialCaulobacter genes [27]; for a full list of the genes in this cluster andwhether they are predicted to be essential, see Data set S5 in thesupplemental material). More broadly, genes with strong reducedfitness phenotypes in many conditions are clearly important fororganismal fitness, and detecting phenotypes for these genes isstraightforward. However, previous work has established thatmost bacterial genes do not have such obvious phenotypes (4, 8).Rather, we expect many phenotypes to be subtle and manifested inonly a subset of our 492 experiments.
To increase sensitivity for detecting mild phenotypes, we clus-tered 95% (465 of 492) of the fitness experiments into 79 groups(Fig. 1A). These groups represent experiments with highly corre-lated genome-wide fitness (pairwise correlations greater than 0.75for all members of the group) and are listed in Data set S1 in thesupplemental material. The two largest experimental groups, with40 and 29 experiments respectively, are rich medium with nostress and rich medium with little stress (i.e., low concentration ofadded inhibitor). The next biggest group (23 experiments) in-cludes a variety of alcohols and aldehydes and growth at 40°C.Overall, the groups frequently contain structurally related com-pounds, compounds with similar modes of action, or the samecompound at different concentrations. For example, group 31includes two doxycycline and three minocycline experiments(doxycycline and minocycline are structurally similar tetracyclineantibiotics), group 25 includes six aminoglycoside antibiotic ex-periments (tobramycin, sisomicin, or gentamicin), and group 73contains two bacitracin experiments at different concentrations.Our finding that compounds with similar structures or modes ofactions have correlated genome-wide fitness patterns is consistentwith previous findings in both bacteria (8, 17) and yeast (28).
To systematically determine the fraction of the Z. mobilis ge-nome with a statistically significant phenotype, we used a test sta-tistic for each gene under each condition that takes into accountthe consistency of measurements for that gene as well as for othergenes in that experiment (4). We converted this test statistic to Pvalues by using control experiments, we combined these P valuesacross similar experiments, and we corrected for multiple testingacross 79 groups (see Materials and Methods for details). At acutoff of P � 0.05, we found that 1,090 (69%) genes are beneficialto fitness and 855 (54%) are detrimental to fitness in at least one ofthe 79 groups of experiments. Overall, 1,409 genes, or 89% of thegenes we have data for, have either a significant reduced fitness orenhanced-fitness phenotype based on this analysis. The false dis-
Biologically Informative Mutant Fitness Patterns
October 2014 Volume 196 Number 20 jb.asm.org 3645
on Septem
ber 18, 2014 by guesthttp://jb.asm
.org/D
ownloaded from

covery rate for Z. mobilis genes with phenotypes using this analysisis 5.6% or less than 80 genes.
To illustrate how the grouping of experiments in the aboveanalysis provides increased statistical power for detecting pheno-types, we highlight a specific example. Mutations in the dehydro-genase ZMO0226 have reduced fitness in three experiments withdifferent concentrations of the uncoupling agent carbonyl cya-nide-p-trifluoromethoxyphenylhydrazone (FCCP), with fitnessvalues of �1.4 to �2.1 (average measurement for five differentstrains with transposon insertions in ZMO0226). The lowest Pvalue from any single experiment was 0.0071, but after correctingfor multiple testing across 492 experiments, this is not meaningful(corrected P � 1). The combined P value from the three FCCPexperiments (which clustered into a single group) was 0.00022, or0.018 after correcting for multiple testing across 79 groups.
To control for potential bias in the above analysis, we per-formed a two-tailed t test on the normalized fitness values that is
independent of the test statistic and P value transformation de-scribed above (see Materials and Methods). With a correction formultiple testing and a P value cutoff of less than 0.05, 75% of thegenes have a reduced-fitness phenotype and 43% have an en-hanced fitness phenotype. Based on this t test analysis, 1,492 genes,or 94% of Z. mobilis genes we have data for, have a significantphenotype (reduced or enhanced) with a false discovery rate of5.3%. Therefore, regardless of the statistical test, the vast majorityof Z. mobilis genes assayed (89% or 94%) have a detectable phe-notype in our large mutant fitness compendium.
Multiple lines of evidence suggest that the statistically signifi-cant but subtle phenotypes identified by our analyses are bona fidephenotypes and not artifacts of our experimental strategy or anal-ysis. First, genes with significant phenotypes tend to have highercorrelations in fitness (cofitness) with genes in the same operonacross all experiments, as expected given that genes in the sameoperon often have related functions (Fig. 1C). Even genes with the
FIG 1 Identifying a phenotype for most Z. mobilis genes. (A) Heat map of clustered mutant fitness data for 1,586 genes (y axis) across 492 experiments (x axis).Reduced fitness values are shown in blue, and enhanced fitness values are shown in yellow (see color key). The experiments are binned into 79 groups (alternatingcolors on the x axis) to increase statistical power for detecting subtle phenotypes (see Materials and Methods). Genes are color-coded to the right of the heat mapaccording to whether they are beneficial for fitness in any group of experiments (red), detrimental to fitness in a group of experiments and never beneficial(green), or have no statistically significant phenotype in any group of experiments (no color). (B) Scatterplot of gene fitness values in rich medium (ZRMGmedium; x axis) versus rich medium supplemented with an inhibitory concentration of cisplatin (y axis). Negative values are indicative of reduced fitness relativeto the typical strain in the mutant pools. Genes encoding members of the UvrABCD nucleotide excision repair system, RecA, and RecFGORX are highlighted. Thesolid black line shows x � y. (C) Correlation of fitness (cofitness on the y axis) for 573 pairs of adjacent genes that are predicted to be cotranscribed in an operon.The pairs are ranked by the most significant phenotype of the weaker gene in any of the 79 groups of experiments (from weakest to strongest phenotype; x axis).Cofitness values are colored according to whether both genes in the pair have a significant phenotype (red), only one gene in the pair has a significant phenotype(black), or neither gene has a significant phenotype (green). The gray hatched region covers 99% of the cofitness distribution from shuffled data (�0.117 to0.115). The dashed blue line represents the best-fit smooth line through the data (local regression from loess). (D) Comparison of gene fitness in rich medium(ZRMG medium; y axis) and expression level in the same condition (x axis). Expression was determined using a high-resolution tiling microarray and is plottedas the log2 level relative to background (bg.) (see Materials and Methods). Genes with significantly reduced (red) or enhanced (green) phenotypes after 1 day (6population doublings) of growth in ZRMG medium (P � 0.001 by Fisher test with 30 replicates) are indicated. (E) Comparison of gene fitness for 1,586 genesafter 3 days (18 population doublings) (x axis) or 7 days (42 population doublings) (y axis) of batch transfer growth in rich medium (cells were diluted backin fresh medium each day). The solid black line shows x � y. The vertical gray lines represent fitness of �0.2 and 0.2. Genes with a significant phenotype after 3days of growth in rich medium (P � 0.05, based on the transformed test statistic for this single experiment) are shown in orange.
Deutschbauer et al.
3646 jb.asm.org Journal of Bacteriology
on Septem
ber 18, 2014 by guesthttp://jb.asm
.org/D
ownloaded from

weakest significant phenotypes tend to have higher cofitnesswithin operons than expected compared to shuffled data (Fig.1C). Because operon gene pairs can also have unrelated functions(29–31), there are multiple instances where one or both adjacentgenes have significant phenotypes but have near zero or negativecofitness (Fig. 1C). Operon cofitness could also be due to polarityeffects in our data set. Polarity occurs when a transposon insertionin an upstream gene of the operon leads to transcriptional termi-nation and reduced expression of a downstream gene(s). Polaritycan be detected genome-wide by a significantly higher fraction ofinstances where only an upstream gene has a phenotype relative toinstances where only the downstream gene has a phenotype (4).Applying this test to our fitness data set, we find a moderate in-crease of upstream-only reduced fitness relative to downstream-only reduced fitness (5,709 versus 4,345 in individual fitness ex-periments; P � 10�15 by a binomial test). Therefore, whilepolarity influences our data set, it is not an overwhelming effectand does not substantially change our estimate of the number ofgenes in Z. mobilis with a phenotype.
A second line of evidence in support of our estimate of geneswith phenotypes is that, for a single condition, even those geneswith subtle phenotypes tend to be well expressed (Fig. 1D). Thefact that many genes with mild phenotypes are well expressedsupports the results of our global analysis, as expression should bea prerequisite for a gene to exert a phenotypic effect.
Last, we validated the genes with weak but significant pheno-types by performing a long-term growth experiment in rich me-dium with batch transfer of the mutant libraries once per day. Ifweak phenotypes are real, then the fitness defects of strains withmutations in these genes should become more pronounced atlater transfers. For weakly beneficial genes, there is a clear bias forreduced fitness phenotypes to become more severe after 7 days ofgrowth relative to 3 days of growth (Fig. 1E). Taken together, theresults of our analysis and experimental validation strongly sup-port our estimate that 89% of the Z. mobilis genome has a detect-able phenotype under laboratory conditions.
To determine whether a similar fraction of genes have a detect-able phenotype in a second bacterium, we supplemented our pre-viously reported 219 genome-wide Shewanella oneidensis fitnessexperiments (4, 22, 32) by performing an additional 77 experi-ments. Combined, the data from the 296 S. oneidensis fitness ex-periments represent a diverse range of metabolic and stress con-ditions that are comparable in size and diversity to the Z. mobilisdata set. A subset of the fitness experiments is very similar (pri-marily the same stresses in rich medium) in both bacteria, whilemost experiments are unique to either Z. mobilis or S. oneidensis.Using the same test statistic, combined P value analysis, andthresholds for significance as applied to the Z. mobilis data set, wegrouped 243 of the S. oneidensis fitness experiments into 61 groupsby hierarchical clustering and identified 1,805 beneficial genes(out of 3,355 total genes with data, or 54%) with reduced fitnessphenotypes and 1,895 (56%) detrimental genes with enhancedfitness phenotypes in at least one group of experiments. For thecomplete list of S. oneidensis mutant fitness experiments, mediumcompositions, and groups of experiments, see Data set S2 in thesupplemental material. In total, 2,507 or 75% of the S. oneidensisgenes that we have data for have a significant phenotype. Thefraction of genes with a phenotype in S. oneidensis is only moder-ately less than that of Z. mobilis and may be explained by the largersize of the Z. mobilis fitness data set or the larger size of the S.
oneidensis genome. Thus, our finding that the vast majority ofgenes in bacterial genomes have a detectable phenotype underlaboratory conditions is likely generalizable.
Characteristics of Z. mobilis phenotypes. To uncover broadertrends in the identified Z. mobilis phenotypes, we characterizedthe phenotypes based on their strength, directionality, occurrencein multiple conditions (pleiotropy), and the functional category ofthe genes. Overall, reduced-fitness phenotypes are much strongerthan enhanced-fitness phenotypes, which fits the expectation thatmost mutations are detrimental to fitness (Fig. 2A). For example,880 genes have significantly reduced fitness under �1 (in one ormore of the 79 groups of experiments), but just 345 genes havesignificantly enhanced fitness above 1. Indeed, many of the sig-nificant enhanced-fitness phenotypes are weak: 201 of the 855detrimental genes have a maximum fitness across groups of exper-iments less than 0.4. While not as pronounced, some of the re-duced-fitness phenotypes are also weak; 77 of the 1,090 beneficialgenes have a minimal fitness greater than �0.4. Assuming a largeeffective population size, a significant number of bacterial geneswith weak reduced-fitness phenotypes should be expected (33). Inthis view, selection will maintain genes with very small beneficialeffects that are difficult to measure in the laboratory. Alternatively,genes with no or only subtle phenotypes in our laboratory-basedfitness compendium may play a crucial role under natural condi-tions, such as mediating interactions with other microorganisms.In this view, performing fitness assays under more-ecological con-ditions would uncover strong phenotypes for those genes with noor weak phenotypes in our laboratory data set.
Surprisingly, we found that 54% (855 of 1,586) of the Z. mobilisgenes had a significant enhanced-fitness phenotype, and for 319 ofthese 855 genes, we identified an increase in fitness only for inser-tions in these genes. For a list of these 319 genes with only en-hanced-fitness phenotypes, see Data set S6 in the supplementalmaterial. Although these findings are consistent with recent re-ports that selection for increased laboratory fitness can drive geneloss in bacteria (34, 35), the extent and scale to which loss-of-function mutations lead to increased fitness in bacteria are onlystarting to be appreciated at the genome-wide level (36). In a studyof E. coli mutant fitness data, Hottes and colleagues found thatbeneficial mutations were identified in nearly all conditions andthat these mutations were enriched in genes encoding enzymesand regulatory proteins, suggesting that metabolic and regulatoryrewiring via loss of function is a prevalent mechanism for fitnessincreases in the absence of new genes (36). However, in contrast tothe recent E. coli results, Z. mobilis regulators, which are defined astranscription factors in the DNA-binding domain (DBD) data-base (37), are not significantly enriched among the detrimentalgene set (odds ratio, 1.17; P � 0.5 by Fisher exact test). Further-more, we find that Z. mobilis enzymes (defined as genes with an EC[Enzyme Commission] number assigned) are significantly lesslikely to be detrimental to fitness in the laboratory (odds ratio,0.69; P � 0.0005). Rather, genes associated with amino acid trans-port and metabolism (COG [clusters of orthologous groups ofproteins] function code E; false discovery rate � 0.04, after cor-recting for testing 20 functional categories) are significantly morelikely to be detrimental to fitness in Z. mobilis. In S. oneidensis,genes with enhanced fitness phenotypes are significantly enrichedfor motility genes (COG function code N [cell motility]; false dis-covery rate of 3 � 10�5) but not for regulators or enzymes (P �0.05). Overall, among E. coli, S. oneidensis, and Z. mobilis, there
Biologically Informative Mutant Fitness Patterns
October 2014 Volume 196 Number 20 jb.asm.org 3647
on Septem
ber 18, 2014 by guesthttp://jb.asm
.org/D
ownloaded from
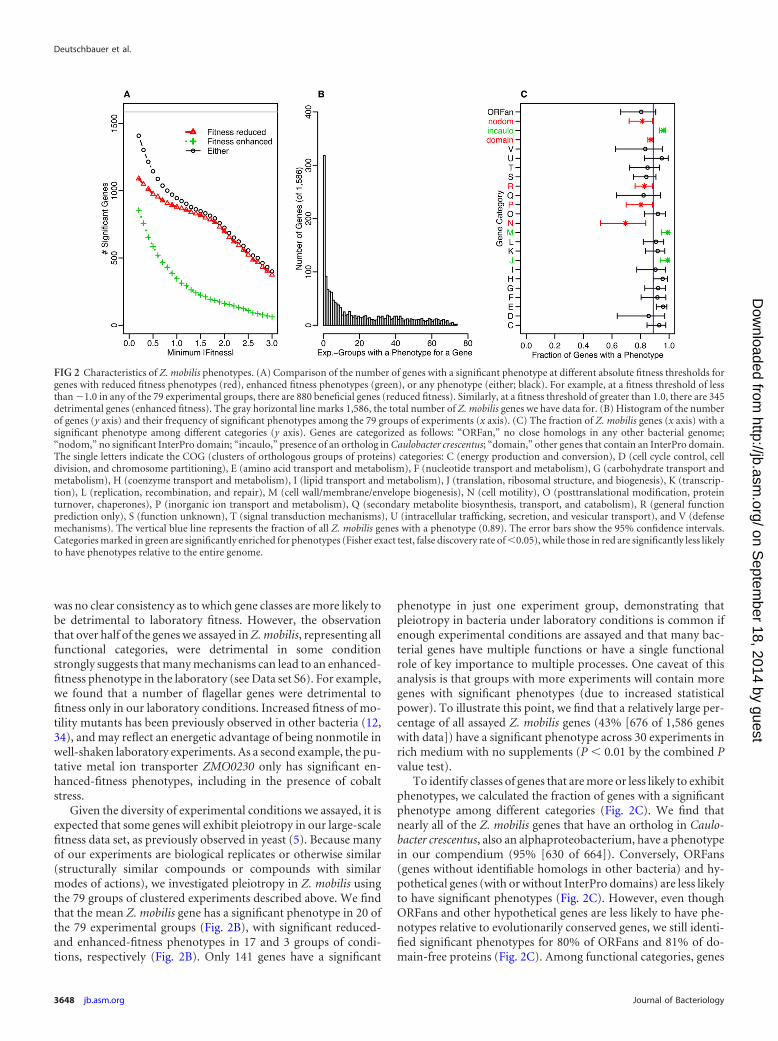
was no clear consistency as to which gene classes are more likely tobe detrimental to laboratory fitness. However, the observationthat over half of the genes we assayed in Z. mobilis, representing allfunctional categories, were detrimental in some conditionstrongly suggests that many mechanisms can lead to an enhanced-fitness phenotype in the laboratory (see Data set S6). For example,we found that a number of flagellar genes were detrimental tofitness only in our laboratory conditions. Increased fitness of mo-tility mutants has been previously observed in other bacteria (12,34), and may reflect an energetic advantage of being nonmotile inwell-shaken laboratory experiments. As a second example, the pu-tative metal ion transporter ZMO0230 only has significant en-hanced-fitness phenotypes, including in the presence of cobaltstress.
Given the diversity of experimental conditions we assayed, it isexpected that some genes will exhibit pleiotropy in our large-scalefitness data set, as previously observed in yeast (5). Because manyof our experiments are biological replicates or otherwise similar(structurally similar compounds or compounds with similarmodes of actions), we investigated pleiotropy in Z. mobilis usingthe 79 groups of clustered experiments described above. We findthat the mean Z. mobilis gene has a significant phenotype in 20 ofthe 79 experimental groups (Fig. 2B), with significant reduced-and enhanced-fitness phenotypes in 17 and 3 groups of condi-tions, respectively (Fig. 2B). Only 141 genes have a significant
phenotype in just one experiment group, demonstrating thatpleiotropy in bacteria under laboratory conditions is common ifenough experimental conditions are assayed and that many bac-terial genes have multiple functions or have a single functionalrole of key importance to multiple processes. One caveat of thisanalysis is that groups with more experiments will contain moregenes with significant phenotypes (due to increased statisticalpower). To illustrate this point, we find that a relatively large per-centage of all assayed Z. mobilis genes (43% [676 of 1,586 geneswith data]) have a significant phenotype across 30 experiments inrich medium with no supplements (P � 0.01 by the combined Pvalue test).
To identify classes of genes that are more or less likely to exhibitphenotypes, we calculated the fraction of genes with a significantphenotype among different categories (Fig. 2C). We find thatnearly all of the Z. mobilis genes that have an ortholog in Caulo-bacter crescentus, also an alphaproteobacterium, have a phenotypein our compendium (95% [630 of 664]). Conversely, ORFans(genes without identifiable homologs in other bacteria) and hy-pothetical genes (with or without InterPro domains) are less likelyto have significant phenotypes (Fig. 2C). However, even thoughORFans and other hypothetical genes are less likely to have phe-notypes relative to evolutionarily conserved genes, we still identi-fied significant phenotypes for 80% of ORFans and 81% of do-main-free proteins (Fig. 2C). Among functional categories, genes
FIG 2 Characteristics of Z. mobilis phenotypes. (A) Comparison of the number of genes with a significant phenotype at different absolute fitness thresholds forgenes with reduced fitness phenotypes (red), enhanced fitness phenotypes (green), or any phenotype (either; black). For example, at a fitness threshold of lessthan �1.0 in any of the 79 experimental groups, there are 880 beneficial genes (reduced fitness). Similarly, at a fitness threshold of greater than 1.0, there are 345detrimental genes (enhanced fitness). The gray horizontal line marks 1,586, the total number of Z. mobilis genes we have data for. (B) Histogram of the numberof genes (y axis) and their frequency of significant phenotypes among the 79 groups of experiments (x axis). (C) The fraction of Z. mobilis genes (x axis) with asignificant phenotype among different categories (y axis). Genes are categorized as follows: “ORFan,” no close homologs in any other bacterial genome;“nodom,” no significant InterPro domain; “incaulo,” presence of an ortholog in Caulobacter crescentus; “domain,” other genes that contain an InterPro domain.The single letters indicate the COG (clusters of orthologous groups of proteins) categories: C (energy production and conversion), D (cell cycle control, celldivision, and chromosome partitioning), E (amino acid transport and metabolism), F (nucleotide transport and metabolism), G (carbohydrate transport andmetabolism), H (coenzyme transport and metabolism), I (lipid transport and metabolism), J (translation, ribosomal structure, and biogenesis), K (transcrip-tion), L (replication, recombination, and repair), M (cell wall/membrane/envelope biogenesis), N (cell motility), O (posttranslational modification, proteinturnover, chaperones), P (inorganic ion transport and metabolism), Q (secondary metabolite biosynthesis, transport, and catabolism), R (general functionprediction only), S (function unknown), T (signal transduction mechanisms), U (intracellular trafficking, secretion, and vesicular transport), and V (defensemechanisms). The vertical blue line represents the fraction of all Z. mobilis genes with a phenotype (0.89). The error bars show the 95% confidence intervals.Categories marked in green are significantly enriched for phenotypes (Fisher exact test, false discovery rate of �0.05), while those in red are significantly less likelyto have phenotypes relative to the entire genome.
Deutschbauer et al.
3648 jb.asm.org Journal of Bacteriology
on Septem
ber 18, 2014 by guesthttp://jb.asm
.org/D
ownloaded from

associated with amino acid metabolism, translation, and the cellwall are significantly more likely to have a phenotype. Conversely,genes associated with inorganic ion transport/metabolism andmotility, and genes with only a general function prediction aresomewhat less likely to have a phenotype (Fig. 2C). The relativelack of phenotypes for motility-related genes might be attributableto the loss (or reduction) of this activity in the parental Z. mobilisZM4 strain used in this study. Despite a myriad of motility exper-iments with the Z. mobilis ZM4 mutant pools, we identified clearphenotypes for only a fraction of the expected motility genes, andthese phenotypes were typically less severe than those identifiedfor motility genes in S. oneidensis MR-1 using similar assays (4). Inaddition to reduced motility of the parental strain [potentially dueto an unknown mutation(s)], it is also possible that we did notidentify the ideal conditions to induce motility in Z. mobilis.
To more systematically explore the properties of genes withouta phenotype, we manually examined the 157 chromosomal, pro-tein-coding Z. mobilis genes with no significant phenotypes (for alist of these genes, see Data set S7 in the supplemental material).Forty-seven of these genes are adjacent to another gene without aphenotype, a fraction significantly greater than expected bychance (P � 1.7 � 10�6 by Fisher exact test). Of these 47 genes, 19are involved in either secretion (ZMO0799 to ZMO0801,ZMO1482, and ZMO1483), antibiotic synthesis (ZMO1779 andZMO1780), or phage defense (ZMO0680, ZMO0681, andZMO0683 to ZMO0685) or encode components of prophage(ZMO0387 to ZMO0390 and ZMO0397 to ZMO0399). Given thatwe did not challenge the Z. mobilis mutant libraries with viralinfection or microbial competitors, it is not surprising that we didnot identify significant phenotypes for these genes.
We considered several other reasons why these 157 genes maylack a phenotype in our data set. One possibility is that we do nothave insertions in the central part of each gene and hence are notinactivating its function, or we have only a single transposon mu-tant and hence have insufficient data. Only 13 of the genes with nophenotype lack insertions in the central part of the gene, and an-other 13 have a single transposon mutant in our pools, so theseexplanations cannot explain the majority of the cases. Of these 157genes with no phenotype, only 9 are ORFans, so incorrect genecalls contribute minimally. A related possibility is that the geneswithout phenotypes are recent pseudogenes and not functional.To address this issue, we analyzed tiling microarray gene expres-sion data for Z. mobilis and compared the expression of genes withand without phenotypes under the expectation that pseudogenesare less likely to be expressed on the correct strand (defined astwofold-greater expression on the sense strand relative to the an-tisense strand). We find that chromosomal genes without pheno-types are only slightly less likely to be significantly expressed on thecorrect strand in either rich or minimal medium (86% [135 of157]) than protein-coding genes on the chromosome with a phe-notype (95% [1,292 of 1,362]). An additional explanation is ge-netic or functional redundancy at the gene or pathway level,whereby a single gene mutation would be expected to have nofitness consequence. One outcome of this hypothesis is that thepercentage of duplicated genes (paralogs) among these 157 geneswithout phenotypes should be larger than for the genes with sig-nificant phenotypes. While the number of paralogs (21 of 157) isenriched among the no-phenotype class (P � 0.0053 by Fisherexact test), it accounts for few of the genes without phenotypes.Therefore, it is unlikely that the absence of phenotypes for these
157 protein-coding genes is solely due to insufficient data, pseu-dogenes, lack of expression, or functional redundancy. Alterna-tively, we did not profile conditions that would lead to a detectablephenotype for these genes. Last, the phenotypes for these genesmay not be detectable by our competitive growth assay, whichwere typically run for 6 generations. For example, a gene fitnessvalue of �0.1 (which would not match our significance criteria),corresponds to a selection coefficient (s) of 0.01 � 0.1 � ln(2)/6.Given the effective population size of bacteria, an s of 0.01 maycorrespond to very strong selection in the wild.
Forty-one percent of Z. mobilis genes have biologically infor-mative patterns of fitness. Previous work has established the util-ity of genome-wide mutant fitness data to annotate the functionsof poorly characterized genes in bacteria and yeast using gene-gene associations (4–6, 8). For example, using a large S. oneidensisfitness data set, we previously proposed specific functional anno-tations for 40 genes or operons with poor or incomplete annota-tions (4). Here, we estimate the fraction of all bacterial genes thatare amenable to informative gene-gene associations using high-throughput genetics. To determine the number of genes with bi-ologically meaningful gene-gene associations using mutant fit-ness, it is important to differentiate between whether a gene has asignificant phenotype at all (as discussed above) and whether agene’s pattern of phenotypes is sufficiently strong to be biologi-cally informative to predict function (4). To address the latter, weexamined two factors that influence gene function prediction, sig-nificant fitness correlations between gene pairs across all experi-ments (cofitness) and the detection of a strong phenotype in atleast one condition. Using stringent criteria for both parameters,cofitness with another gene greater than 0.75 and a strong pheno-type (�fitness� � 1) in at least one experimental group, we find that41% (651 of 1,586) of Z. mobilis genes are attractive targets forassociative annotation using large-scale mutant fitness profiling(Fig. 3A). In contrast, 21% (691 of 3,355) of Shewanella oneidensisMR-1 genes meet the same two criteria across the 296 fitness ex-periments. The smaller percentage of S. oneidensis genes with highcofitness and a strong phenotype relative to Z. mobilis may reflectthe larger genome size of S. oneidensis MR-1, the fact that weperformed fewer experiments with this bacterium, that the S. one-idensis experiments were done under less-informative conditions,or the fact that we were able to interrogate essential genes in Z.mobilis. Of the 651 Z. mobilis genes with strong cofitness to an-other gene and a strong phenotype, 187 are predicted to be essen-tial. Subtracting these essential genes, 464 Z. mobilis genes (35% ofthe nonessential genes that we have data for) are attractive candi-dates for functional annotation, which is still greater than the 21%we observed for S. oneidensis.
To systematically verify the biological significance of our se-lected cofitness threshold, we examined the capacity of cofitness togroup genes into functional categories (as defined by The Institutefor Genomic Research [TIGR] [now the J. Craig Venter Institute{JCVI}] subroles [38]). TIGR/JCVI subroles provide a reasonablelevel of functional specificity, for example the main role “aminoacid biosynthesis” is further divided into seven subroles for thearomatic amino acid family, aspartate family, glutamate family,pyruvate family, serine family, histidine family, and other aminoacid biosynthesis (38). For this analysis, we focused on cofitnessand not strong phenotypes, as the vast majority of genes with highcofitness with another gene also have a strong phenotype (�fitness�� 1) in at least one group of experiments (Fig. 3A). Looking only
Biologically Informative Mutant Fitness Patterns
October 2014 Volume 196 Number 20 jb.asm.org 3649
on Septem
ber 18, 2014 by guesthttp://jb.asm
.org/D
ownloaded from

at pairs of Z. mobilis genes not nearby in the genome (to avoidoperon bias), we find that genes with the same TIGR/JCVI subroleare more likely to have significant cofitness (above 0.75) versusother gene pairs (Fig. 3B, 11% versus 2%, P � 10�15 by Fisherexact test). This suggests that cofitness above 0.75 is a strong indi-cator of functional relatedness and that high cofitness may be auseful tool for inferring the function of poorly characterizedgenes, particularly if one or more genes with high cofitness have aninformative annotation (4–6). When we look at all 1,586 Z. mobilisgenes for which we have fitness data, we find that 39% (623 genes)have high cofitness (over 0.75) with another, nonnearby gene (Fig.3B). These results suggest that a substantial number of bacterialgenes are amenable to a cofitness-based function prediction. It isimportant to note that these cofitness-based gene annotations arebroad (i.e., a pair of genes have shared phenotypes under a set ofconditions) but nevertheless are an advance over the existing,purely computational annotations for these genes (see below fordetails). Furthermore, these broad annotations can lead to specifichypotheses and proposals for the biochemical and physiologicalroles of genes, as described below.
Annotation of poorly characterized Z. mobilis genes usingcofitness. A key challenge in microbiology is the functional anno-tation of poorly annotated and hypothetical genes. To objectivelyidentify poorly annotated genes, we made a list of Z. mobilis pro-teins that have no gene name and whose description matches “hy-pothetical,” “family,” “domain protein,” “fold protein,” or “re-lated protein.” This analysis identified 652 proteins withoutspecific annotations, and we have fitness data for 502 (77%) of
these 652 proteins. Of these 502 poorly annotated Z. mobilis genes,35% (174 of 502) have high cofitness with another gene (cofitness� 0.75). Among these poorly annotated genes with strong cofit-ness to another gene, 79% (137 of 174) have cofitness above 0.75with a well-annotated gene, demonstrating that mutant fitness-enabled gene-gene associations can be obtained for a significantnumber of genes with the poorest computational annotations. Fora complete list of these 174 genes and the genes that they have highcofitness with, see Data set S8 in the supplemental material.
While determining the precise molecular function and bio-chemical activity of these poorly annotated proteins requires ad-ditional experimentation, gene-gene associations from cofitnesscan be used to generate more-specific annotations, including cor-recting misannotated genes, identifying additional evidence tosupport the broad cofitness-based annotation, and proposing spe-cific physiological roles. To illustrate these points, we manuallyexamined the gene-gene associations in Data set S8 in the supple-mental material and found additional evidence, based on con-served proximity or functionally related domains, to support thefunctional relatedness for 57 of the poorly annotated genes andtheir genes with high cofitness (for details, see Text S1 in the sup-plemental material).
Of the 57 newly annotated genes, we proposed specific molec-ular functions for 33 of them (Table 1). Two of the specific anno-tations are for genes that were, in hindsight, annotated errone-ously (ZMO1997 and ZMO1510). More often, we obtained aspecific prediction by comparing the gene’s phenotypes with thedomain content of the gene or of surrounding genes. For instance,
FIG 3 Utility of mutant fitness for annotating gene function in bacteria. (A) For each Z. mobilis gene, a scatterplot of the strongest absolute phenotype (x axis,either fitness reduced or enhanced) versus the strongest cofitness to another gene (y axis). Genes shown in red are putatively essential, and those shown in greenare poorly annotated and do not have a specific annotation (no function) (see main text). The horizontal gray line marks cofitness of 0.75, and the vertical grayline marks absolute fitness of 1.0. (B) Distribution of fitness correlations (cofitness) for different classes of Z. mobilis gene pairs across all 492 experiments. Allpairs of genes that we have data for (All Pairs), gene pairs that have the same TIGR/JCVI subrole (38) and are not within 20 kbp of each other on the chromosome(Same Subrole, Not Nearby), and genes with maximum cofitness for each gene excluding nearby hits within 20 kbp (Top Hits, Not Nearby) are shown. Thedistributions were estimated from the discrete data using kernel density. The vertical gray line marks cofitness of 0.75. (C) Increase in the fraction of genes witha strong reduced-fitness phenotype (fitness less than �2 [y axis]) in any experiment as a function of the number of mutant fitness experiments performed (x axis),plotted for all Z. mobilis genes for which we have data (n � 1,586), poorly annotated Z. mobilis genes (n � 502 [see text for criteria]), or all S. oneidensis MR-1genes with fitness data (n � 3,355). Experiments are in random order. The red control (dashed) line is derived from the number of fitness values less than �2among 17 control experiments (independent samples of start) for S. oneidensis MR-1. To calculate the number of Z. mobilis ZM4 genes expected to have fitnessless than �2 by chance, we used the observed standard deviation in 17 control experiments (independent samples of start; this standard deviation was 0.40) andthe theoretical probability of a normal distribution with this standard deviation and a mean of 0 giving a value below �2 (2.8 � 10�7 per gene per experiment).
Deutschbauer et al.
3650 jb.asm.org Journal of Bacteriology
on Septem
ber 18, 2014 by guesthttp://jb.asm
.org/D
ownloaded from

eight of the newly annotated genes are putative transcriptionalregulators that have cofitness with specific genes, so we proposethat they activate the expression of those genes. As a specific ex-ample, ZMO1733 belongs to the LysR family of regulators and hascofitness with several genes that are important for resisting oxida-tive stresses, including an adjacent alkyl hydroperoxide reductase(ZMO1732), which suggests that ZMO1733 is involved in re-sponding to oxidative stresses. Indeed, the ortholog of ZMO1733
in Caulobacter crescentus was recently shown to be the redox-sen-sitive regulator OxyR (39). Furthermore, three of these transcrip-tion factors contain response regulator domains, and all three ofthese have high cofitness with nearby histidine kinases, which pre-sumably regulate the activity of these transcription factors.
Another 18 of the genes are components of putative ABC trans-porters or efflux pumps. For example, ZMO0981 lies within aputative ABC transporter operon (ZMO02008-ZMO0982-
TABLE 1 Summary of new Z. mobilis gene annotations
Category and gene(s) Brief annotation(s)a
Transcriptional regulatorsZMO0100 Activates ZMO0101ZMO0116 Regulates response to oxidative stressZMO0478 TF/RR with HK ZMO0480; affects the cell wallZMO1206 Regulates secretion-related protein ZliE (ZMO0934)ZMO1322 TF/RR with HK ZMO1323 involved in acid stress resistanceZMO1336 TF; activates ZMO1337ZMO1733 OxyR (as in Caulobacter; see reference 39)ZMO1738 TF/RR with HK ZMO1739; regulates essential processes
Transporters and pumpsZMO0285 Efflux pump component; substrate unclearZMO0780, ZMO0779 Efflux pump with ZMO0778; substrate unclearZMO0910 Component of polysaccharide export ABC transporter (with ZMO0911 and ZMO1467)ZMO0964 Efflux pump componentZMO0981 Component of ABC transporter, likely involved in the export of cell wall componentsZMO1018, ZMO1017, ZMO1016, ZMO1015 ABC transporter exporting component of cell envelopeZMO1431, ZMO1430 Efflux pump, possibly for aromatic acidsZMO1529, ZMO1525 Efflux pump components; substrate unclearZMO1591, ZMO1590 Efflux pump for aromatic compoundsZMO1628, ZMO1630 Siderophore system acts as efflux system for catechol/protocatechualdehyde
Annotation correctionZMO1510 Misannotated as HemK family protein; actually a methyltransferase-modifying release factorZMO1997 Novel form of hemJ (as in Acinetobacter; see reference 47)
Other specific functionsZMO0112 Putative substrate of glutamine cyclotransferaseZMO0803, ZMO1892 Regulate peptidoglycan recycling and attachment to outer membraneZMO1808 RnfHZMO1916 BioH (computational prediction, supported by fitness data)
Pathway-level predictionZMO0055 Permease related to sulfate assimilationZMO0107 NDP-sugar transferase related to glycolipid synthesisZMO0132, ZMO0133 Outer membrane-associated acid tolerance proteinsZMO0331 Peptidase related to the outer membraneZMO0444, ZMO0445, ZMO0447 Lipid-related enzymes affecting the cell envelopeZMO0495 Outer membrane biogenesis proteinZMO0767, ZMO1319 Outer membrane-related proteinsZMO0934 ZliE secretion-related proteinZMO0947, ZMO0502 Synthesis and export of a cell wall componentZMO1317 Nucleotide kinase-like enzyme affecting the cell wallZMO1337 Hydroquinone resistance proteinZMO1530 Capsular polysaccharide synthesis proteinZMO1573 Peroxidase regulated by ZMO0116ZMO1717, ZMO1718 Part of an outer membrane integrity systemZMO1723 Laccase involved in oxidative stress resistanceZMO1734 UDP glycosyltransferase-like enzyme in cell wall synthesisZMO1790 Heme-related transporterZMO1875 FeS cluster repair with bolA (previously published in reference 17)
a Abbreviations: TF, transcription factor; RR, response regulator; HK, histidine kinase; NDP, nucleotide diphosphate.
Biologically Informative Mutant Fitness Patterns
October 2014 Volume 196 Number 20 jb.asm.org 3651
on Septem
ber 18, 2014 by guesthttp://jb.asm
.org/D
ownloaded from

ZMO0981), and close homologs of this operon are sometimesannotated as dipeptide or oligopeptide transporters. However,this system was important for growth in defined medium with noadded peptides, which seems inconsistent with that annotation.This operon was detrimental to fitness in the presence of beta-lactam antibiotics, and some homologous operons include puta-tive cell wall remodeling genes or beta-lactamases, so we proposethat this operon is involved in the export of a component of thecell envelope. Although the ZMO0981 protein contains recogniz-able ABC-like ATPase domains, we also identified phenotypes foruncharacterized proteins that do not contain recognized trans-porter domains but lie within a conserved operon with putativetransporter components and have cofitness with them. For exam-ple, the hypothetical gene ZMO1630 does not contain any recog-nizable domains (it has no InterPro hits) and has cofitness withZMO1628 (r � 0.81) and with other genes in the operon(ZMO1631-ZMO1628). The ZMO1631 protein is annotated as aTonB-like siderophore receptor protein, and ZMO1630 has a sig-nal peptide and three transmembrane helices (as predicted byTMHMM) and could be a component of a transporter. In Z. mo-bilis, ZMO1631-ZMO1628 mutants are sensitive to catechol orprotocatechualdehyde, which are similar compounds (both havebenzene rings with two adjacent hydroxyl groups) and are sidero-phores. Our prediction is that the Z. mobilis system naturally pro-motes the uptake of a ferric siderophore, while in our experi-ments, the proteins encoded by ZMO1631-ZMO1628 act as anefflux pump for catechol and protocatechualdehyde. By similarlogic, we predict that ZMO1015 (which contains a Pfam domainof unknown function) (DUF330), ZMO1591 (DUF140), andZMO1431 (DUF1656) encode components of transporters.
We also predicted specific functions for five other proteins. Forexample, we used cofitness to identify the RnfH (ZMO1808; an-notated as hypothetical) and RnfF (ZMO1842; misannotated asnosX) components of the ion-pumping electron transport com-plex Rnf (40, 41). We found that this complex is required foroptimal growth of Z. mobilis under anaerobic conditions (Fig.4A). To our knowledge, this is the first demonstration that RnfH,which is not always present in bacterial genomes with the Rnfcomplex (42), is required for its activity. Furthermore, we show
that rseC (ZMO1841), which is cotranscribed with rnfF, is func-tionally associated with the Rnf complex during anaerobic growthbut not during organic acid or beta-lactam antibiotic stress (Fig.4B). As another example, the hypothetical gene ZMO1916 hascofitness with biotin synthase (ZMO0094; r � 0.95) and dethio-biotin synthase (ZMO0095; r � 0.8), which suggests thatZMO1916 has a role in biotin synthesis. Indeed, an ortholog ofZMO1916 in cyanobacteria was annotated as bioK (43) and isproposed to be a pimeloyl-acyl carrier protein methyl ester es-terase. In E. coli, this activity is performed by BioH, but bioH is notpresent in cyanobacteria, and it is absent from Z. mobilis as well. Asfar as we know, this is the first experimental support for the in-volvement of these genes in biotin synthesis. In many of the casesdiscussed above, where we have a phenotype for an uncharacter-ized protein family that lies in a conserved operon, another inter-pretation might be that the novel protein has an unrelated func-tion and that the phenotypes are due to polar effects. We cannotrule out this possibility, but given that these are conserved operonsand that we found a moderate rate of polar effects, we think this isunlikely. Overall, we were able to make or improve specific anno-tations for 33 hypothetical proteins and make pathway-level pre-dictions for 24 others (Table 1).
Seventy-nine diverse mutant fitness experiments are nearlyas informative as 492 experiments. Given that technologies arerapidly advancing to the point that large-scale mutant phenotypedata sets in bacteria will proliferate (12–14), we asked whetherhundreds of laboratory experiments with a single bacterial speciesare worth the investment if the goal is to globally annotate genefunction (and not to detect statistically significant but subtle phe-notypes). To investigate this, we looked at the rate at which newgenes with strongly reduced fitness phenotypes (fitness less than�2) appear as a function of increasing the number of experiments(selected at random) for both Z. mobilis and S. oneidensis. For thisanalysis, counting genes with strong phenotypes is the simplestway to show the impact of adding more experiments, because itavoids complicated issues around experiment grouping or statis-tical significance. We find that while each additional experimentprovides an increase in the number of genes with a strong pheno-type below �2, there is diminishing return after 100 experi-
FIG 4 Function of Rnf/RseC in Z. mobilis. (A) Heat map of gene fitness values in rich medium in experiments for mutants in components of the Rnf complexand RseC. The experiments marked in red (x axis) were performed under aerobic conditions, and those marked in orange were performed under anaerobicconditions. Fitness values are color-coded as described in the legend to Fig. 1A. (B) Comparison of gene fitness values for the Rnf complex (averaged across alleight genes encoding components of the complex) versus RseC in different categories of experiments.
Deutschbauer et al.
3652 jb.asm.org Journal of Bacteriology
on Septem
ber 18, 2014 by guesthttp://jb.asm
.org/D
ownloaded from

ments in both bacteria (Fig. 3C). In Z. mobilis, an increase fromthe average set of 100 random experiments to all 492 experimentsonly moderately increases the number of genes with a strong re-duced-fitness phenotype (from 801 to 959). Similarly, 296 S. one-idensis experiments identify 1,379 genes with fitness below �2,compared to 1,046 genes from the average of 100 random exper-iments. Among the 502 genes without a specific function anno-tated in Z. mobilis, a similar trend of diminishing return is ob-served around 100 random experiments; moving from 100 to 492experiments only moderately increases the number of thesepoorly annotated genes with fitness less than �2 from 197 to 245(Fig. 3C).
Finally, we examined whether a rational approach for selectingthe conditions would enable the same level of biological discoverywhile reducing cost and effort. With one experiment from each ofthe 79 nonredundant groups of Z. mobilis fitness experiments (fora list of conditions, see Data set S1 in the supplemental material),146 of the 174 (84%) poorly characterized genes have high cofit-ness with one of the original genes (cofitness � 0.78). We used ahigher cofitness threshold for this analysis (0.78 versus 0.75) tokeep the fraction of random gene pairs with cofitness above 0.75fixed at 0.37%, despite having fewer experiments (79 versus 492).Therefore, 79 diverse, laboratory-based mutant fitness experi-ments (rather than 500) are sufficient for identifying most cofit-ness-based gene-gene associations in Z. mobilis. If we pick a ran-dom exemplar of each of the 61 nonredundant groups of S.oneidensis MR-1 fitness experiments (Data set S2), 1,130 genes,including 355 poorly characterized genes, have a reasonablystrong phenotype (�fitness� � 0.75) and significant cofitness above0.8. Of the 65 genes we previously annotated using mutant fitnessin S. oneidensis (4), 46 (71%) are above these thresholds in thereduced data set.
DISCUSSIONPhenotypes for almost all genes in bacteria. To our knowledge,our finding that 89% of assayed Z. mobilis genes have a detectablephenotype is the highest fraction for a bacterium thus far. In E.coli, despite decades of extensive single-gene and genome-widestudies, a significant fraction of the genome does not have anidentified phenotype (and hence function) (44). For instance, agenome-wide analysis of mutant fitness of single-gene knockoutstrains of E. coli across hundreds of conditions identified a signif-icant phenotype for only half of the genome (8). Furthermore,deletion of approximately 10% of the genes within a single strainof E. coli, primarily targeting hypothetical and selfish genes, didnot substantially impact the growth rate in a defined medium(45). There are a number of potential reasons why we detectedsuch a high percentage of genes with a phenotype in Z. mobilis,including the sensitivity of our competitive fitness assay (11), thesmall genome size of Z. mobilis, and our grouping of similar ex-periments to increase statistical power for detecting subtle pheno-types. Furthermore, we confirmed that these subtle phenotypesare genuine by showing that detrimental mutations continued todecrease in abundance when we continued the experiment formore generations (Fig. 1E), by showing that virtually all of thegenes with phenotypes in rich medium are expressed in rich me-dium (Fig. 1D), and by showing that even operons that have onlysubtle phenotypes tend to have high cofitness (Fig. 1C).
Utility of more phenotypes. Given that 79 fitness experimentssuffice to find phenotypes for most genes in Z. mobilis, it is not
surprising that doing hundreds of additional assays failed to findmany additional significant phenotypes. However, measuring fit-ness in additional conditions did not make the phenotypes moreinterpretable, which surprised us. Intuitively, more fitness exper-iments allow many genes to show more-complex fitness patternsthat contain more information about gene function, but we werenot able to take advantage of this. We believe that this is partlybecause most of these additional experiments were stresses bysmall molecules, which are difficult to interpret, so we relied oncofitness. Also, genes with significant but only weak phenotypestended to have lower cofitness (Fig. 3A), which limited our abilityto predict the functions of these genes. It is possible that betterstatistical methods or complementary data of other types (e.g.,protein-protein interactions or double mutants) would increasethe utility of the additional conditions. A related issue is that doingmore-similar experiments (e.g., different concentrations of an in-hibitor) allows for increased confidence in subtle phenotypes (re-ducing fitness by just 3% per generation), but we do not see how touse subtle phenotypes for annotation. In an organism with abroader range of metabolic or respiratory capabilities, such as S.oneidensis, many genes have specific phenotypes relating to me-tabolism or respiration that are readily interpretable (4). For ex-ample, doing an additional fitness experiment with a new carbonsource might yield a specific phenotype for one or two operonsinvolved in the transport or catabolism of that compound. Interms of the genome-wide numbers of genes with phenotypes, thisis not impressive, but it does lead to specific annotations.
Implications for annotating gene function in bacteria. Giventhe ease of bacterial genome sequencing, it is imperative that high-throughput approaches for elucidating gene function are devel-oped to determine gene function in a wide range of bacteria. Inaddition to demonstrating that nearly all genes in bacteria have anidentifiable phenotype, our results and methods suggest that scal-ing mutant fitness-based gene annotation to many bacteria is fea-sible. First, the majority of our Z. mobilis experiments (316 of 492)were performed in microplates, demonstrating that bacterial mu-tant fitness assays can be performed in a miniaturized, high-throughput growth format. Second, switching from microarraysto sequencing DNA bar codes will enable greater throughput andlower cost (13, 46).
Our genome-wide fitness results and analysis do not mean thatwe have completely validated the function(s) of the genes dis-cussed. Rather, our work flow provides a data-driven, high-throughput approach to generate many gene function predictionsof different specificities using gene-gene fitness correlations. Infact, we view our genome-wide data sets as a starting point forgenerating specific hypotheses on the functions of poorly charac-terized genes, which could be followed up with more-traditional,single-gene investigations. However, given the sheer number ofuncharacterized proteins, this will be possible only for the mostinteresting genes. We hope that other high-throughput ap-proaches will provide complementary information so that we canmake reliable claims about the functions of most of the otheruncharacterized proteins.
Although this study focused on poorly annotated genes, fitnessdata could also be used to test the more-specific functional anno-tations. We noted several erroneous annotations during the anal-ysis of hypothetical proteins (e.g., ZMO1842 was misannotated asnosX instead of as rnfF, and a soxR-like regulator was omitted fromthe annotation, see Text S1 in the supplemental material). To
Biologically Informative Mutant Fitness Patterns
October 2014 Volume 196 Number 20 jb.asm.org 3653
on Septem
ber 18, 2014 by guesthttp://jb.asm
.org/D
ownloaded from

illustrate this issue more broadly, we considered the protein-cod-ing genes of Z. mobilis that have specific annotations and signifi-cant beneficial phenotypes and are strongly beneficial in at leastone group of experiments (average fitness under �1). There are491 such proteins, and we examined a random subset of 20 ofthem (Text S2). We confirmed the annotations for nine of thesegenes and found two erroneous annotations. For the remainingnine genes, we could not make a clear determination; this in-cluded four genes that were important for fitness in most condi-tions, which confirms the gene’s importance but does not link it toa biological process. If scaled up to the 491 candidate proteins, thisapproach could probably be used to confirm hundreds of anno-tations and identify dozens of erroneous annotations.
Last, our results show that less than 100 experiments, instead of492, suffice to find phenotypes and informative cofitness for manygenes. Although these experiments were selected in hindsight, weexpect that most of the redundancy of the fitness experimentscould be avoided in future studies with other organisms. Most ofthe experiments grouped into clusters that comprised replicateexperiments, near-replicate experiments, such as different con-centrations of the same inhibitor, or experiments that involvedstructurally similar compounds, such as antibiotics of the sameclass.
What fitness experiments should be conducted for anotherbacterium? We recommend selecting conditions based on theorganism’s energetic or metabolic capabilities, i.e., differentsources of carbon and nitrogen, or combinations of electron do-nors and acceptors. We recommend that a few dozen dissimilarstresses be performed as well; our clustering should help to selectthese conditions (see Data sets S1 and S2 in the supplementalmaterial). In conclusion, this work provides a general approach todiscover the functions of many genes in diverse bacteria by usingmutant fitness.
ACKNOWLEDGMENTS
This work was initially funded by the Energy Biosciences Institute grantOO7G02 and completed with funding from ENIGMA. The work con-ducted by ENIGMA was supported by the Office of Science, Office ofBiological and Environmental Research of the U.S. Department of Energyunder contract DE-AC02-05CH11231.
REFERENCES1. Galperin MY, Koonin EV. 2010. From complete genome sequence to
‘complete’ understanding? Trends Biotechnol. 28:398 – 406. http://dx.doi.org/10.1016/j.tibtech.2010.05.006.
2. Raskin DM, Seshadri R, Pukatzki SU, Mekalanos JJ. 2006. Bacterialgenomics and pathogen evolution. Cell 124:703–714. http://dx.doi.org/10.1016/j.cell.2006.02.002.
3. Roberts RJ, Chang YC, Hu Z, Rachlin JN, Anton BP, Pokrzywa RM,Choi HP, Faller LL, Guleria J, Housman G, Klitgord N, Mazumdar V,McGettrick MG, Osmani L, Swaminathan R, Tao KR, Letovsky S,Vitkup D, Segre D, Salzberg SL, Delisi C, Steffen M, Kasif S. 2011.COMBREX: a project to accelerate the functional annotation of prokary-otic genomes. Nucleic Acids Res. 39:D11–D14. http://dx.doi.org/10.1093/nar/gkq1168.
4. Deutschbauer A, Price MN, Wetmore KM, Shao W, Baumohl JK, Xu Z,Nguyen M, Tamse R, Davis RW, Arkin AP. 2011. Evidence-basedannotation of gene function in Shewanella oneidensis MR-1 using ge-nome-wide fitness profiling across 121 conditions. PLoS Genet.7:e1002385. http://dx.doi.org/10.1371/journal.pgen.1002385.
5. Dudley AM, Janse DM, Tanay A, Shamir R, Church GM. 2005. A globalview of pleiotropy and phenotypically derived gene function in yeast. Mol.Syst. Biol. 1:2005.0001. http://dx.doi.org/10.1038/msb4100004.
6. Hillenmeyer ME, Ericson E, Davis RW, Nislow C, Koller D, Giaever G.
2010. Systematic analysis of genome-wide fitness data in yeast revealsnovel gene function and drug action. Genome Biol. 11:R30. http://dx.doi.org/10.1186/gb-2010-11-3-r30.
7. Hillenmeyer ME, Fung E, Wildenhain J, Pierce SE, Hoon S, Lee W,Proctor M, St. Onge RP, Tyers M, Koller D, Altman RB, Davis RW,Nislow C, Giaever G. 2008. The chemical genomic portrait of yeast:uncovering a phenotype for all genes. Science 320:362–365. http://dx.doi.org/10.1126/science.1150021.
8. Nichols RJ, Sen S, Choo YJ, Beltrao P, Zietek M, Chaba R, Lee S,Kazmierczak KM, Lee KJ, Wong A, Shales M, Lovett S, Winkler ME,Krogan NJ, Typas A, Gross CA. 2011. Phenotypic landscape of a bacterialcell. Cell 144:143–156. http://dx.doi.org/10.1016/j.cell.2010.11.052.
9. Oh J, Fung E, Schlecht U, Davis RW, Giaever G, St. Onge RP, Deutsch-bauer A, Nislow C. 2010. Gene annotation and drug target discovery inCandida albicans with a tagged transposon mutant collection. PLoSPathog. 6:e1001140. http://dx.doi.org/10.1371/journal.ppat.1001140.
10. Giaever G, Chu AM, Ni L, Connelly C, Riles L, Veronneau S, Dow S,Lucau-Danila A, Anderson K, Andre B, Arkin AP, Astromoff A, El-Bakkoury M, Bangham R, Benito R, Brachat S, Campanaro S, Curtiss M,Davis K, Deutschbauer A, Entian KD, Flaherty P, Foury F, Garfinkel DJ,Gerstein M, Gotte D, Guldener U, Hegemann JH, Hempel S, Herman Z,Jaramillo DF, Kelly DE, Kelly SL, Kotter P, LaBonte D, Lamb DC, Lan N,Liang H, Liao H, Liu L, Luo C, Lussier M, Mao R, Menard P, Ooi SL,Revuelta JL, Roberts CJ, Rose M, Ross-Macdonald P, Scherens B, Schim-mack G, Shafer B, Shoemaker DD, Sookhai-Mahadeo S, Storms RK,Strathern JN, Valle G, Voet M, Volckaert G, Wang CY, et al. 2002.Functional profiling of the Saccharomyces cerevisiae genome. Nature 418:387–391. http://dx.doi.org/10.1038/nature00935.
11. Oh J, Fung E, Price MN, Dehal PS, Davis RW, Giaever G, Nislow C,Arkin AP, Deutschbauer A. 2010. A universal TagModule collection forparallel genetic analysis of microorganisms. Nucleic Acids Res. 38:e146.http://dx.doi.org/10.1093/nar/gkq419.
12. Langridge GC, Phan MD, Turner DJ, Perkins TT, Parts L, Haase J,Charles I, Maskell DJ, Peters SE, Dougan G, Wain J, Parkhill J, TurnerAK. 2009. Simultaneous assay of every Salmonella Typhi gene using onemillion transposon mutants. Genome Res. 19:2308 –2316. http://dx.doi.org/10.1101/gr.097097.109.
13. Smith AM, Heisler LE, Mellor J, Kaper F, Thompson MJ, Chee M, RothFP, Giaever G, Nislow C. 2009. Quantitative phenotyping via deep bar-code sequencing. Genome Res. 19:1836 –1842. http://dx.doi.org/10.1101/gr.093955.109.
14. van Opijnen T, Bodi KL, Camilli A. 2009. Tn-seq: high-throughputparallel sequencing for fitness and genetic interaction studies in micro-organisms. Nat. Methods 6:767–772. http://dx.doi.org/10.1038/nmeth.1377.
15. Rogers PL, Jeon YJ, Lee KJ, Lawford HG. 2007. Zymomonas mobilis forfuel ethanol and higher value products. Adv. Biochem. Eng. Biotechnol.108:263–288. http://dx.doi.org/10.1007/10_2007_060.
16. Bochner B, Gomez V, Ziman M, Yang S, Brown SD. 2010. Phenotypemicroarray profiling of Zymomonas mobilis ZM4. Appl. Biochem. Bio-technol. 161:116 –123. http://dx.doi.org/10.1007/s12010-009-8842-2.
17. Skerker JM, Leon D, Price MN, Mar JS, Tarjan DR, Wetmore KM,Deutschbauer AM, Baumohl JK, Bauer S, Ibanez AB, Mitchell VD, WuCH, Hu P, Hazen T, Arkin AP. 2013. Dissecting a complex chemicalstress: chemogenomic profiling of plant hydrolysates. Mol. Syst. Biol.9:674. http://dx.doi.org/10.1038/msb.2013.30.
18. Pierce SE, Davis RW, Nislow C, Giaever G. 2007. Genome-wide analysisof barcoded Saccharomyces cerevisiae gene-deletion mutants in pooled cul-tures. Nat. Protoc. 2:2958 –2974. http://dx.doi.org/10.1038/nprot.2007.427.
19. Dehal PS, Joachimiak MP, Price MN, Bates JT, Baumohl JK, Chivian D,Friedland GD, Huang KH, Keller K, Novichkov PS, Dubchak IL, AlmEJ, Arkin AP. 2010. MicrobesOnline: an integrated portal for compara-tive and functional genomics. Nucleic Acids Res. 38:D396 –D400. http://dx.doi.org/10.1093/nar/gkp919.
20. Price MN, Deutschbauer AM, Kuehl JV, Liu H, Witkowska HE, ArkinAP. 2011. Evidence-based annotation of transcripts and proteins in thesulfate-reducing bacterium Desulfovibrio vulgaris Hildenborough. J. Bac-teriol. 193:5716 –5727. http://dx.doi.org/10.1128/JB.05563-11.
21. Yang S, Pappas KM, Hauser LJ, Land ML, Chen GL, Hurst GB, Pan C,Kouvelis VN, Typas MA, Pelletier DA, Klingeman DM, Chang YJ,Samatova NF, Brown SD. 2009. Improved genome annotation for Zy-
Deutschbauer et al.
3654 jb.asm.org Journal of Bacteriology
on Septem
ber 18, 2014 by guesthttp://jb.asm
.org/D
ownloaded from

momonas mobilis. Nat. Biotechnol. 27:893– 894. http://dx.doi.org/10.1038/nbt1009-893.
22. Price MN, Deutschbauer AM, Skerker JM, Wetmore KM, Ruths T, MarJS, Kuehl JV, Shao W, Arkin AP. 2013. Indirect and suboptimal controlof gene expression is widespread in bacteria. Mol. Syst. Biol. 9:660. http://dx.doi.org/10.1038/msb.2013.16.
23. Truglio JJ, Croteau DL, Van Houten B, Kisker C. 2006. Prokaryoticnucleotide excision repair: the UvrABC system. Chem. Rev. 106:233–252.http://dx.doi.org/10.1021/cr040471u.
24. Kuzminov A. 1999. Recombinational repair of DNA damage in Esche-richia coli and bacteriophage lambda. Microbiol. Mol. Biol. Rev. 63:751–813.
25. Zdraveski ZZ, Mello JA, Marinus MG, Essigmann JM. 2000. Multiplepathways of recombination define cellular responses to cisplatin. Chem.Biol. 7:39 –50.
26. Cox MM. 2007. Motoring along with the bacterial RecA protein. Nat. Rev.Mol. Cell Biol. 8:127–138. http://dx.doi.org/10.1038/nrm2099.
27. Christen B, Abeliuk E, Collier JM, Kalogeraki VS, Passarelli B, CollerJA, Fero MJ, McAdams HH, Shapiro L. 2011. The essential genome of abacterium. Mol. Syst. Biol. 7:528. http://dx.doi.org/10.1038/msb.2011.58.
28. Giaever G, Flaherty P, Kumm J, Proctor M, Nislow C, Jaramillo DF,Chu AM, Jordan MI, Arkin AP, Davis RW. 2004. Chemogenomicprofiling: identifying the functional interactions of small molecules inyeast. Proc. Natl. Acad. Sci. U. S. A. 101:793–798. http://dx.doi.org/10.1073/pnas.0307490100.
29. de Daruvar A, Collado-Vides J, Valencia A. 2002. Analysis of the cellularfunctions of Escherichia coli operons and their conservation in Bacillussubtilis. J. Mol. Evol. 55:211–221. http://dx.doi.org/10.1007/s00239-002-2317-1.
30. Price MN, Arkin AP, Alm EJ. 2006. The life-cycle of operons. PLoSGenet. 2:e96. http://dx.doi.org/10.1371/journal.pgen.0020096.
31. Rogozin IB, Makarova KS, Murvai J, Czabarka E, Wolf YI, Tatusov RL,Szekely LA, Koonin EV. 2002. Connected gene neighborhoods in pro-karyotic genomes. Nucleic Acids Res. 30:2212–2223. http://dx.doi.org/10.1093/nar/30.10.2212.
32. Baran R, Bowen BP, Price MN, Arkin AP, Deutschbauer AM, NorthenTR. 2013. Metabolic footprinting of mutant libraries to map metaboliteutilization to genotype. ACS Chem. Biol. 8:189 –199. http://dx.doi.org/10.1021/cb300477w.
33. Lynch M, Conery JS. 2003. The origins of genome complexity. Science302:1401–1404. http://dx.doi.org/10.1126/science.1089370.
34. Koskiniemi S, Sun S, Berg OG, Andersson DI. 2012. Selection-drivengene loss in bacteria. PLoS Genet. 8:e1002787. http://dx.doi.org/10.1371/journal.pgen.1002787.
35. Lee MC, Marx CJ. 2012. Repeated, selection-driven genome reduction ofaccessory genes in experimental populations. PLoS Genet. 8:e1002651.http://dx.doi.org/10.1371/journal.pgen.1002651.
36. Hottes AK, Freddolino PL, Khare A, Donnell ZN, Liu JC, Tavazoie S.
2013. Bacterial adaptation through loss of function. PLoS Genet.9:e1003617. http://dx.doi.org/10.1371/journal.pgen.1003617.
37. Wilson D, Charoensawan V, Kummerfeld SK, Teichmann SA. 2008.DBD–taxonomically broad transcription factor predictions: new contentand functionality. Nucleic Acids Res. 36:D88 –D92. http://dx.doi.org/10.1093/nar/gkm964.
38. Peterson JD, Umayam LA, Dickinson T, Hickey EK, White O. 2001. TheComprehensive Microbial Resource. Nucleic Acids Res. 29:123–125. http://dx.doi.org/10.1093/nar/29.1.123.
39. Italiani VC, da Silva Neto JF, Braz VS, Marques MV. 2011. Regulationof catalase-peroxidase KatG is OxyR dependent and Fur independent inCaulobacter crescentus. J. Bacteriol. 193:1734 –1744. http://dx.doi.org/10.1128/JB.01339-10.
40. Biegel E, Muller V. 2010. Bacterial Na-translocating ferredoxin:NADoxidoreductase. Proc. Natl. Acad. Sci. U. S. A. 107:18138 –18142. http://dx.doi.org/10.1073/pnas.1010318107.
41. Schmehl M, Jahn A, Meyer zu Vilsendorf A, Hennecke S, Masepohl B,Schuppler M, Marxer M, Oelze J, Klipp W. 1993. Identification of a newclass of nitrogen fixation genes in Rhodobacter capsulatus: a putative mem-brane complex involved in electron transport to nitrogenase. Mol. Gen.Genet. 241:602– 615.
42. Biegel E, Schmidt S, Gonzalez JM, Muller V. 2011. Biochemistry, evo-lution and physiological function of the Rnf complex, a novel ion-motiveelectron transport complex in prokaryotes. Cell. Mol. Life Sci. 68:613–634. http://dx.doi.org/10.1007/s00018-010-0555-8.
43. Rodionov DA, Mironov AA, Gelfand MS. 2002. Conservation of thebiotin regulon and the BirA regulatory signal in Eubacteria and Archaea.Genome Res. 12:1507–1516. http://dx.doi.org/10.1101/gr.314502.
44. Keseler IM, Collado-Vides J, Santos-Zavaleta A, Peralta-Gil M, Gama-Castro S, Muniz-Rascado L, Bonavides-Martinez C, Paley S, Krummen-acker M, Altman T, Kaipa P, Spaulding A, Pacheco J, Latendresse M,Fulcher C, Sarker M, Shearer AG, Mackie A, Paulsen I, Gunsalus RP,Karp PD. 2011. EcoCyc: a comprehensive database of Escherichia colibiology. Nucleic Acids Res. 39:D583–D590. http://dx.doi.org/10.1093/nar/gkq1143.
45. Kolisnychenko V, Plunkett G, III, Herring CD, Feher T, Posfai J,Blattner FR, Posfai G. 2002. Engineering a reduced Escherichia coli ge-nome. Genome Res. 12:640 – 647. http://dx.doi.org/10.1101/gr.217202.
46. Smith AM, Heisler LE, St Onge RP, Farias-Hesson E, Wallace IM,Bodeau J, Harris AN, Perry KM, Giaever G, Pourmand N, Nislow C.2010. Highly-multiplexed barcode sequencing: an efficient method forparallel analysis of pooled samples. Nucleic Acids Res. 38:e142. http://dx.doi.org/10.1093/nar/gkq368.
47. Boynton TO, Gerdes S, Craven SH, Neidle EL, Phillips JD, Dailey HA.2011. Discovery of a gene involved in a third bacterial protoporphyrino-gen oxidase activity through comparative genomic analysis and functionalcomplementation. Appl. Environ. Microbiol. 77:4795– 4801. http://dx.doi.org/10.1128/AEM.00171-11.
Biologically Informative Mutant Fitness Patterns
October 2014 Volume 196 Number 20 jb.asm.org 3655
on Septem
ber 18, 2014 by guesthttp://jb.asm
.org/D
ownloaded from
Related Documents


![The Short-Rooted Phenotype of the brevis radix Mutant ...The Short-Rooted Phenotype of thebrevis radix Mutant Partly Reflects Root Abscisic Acid Hypersensitivity1[C][W][OA] Americo](https://static.cupdf.com/doc/110x72/5e5c767a94a059785659a709/the-short-rooted-phenotype-of-the-brevis-radix-mutant-the-short-rooted-phenotype.jpg)


