TOWARDS A SUSTAINABLE AGRO-LOGISTICS IN DEVELOPING COUNTRIES THE CASE OF COCOA’S SUPPLY CHAIN IN SAN PEDRO REGION/CÔTE D’IVOIRE Abdel El Makhloufi Miguel Mujica Mota Dick van Damme Victor Langenberg Public Disclosure Authorized Public Disclosure Authorized Public Disclosure Authorized Public Disclosure Authorized

Welcome message from author
This document is posted to help you gain knowledge. Please leave a comment to let me know what you think about it! Share it to your friends and learn new things together.
Transcript
TOWARDS A SUSTAINABLE AGRO-LOGISTICS IN DEVELOPING COUNTRIESTHE CASE OF COCOA’S SUPPLY CHAIN IN SAN PEDRO REGION/CÔTE D’IVOIRE
Abdel El Makhloufi
Miguel Mujica Mota
Dick van Damme
Victor Langenberg
Pub
lic D
iscl
osur
e A
utho
rized
Pub
lic D
iscl
osur
e A
utho
rized
Pub
lic D
iscl
osur
e A
utho
rized
Pub
lic D
iscl
osur
e A
utho
rized
Publication
Research programme Urban Technology
Faculty of Technology, Amsterdam University of Applied Sciences (AUAS)
Amsterdam, The Netherlands.
Authors
Abdel El Makhloufi (AUAS, Research group ‘Mainport Logistics’)
Miguel Mujica Mota (AUAS, Aviation Academy)
Dick van Damme (AUAS, Research group ‘Mainport Logistics’)
Victor Langenberg (Deltares research institute)
Design
Creja ontwerpen
Financing
This report is financed by the World Bank and is making part of the World Bank
MDTF-SL projects.
The findings, interpretations, and conclusions expressed in this report do not
necessarily reflect the views of The World Bank or the governments they represent.
Contact
Dr. Abdel El Makhloufi
Amsterdam University of Applied Sciences (AUAS)
Weesperzijde 190. 1097 DZ Amsterdam
PO. Box 1025. 1000 BA Amsterdam, The Netherlands
Internet: http://www.international.hva.nl
Rights and Permissions
ISBN: 978-94-92644-09-1
This publication is available online at: http://www.hva.nl/urban-technology
Disclaimer: Research Centre Technology, Amsterdam University of Applied
Sciences, September 2018
All rights reserved
© 2018
TOWARDS A SUSTAINABLE AGRO-LOGISTICS IN DEVELOPING COUNTRIESTHE CASE OF COCOA’S SUPPLY CHAIN IN SAN PEDRO REGION/CÔTE D’IVOIRE
5
CONTENTS
ACKNOWLEDGMENTS 11
1. INTRODUCTION 13
1.1 Objectives and research question 14
1.2 Methodology and data collection 15
1.3 Limitation of methodology and data 16
2. THE ECONOMY OF COCOA PRODUCTION IN CÔTE D’IVOIRE 19
2.1 Population and socio-demographic development 19
2.2 Macro-economic development 23
2.2.1 Economic structure and sector composition 26
2.3 The international market of cocoa 28
2.3.1 World production 29
2.3.2 Grinding, production and stocks 31
2.3.3 International prices of cocoa 33
2.4 Economic performance of the cocoa sector in Côte d’Ivoire 34
2.4.1 Producers, production locations and production 35
2.4.2 Export and grinding capacity 38
2.4.3 Export markets and trade partners 40
2.4.4 World cocoa prices and the farm gate price 42
2.4.5 Strong performance and great vulnerability of the cocoa sector in Côte d’Ivoire 45
2.5 Concluding remarks 51
3. THEORETICAL AND CONCEPTUAL FRAMEWORK OF LOGISTICS SUPPLY CHAIN 55
3.1 Theoretical framework for studying cocoa supply chain and network 55
3.2 Conceptual framework for studying cocoa supply chain and network 60
3.3 Logistics of the cocoa supply chain and network in Côte d’Ivoire 63
4. MAPPING THE LOGISTICS OF COCOA SUPPLY CHAIN: EMPIRICAL STUDY
IN THE SAN PEDRO REGION 67
4.1 Socio-demographic and economic structure of the San Pedro region 67
4.2 Road infrastructure and accessibility to production location 73
4.3 The logistics of the cocoa supply chain in the San Pedro region 76
4.3.1 The weakest link in the logistics chain: the farmers 80
4.3.2 Key challenges at the upstream channel of the cocoa supply chain 90
4.3.3 Private buyers and traders: Powerful position in the upstream of the cocoa supply chain 94
4.3.4 Cooperatives: proliferation, weak position and weak integration in the logistics supply chain 95
4.3.5 Road freight transporters: inefficient, costly and unreliable 100
6 7
6.3.2 Ecosystem Services 175
6.3.3 Calculation of PPP and Bank Values in each Round 176
6.3.4 PPP and Individual Indicator Scores Determination 177
6.3.5 Port Development Measures 177
6.4 Serious Game finalisation 180
6.4.1 Adaptations 180
6.4.2 Presentation and hand-over 180
6.5 Follow-up and next phase 180
6.5.1 Workshop Design 180
6.5.2 10 steps recommendations 181
6.5.3 The feedback loop 184
7. CONCLUSIONS AND RECOMMENDATIONS 187
7.1 Recommendations 190
REFERENCES 201
APPENDIX 205
APPENDIX 1: LIST OF INTERVIEWS 207
LIST OF FIGURES
Figure 2.1 Population of Côte d’Ivoire, by age (1970-2016)
Figure 2.2 Occupations by region (men) (2012) 22
Figure 2.3 Real GDP growth of Côte d’Ivoire vs. sub-Saharan Africa: 1980-2018 24
Figure 2.4 Private consumption (current national prices), investments and public/government
consumption (1960-2014) (current national prices). 24
Figure 2.5 Export and import goods from 1960 to 2016 (in current US$) 25
Figure 2.6 Expenditure and revenues: 1960 to 2016 (in current US$) 26
Figure 2.7 Repartition of firms by sector, 2012 27
Figure 2.8 Total value added by sector: 1960-2016 28
Figure 2.9 World cocoa production and yields: 1960-2015 29
Figure 2.10 World cocoa production by region: 2011-15 30
Figure 2.11 Top ten exporters and importers countries of cocoa, 2012-16 30
Figure 2.12 Top ten grinding countries of cocoa in the world: 2011-15 32
Figure 2.13 Top ten grinding, production and stocks: 2006-16 (thousand tons) 33
Figure 2.14 Changes in nominal and real prices of cocoa (LHS) and world production (RHS)
from 2000 to 2016 ($/kg and thousands tons) 34
Figure 2.15 Total farmers and workers in the cocoa-coffee sector, by region (2014) 37
Figure 2.16 Total production and average yield (kg/ha): 1961-2016 38
Figure 2.17 Exports of cocoa, in volume (tons) and value (FCFA): 1995-2016 39
Figure 2.18 Export of cocoa derivatives (paste/liquor, powder/cake, and cocoa butter): 2012-15 40
4.3.6 International exporters and processors: high concentration and powerful position in
the logistics of cocoa supply chain 108
4.3.7 Logistics services companies/forwarders: last-mile logistics services 113
4.3.8 The port of San Pedro: a key actor in the cocoa supply chain and international logistics networks 117
4.4 Conclusion 127
5. CONCEPTUAL DESIGN AND FRAMEWORK OF COCOA SUPPLY CHAIN SIMULATION MODEL 131
5.1 Introduction to current approach in supply chain modelling 131
5.2 Discrete Event Systems Approach 132
5.2.1 Description 132
5.2.2 Fields of Application 133
5.2.3 Pros and Cons 133
5.3 Methodology for Supply Chain Simulation Modelling 134
5.3.1 Development Phase 136
5.4 Software Tool 143
5.4.1 SIMIO Simulation Program 143
5.5 Development of computer model 146
5.5.1 Cluster development 147
5.5.2 Inter-arrival time per Region 148
5.5.3 Share of the Raw Production 149
5.5.4 Check Point Implementations 150
5.5.5 Emissions 151
5.5.6 Final Model 151
5.6 Verification and Validation 153
5.7 Experimentation and Scenario Analysis 153
5.8 Conclusions and Recommendations 160
5.8.1 Recommendations 161
6. SERIOUS GAMING FOR SUSTAINABLE LOGISTICS, SUPPLY CHAIN AND PORT
DEVELOPMENT SAN PEDRO 163
6.1 Introduction and Concept 163
6.1.1 The Port of the Future gaming and training tool 163
6.1.2 Port of the Future: Conceptualisation 164
6.1.3 The Three Pillars of Sustainability: People, Planet and Profit 167
6.1.4 Figure 6.4. The People, Planet and Profit (PPP) concept. 168
6.2 The Serious Game 168
6.2.1 Introduction and Target Audience 168
6.2.2 Aim of the game 169
6.2.3 Game Procedure and Rules 169
6.2.4 Figure 6.4. Visualization of the game procedure Port of the Future Serious Game. 170
6.3 Scientific Background 172
6.3.1 The Building Blocks of PPP: Indicators 172
8 9
Figure 5.5 The GIS from OpenStreet.org for Ivory Coast 141
Figure 5.6 Network layer over the GIS map. 142
Figure 5.7 SIMIO Facility view. 144
Figure 5.8 Types and Hierarchy of Objects in SIMIO. 144
Figure 5.9 LINKS of SIMIO on the GIS map. 146
Figure 5.10 Clustering of Cocoa production in San Pedro. 147
Figure 5.11 Entities for computer simulation. 148
Figure 5.12 Checkpoints within the road network 150
Figure 5.13 Graphical aspect of simulation model of region of San Pedro. 152
Figure 5.14 Dashboard of simulation model. 152
Figure 6.1 Stepped approach in stakeholder participation process. 164
Figure 6.2 Comparison between traditional ports (left) and the “Port of the Future” (right) (Schipper, 2015) 165
Figure 6.3 The People, Planet and Profit (PPP) concept. 168
Figure 6.4 Visualization of the game procedure Port of the Future Serious Game. 170
Figure 6.5 The nine performance indicators of the Port of the Future Serious Game. 173
Figure 6.6 Coastal and estuarine ecosystem services of a port environment (Drennan, 2015). 176
Figure 6.7 The calculation of the PPP score and bank calculation for the next gaming round. 176
Figure 6.8 Measure Card Example. 179
Figure 6.9 Workshop methodology: Developing a sustainable supply chain (steps 1 to 10). 182
LIST OF TABLES
Table 4.1 State of Road networks in San Pedro region (2008) 74
Table 4.2 Exporters of cocoa derivatives in San Pedro 109
Table 4.3 Type and number of vessels movements in the port of San Pedro: 2012-2017 (abs.). 121
Table 5.1 Elements to be considered in the simulation model 137
Table 5.2 Characteristics of the Warehouses, Port and Grinders 142
Table 5.3 Vehicle characteristics 143
Table 5.4 Characteristics of the roads 149
Table 5.5 Checkpoint characteristics 151
Table 5.6 Vehicle’s characteristics 151
Table 5.7 Design of Experiments for the Supply Chain Model 154
Table 5.8 Base Case Characteristics 155
Table 5.9 Simulated Results for Base case Scenario 155
Table 5.10 Scenario II Characteristics 156
Table 5.11 Results 156
Table 5.12 Scenario III Characteristics 157
Table 5.13 Results 157
Table 5.14 Scenario IV Characteristics 157
Table 5.15 Results 158
Table 5.16 Scenario V Characteristics 158
Figure 2.19 Trade partners and markets of Côte d’Ivoire (2014) 41
Figure 2.20 Composition of transport sector in Côte d’Ivoire: 2000-2012 48
Figure 2.21 LPI score, Côte d’Ivoire: 2012 vs. 2016 50
Figure 3.1 Theoretical/conceptual framework for a sustainable logistics chain and network 56
Figure 3.2 Conceptual framework for studying logistics chains and networks 61
Figure 4.1 Population of Bas-Sassandra, by prefecture/sub-region (2014) 70
Figure 4.2 Number of households by prefecture/sub-region (2014) 70
Figure 4.3 Type of jobs in south-west region vs. Abidjan (2012). 72
Figure 4.4 Logistics of the cocoa supply chain in San Pedro, Côte d’Ivoire 78
Figure 4.5 Surveyed households in the district of Bas-Sassandra by department 79
Figure 4.6 Cocoa producers/farmers by department/region (2014) 80
Figure 4.7 Number and total inhabitants of settlements in the department of Bas-Sassandra 82
Figure 4.8 Age structure (left) and household size (right) of cocoa farmers in the Bas-Sassandra district 82
Figure 4.9 Farm size in the San Pedro region/Bas-Sassandra 83
Figure 4.10 Average labor force (paid and not paid) in the cocoa sector in the San Pedro region 86
Figure 4.11 Expenses of fertilizers, pesticides and seeds by department 87
Figure 4.12 Reasons for rejecting credits to cocoa farmers 88
Figure 4.13 Median income/revenue per departments in the San Pedro region 89
Figure 4.14 Disposable income per day of cocoa farmers in the San Pedro region 90
Figure 4.15 Number of licensed cocoa buyers in San Pedro region: 2015-2017 95
Figure 4.16 Share of total cooperatives in San Pedro, by department and region (2015) 97
Figure 4.17 Distribution of the size of cooperatives by region (2015) 98
Figure 4.18 Composition of transport fleet in San Pedro (2017) 101
Figure 4.19 Trucking sector in San Pedro region, by department 102
Figure 4.20 Estimated delays (left) by distance (right) from/to San Pedro 105
Figure 4.21 Estimated costs of checkpoints from/to San Pedro. 106
Figure 4.22 Estimated total export by international exporters (2017). 110
Figure 4.23 Local grinding in San Pedro 112
Figure 4.24 Total monthly export handled by the six largest forwarders in San Pedro (2017) (in tons) 115
Figure 4.25 Estimated total storage capacity of warehouses of the six largest forwarders in San Pedro (2017) 116
Figure 4.26 San Pedro port traffic (thousand tons) 119
Figure 4.27 Exports from the port of San Pedro by product (2012-2017, in tons) 120
Figure 4.28 Share of cocoa beans among total exports: 2012-2017 (tons) 121
Figure 4.29 Waiting time of vessels at PASP (2016) 123
Figure 4.30 Average waiting time, quay duration (lift axis) and average turnaround of vessels at the port
of San Pedro (2016) 124
Figure 4.31 Absolute waiting time and turnaround time of vessels at the port of San Pedro (2016) 124
Figure 4.32 Total number of vehicle movements from/to the port (2016) 125
Figure 5.1 Simulation Methodology 135
Figure 5.2 The Cocoa Supply Chain Model 136
Figure 5.3 Standard heavy truck used for transporting the Cocoa to the Port 139
Figure 5.4 The Level of Cocoa Production in Ivory Coast. 140
10 11
ACKNOWLEDGMENTS
This report presents the final research results on the logistics of the cocoa’s supply chain in the San Pedro region in
Côte d’Ivoire. The research project is undertaken by the Amsterdam University of Applied Sciences (Urban Technology
research group and Aviation Academy research group), in cooperation with the institute for applied research in the
field of water and surface ‘Deltares’ and the Port of Amsterdam in The Netherlands.
The project has its focus on the logistics of the cocoa supply chain from the farmer to the Port of San Pedro in Côte
d’Ivoire. The report specifies the evaluation methodology determining the focus and scope of the project, including
the development of a theoretical and conceptual framework, a simulation model and a serious gaming model.
It presents the results of empirical analysis, based on the analysis of various data collected from the field and from
interviews with various actors which are involved in the logistics of the cocoa’s supply chain in Côte d’Ivoire, as well
as the results from the simulation modelling approach.
We are grateful for the assistance from and support of the Dutch Embassy in Abidjan during our field research;
especially Ambassador Robert van den Dool, Raïssa Marteaux and Joel Amani Kouame. Our thanks also go to the
national Statistical Office of Côte d’Ivoire for providing us with the data on the cocoa sector in San Pedro region. We
acknowledge the assistance of Jack Steijn in helping us to organize a workshop during the Chocoa Conference in
February 2018 in Amsterdam.
We want to thank Eric Warners, Mark Hoolwerf and Roel de van der Schueren for their continuous support and
valuable comments on this report. Also, we would like to thank Edith Petersen, research coordinator at Urban
Technology for managing the project. Special thanks go to Sandrine Zahibe from the Port of San Pedro (PASP) for
facilitating our fieldwork in the region of San Pedro.
We thank both the Port of Amsterdam and the Port of San Pedro for their support and encouragement throughout
the process.
Last but not least, our deepest appreciation goes to all the people who received us and were prepared to exchange
their ideas and knowledge about the cocoa sector during our fieldwork missions in Côte d’Ivoire.
In addition the authors acknowledge the financial support of the Worldbank Multi-Donor Trust Fund for Sustainable
Logistics (MDTF-SL) for making this study possible.
“You get what you inspect, not what you expect” (Oliver Wright, cited by Melnyk et al. 2004).
Table 5.17 Results 159
Table 5.18 Scenario VI Characteristics 159
Table 5.19 Results 159
Table 5.20 Summary of findings 160
Table 6.1 Steps game procedure Port of the Future Serious Game 170
Table 6.2 Overview of value scores and effects on measures with their performance under the PPP indicators 178
LIST OF MAPS
Map 2.1 Population density in Côte d’Ivoire 21
Map 2.2 Spatial distribution of villages, hamlet and settlments in Côte d’Ivoire 36
Map 2.3 Transport infrastructure and road network in Côte d’Ivoire 47
Map 4.1 Map of the district of Bas-Sassandra/Great region of San Pedro 68
Map 4.2 Population of the district of Bas-Sassandra 69
Map 4.3 Road network in San Pedro region 73
Map 4.4 Distribution of cocoa farmers and worker per department 81
Map 4.5 Cocoa production in San Pedro region, by department 85
Map 4.6 Road networks and main access roads from/to San Pedro 104
Map 4.7 Location of warehouses and processing factories in San Pedro 108
Map 4.8 Spatial location of Grinders in San Pedro 113
Map 4.9 The Port of San Pedro (PASP) 118
Map 4.10 Future expansion plans of PASP 126

12 13
1. INTRODUCTION
THIS RESEARCH MAKES PART OF THE MULTI-DONOR TRUST FUND FOR SUSTAINABLE LOGISTICS
(MDTF-SL), WHICH PROMOTES SUSTAINABLE LOGISTICS PRACTICES IN DEVELOPING COUNTRIES
BY FUNDING RESEARCH ACTIVITIES ON AGRI-LOGISTICS, GREEN SUPPLY CHAINS, URBAN
LOGISTICS AND PORT-CITY DEVELOPMENT.
In the area of agri-logistics, the MDTF-SL aims to assist developing countries in strengthening food security and
improving the competitiveness of agricultural exports through reducing logistics and food losses along the supply
chains. Sustainable and efficient agri-logistics is critical to the economic development of many African countries such
as Côte d’Ivoire. It boosts agriculture productivity and improves food security for the growing urban population.
Furthermore, it also increases employment and reduces poverty. The development of efficient logistics supply chains
is essential for improving the daily lives of the population, firms and sectors of the economy.
Côte d’Ivoire is a gateway to West Africa, boasting sizable exports and imports of agri-commodities in the region.
The economy of Côte d’Ivoire is dominated by agriculture, in particular the growing of cocoa beans, the country’s
largest export. Côte d’Ivoire supplies more than one-third of the world’s cocoa but processes only 30 percent of the
total produced cocoa. This is because the market of the cocoa sector is highly concentrated and the bulk of trade
and processing of cocoa is dominated by a limited number of international exporters companies. The entry barriers
to this market segment are very high, due to the large volumes required to produce and export cocoa derivatives
and large investments in specific types of equipment, storage facilities and transportation.
The cocoa sector is a major export earner in term of revenues, yet its production is still in the hands of aging small
farmers with large productivity losses as a result of numerous structural problems and challenges, such as the
existence of poor physical infrastructure (road conditions, storage facilities, energy, telecommunication), low use
of ICT, high transport costs and high congestion, poor quality and increasing waste, as well as weak institutional
infrastructures such as government support, sanction systems and weak producer associations.
More than 75 percent of the total cocoa in Côte d’Ivoire is produced in the south-west region, where the most
fertile forest zones for cultivating cocoa can be found, especially the production zones of Dalao, Divo, Gagnoa,
Soubré and San Pedro.
1
14 15
INTRODUCTION
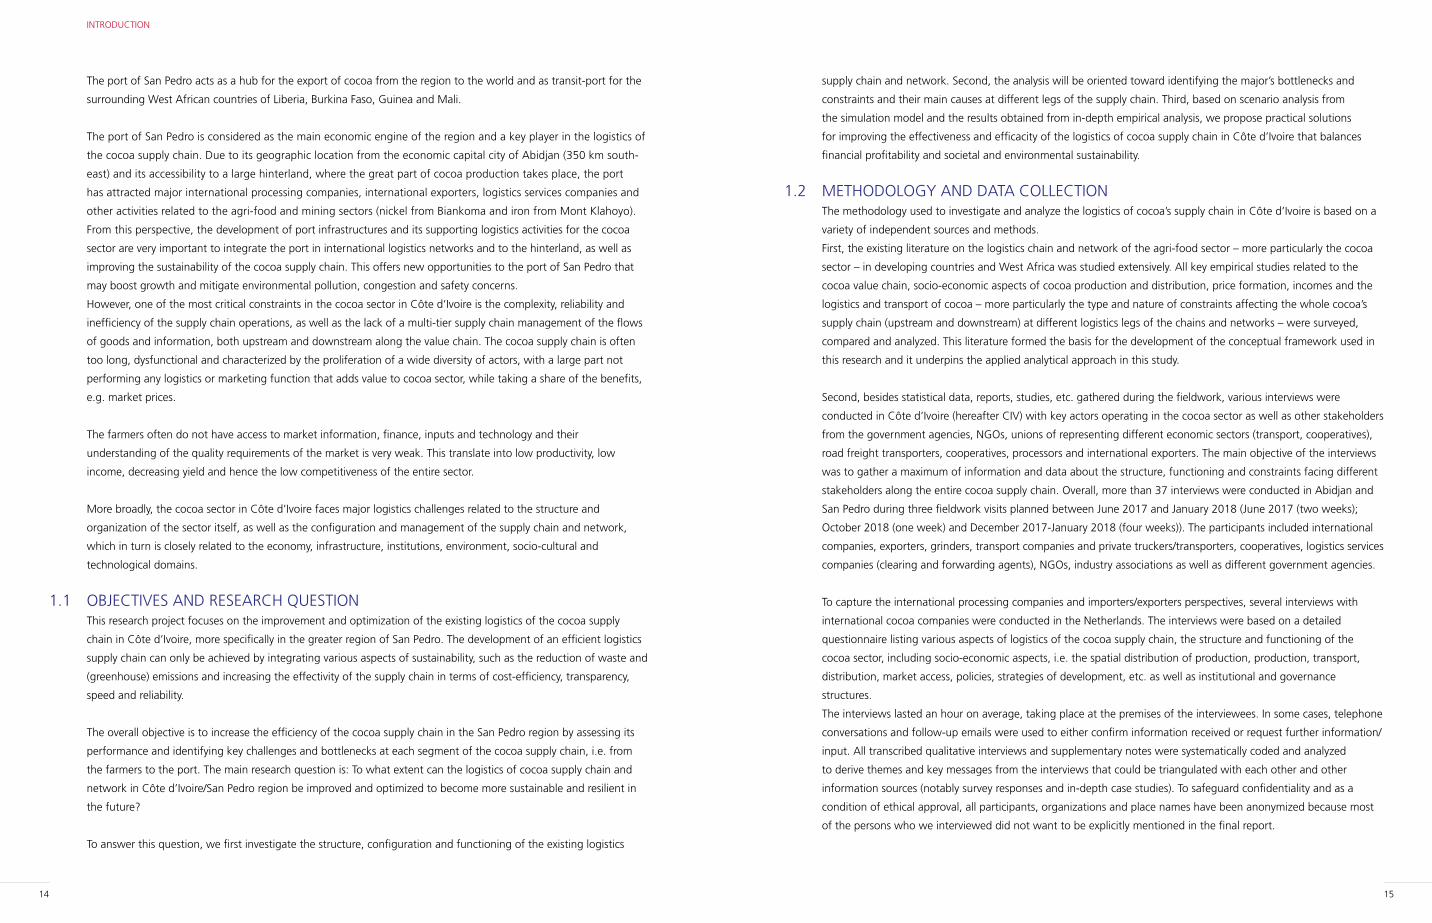
supply chain and network. Second, the analysis will be oriented toward identifying the major’s bottlenecks and
constraints and their main causes at different legs of the supply chain. Third, based on scenario analysis from
the simulation model and the results obtained from in-depth empirical analysis, we propose practical solutions
for improving the effectiveness and efficacity of the logistics of cocoa supply chain in Côte d’Ivoire that balances
financial profitability and societal and environmental sustainability.
1.2 METHODOLOGY AND DATA COLLECTIONThe methodology used to investigate and analyze the logistics of cocoa’s supply chain in Côte d’Ivoire is based on a
variety of independent sources and methods.
First, the existing literature on the logistics chain and network of the agri-food sector – more particularly the cocoa
sector – in developing countries and West Africa was studied extensively. All key empirical studies related to the
cocoa value chain, socio-economic aspects of cocoa production and distribution, price formation, incomes and the
logistics and transport of cocoa – more particularly the type and nature of constraints affecting the whole cocoa’s
supply chain (upstream and downstream) at different logistics legs of the chains and networks – were surveyed,
compared and analyzed. This literature formed the basis for the development of the conceptual framework used in
this research and it underpins the applied analytical approach in this study.
Second, besides statistical data, reports, studies, etc. gathered during the fieldwork, various interviews were
conducted in Côte d’Ivoire (hereafter CIV) with key actors operating in the cocoa sector as well as other stakeholders
from the government agencies, NGOs, unions of representing different economic sectors (transport, cooperatives),
road freight transporters, cooperatives, processors and international exporters. The main objective of the interviews
was to gather a maximum of information and data about the structure, functioning and constraints facing different
stakeholders along the entire cocoa supply chain. Overall, more than 37 interviews were conducted in Abidjan and
San Pedro during three fieldwork visits planned between June 2017 and January 2018 (June 2017 (two weeks);
October 2018 (one week) and December 2017-January 2018 (four weeks)). The participants included international
companies, exporters, grinders, transport companies and private truckers/transporters, cooperatives, logistics services
companies (clearing and forwarding agents), NGOs, industry associations as well as different government agencies.
To capture the international processing companies and importers/exporters perspectives, several interviews with
international cocoa companies were conducted in the Netherlands. The interviews were based on a detailed
questionnaire listing various aspects of logistics of the cocoa supply chain, the structure and functioning of the
cocoa sector, including socio-economic aspects, i.e. the spatial distribution of production, production, transport,
distribution, market access, policies, strategies of development, etc. as well as institutional and governance
structures.
The interviews lasted an hour on average, taking place at the premises of the interviewees. In some cases, telephone
conversations and follow-up emails were used to either confirm information received or request further information/
input. All transcribed qualitative interviews and supplementary notes were systematically coded and analyzed
to derive themes and key messages from the interviews that could be triangulated with each other and other
information sources (notably survey responses and in-depth case studies). To safeguard confidentiality and as a
condition of ethical approval, all participants, organizations and place names have been anonymized because most
of the persons who we interviewed did not want to be explicitly mentioned in the final report.
The port of San Pedro acts as a hub for the export of cocoa from the region to the world and as transit-port for the
surrounding West African countries of Liberia, Burkina Faso, Guinea and Mali.
The port of San Pedro is considered as the main economic engine of the region and a key player in the logistics of
the cocoa supply chain. Due to its geographic location from the economic capital city of Abidjan (350 km south-
east) and its accessibility to a large hinterland, where the great part of cocoa production takes place, the port
has attracted major international processing companies, international exporters, logistics services companies and
other activities related to the agri-food and mining sectors (nickel from Biankoma and iron from Mont Klahoyo).
From this perspective, the development of port infrastructures and its supporting logistics activities for the cocoa
sector are very important to integrate the port in international logistics networks and to the hinterland, as well as
improving the sustainability of the cocoa supply chain. This offers new opportunities to the port of San Pedro that
may boost growth and mitigate environmental pollution, congestion and safety concerns.
However, one of the most critical constraints in the cocoa sector in Côte d’Ivoire is the complexity, reliability and
inefficiency of the supply chain operations, as well as the lack of a multi-tier supply chain management of the flows
of goods and information, both upstream and downstream along the value chain. The cocoa supply chain is often
too long, dysfunctional and characterized by the proliferation of a wide diversity of actors, with a large part not
performing any logistics or marketing function that adds value to cocoa sector, while taking a share of the benefits,
e.g. market prices.
The farmers often do not have access to market information, finance, inputs and technology and their
understanding of the quality requirements of the market is very weak. This translate into low productivity, low
income, decreasing yield and hence the low competitiveness of the entire sector.
More broadly, the cocoa sector in Côte d’Ivoire faces major logistics challenges related to the structure and
organization of the sector itself, as well as the configuration and management of the supply chain and network,
which in turn is closely related to the economy, infrastructure, institutions, environment, socio-cultural and
technological domains.
1.1 OBJECTIVES AND RESEARCH QUESTION This research project focuses on the improvement and optimization of the existing logistics of the cocoa supply
chain in Côte d’Ivoire, more specifically in the greater region of San Pedro. The development of an efficient logistics
supply chain can only be achieved by integrating various aspects of sustainability, such as the reduction of waste and
(greenhouse) emissions and increasing the effectivity of the supply chain in terms of cost-efficiency, transparency,
speed and reliability.
The overall objective is to increase the efficiency of the cocoa supply chain in the San Pedro region by assessing its
performance and identifying key challenges and bottlenecks at each segment of the cocoa supply chain, i.e. from
the farmers to the port. The main research question is: To what extent can the logistics of cocoa supply chain and
network in Côte d’Ivoire/San Pedro region be improved and optimized to become more sustainable and resilient in
the future?
To answer this question, we first investigate the structure, configuration and functioning of the existing logistics
16 17
INTRODUCTION
of the most important functions of governments and sharing data for research purposes is essential to help policy-
makers to develop policy measures of development. However, as the case in many developing countries, some
government agencies in CIV refused to provide us access to their data (Cocoa Board (CCC), Ministry of Agriculture),
perhaps for political reasons and/or quality concerns. More generally, the availability and quality of statistical data
is a great challenge for researchers due to the lack of consistent and comparable data and the poor quality of
data, especially reliable and up-to-date data of transport and logistics sectors. However, the very rich and extensive
information on the production side of the cocoa sector that the micro-data obtained from the national statistical
agency (INS) was very helpful in analyzing various aspects of production of cocoa at the farmer, household and
regional level. Two different micro-data types were provided by the national statistics agency (INS): micro-data
containing information about the total number of farmers and settlements at a very local geographical level.
First, both data was checked for collection errors, omissions and outliers. Subsequently, various variables from the
household survey were calculated and converted to a uniform weight such as the conversion of the surface of land
plots from m2 and the acre to the hectare, total production quantities in different weights (number of boxes, bags,
etc.) into kg and tons, etc. The two datasets were then cleaned and merged together into one single dataset at the
household and settlement geographical level. Eventually, we were left with a dataset containing more than 34,000
surveyed individuals/farmers in the three departments of the Bas-Sassandra district and a dozen variables, including
socio-demographic variables (age, sex, type and size of households, nationality and ethnic origin, number of men,
women and children’s, employment, incomes, expenditures per household and per head, etc.) as well as variables
like total superficies of cultivated parcels, total yield, total production (in kg), production costs (pesticides, seeds,
number of employees per year/hours per week, etc.), total seals, production loss (kg) and revenues, etc. (see results
presented in empirical analysis, chapter 4). Based on this, the research team made a necessary trade-off between the
breadth and depth of analysis, covering some themes in detail and others more superficially.
The organization of the report is as follows:
Chapter 2 presents a broad overview of the socio-demographic and macro-economic development of CIV and
analyzes the world market of cocoa and the economic importance of the cocoa sector for the Ivorian economy.
Chapter 3 presents the theoretical foundations of the logistics supply chain and a conceptual framework for
studying the logistics of the cocoa supply chain in CIV. This conceptual framework is then applied and discussed in
the analysis for the cocoa logistics chains in CIV.
Chapter 4 presents the empirical analysis of the logistics of the cocoa supply chain in the San Pedro region. It begins
with an analysis of the structure and a management of the logistics of the cocoa supply chain, the multiple actors
involved in the cocoa supply chain, their role, position and function in the logistics chain. Furthermore, an in-depth
empirical analysis of the entire logistics of the cocoa supply chain is presented, as well as the analysis of the type and
causes of identified constraints and bottlenecks occurring at each channel of the logistic chain.
Chapter 5 presents an overall methodological approach and theoretical foundation of the simulation model.
The model specification, choice of parameters, data and hypotheses are discussed in this chapter and the results
obtained from different scenarios are presented and discussed based on data gathered from the field.
Chapter 6 presents the theoretical and methodological approaches, as well as the main buildings blocks and
components of the serious gaming model. The relevancy and possibilities of the application of the model in policy-
making are discussed in this chapter.
Third, a dynamic simulation model and serious gaming model were developed by the research team, based on the
data and information gathered from the fieldwork. The applied modeling approach serves as a decision support
tool for driving decisions regarding policies that positively affect the performance and productivity of the cocoa
supply chain. The simulation model is a high-level discrete-event simulation (DES) model that enables flexibility,
transparency and increased awareness of the decision-making process.
In a discrete-event model, it is easy to model a sequence of steps and characterize the objects – called entities –
flowing through the model. Therefore, discrete-event simulation is extensively used in the domain of modeling
logistic systems. In particular, this approach fits perfectly for supply chain networks since the processes involved
qualify for the aforementioned characteristics. The advantages of applying the DES approach are that: (1) it allows
easily defining a stochastic model and performing Monte Carlo simulations, taking into account the intrinsic
risk and uncertainty of real systems; (2) each model entity is well identified and characterized by a number of
attributes whose values may change when some specific events are executed, whereby we can examine the status
of each model entity at each time step of the simulation, gaining a better understanding of the evolution of the
process during a simulation run; and (3) DES models can be used to understand how a system will behave under
environmental extraordinary conditions. For example, such a simulation could help management to understand large
increases in orders, significant swings in product mix or even new client delivery demands.
Besides the simulation model, a serious gaming model for sustainable supply chain development is developed by
the applied research institute ‘Deltares’. The development of the simulation tool has two objectives: (i) to develop a
serious game tool to be used in stakeholder debates concerning the port development strategies and their impact
on the region and the port’s hinterland; and (ii) develop an educational approach for the port community and
stakeholders in the cocoa supply chain in which different aspects of a traditional port-supply chain versus future
requirements are showcased through collaborative serious gaming. The overall aim of the serious game is to create
an awareness of key stakeholders and gain support for a more sustainable development approach of the port of San
Pedro and its connections to the hinterland. This includes socio-economic developments, the natural requirements of
ports and supply chains and insights into the impact of the sustainable growth design and underlying cause-effect
relations.
The serious game is based on the outcome of the planned field studies as well as the DES model scenario output,
whereby the complexity of port and supply chain development can be integrated with fundamental natural and
socio-economic knowledge developments. The San Pedro Port of the future serious game applies a fictional but
realistic environment based on three pillars of sustainability indicators (people, planet and profit): (i) traditional and
modern port and supply chain development scenarios are compared; (ii) the game applies a realistic environment,
autonomous scenarios, a set of measures and a qualitative set of indicators for safety, economy and the natural
environment; (iii) effective operation with possible cost savings through reduced investment and maintenance cost
can be implemented for the short to long term of 20 years; (iv) in negotiation, collaboration and reflection on policy
decisions is part of the role play; and (v) the serious game contains simulations that involve knowledge of measures
on the socio-ecological system, the vulnerability of the environment, nature values, social and cultural aspects as
well as economic growth.
1.3 LIMITATION OF METHODOLOGY AND DATAIt is worth mentioning that much research on development issues relies on data. Data and evidence are the
foundation of an objective evaluation of the effectiveness of sectoral development policy. Data production is one
18 19
THE ECONOMY OF COCOA PRODUCTION IN CÔTE D’IVOIRE
2
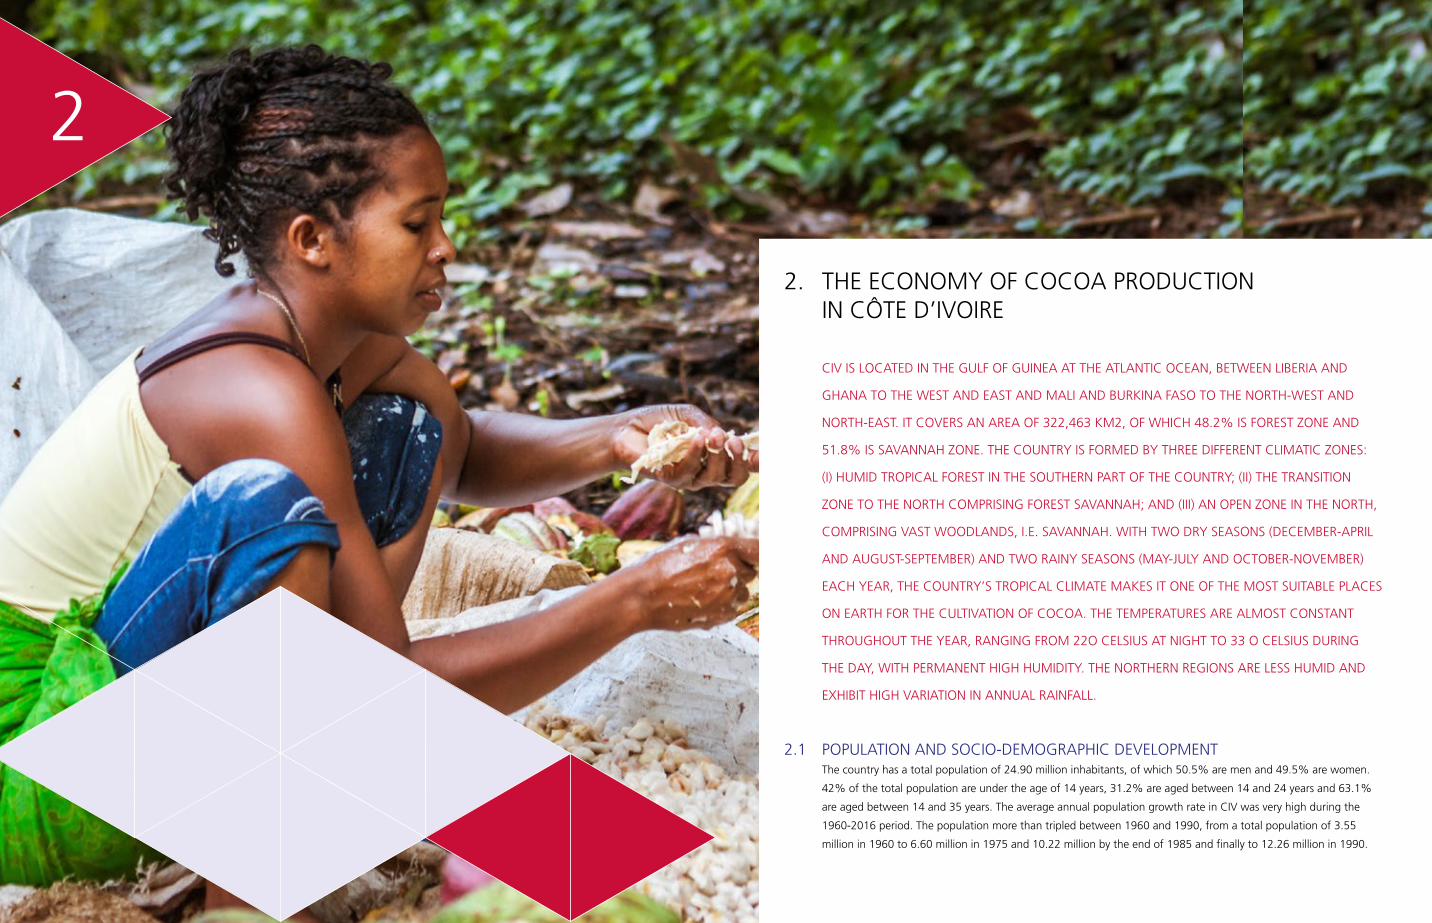
2. THE ECONOMY OF COCOA PRODUCTION IN CÔTE D’IVOIRE
CIV IS LOCATED IN THE GULF OF GUINEA AT THE ATLANTIC OCEAN, BETWEEN LIBERIA AND
GHANA TO THE WEST AND EAST AND MALI AND BURKINA FASO TO THE NORTH-WEST AND
NORTH-EAST. IT COVERS AN AREA OF 322,463 KM2, OF WHICH 48.2% IS FOREST ZONE AND
51.8% IS SAVANNAH ZONE. THE COUNTRY IS FORMED BY THREE DIFFERENT CLIMATIC ZONES:
(I) HUMID TROPICAL FOREST IN THE SOUTHERN PART OF THE COUNTRY; (II) THE TRANSITION
ZONE TO THE NORTH COMPRISING FOREST SAVANNAH; AND (III) AN OPEN ZONE IN THE NORTH,
COMPRISING VAST WOODLANDS, I.E. SAVANNAH. WITH TWO DRY SEASONS (DECEMBER-APRIL
AND AUGUST-SEPTEMBER) AND TWO RAINY SEASONS (MAY-JULY AND OCTOBER-NOVEMBER)
EACH YEAR, THE COUNTRY’S TROPICAL CLIMATE MAKES IT ONE OF THE MOST SUITABLE PLACES
ON EARTH FOR THE CULTIVATION OF COCOA. THE TEMPERATURES ARE ALMOST CONSTANT
THROUGHOUT THE YEAR, RANGING FROM 22O CELSIUS AT NIGHT TO 33 O CELSIUS DURING
THE DAY, WITH PERMANENT HIGH HUMIDITY. THE NORTHERN REGIONS ARE LESS HUMID AND
EXHIBIT HIGH VARIATION IN ANNUAL RAINFALL.
2.1 POPULATION AND SOCIO-DEMOGRAPHIC DEVELOPMENTThe country has a total population of 24.90 million inhabitants, of which 50.5% are men and 49.5% are women.
42% of the total population are under the age of 14 years, 31.2% are aged between 14 and 24 years and 63.1%
are aged between 14 and 35 years. The average annual population growth rate in CIV was very high during the
1960-2016 period. The population more than tripled between 1960 and 1990, from a total population of 3.55
million in 1960 to 6.60 million in 1975 and 10.22 million by the end of 1985 and finally to 12.26 million in 1990.
20 21
THE ECONOMY OF COCOA PRODUCTION IN CÔTE D’IVOIRE
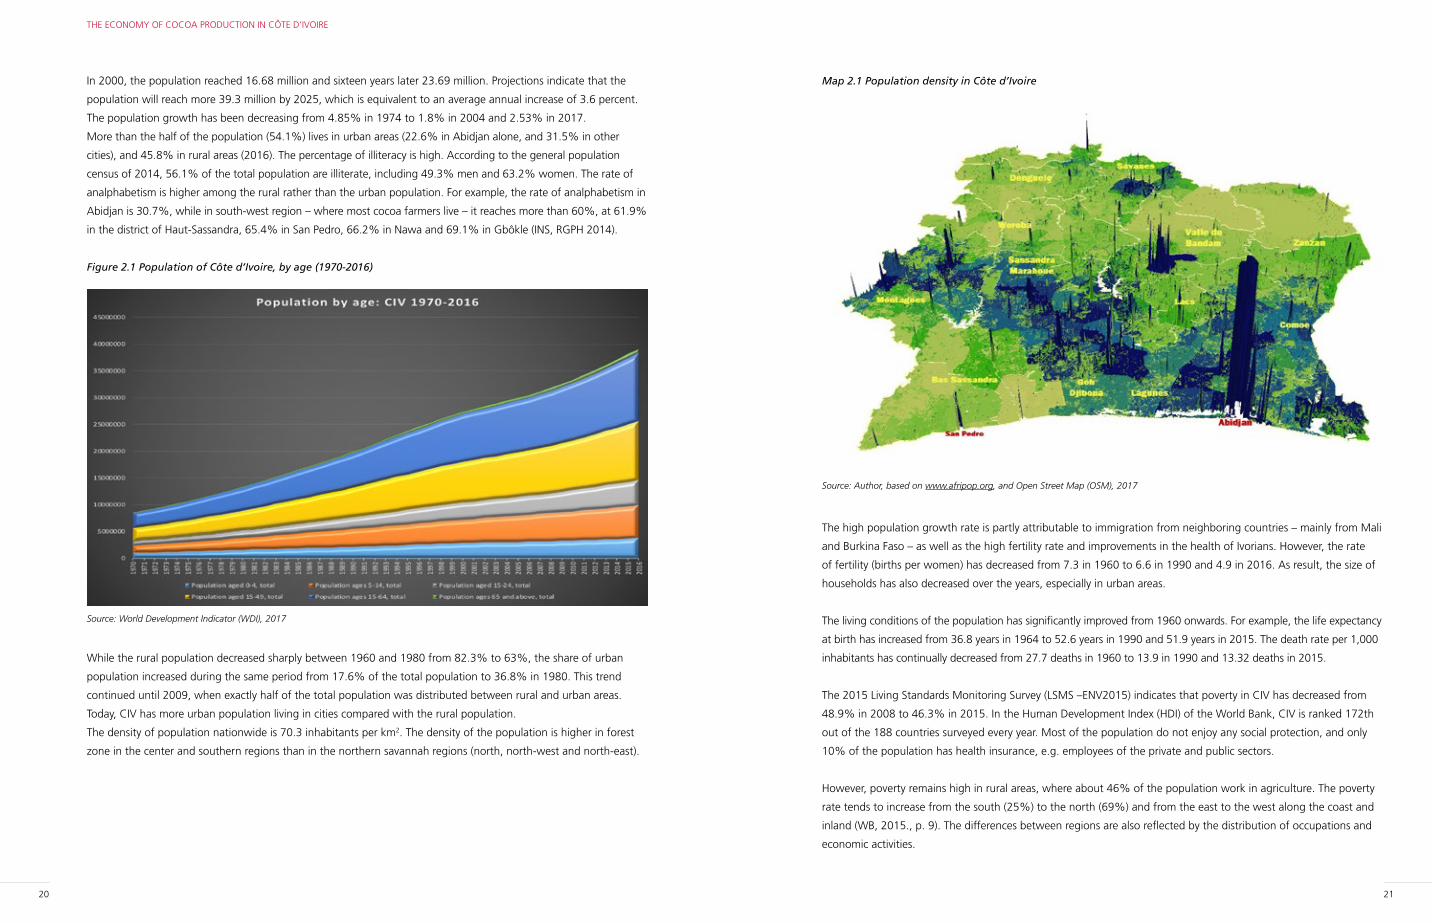
Map 2.1 Population density in Côte d’Ivoire
Source: Author, based on www.afripop.org, and Open Street Map (OSM), 2017
The high population growth rate is partly attributable to immigration from neighboring countries – mainly from Mali
and Burkina Faso – as well as the high fertility rate and improvements in the health of Ivorians. However, the rate
of fertility (births per women) has decreased from 7.3 in 1960 to 6.6 in 1990 and 4.9 in 2016. As result, the size of
households has also decreased over the years, especially in urban areas.
The living conditions of the population has significantly improved from 1960 onwards. For example, the life expectancy
at birth has increased from 36.8 years in 1964 to 52.6 years in 1990 and 51.9 years in 2015. The death rate per 1,000
inhabitants has continually decreased from 27.7 deaths in 1960 to 13.9 in 1990 and 13.32 deaths in 2015.
The 2015 Living Standards Monitoring Survey (LSMS –ENV2015) indicates that poverty in CIV has decreased from
48.9% in 2008 to 46.3% in 2015. In the Human Development Index (HDI) of the World Bank, CIV is ranked 172th
out of the 188 countries surveyed every year. Most of the population do not enjoy any social protection, and only
10% of the population has health insurance, e.g. employees of the private and public sectors.
However, poverty remains high in rural areas, where about 46% of the population work in agriculture. The poverty
rate tends to increase from the south (25%) to the north (69%) and from the east to the west along the coast and
inland (WB, 2015., p. 9). The differences between regions are also reflected by the distribution of occupations and
economic activities.
In 2000, the population reached 16.68 million and sixteen years later 23.69 million. Projections indicate that the
population will reach more 39.3 million by 2025, which is equivalent to an average annual increase of 3.6 percent.
The population growth has been decreasing from 4.85% in 1974 to 1.8% in 2004 and 2.53% in 2017.
More than the half of the population (54.1%) lives in urban areas (22.6% in Abidjan alone, and 31.5% in other
cities), and 45.8% in rural areas (2016). The percentage of illiteracy is high. According to the general population
census of 2014, 56.1% of the total population are illiterate, including 49.3% men and 63.2% women. The rate of
analphabetism is higher among the rural rather than the urban population. For example, the rate of analphabetism in
Abidjan is 30.7%, while in south-west region – where most cocoa farmers live – it reaches more than 60%, at 61.9%
in the district of Haut-Sassandra, 65.4% in San Pedro, 66.2% in Nawa and 69.1% in Gbôkle (INS, RGPH 2014).
Figure 2.1 Population of Côte d’Ivoire, by age (1970-2016)
Source: World Development Indicator (WDI), 2017
While the rural population decreased sharply between 1960 and 1980 from 82.3% to 63%, the share of urban
population increased during the same period from 17.6% of the total population to 36.8% in 1980. This trend
continued until 2009, when exactly half of the total population was distributed between rural and urban areas.
Today, CIV has more urban population living in cities compared with the rural population.
The density of population nationwide is 70.3 inhabitants per km2. The density of the population is higher in forest
zone in the center and southern regions than in the northern savannah regions (north, north-west and north-east).
22 23
THE ECONOMY OF COCOA PRODUCTION IN CÔTE D’IVOIRE
shift of 3.5% of workers moving from agriculture to services, especially to low-productivity and informal activities
in the sale and retail sector. According to the IMF (2016., p. 12), the transition of the labor force from agriculture to
industry will have to occur “via” local agri-business industries producing intermediary or derivative products, such as
the processing of cocoa and cashew, for example.
Since 2011, the government of CIV has started to pay more attention to the implementation of structural economic
and social reforms (social cohesion) aiming to improve the macro-economic environment and achieve sustainable
growth. The National Development Program (NDP) 2016-2020 was launched with the objective of improving the
well-being of the population by reducing the poverty rate and fostering cultural diversity and unity between the
population, structurally transforming the country into an industrializing nation, reinforcing the international and
regional economic integration as well as enhancing democracy and openness. The total investment of the NDP is
3 trillion FCFA. The main targeted economic sectors are agri-industry, natural resources (gas, hydro-energy, etc.),
manufacturing industry (metal, chemistry, etc.), consumption goods and light manufacturing industry. However, one
of the main weaknesses of the Ivorian economy is its strong dependence on the cocoa sector, which is very sensitive
to changes in the international markets.
2.2 MACRO-ECONOMIC DEVELOPMENT CIV is the third largest economy in West Africa – after Nigeria and Ghana – and the second most export-oriented
country in the region. The country is considered as one of the top economic performers in the region, with a
nominal GDP of about 32 billion US$ (2015) and a weighted average GDP per capita of 1,646 US$ in per capita
terms (AfDB, 2018., p. 6). However, like many West African countries, the Ivorian economy is vulnerable to external
shocks (international prices of commodities and climate conditions) due to its dependence on the agriculture
sector in terms of employment and revenues generated from exports. 64.8% of the land in the country is used
for agricultural purposes and the sector accounts for 60% of total export and contributes to 25% of GDP (2015).
Worldwide, the country is known as the world’s largest producer and exporter of cocoa beans, as well as one of the
main producers and exporters of coffee and palm oil.
During the early-1960s and 1970s, CIV financed rapid growth through excessive external borrowing and positive
terms-of-trade shocks, which later created a debt crisis (AfDB, 2018, p. 37). Furthermore, the Ivorian economy
was affected as the relative boom period of high prices of commodities came to an end during the 1980s (annual
average GDP growth in 1999-2007 was only +0.1%). Over the next two decades, as international cocoa prices
kept decreasing, GDP declined on average by 0.24% points per year, reaching 2% in 2010 and -4.2% in 2011, due
to the political crisis. After the political crisis (Côte d’Ivoire war) of 2010-11, the economy registered a spectacular
GDP growth rate, reaching 10.1% in 2010 and around 7.5-9% during the 2013-17 period (9.3% in 2013, 8.2% in
2014, 7.7% in 2015 and 2016, and 7.4% in 2017). The per capita GDP rate decreased from 7.3% in 2012 to 6.2%
in 2015 and 4.1% in 2017. The figure below shows the evolution of the real GDP growth rate between 1960 and
2017 compared with the growth rate registered by sub-Saharan Africa in the same period. CIV’s growth rate of GDP
was higher than the sub-Saharan Africa average during the 2014-17 period, which clearly points to the spectacular
economic performance of the Ivorian economy.
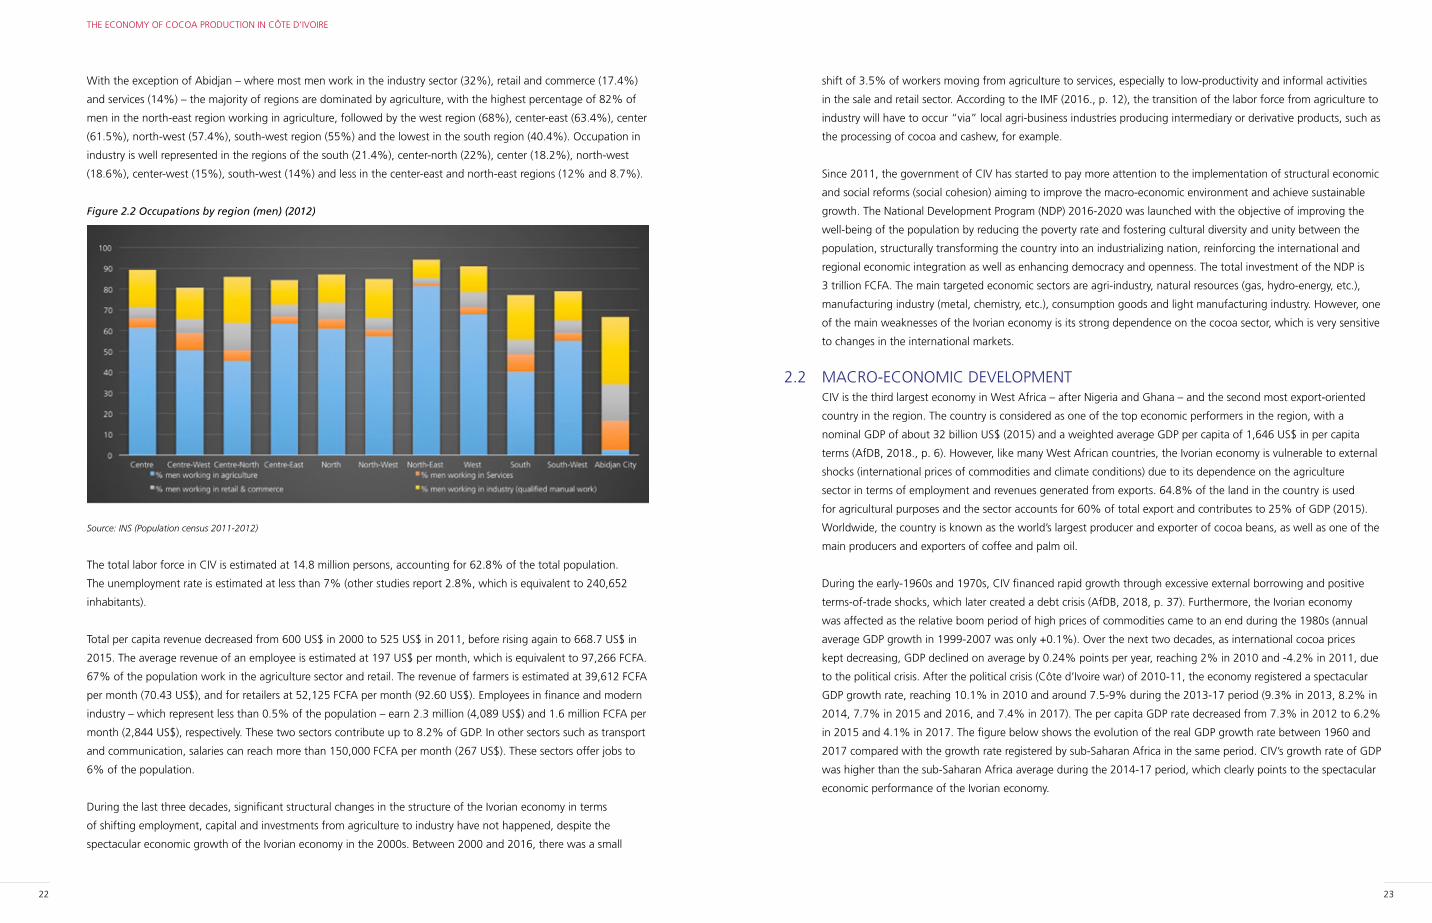
With the exception of Abidjan – where most men work in the industry sector (32%), retail and commerce (17.4%)
and services (14%) – the majority of regions are dominated by agriculture, with the highest percentage of 82% of
men in the north-east region working in agriculture, followed by the west region (68%), center-east (63.4%), center
(61.5%), north-west (57.4%), south-west region (55%) and the lowest in the south region (40.4%). Occupation in
industry is well represented in the regions of the south (21.4%), center-north (22%), center (18.2%), north-west
(18.6%), center-west (15%), south-west (14%) and less in the center-east and north-east regions (12% and 8.7%).
Figure 2.2 Occupations by region (men) (2012)
Source: INS (Population census 2011-2012)
The total labor force in CIV is estimated at 14.8 million persons, accounting for 62.8% of the total population.
The unemployment rate is estimated at less than 7% (other studies report 2.8%, which is equivalent to 240,652
inhabitants).
Total per capita revenue decreased from 600 US$ in 2000 to 525 US$ in 2011, before rising again to 668.7 US$ in
2015. The average revenue of an employee is estimated at 197 US$ per month, which is equivalent to 97,266 FCFA.
67% of the population work in the agriculture sector and retail. The revenue of farmers is estimated at 39,612 FCFA
per month (70.43 US$), and for retailers at 52,125 FCFA per month (92.60 US$). Employees in finance and modern
industry – which represent less than 0.5% of the population – earn 2.3 million (4,089 US$) and 1.6 million FCFA per
month (2,844 US$), respectively. These two sectors contribute up to 8.2% of GDP. In other sectors such as transport
and communication, salaries can reach more than 150,000 FCFA per month (267 US$). These sectors offer jobs to
6% of the population.
During the last three decades, significant structural changes in the structure of the Ivorian economy in terms
of shifting employment, capital and investments from agriculture to industry have not happened, despite the
spectacular economic growth of the Ivorian economy in the 2000s. Between 2000 and 2016, there was a small
24 25
THE ECONOMY OF COCOA PRODUCTION IN CÔTE D’IVOIRE
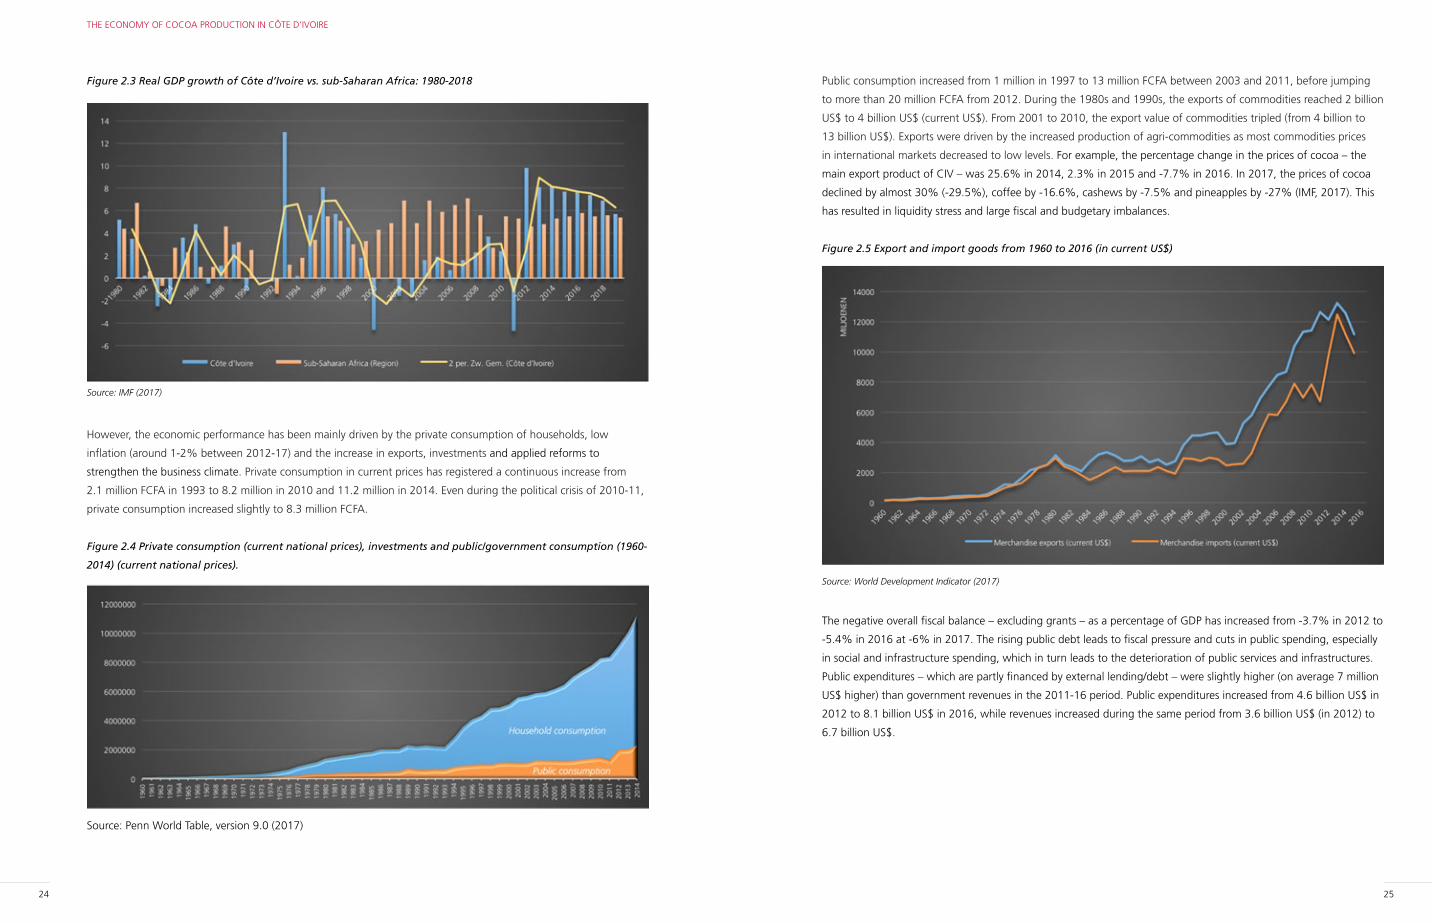
Public consumption increased from 1 million in 1997 to 13 million FCFA between 2003 and 2011, before jumping
to more than 20 million FCFA from 2012. During the 1980s and 1990s, the exports of commodities reached 2 billion
US$ to 4 billion US$ (current US$). From 2001 to 2010, the export value of commodities tripled (from 4 billion to
13 billion US$). Exports were driven by the increased production of agri-commodities as most commodities prices
in international markets decreased to low levels. For example, the percentage change in the prices of cocoa – the
main export product of CIV – was 25.6% in 2014, 2.3% in 2015 and -7.7% in 2016. In 2017, the prices of cocoa
declined by almost 30% (-29.5%), coffee by -16.6%, cashews by -7.5% and pineapples by -27% (IMF, 2017). This
has resulted in liquidity stress and large fiscal and budgetary imbalances.
Figure 2.5 Export and import goods from 1960 to 2016 (in current US$)
Source: World Development Indicator (2017)
The negative overall fiscal balance – excluding grants – as a percentage of GDP has increased from -3.7% in 2012 to
-5.4% in 2016 at -6% in 2017. The rising public debt leads to fiscal pressure and cuts in public spending, especially
in social and infrastructure spending, which in turn leads to the deterioration of public services and infrastructures.
Public expenditures – which are partly financed by external lending/debt – were slightly higher (on average 7 million
US$ higher) than government revenues in the 2011-16 period. Public expenditures increased from 4.6 billion US$ in
2012 to 8.1 billion US$ in 2016, while revenues increased during the same period from 3.6 billion US$ (in 2012) to
6.7 billion US$.
Figure 2.3 Real GDP growth of Côte d’Ivoire vs. sub-Saharan Africa: 1980-2018
Source: IMF (2017)
However, the economic performance has been mainly driven by the private consumption of households, low
inflation (around 1-2% between 2012-17) and the increase in exports, investments and applied reforms to
strengthen the business climate. Private consumption in current prices has registered a continuous increase from
2.1 million FCFA in 1993 to 8.2 million in 2010 and 11.2 million in 2014. Even during the political crisis of 2010-11,
private consumption increased slightly to 8.3 million FCFA.
Figure 2.4 Private consumption (current national prices), investments and public/government consumption (1960-
2014) (current national prices).
Source: Penn World Table, version 9.0 (2017)
26 27
THE ECONOMY OF COCOA PRODUCTION IN CÔTE D’IVOIRE
by international firms. However, these large firms contribute 80% of value added and 80% of employment in the
industry sector. The industry sector represents about 5.2% of total employment, while the services sector offers jobs
to about 22% of the total population, of which 11% are in commercial activities (retail, hotel and restaurants), 7% in
post and telecommunications, 3.8% in transport and 3.4% in the banking and finance sector (Deloitte, 2017., p. 7).
Nevertheless, the agriculture sector still dominates the Ivorian economy in terms of employment (70% of total jobs).
The informal sector remains the most important source of employment, with almost 70% of jobs and an estimated
share of 30% of GDP (AfDB, 2017., p. 44). The high number of jobs in the informal sector masks the structural
weakness of the economy and the persistence of structural problems of development that characterize developing
countries, e.g. poverty, unemployment, social problems, precarious unprotected jobs, high inequality, etc. Without
informal jobs, the level and rate of unemployment would remain very high.
Figure 2.7 Repartition of firms by sector, 2012
Source: INS (2012)
The services sector is the main contributor to the Ivorian economy in terms of value added, with more than 35 billion
US$, followed by the industry sector (21 billion US$), manufacturing industry (14 billion US$) and agriculture with a
modest contribution of 9 billion US$. The share in value added of these sectors has followed the same growth trend
from 1980, with a faster growth in services and industry compared with manufacturing and agriculture.
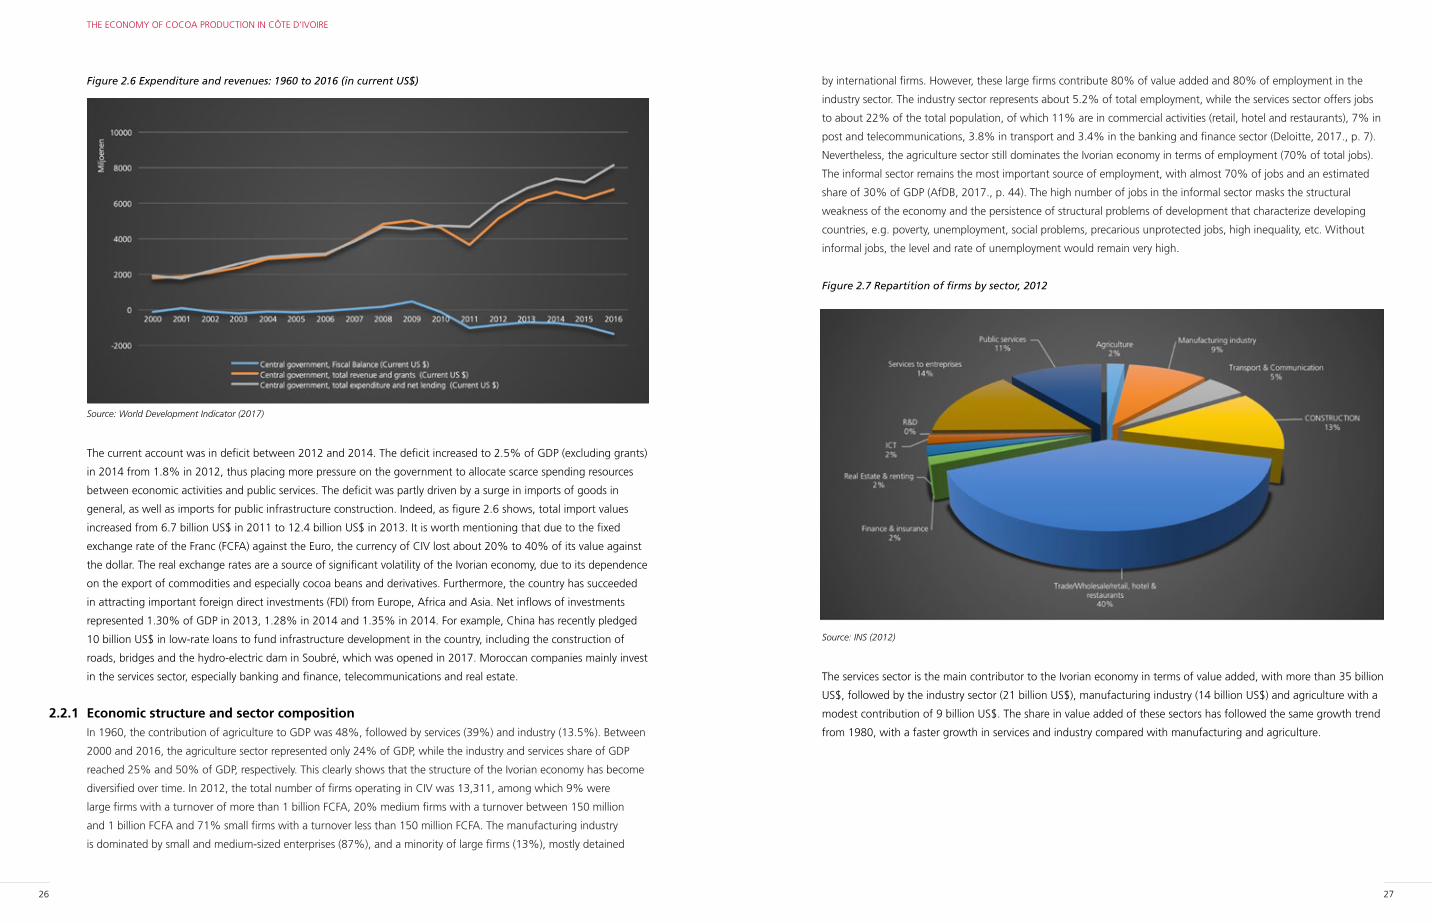
Figure 2.6 Expenditure and revenues: 1960 to 2016 (in current US$)
Source: World Development Indicator (2017)
The current account was in deficit between 2012 and 2014. The deficit increased to 2.5% of GDP (excluding grants)
in 2014 from 1.8% in 2012, thus placing more pressure on the government to allocate scarce spending resources
between economic activities and public services. The deficit was partly driven by a surge in imports of goods in
general, as well as imports for public infrastructure construction. Indeed, as figure 2.6 shows, total import values
increased from 6.7 billion US$ in 2011 to 12.4 billion US$ in 2013. It is worth mentioning that due to the fixed
exchange rate of the Franc (FCFA) against the Euro, the currency of CIV lost about 20% to 40% of its value against
the dollar. The real exchange rates are a source of significant volatility of the Ivorian economy, due to its dependence
on the export of commodities and especially cocoa beans and derivatives. Furthermore, the country has succeeded
in attracting important foreign direct investments (FDI) from Europe, Africa and Asia. Net inflows of investments
represented 1.30% of GDP in 2013, 1.28% in 2014 and 1.35% in 2014. For example, China has recently pledged
10 billion US$ in low-rate loans to fund infrastructure development in the country, including the construction of
roads, bridges and the hydro-electric dam in Soubré, which was opened in 2017. Moroccan companies mainly invest
in the services sector, especially banking and finance, telecommunications and real estate.
2.2.1 Economic structure and sector compositionIn 1960, the contribution of agriculture to GDP was 48%, followed by services (39%) and industry (13.5%). Between
2000 and 2016, the agriculture sector represented only 24% of GDP, while the industry and services share of GDP
reached 25% and 50% of GDP, respectively. This clearly shows that the structure of the Ivorian economy has become
diversified over time. In 2012, the total number of firms operating in CIV was 13,311, among which 9% were
large firms with a turnover of more than 1 billion FCFA, 20% medium firms with a turnover between 150 million
and 1 billion FCFA and 71% small firms with a turnover less than 150 million FCFA. The manufacturing industry
is dominated by small and medium-sized enterprises (87%), and a minority of large firms (13%), mostly detained
28 29
THE ECONOMY OF COCOA PRODUCTION IN CÔTE D’IVOIRE
vulnerable to cocoa price changes, pests and diseases and the effects of weather and climate change (Camargo
and Nhantumbo, 2016, p.26). Worldwide, the average yields of cocoa between 1961 and 2014 show an increase
from 269 kg/ha in 1960 to 496 kg/ha in 1997, reaching the highest level of 505 kg/ha in 2005 before falling to 435
kg/ha in 2015. However, the average yields vary between continents, regions and within regions. They are around
between 300 and 600 kg/ha in Africa and the Americas and around 500 and 700 kg/ha in Asia (FAO 2014). More
generally, the low cocoa yields can be attributed to various factors such as the declining fertility of soil, pests and
diseases, low levels of fertilization and the genetic and type of cocoa trees planted by farmers.
Despite the low level of yields, the world cocoa production has increased during the 2000-16 period at an average
annual growth rate of 2.5%, due to the increase in demand of approximately 3% per year.
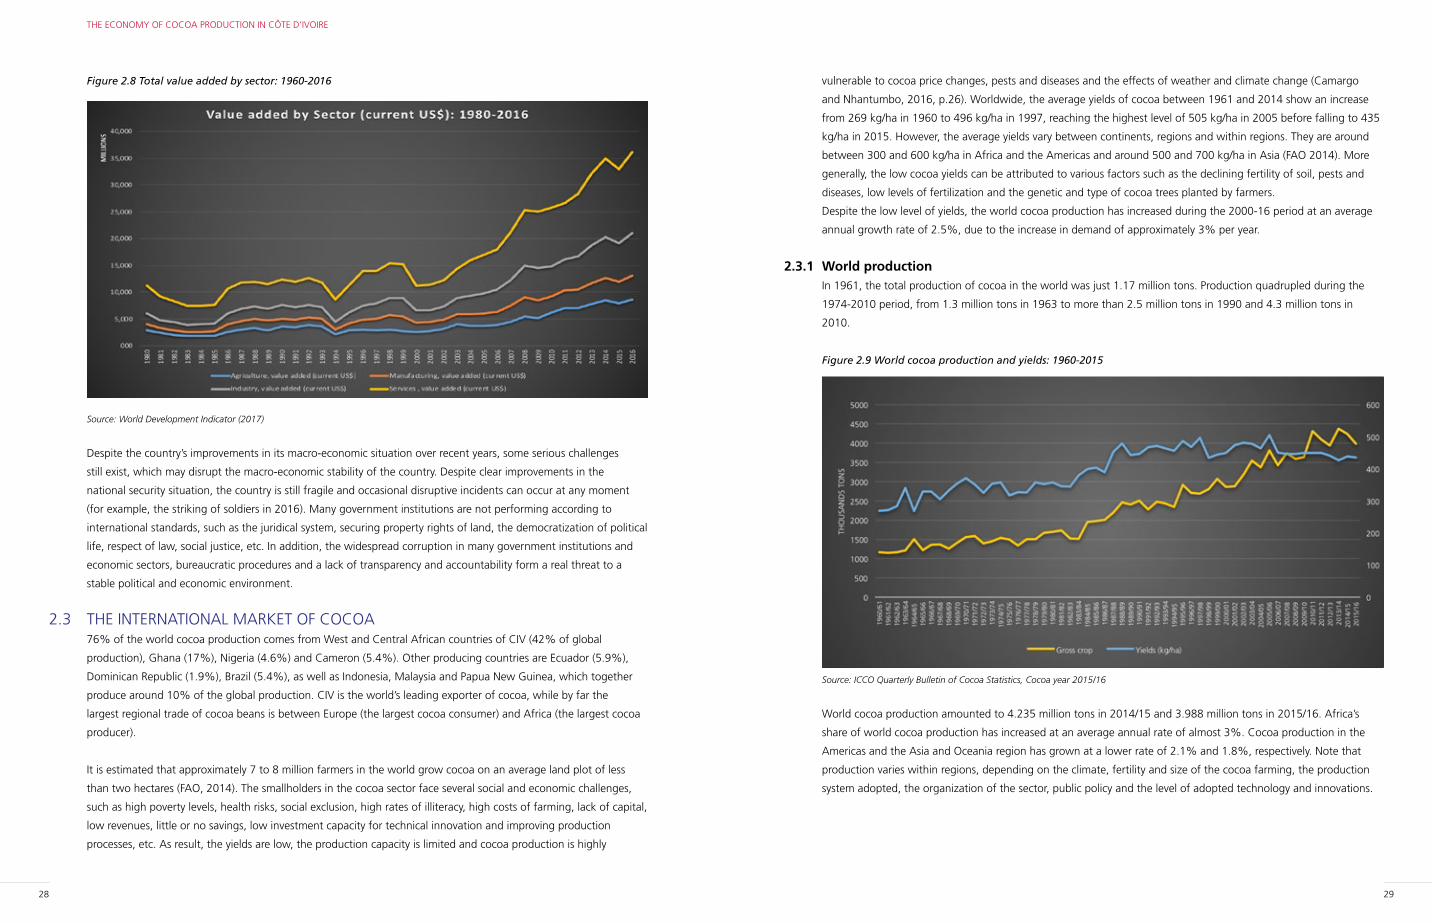
2.3.1 World production In 1961, the total production of cocoa in the world was just 1.17 million tons. Production quadrupled during the
1974-2010 period, from 1.3 million tons in 1963 to more than 2.5 million tons in 1990 and 4.3 million tons in
2010.
Figure 2.9 World cocoa production and yields: 1960-2015
Source: ICCO Quarterly Bulletin of Cocoa Statistics, Cocoa year 2015/16
World cocoa production amounted to 4.235 million tons in 2014/15 and 3.988 million tons in 2015/16. Africa’s
share of world cocoa production has increased at an average annual rate of almost 3%. Cocoa production in the
Americas and the Asia and Oceania region has grown at a lower rate of 2.1% and 1.8%, respectively. Note that
production varies within regions, depending on the climate, fertility and size of the cocoa farming, the production
system adopted, the organization of the sector, public policy and the level of adopted technology and innovations.
Figure 2.8 Total value added by sector: 1960-2016
Source: World Development Indicator (2017)
Despite the country’s improvements in its macro-economic situation over recent years, some serious challenges
still exist, which may disrupt the macro-economic stability of the country. Despite clear improvements in the
national security situation, the country is still fragile and occasional disruptive incidents can occur at any moment
(for example, the striking of soldiers in 2016). Many government institutions are not performing according to
international standards, such as the juridical system, securing property rights of land, the democratization of political
life, respect of law, social justice, etc. In addition, the widespread corruption in many government institutions and
economic sectors, bureaucratic procedures and a lack of transparency and accountability form a real threat to a
stable political and economic environment.
2.3 THE INTERNATIONAL MARKET OF COCOA76% of the world cocoa production comes from West and Central African countries of CIV (42% of global
production), Ghana (17%), Nigeria (4.6%) and Cameron (5.4%). Other producing countries are Ecuador (5.9%),
Dominican Republic (1.9%), Brazil (5.4%), as well as Indonesia, Malaysia and Papua New Guinea, which together
produce around 10% of the global production. CIV is the world’s leading exporter of cocoa, while by far the
largest regional trade of cocoa beans is between Europe (the largest cocoa consumer) and Africa (the largest cocoa
producer).
It is estimated that approximately 7 to 8 million farmers in the world grow cocoa on an average land plot of less
than two hectares (FAO, 2014). The smallholders in the cocoa sector face several social and economic challenges,
such as high poverty levels, health risks, social exclusion, high rates of illiteracy, high costs of farming, lack of capital,
low revenues, little or no savings, low investment capacity for technical innovation and improving production
processes, etc. As result, the yields are low, the production capacity is limited and cocoa production is highly
30 31
THE ECONOMY OF COCOA PRODUCTION IN CÔTE D’IVOIRE
factors, the spread of diseases, political unrest and environmental impacts affecting the cultivation of cocoa. Other
factors such as the low use of fertilizers and fungicides in cocoa farming, low investment and the age of cocoa trees
can slow down the growth of cocoa production.
Some observers of the cocoa market suggest that it has entered a period of falling prices, leading to poverty traps
and stagnation because the reduction of incomes pushes farmers to reduce inputs and production costs, with
resulting low yields, lower revenues, fewer expenses and hence increased poverty and impoverishment of cocoa
farmers.
2.3.2 Grinding, production and stocksThe production and export of cocoa are closely dependent on the global demand from the international processing
factories that process derivative cocoa products (cocoa paste/liquor, cocoa butter, cocoa cake and cocoa powder)
into chocolate products. During the 1990s and 2000s, the processing industry profited from the low prices of cocoa
beans, an excess of supply over demand and the high prices of cocoa derivatives such as cocoa butter. However,
since the financial crisis of 2008, the cocoa processing industry has been confronted by a steady increase in the price
of cocoa beans and a decrease in demand for cocoa derivative products. Consequently, the processing of cocoa has
slowed down, with the resulting decline in demand for cocoa beans by the cocoa industry.
Europe remains the largest processor of cocoa in the world. Most international processing companies that produce
chocolate products are in Europe and the US, with the Netherlands being the world’s leading cocoa processing
country. 37% of the world cocoa production is processed in Europe, 22% in America, 21% in Asia and Oceania and
20% in Africa.
While Europe remains by far the largest cocoa processing region, a large share of cocoa is processed in the
countries of origin by international companies. The expansion of cocoa processing factories in countries of origin
has been facilitated by the increasing vertical integration of the international manufacturers of cocoa, the possibility
of processing large volume of cocoa, low labor and transport costs and domestic subsidization of processing
companies through fiscal policies in the countries of origin.
The Netherlands remains the largest processor country of cocoa, with 520,000 tons processed in 2015-16, while CIV
reached 510,000 tons in the same year and Germany and US processed 440,000 and 410,000 tons, respectively.
The striking feature is the increasing share of Ghana, which has surpassed Malaysia and almost reached the same
level of grinding as Brazil. The second feature is the rapid increase in the processing industry in Germany during the
last decade, taking over the position of the US as the second world grinding country. According to the International
Cocoa Organization (ICO), in the past decade grinding capacity has grown by 50% in CIV, 250% in Ghana, 240%
in Indonesia and 40% in Malaysia.
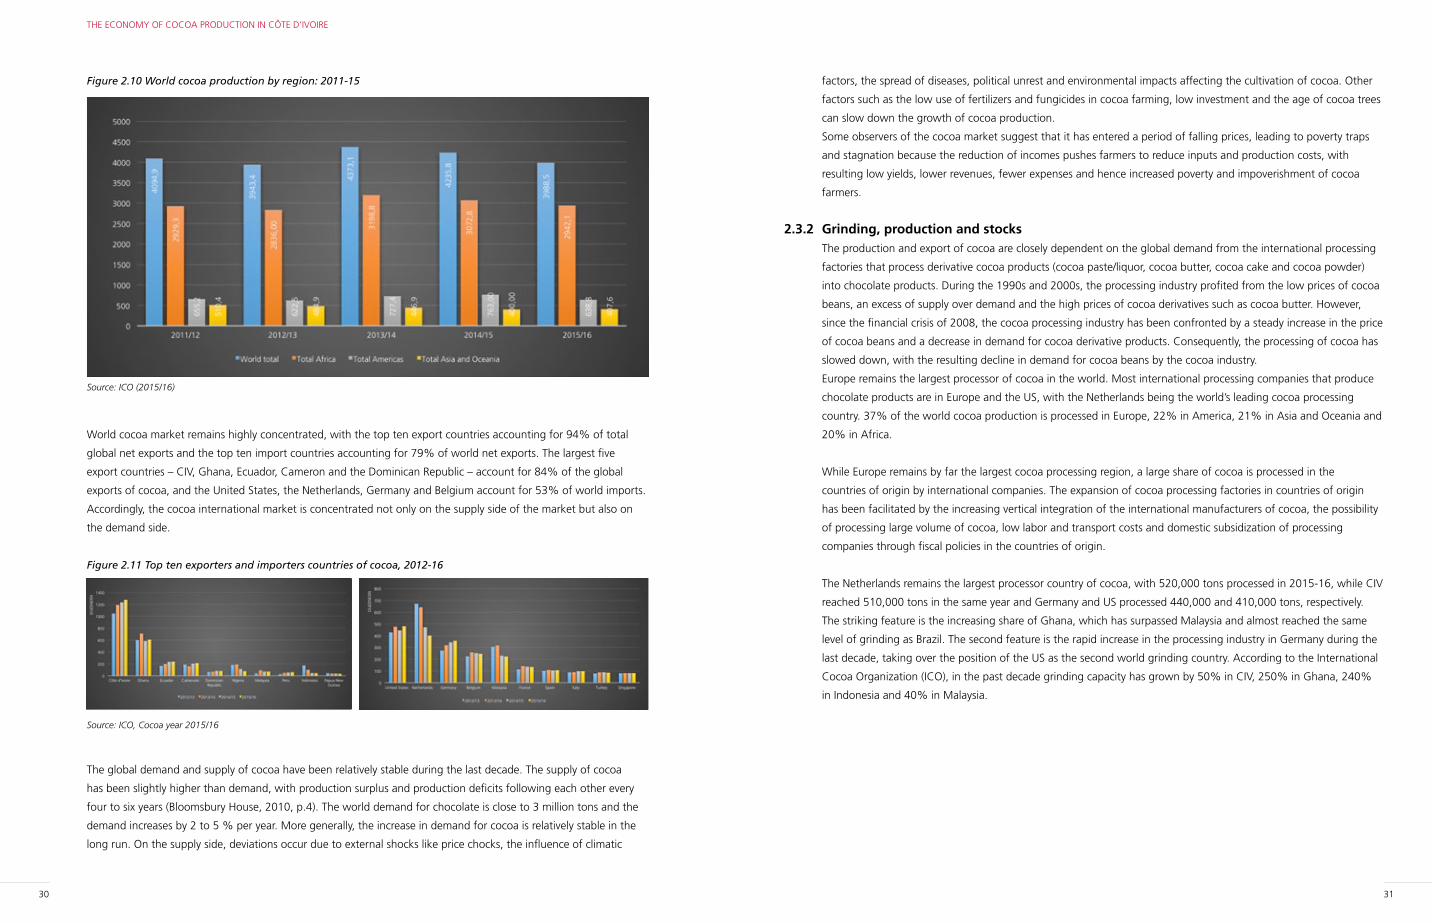
Figure 2.10 World cocoa production by region: 2011-15
Source: ICO (2015/16)
World cocoa market remains highly concentrated, with the top ten export countries accounting for 94% of total
global net exports and the top ten import countries accounting for 79% of world net exports. The largest five
export countries – CIV, Ghana, Ecuador, Cameron and the Dominican Republic – account for 84% of the global
exports of cocoa, and the United States, the Netherlands, Germany and Belgium account for 53% of world imports.
Accordingly, the cocoa international market is concentrated not only on the supply side of the market but also on
the demand side.
Figure 2.11 Top ten exporters and importers countries of cocoa, 2012-16
Source: ICO, Cocoa year 2015/16
The global demand and supply of cocoa have been relatively stable during the last decade. The supply of cocoa
has been slightly higher than demand, with production surplus and production deficits following each other every
four to six years (Bloomsbury House, 2010, p.4). The world demand for chocolate is close to 3 million tons and the
demand increases by 2 to 5 % per year. More generally, the increase in demand for cocoa is relatively stable in the
long run. On the supply side, deviations occur due to external shocks like price chocks, the influence of climatic
32 33
THE ECONOMY OF COCOA PRODUCTION IN CÔTE D’IVOIRE
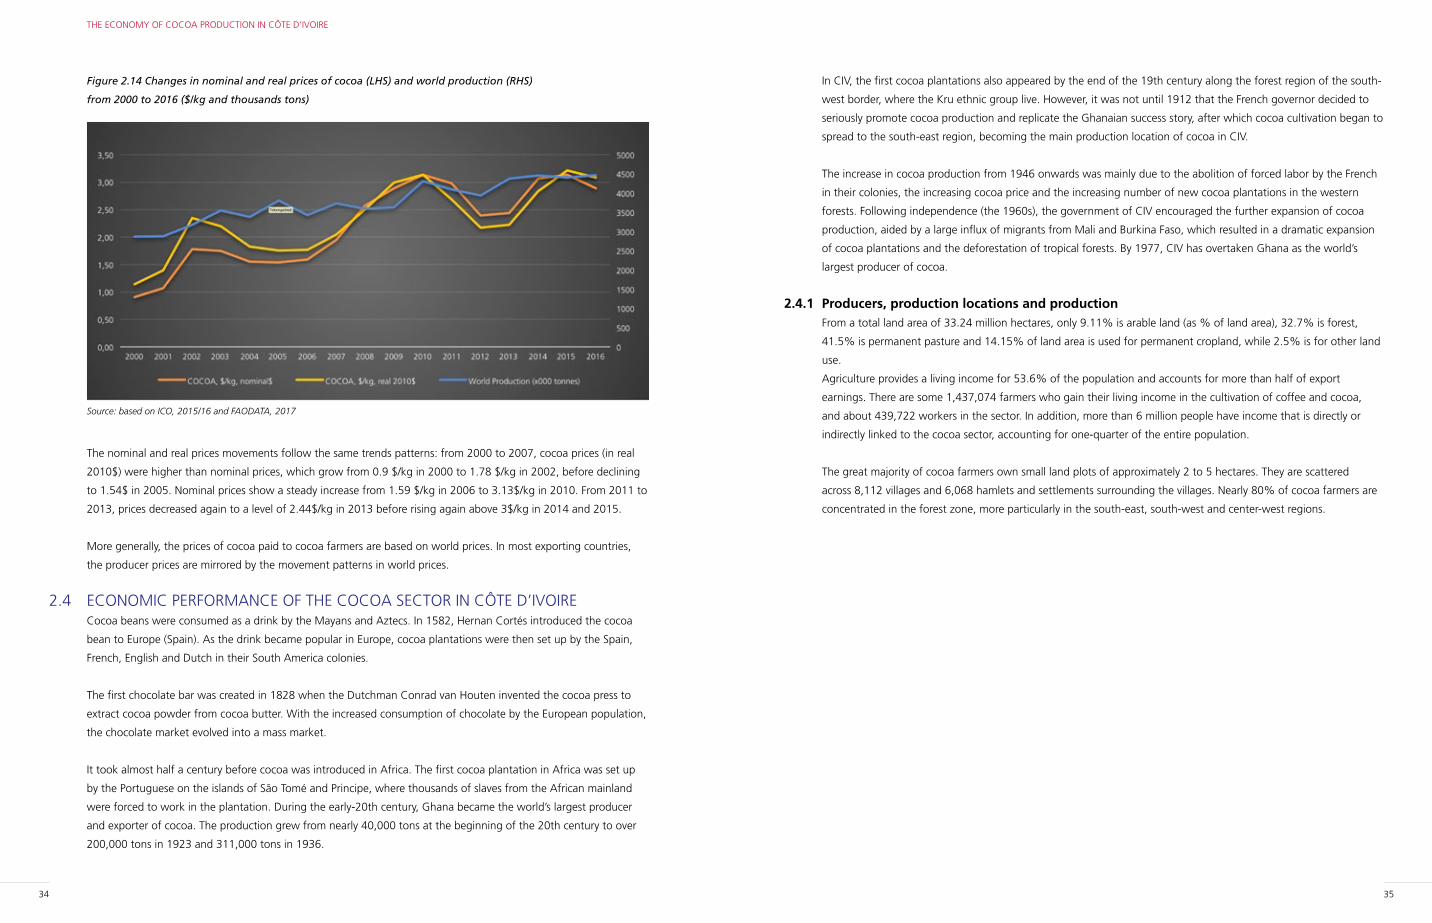
Figure 2.13 Top ten grinding, production and stocks: 2006-16 (thousand tons)
Source: based on ICO, 2015/16
2.3.3 International prices of cocoaWhile Europe remains by far the largest cocoa processing region, a large share of cocoa is processed in the countries
of origin by international companies, etc. It is believed that on average a 1% increase in the stock/grinding ratio
is associated with a price decline of 3% (Bloomsbury House, 2010, p.6). Other factors such as the financial crisis,
fluctuations in the exchange rate of currencies, the low rate of global economic growth, delayed transport of cocoa
to the port, limited producer selling, the expectation of higher stockpiles and demand forecasts among processors
can drive the prices of cocoa up or down. Beside these factors, cocoa prices are determined by cocoa beans traded
at the two world exchange markets for commodities – the London (NYSE Life-GBP) and New York (ICE-USD)
exchange markets – where the cocoa futures contracts are handled. The contracts – each for 10 metric tons – serve
as benchmark global price quotes for cocoa and are traded for the delivery of cocoa beans in March, May, July,
September and December. Short-term volatility in cocoa prices can be influenced by speculations on the trade of
future contracts in the stock markets.
Figure 2.12 Top ten grinding countries of cocoa in the world: 2011-15
Source: ICO (2015/16)
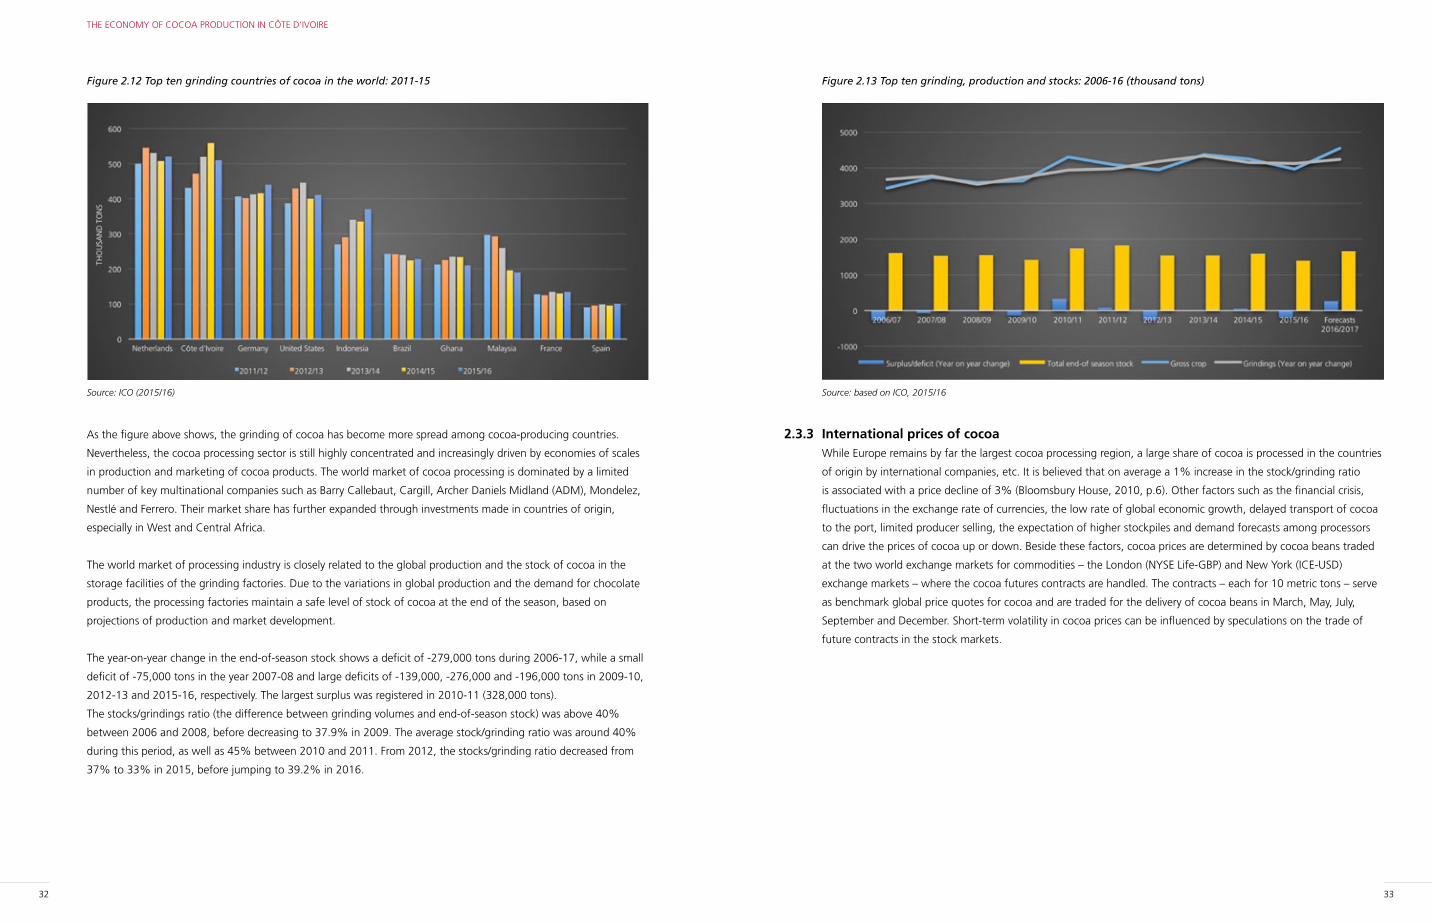
As the figure above shows, the grinding of cocoa has become more spread among cocoa-producing countries.
Nevertheless, the cocoa processing sector is still highly concentrated and increasingly driven by economies of scales
in production and marketing of cocoa products. The world market of cocoa processing is dominated by a limited
number of key multinational companies such as Barry Callebaut, Cargill, Archer Daniels Midland (ADM), Mondelez,
Nestlé and Ferrero. Their market share has further expanded through investments made in countries of origin,
especially in West and Central Africa.
The world market of processing industry is closely related to the global production and the stock of cocoa in the
storage facilities of the grinding factories. Due to the variations in global production and the demand for chocolate
products, the processing factories maintain a safe level of stock of cocoa at the end of the season, based on
projections of production and market development.
The year-on-year change in the end-of-season stock shows a deficit of -279,000 tons during 2006-17, while a small
deficit of -75,000 tons in the year 2007-08 and large deficits of -139,000, -276,000 and -196,000 tons in 2009-10,
2012-13 and 2015-16, respectively. The largest surplus was registered in 2010-11 (328,000 tons).
The stocks/grindings ratio (the difference between grinding volumes and end-of-season stock) was above 40%
between 2006 and 2008, before decreasing to 37.9% in 2009. The average stock/grinding ratio was around 40%
during this period, as well as 45% between 2010 and 2011. From 2012, the stocks/grinding ratio decreased from
37% to 33% in 2015, before jumping to 39.2% in 2016.
34 35
THE ECONOMY OF COCOA PRODUCTION IN CÔTE D’IVOIRE
In CIV, the first cocoa plantations also appeared by the end of the 19th century along the forest region of the south-
west border, where the Kru ethnic group live. However, it was not until 1912 that the French governor decided to
seriously promote cocoa production and replicate the Ghanaian success story, after which cocoa cultivation began to
spread to the south-east region, becoming the main production location of cocoa in CIV.
The increase in cocoa production from 1946 onwards was mainly due to the abolition of forced labor by the French
in their colonies, the increasing cocoa price and the increasing number of new cocoa plantations in the western
forests. Following independence (the 1960s), the government of CIV encouraged the further expansion of cocoa
production, aided by a large influx of migrants from Mali and Burkina Faso, which resulted in a dramatic expansion
of cocoa plantations and the deforestation of tropical forests. By 1977, CIV has overtaken Ghana as the world’s
largest producer of cocoa.
2.4.1 Producers, production locations and productionFrom a total land area of 33.24 million hectares, only 9.11% is arable land (as % of land area), 32.7% is forest,
41.5% is permanent pasture and 14.15% of land area is used for permanent cropland, while 2.5% is for other land
use.
Agriculture provides a living income for 53.6% of the population and accounts for more than half of export
earnings. There are some 1,437,074 farmers who gain their living income in the cultivation of coffee and cocoa,
and about 439,722 workers in the sector. In addition, more than 6 million people have income that is directly or
indirectly linked to the cocoa sector, accounting for one-quarter of the entire population.
The great majority of cocoa farmers own small land plots of approximately 2 to 5 hectares. They are scattered
across 8,112 villages and 6,068 hamlets and settlements surrounding the villages. Nearly 80% of cocoa farmers are
concentrated in the forest zone, more particularly in the south-east, south-west and center-west regions.
Figure 2.14 Changes in nominal and real prices of cocoa (LHS) and world production (RHS)
from 2000 to 2016 ($/kg and thousands tons)
Source: based on ICO, 2015/16 and FAODATA, 2017
The nominal and real prices movements follow the same trends patterns: from 2000 to 2007, cocoa prices (in real
2010$) were higher than nominal prices, which grow from 0.9 $/kg in 2000 to 1.78 $/kg in 2002, before declining
to 1.54$ in 2005. Nominal prices show a steady increase from 1.59 $/kg in 2006 to 3.13$/kg in 2010. From 2011 to
2013, prices decreased again to a level of 2.44$/kg in 2013 before rising again above 3$/kg in 2014 and 2015.
More generally, the prices of cocoa paid to cocoa farmers are based on world prices. In most exporting countries,
the producer prices are mirrored by the movement patterns in world prices.
2.4 ECONOMIC PERFORMANCE OF THE COCOA SECTOR IN CÔTE D’IVOIRE Cocoa beans were consumed as a drink by the Mayans and Aztecs. In 1582, Hernan Cortés introduced the cocoa
bean to Europe (Spain). As the drink became popular in Europe, cocoa plantations were then set up by the Spain,
French, English and Dutch in their South America colonies.
The first chocolate bar was created in 1828 when the Dutchman Conrad van Houten invented the cocoa press to
extract cocoa powder from cocoa butter. With the increased consumption of chocolate by the European population,
the chocolate market evolved into a mass market.
It took almost half a century before cocoa was introduced in Africa. The first cocoa plantation in Africa was set up
by the Portuguese on the islands of São Tomé and Principe, where thousands of slaves from the African mainland
were forced to work in the plantation. During the early-20th century, Ghana became the world’s largest producer
and exporter of cocoa. The production grew from nearly 40,000 tons at the beginning of the 20th century to over
200,000 tons in 1923 and 311,000 tons in 1936.
36 37
THE ECONOMY OF COCOA PRODUCTION IN CÔTE D’IVOIRE
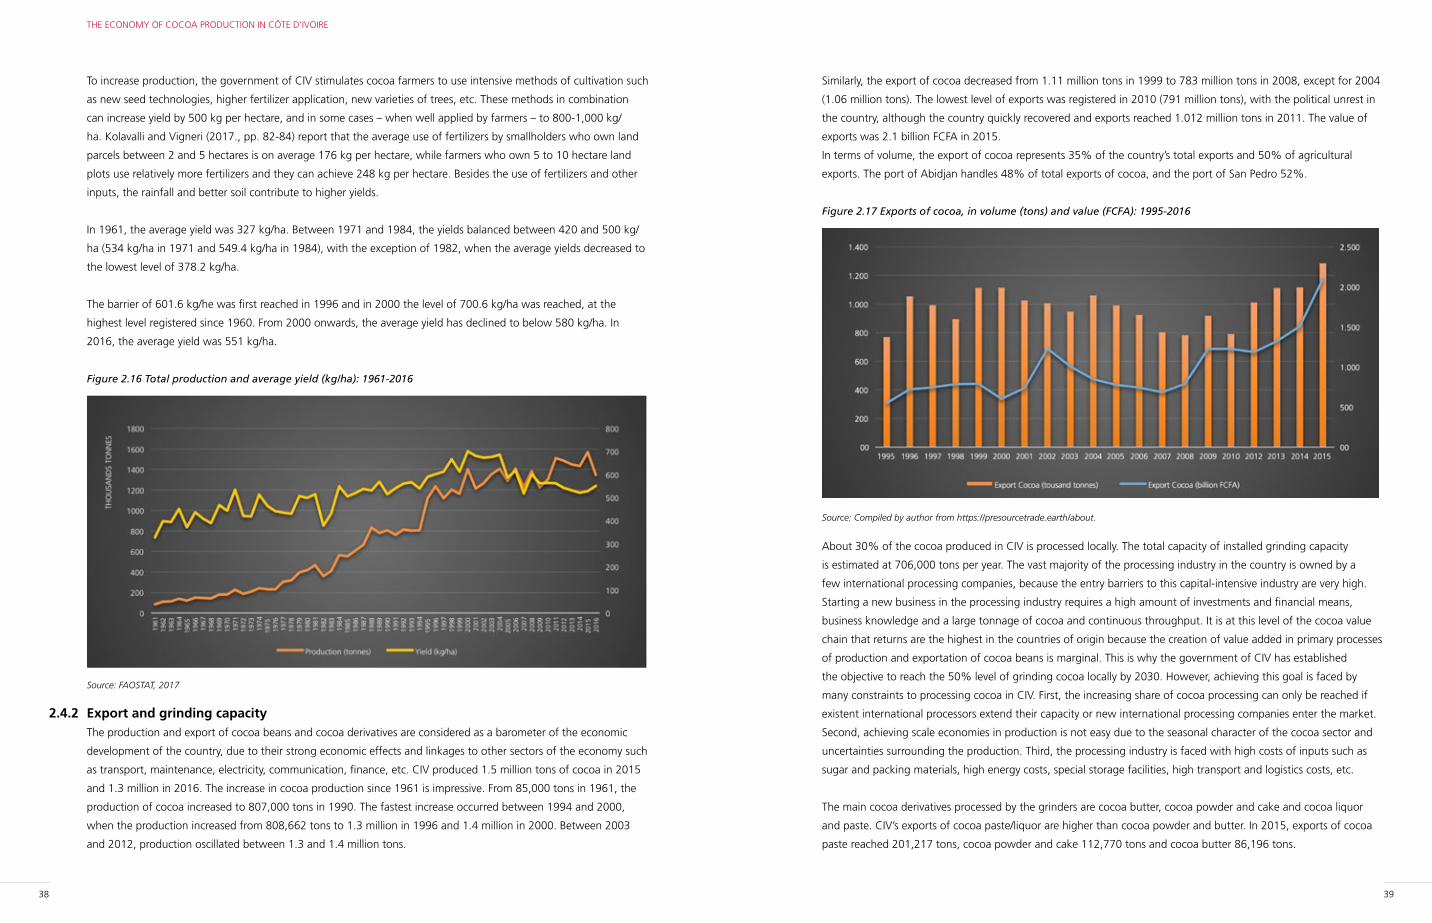
Figure 2.15 Total farmers and workers in the cocoa-coffee sector, by region (2014)
Source: INS, RGPH2014, 2014.
The cultivation of cocoa is labor-intensive. It is estimated that on average 178 person-days are required for the
major tasks associated with cocoa production for a representative grower producing between 940 kg and 1.2 tons
(Kolavalli and Vigneri, 2017, p.77). During the busiest months from August to November, the farmers spend on
average 34 hours per week maintaining their cocoa farm. During the less busy months (January-May), they spend
fewer hours per week (on average 15 hours) on their farm. Most of the work is done by the farmers and their family
members and relatives. Due to low revenues, they are unable to hire external labor force for a long time. Therefore,
the share of workers in the cocoa sector is low.
The average yield of cocoa farmers in CIV is between 450 and 550 kg per hectare. It is argued that the low yields
can be explained by the spread of diseases, the low use of pesticides and fertilizers as well as the relatively old age
of cocoa trees in the cocoa sector (more than 17 years).
However, there are some variations between farmers in different regions and within regions themselves. For
example, some certified cocoa farmers can reach higher yields than non-certified farmers (between 600 and 800
kg/ha), because they are trained on how to apply efficient methods and techniques of cocoa cultivation and they
receive relatively more technical support from their contractors than other farmers.
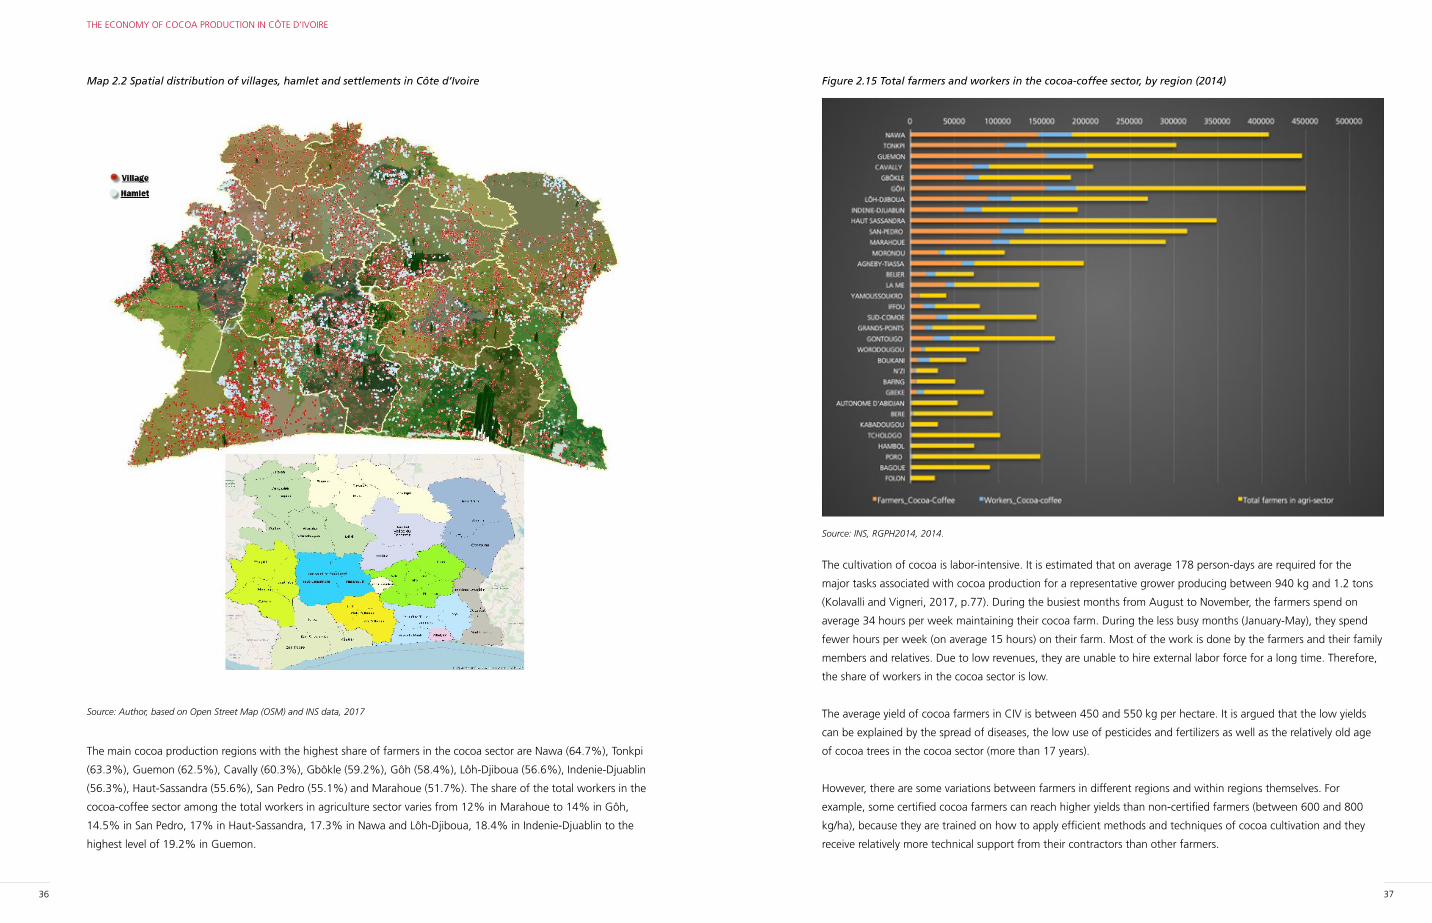
Map 2.2 Spatial distribution of villages, hamlet and settlements in Côte d’Ivoire
Source: Author, based on Open Street Map (OSM) and INS data, 2017
The main cocoa production regions with the highest share of farmers in the cocoa sector are Nawa (64.7%), Tonkpi
(63.3%), Guemon (62.5%), Cavally (60.3%), Gbôkle (59.2%), Gôh (58.4%), Lôh-Djiboua (56.6%), Indenie-Djuablin
(56.3%), Haut-Sassandra (55.6%), San Pedro (55.1%) and Marahoue (51.7%). The share of the total workers in the
cocoa-coffee sector among the total workers in agriculture sector varies from 12% in Marahoue to 14% in Gôh,
14.5% in San Pedro, 17% in Haut-Sassandra, 17.3% in Nawa and Lôh-Djiboua, 18.4% in Indenie-Djuablin to the
highest level of 19.2% in Guemon.
38 39
THE ECONOMY OF COCOA PRODUCTION IN CÔTE D’IVOIRE
Similarly, the export of cocoa decreased from 1.11 million tons in 1999 to 783 million tons in 2008, except for 2004
(1.06 million tons). The lowest level of exports was registered in 2010 (791 million tons), with the political unrest in
the country, although the country quickly recovered and exports reached 1.012 million tons in 2011. The value of
exports was 2.1 billion FCFA in 2015.
In terms of volume, the export of cocoa represents 35% of the country’s total exports and 50% of agricultural
exports. The port of Abidjan handles 48% of total exports of cocoa, and the port of San Pedro 52%.
Figure 2.17 Exports of cocoa, in volume (tons) and value (FCFA): 1995-2016
Source: Compiled by author from https://presourcetrade.earth/about.
About 30% of the cocoa produced in CIV is processed locally. The total capacity of installed grinding capacity
is estimated at 706,000 tons per year. The vast majority of the processing industry in the country is owned by a
few international processing companies, because the entry barriers to this capital-intensive industry are very high.
Starting a new business in the processing industry requires a high amount of investments and financial means,
business knowledge and a large tonnage of cocoa and continuous throughput. It is at this level of the cocoa value
chain that returns are the highest in the countries of origin because the creation of value added in primary processes
of production and exportation of cocoa beans is marginal. This is why the government of CIV has established
the objective to reach the 50% level of grinding cocoa locally by 2030. However, achieving this goal is faced by
many constraints to processing cocoa in CIV. First, the increasing share of cocoa processing can only be reached if
existent international processors extend their capacity or new international processing companies enter the market.
Second, achieving scale economies in production is not easy due to the seasonal character of the cocoa sector and
uncertainties surrounding the production. Third, the processing industry is faced with high costs of inputs such as
sugar and packing materials, high energy costs, special storage facilities, high transport and logistics costs, etc.
The main cocoa derivatives processed by the grinders are cocoa butter, cocoa powder and cake and cocoa liquor
and paste. CIV’s exports of cocoa paste/liquor are higher than cocoa powder and butter. In 2015, exports of cocoa
paste reached 201,217 tons, cocoa powder and cake 112,770 tons and cocoa butter 86,196 tons.
To increase production, the government of CIV stimulates cocoa farmers to use intensive methods of cultivation such
as new seed technologies, higher fertilizer application, new varieties of trees, etc. These methods in combination
can increase yield by 500 kg per hectare, and in some cases – when well applied by farmers – to 800-1,000 kg/
ha. Kolavalli and Vigneri (2017., pp. 82-84) report that the average use of fertilizers by smallholders who own land
parcels between 2 and 5 hectares is on average 176 kg per hectare, while farmers who own 5 to 10 hectare land
plots use relatively more fertilizers and they can achieve 248 kg per hectare. Besides the use of fertilizers and other
inputs, the rainfall and better soil contribute to higher yields.
In 1961, the average yield was 327 kg/ha. Between 1971 and 1984, the yields balanced between 420 and 500 kg/
ha (534 kg/ha in 1971 and 549.4 kg/ha in 1984), with the exception of 1982, when the average yields decreased to
the lowest level of 378.2 kg/ha.
The barrier of 601.6 kg/he was first reached in 1996 and in 2000 the level of 700.6 kg/ha was reached, at the
highest level registered since 1960. From 2000 onwards, the average yield has declined to below 580 kg/ha. In
2016, the average yield was 551 kg/ha.
Figure 2.16 Total production and average yield (kg/ha): 1961-2016
Source: FAOSTAT, 2017
2.4.2 Export and grinding capacityThe production and export of cocoa beans and cocoa derivatives are considered as a barometer of the economic
development of the country, due to their strong economic effects and linkages to other sectors of the economy such
as transport, maintenance, electricity, communication, finance, etc. CIV produced 1.5 million tons of cocoa in 2015
and 1.3 million in 2016. The increase in cocoa production since 1961 is impressive. From 85,000 tons in 1961, the
production of cocoa increased to 807,000 tons in 1990. The fastest increase occurred between 1994 and 2000,
when the production increased from 808,662 tons to 1.3 million in 1996 and 1.4 million in 2000. Between 2003
and 2012, production oscillated between 1.3 and 1.4 million tons.
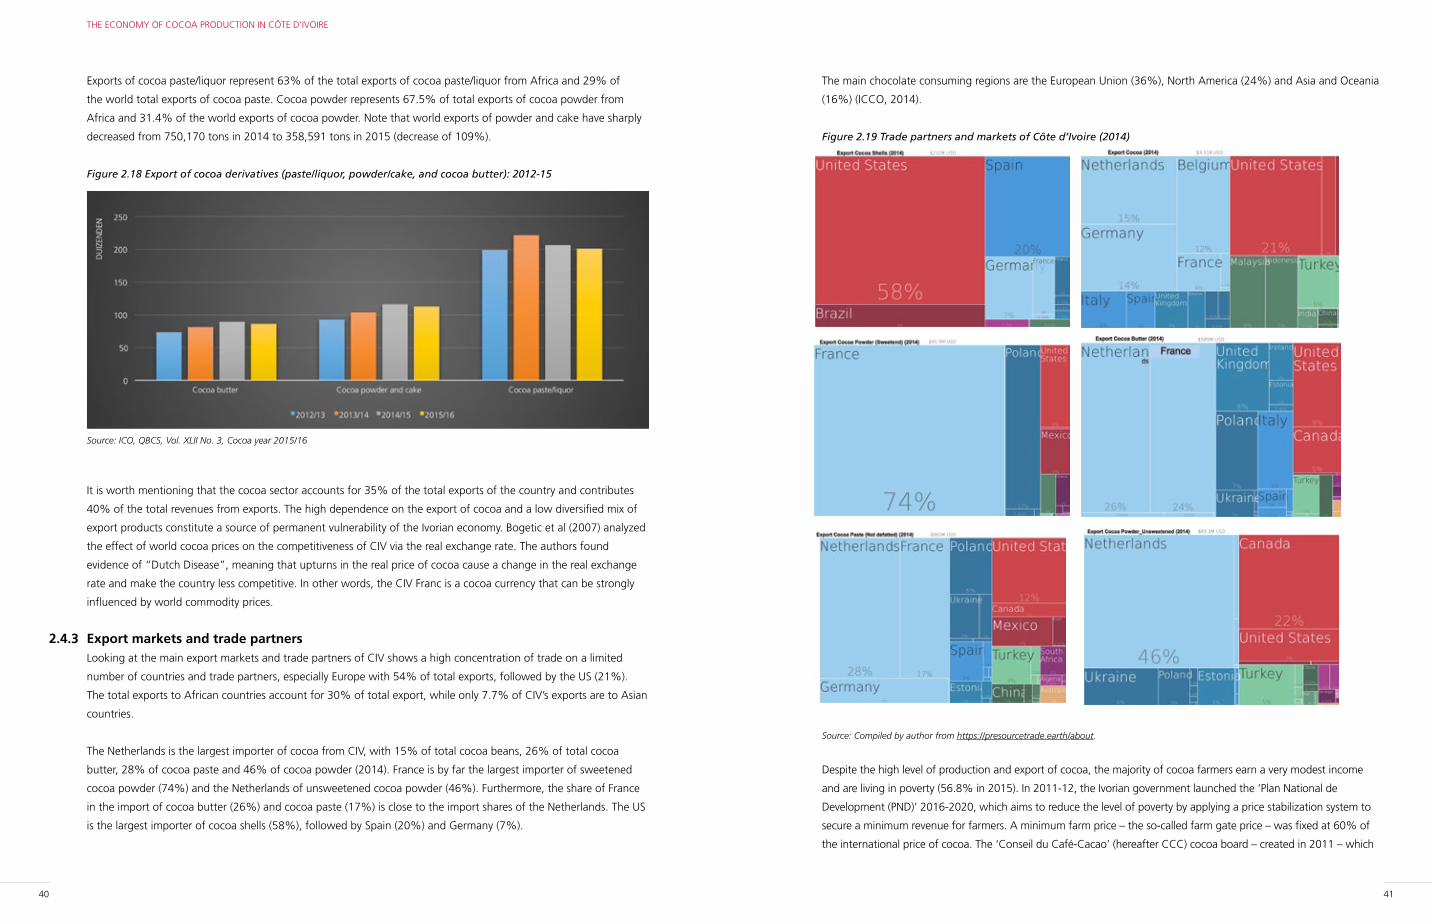
40 41
THE ECONOMY OF COCOA PRODUCTION IN CÔTE D’IVOIRE
The main chocolate consuming regions are the European Union (36%), North America (24%) and Asia and Oceania
(16%) (ICCO, 2014).
Figure 2.19 Trade partners and markets of Côte d’Ivoire (2014)
Source: Compiled by author from https://presourcetrade.earth/about.
Despite the high level of production and export of cocoa, the majority of cocoa farmers earn a very modest income
and are living in poverty (56.8% in 2015). In 2011-12, the Ivorian government launched the ‘Plan National de
Development (PND)’ 2016-2020, which aims to reduce the level of poverty by applying a price stabilization system to
secure a minimum revenue for farmers. A minimum farm price – the so-called farm gate price – was fixed at 60% of
the international price of cocoa. The ‘Conseil du Café-Cacao’ (hereafter CCC) cocoa board – created in 2011 – which
Exports of cocoa paste/liquor represent 63% of the total exports of cocoa paste/liquor from Africa and 29% of
the world total exports of cocoa paste. Cocoa powder represents 67.5% of total exports of cocoa powder from
Africa and 31.4% of the world exports of cocoa powder. Note that world exports of powder and cake have sharply
decreased from 750,170 tons in 2014 to 358,591 tons in 2015 (decrease of 109%).
Figure 2.18 Export of cocoa derivatives (paste/liquor, powder/cake, and cocoa butter): 2012-15
Source: ICO, QBCS, Vol. XLII No. 3, Cocoa year 2015/16
It is worth mentioning that the cocoa sector accounts for 35% of the total exports of the country and contributes
40% of the total revenues from exports. The high dependence on the export of cocoa and a low diversified mix of
export products constitute a source of permanent vulnerability of the Ivorian economy. Bogetic et al (2007) analyzed
the effect of world cocoa prices on the competitiveness of CIV via the real exchange rate. The authors found
evidence of “Dutch Disease”, meaning that upturns in the real price of cocoa cause a change in the real exchange
rate and make the country less competitive. In other words, the CIV Franc is a cocoa currency that can be strongly
influenced by world commodity prices.
2.4.3 Export markets and trade partnersLooking at the main export markets and trade partners of CIV shows a high concentration of trade on a limited
number of countries and trade partners, especially Europe with 54% of total exports, followed by the US (21%).
The total exports to African countries account for 30% of total export, while only 7.7% of CIV’s exports are to Asian
countries.
The Netherlands is the largest importer of cocoa from CIV, with 15% of total cocoa beans, 26% of total cocoa
butter, 28% of cocoa paste and 46% of cocoa powder (2014). France is by far the largest importer of sweetened
cocoa powder (74%) and the Netherlands of unsweetened cocoa powder (46%). Furthermore, the share of France
in the import of cocoa butter (26%) and cocoa paste (17%) is close to the import shares of the Netherlands. The US
is the largest importer of cocoa shells (58%), followed by Spain (20%) and Germany (7%).
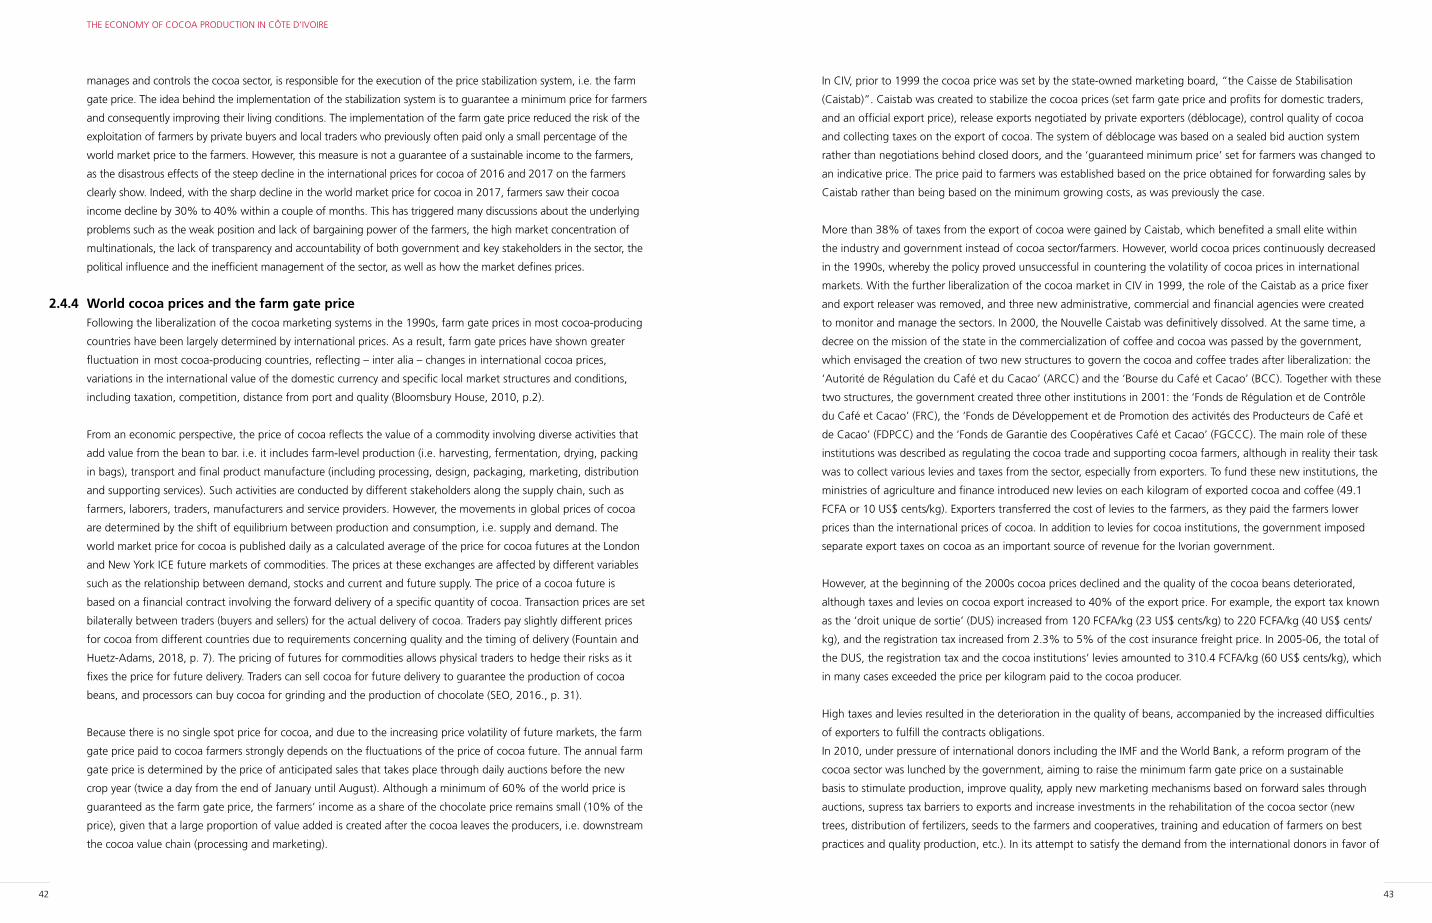
42 43
THE ECONOMY OF COCOA PRODUCTION IN CÔTE D’IVOIRE
In CIV, prior to 1999 the cocoa price was set by the state-owned marketing board, “the Caisse de Stabilisation
(Caistab)”. Caistab was created to stabilize the cocoa prices (set farm gate price and profits for domestic traders,
and an official export price), release exports negotiated by private exporters (déblocage), control quality of cocoa
and collecting taxes on the export of cocoa. The system of déblocage was based on a sealed bid auction system
rather than negotiations behind closed doors, and the ‘guaranteed minimum price’ set for farmers was changed to
an indicative price. The price paid to farmers was established based on the price obtained for forwarding sales by
Caistab rather than being based on the minimum growing costs, as was previously the case.
More than 38% of taxes from the export of cocoa were gained by Caistab, which benefited a small elite within
the industry and government instead of cocoa sector/farmers. However, world cocoa prices continuously decreased
in the 1990s, whereby the policy proved unsuccessful in countering the volatility of cocoa prices in international
markets. With the further liberalization of the cocoa market in CIV in 1999, the role of the Caistab as a price fixer
and export releaser was removed, and three new administrative, commercial and financial agencies were created
to monitor and manage the sectors. In 2000, the Nouvelle Caistab was definitively dissolved. At the same time, a
decree on the mission of the state in the commercialization of coffee and cocoa was passed by the government,
which envisaged the creation of two new structures to govern the cocoa and coffee trades after liberalization: the
‘Autorité de Régulation du Café et du Cacao’ (ARCC) and the ‘Bourse du Café et Cacao’ (BCC). Together with these
two structures, the government created three other institutions in 2001: the ‘Fonds de Régulation et de Contrôle
du Café et Cacao’ (FRC), the ‘Fonds de Développement et de Promotion des activités des Producteurs de Café et
de Cacao’ (FDPCC) and the ‘Fonds de Garantie des Coopératives Café et Cacao’ (FGCCC). The main role of these
institutions was described as regulating the cocoa trade and supporting cocoa farmers, although in reality their task
was to collect various levies and taxes from the sector, especially from exporters. To fund these new institutions, the
ministries of agriculture and finance introduced new levies on each kilogram of exported cocoa and coffee (49.1
FCFA or 10 US$ cents/kg). Exporters transferred the cost of levies to the farmers, as they paid the farmers lower
prices than the international prices of cocoa. In addition to levies for cocoa institutions, the government imposed
separate export taxes on cocoa as an important source of revenue for the Ivorian government.
However, at the beginning of the 2000s cocoa prices declined and the quality of the cocoa beans deteriorated,
although taxes and levies on cocoa export increased to 40% of the export price. For example, the export tax known
as the ‘droit unique de sortie’ (DUS) increased from 120 FCFA/kg (23 US$ cents/kg) to 220 FCFA/kg (40 US$ cents/
kg), and the registration tax increased from 2.3% to 5% of the cost insurance freight price. In 2005-06, the total of
the DUS, the registration tax and the cocoa institutions’ levies amounted to 310.4 FCFA/kg (60 US$ cents/kg), which
in many cases exceeded the price per kilogram paid to the cocoa producer.
High taxes and levies resulted in the deterioration in the quality of beans, accompanied by the increased difficulties
of exporters to fulfill the contracts obligations.
In 2010, under pressure of international donors including the IMF and the World Bank, a reform program of the
cocoa sector was lunched by the government, aiming to raise the minimum farm gate price on a sustainable
basis to stimulate production, improve quality, apply new marketing mechanisms based on forward sales through
auctions, supress tax barriers to exports and increase investments in the rehabilitation of the cocoa sector (new
trees, distribution of fertilizers, seeds to the farmers and cooperatives, training and education of farmers on best
practices and quality production, etc.). In its attempt to satisfy the demand from the international donors in favor of
manages and controls the cocoa sector, is responsible for the execution of the price stabilization system, i.e. the farm
gate price. The idea behind the implementation of the stabilization system is to guarantee a minimum price for farmers
and consequently improving their living conditions. The implementation of the farm gate price reduced the risk of the
exploitation of farmers by private buyers and local traders who previously often paid only a small percentage of the
world market price to the farmers. However, this measure is not a guarantee of a sustainable income to the farmers,
as the disastrous effects of the steep decline in the international prices for cocoa of 2016 and 2017 on the farmers
clearly show. Indeed, with the sharp decline in the world market price for cocoa in 2017, farmers saw their cocoa
income decline by 30% to 40% within a couple of months. This has triggered many discussions about the underlying
problems such as the weak position and lack of bargaining power of the farmers, the high market concentration of
multinationals, the lack of transparency and accountability of both government and key stakeholders in the sector, the
political influence and the inefficient management of the sector, as well as how the market defines prices.
2.4.4 World cocoa prices and the farm gate priceFollowing the liberalization of the cocoa marketing systems in the 1990s, farm gate prices in most cocoa-producing
countries have been largely determined by international prices. As a result, farm gate prices have shown greater
fluctuation in most cocoa-producing countries, reflecting – inter alia – changes in international cocoa prices,
variations in the international value of the domestic currency and specific local market structures and conditions,
including taxation, competition, distance from port and quality (Bloomsbury House, 2010, p.2).
From an economic perspective, the price of cocoa reflects the value of a commodity involving diverse activities that
add value from the bean to bar. i.e. it includes farm-level production (i.e. harvesting, fermentation, drying, packing
in bags), transport and final product manufacture (including processing, design, packaging, marketing, distribution
and supporting services). Such activities are conducted by different stakeholders along the supply chain, such as
farmers, laborers, traders, manufacturers and service providers. However, the movements in global prices of cocoa
are determined by the shift of equilibrium between production and consumption, i.e. supply and demand. The
world market price for cocoa is published daily as a calculated average of the price for cocoa futures at the London
and New York ICE future markets of commodities. The prices at these exchanges are affected by different variables
such as the relationship between demand, stocks and current and future supply. The price of a cocoa future is
based on a financial contract involving the forward delivery of a specific quantity of cocoa. Transaction prices are set
bilaterally between traders (buyers and sellers) for the actual delivery of cocoa. Traders pay slightly different prices
for cocoa from different countries due to requirements concerning quality and the timing of delivery (Fountain and
Huetz-Adams, 2018, p. 7). The pricing of futures for commodities allows physical traders to hedge their risks as it
fixes the price for future delivery. Traders can sell cocoa for future delivery to guarantee the production of cocoa
beans, and processors can buy cocoa for grinding and the production of chocolate (SEO, 2016., p. 31).
Because there is no single spot price for cocoa, and due to the increasing price volatility of future markets, the farm
gate price paid to cocoa farmers strongly depends on the fluctuations of the price of cocoa future. The annual farm
gate price is determined by the price of anticipated sales that takes place through daily auctions before the new
crop year (twice a day from the end of January until August). Although a minimum of 60% of the world price is
guaranteed as the farm gate price, the farmers’ income as a share of the chocolate price remains small (10% of the
price), given that a large proportion of value added is created after the cocoa leaves the producers, i.e. downstream
the cocoa value chain (processing and marketing).
44 45
THE ECONOMY OF COCOA PRODUCTION IN CÔTE D’IVOIRE
factories are closed. Trucks full of cocoa are backed up along the roads quickly clogging up the streets. The city has
almost ground to a halt”. Moreover, it was stated that: “20 presidents of cocoa farmers’ cooperatives from around
the region meet. Between them, they represent almost 20,000 farmers. And they are angry that they cannot pay
their children’s school fees, feed their families and prepare for the next harvest”.
While international traders can protect themselves from unexpected risks due to the volatility of prices in stock
markets, commodities, local traders and farmers in developing countries are left behind and unprotected against
such events.
“Though hard data is absent, it is safe to assume that some actors are making a lot of money off the price collapse,
while farmers and sustainability suffer” (Fountain and Huetz-Adams, 2018, p.11).
The CCC has been criticized by international traders for the way in which export licenses are allocated to local
traders (10% of total licenses), especially the transparency concerning the distribution of these licenses and their
market value (SEO, 2017, p.33). In a recent study, Kolavalli and Vigneri (2017) provide insights into the effects of the
way in which the cocoa sector was (mis)managed by the marketing boards on the rest of the economy. They argue
that “West African boards, for example, were characterized by misuse of funds, inefficiency in their performance,
and the depressing effects on farm production of their policies” (Kolavalli and Vigneri, 2017, p. 7).
According to a Global Witness report in 2017, cocoa gave Côte d’Ivoire its wealth and at the same time partly
contributed to the country’s downfall, because the large revenues that it has generated have fostered an opaque
system and favored corruption over several decades.
The decision-making in the cocoa sector is largely top-down, and various administrations have taken measures
to keep the sector growing, because a growing sector also benefits regional leaders of cocoa farmers and the
bureaucracies managing the sector (op cit., p. 60).
As is the case in many developing countries, the institutional governance structure is not sufficiently developed
to cater for the negative effects of an institutionalized corrupted environment, where both transparency and
accountability are quasi-absent in parts of the political and economic domains.
2.4.5 Strong performance and great vulnerability of the cocoa sector in Côte d’IvoireDespite the strong economic growth of the Ivorian economy and the strong international position of the country
as the world’s largest producer and exporter of cocoa, both the economy as well as the cocoa sector are highly
vulnerable to external shocks and suffer from various internal weaknesses that affect their development. The
weakness of the Ivorian economy lies in its internal dual structure, with the dominance of the informal sector, the
agriculture sector and the lack of structural changes of the economy, the strong dependence of the economy on
the production and export of limited agri-commodities, a lack of investments and low levels of job creation, weak
institutions and limited institutional capacity, high levels of public debt, low public expenditure and a negative fiscal
balance, as well as difficulties in realizing structural change, i.e. transition of the economy from the primary sector
(agriculture) to the secondary (manufacturing industry) and tertiary sectors (services sector). In addition, the Ivorian
economy remains vulnerable to external shocks, especially the changes in the world prices of agri-commodities and
international demand for agri-products.
the (neoliberal) market liberalization program and tighten control of the cocoa sector, the government created the
Conseil Caffe-Cacao (CCC).
The CCC pre-sells 80% of the expected total harvest in the year before the harvest season starts, and the farm gate
price is fixed at 60% of the value of this pre-sale. Every year in September, the CCC determines the fame gate price
for the next year, and the allocation of subsidies to different parties in the cocoa supply chain (e.g. private buyers,
traders, exporters, transporters) as well as the amount of tax revenues (60% goes to farmers, 10-15% to different
intermediaries in the cocoa supply chain, and 22% as tax revenues). However, note that even though the cocoa
sector is regulated in terms of the minimum guaranteed farm gate price, the real price paid to the farmer – when
corrected for inflation – shows only marginal benefits for the farmers (SEO, 2016., p. 38).
After the 2017 price decline, the CCC reduced the farm gate price by 40% with the mid-crop pricing in April 2017
(Fountain and Huetz-Adams, 2018., p. 7). The problem was that for the 2016-17 harvest season forwarded sells
were approximately 80% of the expected harvest at the world price of 3,000 US$. The remaining 20% was meant
to be sold during the low season, beginning in March and ending in September. The world market price of cocoa
suddenly decreased to 2000 US$, whereby about 350,000 tons of cocoa that were sold to private traders could not
be sold. As result, many private traders were unable to honor their contracts with cooperatives and private buyers.
In addition, the oversupply of cocoa in the world market and the remaining 20% of the harvest that had to be sold
forward (360,000 tons) made the situation much worse for the cocoa sector (farmers, cooperatives, transporters,
port activities, etc.) and government authorities (op cit., p. 10).
However, note that the CCC has a special cocoa stabilization fund of 70 billion FCFA stored in Ivorian bank accounts
designed to smooth out price problems like this, as well as a reserve fund at the Central Bank of West African
States, although this fund has not been used to help the sector/farmers. In December 2017, the CCC sold 100,000
tons of defaulted contracts to international exporters (Olam, Cargill, and Barry Callebaut) (Commodafrica, January
10, 2018.). According to Commodafrica, the total costs of defaulted contracts (93 export approved licenses by the
CCC to local traders and cooperatives in 2016-17) was more than 293 billion FCFA (447 million Euro), which is very
high when considering that the whole cocoa sector generates 525 billion FCFA (800 million Euro) of tax revenues,
for a total budget of 6,000 billion FCFA. In order to maintain the guaranteed farm gate of 60% of the market price,
the Ivorian government suppressed the tax on exportation from April to September 2017, which cost the state
about 43.4 billion FCFA.
As result of the CCC maintaining the farm gate at 700 FCFA per kg and the decline in world prices of cocoa, some
grinders temporarily halted the processing of cocoa – except Cargill and Touton – because they refused to comply
with the price of 1,100 FCFA per kg that the CCC had proposed to international traders/grinders. Some cooperatives
also stopped the shipments of cocoa from the production location to their storage facilities, and farmers who sold
their cocoa could not be paid on time. The cocoa sector was paralyzed. The CCC was blamed in the media as being
responsible for the crisis in the cocoa sector, due to the lack of control and transparency, unclarity of the sealing
system and poor communication.
A BBC reporter in Abidjan (Tamasin, 2017) sketched the situation caused by the price collapse on the port of San
Pedro: “This is the world’s biggest cocoa port and the traffic is usually unbearable, […] But today it’s quiet. The
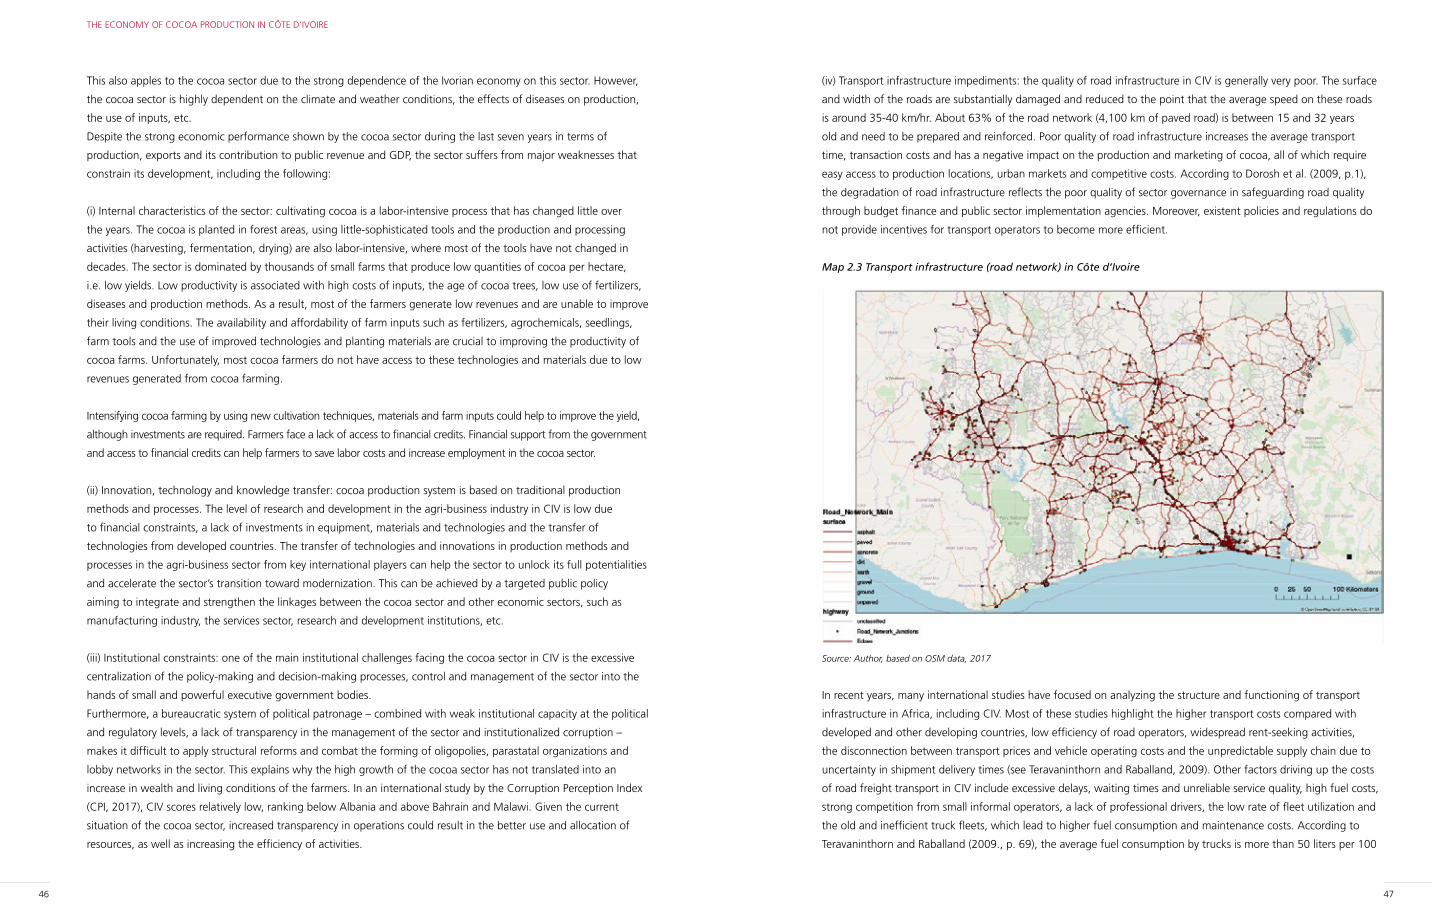
46 47
THE ECONOMY OF COCOA PRODUCTION IN CÔTE D’IVOIRE
(iv) Transport infrastructure impediments: the quality of road infrastructure in CIV is generally very poor. The surface
and width of the roads are substantially damaged and reduced to the point that the average speed on these roads
is around 35-40 km/hr. About 63% of the road network (4,100 km of paved road) is between 15 and 32 years
old and need to be prepared and reinforced. Poor quality of road infrastructure increases the average transport
time, transaction costs and has a negative impact on the production and marketing of cocoa, all of which require
easy access to production locations, urban markets and competitive costs. According to Dorosh et al. (2009, p.1),
the degradation of road infrastructure reflects the poor quality of sector governance in safeguarding road quality
through budget finance and public sector implementation agencies. Moreover, existent policies and regulations do
not provide incentives for transport operators to become more efficient.
Map 2.3 Transport infrastructure (road network) in Côte d’Ivoire
Source: Author, based on OSM data, 2017
In recent years, many international studies have focused on analyzing the structure and functioning of transport
infrastructure in Africa, including CIV. Most of these studies highlight the higher transport costs compared with
developed and other developing countries, low efficiency of road operators, widespread rent-seeking activities,
the disconnection between transport prices and vehicle operating costs and the unpredictable supply chain due to
uncertainty in shipment delivery times (see Teravaninthorn and Raballand, 2009). Other factors driving up the costs
of road freight transport in CIV include excessive delays, waiting times and unreliable service quality, high fuel costs,
strong competition from small informal operators, a lack of professional drivers, the low rate of fleet utilization and
the old and inefficient truck fleets, which lead to higher fuel consumption and maintenance costs. According to
Teravaninthorn and Raballand (2009., p. 69), the average fuel consumption by trucks is more than 50 liters per 100
This also apples to the cocoa sector due to the strong dependence of the Ivorian economy on this sector. However,
the cocoa sector is highly dependent on the climate and weather conditions, the effects of diseases on production,
the use of inputs, etc.
Despite the strong economic performance shown by the cocoa sector during the last seven years in terms of
production, exports and its contribution to public revenue and GDP, the sector suffers from major weaknesses that
constrain its development, including the following:
(i) Internal characteristics of the sector: cultivating cocoa is a labor-intensive process that has changed little over
the years. The cocoa is planted in forest areas, using little-sophisticated tools and the production and processing
activities (harvesting, fermentation, drying) are also labor-intensive, where most of the tools have not changed in
decades. The sector is dominated by thousands of small farms that produce low quantities of cocoa per hectare,
i.e. low yields. Low productivity is associated with high costs of inputs, the age of cocoa trees, low use of fertilizers,
diseases and production methods. As a result, most of the farmers generate low revenues and are unable to improve
their living conditions. The availability and affordability of farm inputs such as fertilizers, agrochemicals, seedlings,
farm tools and the use of improved technologies and planting materials are crucial to improving the productivity of
cocoa farms. Unfortunately, most cocoa farmers do not have access to these technologies and materials due to low
revenues generated from cocoa farming.
Intensifying cocoa farming by using new cultivation techniques, materials and farm inputs could help to improve the yield,
although investments are required. Farmers face a lack of access to financial credits. Financial support from the government
and access to financial credits can help farmers to save labor costs and increase employment in the cocoa sector.
(ii) Innovation, technology and knowledge transfer: cocoa production system is based on traditional production
methods and processes. The level of research and development in the agri-business industry in CIV is low due
to financial constraints, a lack of investments in equipment, materials and technologies and the transfer of
technologies from developed countries. The transfer of technologies and innovations in production methods and
processes in the agri-business sector from key international players can help the sector to unlock its full potentialities
and accelerate the sector’s transition toward modernization. This can be achieved by a targeted public policy
aiming to integrate and strengthen the linkages between the cocoa sector and other economic sectors, such as
manufacturing industry, the services sector, research and development institutions, etc.
(iii) Institutional constraints: one of the main institutional challenges facing the cocoa sector in CIV is the excessive
centralization of the policy-making and decision-making processes, control and management of the sector into the
hands of small and powerful executive government bodies.
Furthermore, a bureaucratic system of political patronage – combined with weak institutional capacity at the political
and regulatory levels, a lack of transparency in the management of the sector and institutionalized corruption –
makes it difficult to apply structural reforms and combat the forming of oligopolies, parastatal organizations and
lobby networks in the sector. This explains why the high growth of the cocoa sector has not translated into an
increase in wealth and living conditions of the farmers. In an international study by the Corruption Perception Index
(CPI, 2017), CIV scores relatively low, ranking below Albania and above Bahrain and Malawi. Given the current
situation of the cocoa sector, increased transparency in operations could result in the better use and allocation of
resources, as well as increasing the efficiency of activities.
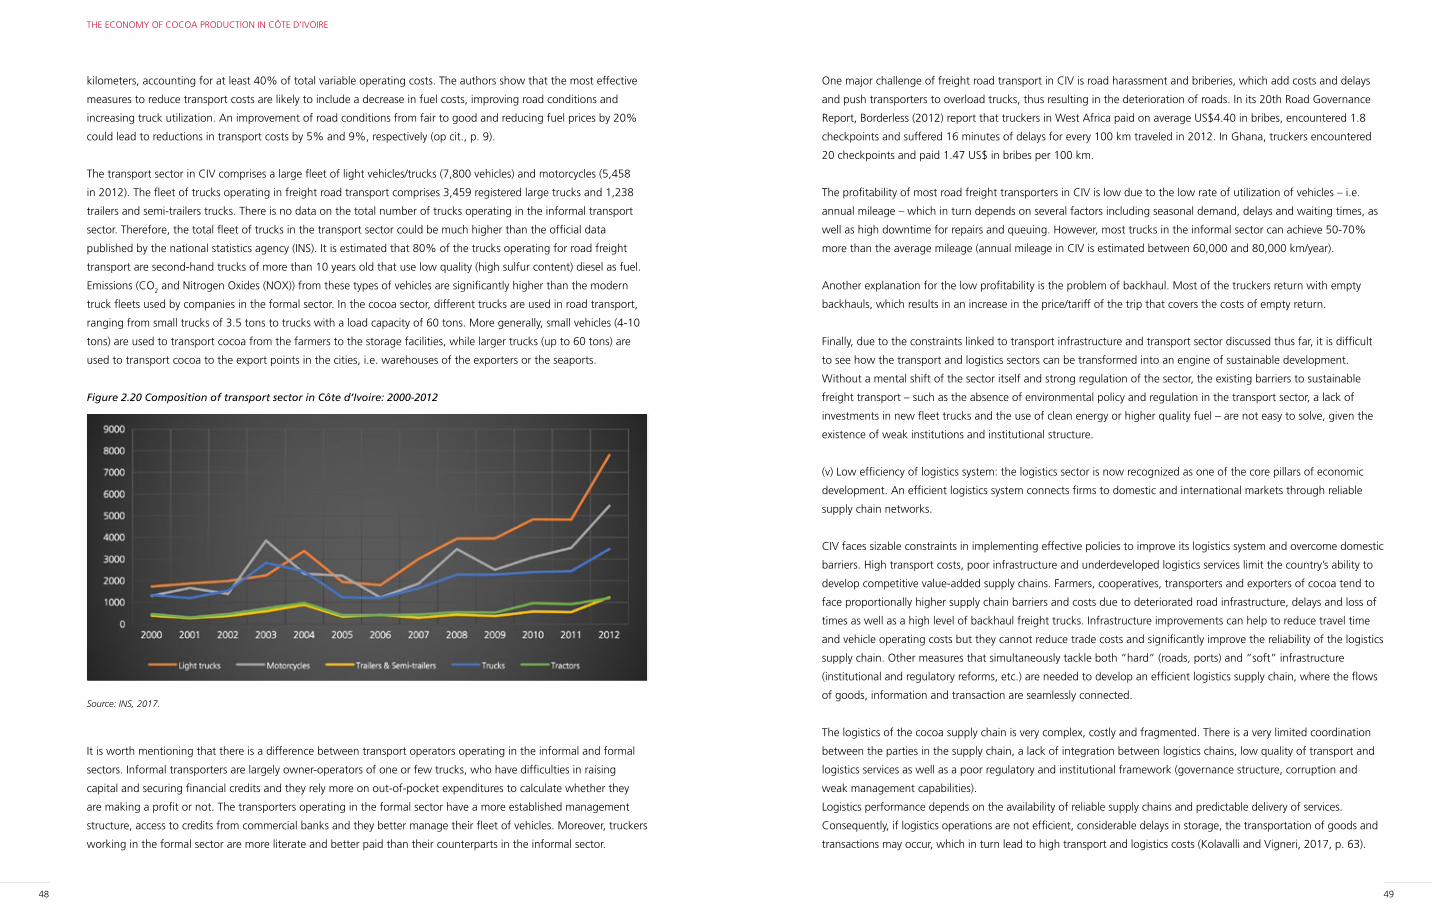
48 49
THE ECONOMY OF COCOA PRODUCTION IN CÔTE D’IVOIRE
One major challenge of freight road transport in CIV is road harassment and briberies, which add costs and delays
and push transporters to overload trucks, thus resulting in the deterioration of roads. In its 20th Road Governance
Report, Borderless (2012) report that truckers in West Africa paid on average US$4.40 in bribes, encountered 1.8
checkpoints and suffered 16 minutes of delays for every 100 km traveled in 2012. In Ghana, truckers encountered
20 checkpoints and paid 1.47 US$ in bribes per 100 km.
The profitability of most road freight transporters in CIV is low due to the low rate of utilization of vehicles – i.e.
annual mileage – which in turn depends on several factors including seasonal demand, delays and waiting times, as
well as high downtime for repairs and queuing. However, most trucks in the informal sector can achieve 50-70%
more than the average mileage (annual mileage in CIV is estimated between 60,000 and 80,000 km/year).
Another explanation for the low profitability is the problem of backhaul. Most of the truckers return with empty
backhauls, which results in an increase in the price/tariff of the trip that covers the costs of empty return.
Finally, due to the constraints linked to transport infrastructure and transport sector discussed thus far, it is difficult
to see how the transport and logistics sectors can be transformed into an engine of sustainable development.
Without a mental shift of the sector itself and strong regulation of the sector, the existing barriers to sustainable
freight transport – such as the absence of environmental policy and regulation in the transport sector, a lack of
investments in new fleet trucks and the use of clean energy or higher quality fuel – are not easy to solve, given the
existence of weak institutions and institutional structure.
(v) Low efficiency of logistics system: the logistics sector is now recognized as one of the core pillars of economic
development. An efficient logistics system connects firms to domestic and international markets through reliable
supply chain networks.
CIV faces sizable constraints in implementing effective policies to improve its logistics system and overcome domestic
barriers. High transport costs, poor infrastructure and underdeveloped logistics services limit the country’s ability to
develop competitive value-added supply chains. Farmers, cooperatives, transporters and exporters of cocoa tend to
face proportionally higher supply chain barriers and costs due to deteriorated road infrastructure, delays and loss of
times as well as a high level of backhaul freight trucks. Infrastructure improvements can help to reduce travel time
and vehicle operating costs but they cannot reduce trade costs and significantly improve the reliability of the logistics
supply chain. Other measures that simultaneously tackle both “hard” (roads, ports) and “soft” infrastructure
(institutional and regulatory reforms, etc.) are needed to develop an efficient logistics supply chain, where the flows
of goods, information and transaction are seamlessly connected.
The logistics of the cocoa supply chain is very complex, costly and fragmented. There is a very limited coordination
between the parties in the supply chain, a lack of integration between logistics chains, low quality of transport and
logistics services as well as a poor regulatory and institutional framework (governance structure, corruption and
weak management capabilities).
Logistics performance depends on the availability of reliable supply chains and predictable delivery of services.
Consequently, if logistics operations are not efficient, considerable delays in storage, the transportation of goods and
transactions may occur, which in turn lead to high transport and logistics costs (Kolavalli and Vigneri, 2017, p. 63).
kilometers, accounting for at least 40% of total variable operating costs. The authors show that the most effective
measures to reduce transport costs are likely to include a decrease in fuel costs, improving road conditions and
increasing truck utilization. An improvement of road conditions from fair to good and reducing fuel prices by 20%
could lead to reductions in transport costs by 5% and 9%, respectively (op cit., p. 9).
The transport sector in CIV comprises a large fleet of light vehicles/trucks (7,800 vehicles) and motorcycles (5,458
in 2012). The fleet of trucks operating in freight road transport comprises 3,459 registered large trucks and 1,238
trailers and semi-trailers trucks. There is no data on the total number of trucks operating in the informal transport
sector. Therefore, the total fleet of trucks in the transport sector could be much higher than the official data
published by the national statistics agency (INS). It is estimated that 80% of the trucks operating for road freight
transport are second-hand trucks of more than 10 years old that use low quality (high sulfur content) diesel as fuel.
Emissions (CO2 and Nitrogen Oxides (NOX)) from these types of vehicles are significantly higher than the modern
truck fleets used by companies in the formal sector. In the cocoa sector, different trucks are used in road transport,
ranging from small trucks of 3.5 tons to trucks with a load capacity of 60 tons. More generally, small vehicles (4-10
tons) are used to transport cocoa from the farmers to the storage facilities, while larger trucks (up to 60 tons) are
used to transport cocoa to the export points in the cities, i.e. warehouses of the exporters or the seaports.
Figure 2.20 Composition of transport sector in Côte d’Ivoire: 2000-2012
Source: INS, 2017.
It is worth mentioning that there is a difference between transport operators operating in the informal and formal
sectors. Informal transporters are largely owner-operators of one or few trucks, who have difficulties in raising
capital and securing financial credits and they rely more on out-of-pocket expenditures to calculate whether they
are making a profit or not. The transporters operating in the formal sector have a more established management
structure, access to credits from commercial banks and they better manage their fleet of vehicles. Moreover, truckers
working in the formal sector are more literate and better paid than their counterparts in the informal sector.
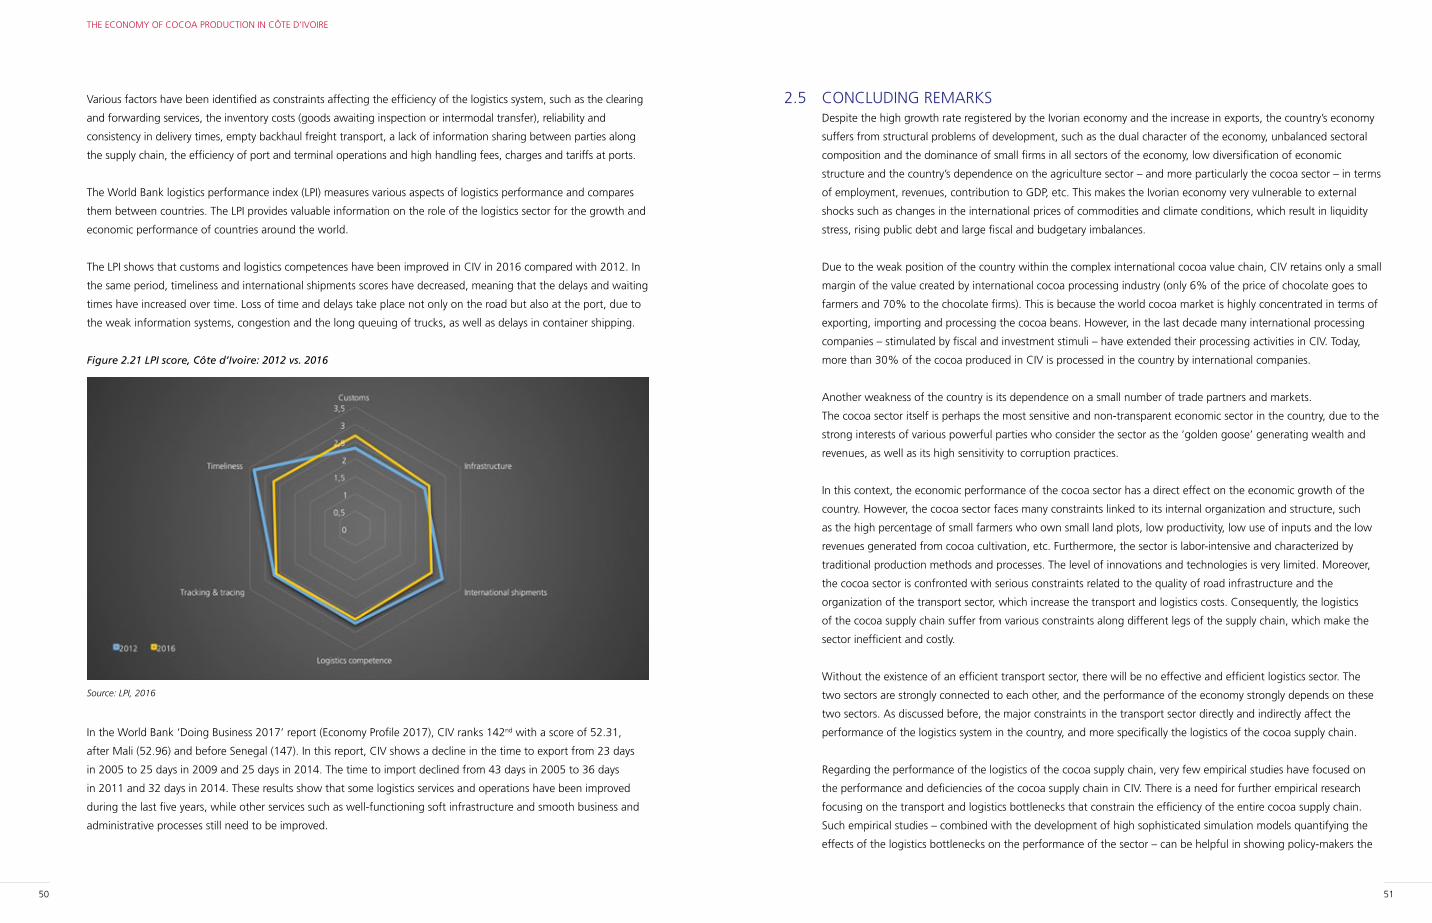
50 51
THE ECONOMY OF COCOA PRODUCTION IN CÔTE D’IVOIRE
2.5 CONCLUDING REMARKSDespite the high growth rate registered by the Ivorian economy and the increase in exports, the country’s economy
suffers from structural problems of development, such as the dual character of the economy, unbalanced sectoral
composition and the dominance of small firms in all sectors of the economy, low diversification of economic
structure and the country’s dependence on the agriculture sector – and more particularly the cocoa sector – in terms
of employment, revenues, contribution to GDP, etc. This makes the Ivorian economy very vulnerable to external
shocks such as changes in the international prices of commodities and climate conditions, which result in liquidity
stress, rising public debt and large fiscal and budgetary imbalances.
Due to the weak position of the country within the complex international cocoa value chain, CIV retains only a small
margin of the value created by international cocoa processing industry (only 6% of the price of chocolate goes to
farmers and 70% to the chocolate firms). This is because the world cocoa market is highly concentrated in terms of
exporting, importing and processing the cocoa beans. However, in the last decade many international processing
companies – stimulated by fiscal and investment stimuli – have extended their processing activities in CIV. Today,
more than 30% of the cocoa produced in CIV is processed in the country by international companies.
Another weakness of the country is its dependence on a small number of trade partners and markets.
The cocoa sector itself is perhaps the most sensitive and non-transparent economic sector in the country, due to the
strong interests of various powerful parties who consider the sector as the ‘golden goose’ generating wealth and
revenues, as well as its high sensitivity to corruption practices.
In this context, the economic performance of the cocoa sector has a direct effect on the economic growth of the
country. However, the cocoa sector faces many constraints linked to its internal organization and structure, such
as the high percentage of small farmers who own small land plots, low productivity, low use of inputs and the low
revenues generated from cocoa cultivation, etc. Furthermore, the sector is labor-intensive and characterized by
traditional production methods and processes. The level of innovations and technologies is very limited. Moreover,
the cocoa sector is confronted with serious constraints related to the quality of road infrastructure and the
organization of the transport sector, which increase the transport and logistics costs. Consequently, the logistics
of the cocoa supply chain suffer from various constraints along different legs of the supply chain, which make the
sector inefficient and costly.
Without the existence of an efficient transport sector, there will be no effective and efficient logistics sector. The
two sectors are strongly connected to each other, and the performance of the economy strongly depends on these
two sectors. As discussed before, the major constraints in the transport sector directly and indirectly affect the
performance of the logistics system in the country, and more specifically the logistics of the cocoa supply chain.
Regarding the performance of the logistics of the cocoa supply chain, very few empirical studies have focused on
the performance and deficiencies of the cocoa supply chain in CIV. There is a need for further empirical research
focusing on the transport and logistics bottlenecks that constrain the efficiency of the entire cocoa supply chain.
Such empirical studies – combined with the development of high sophisticated simulation models quantifying the
effects of the logistics bottlenecks on the performance of the sector – can be helpful in showing policy-makers the
Various factors have been identified as constraints affecting the efficiency of the logistics system, such as the clearing
and forwarding services, the inventory costs (goods awaiting inspection or intermodal transfer), reliability and
consistency in delivery times, empty backhaul freight transport, a lack of information sharing between parties along
the supply chain, the efficiency of port and terminal operations and high handling fees, charges and tariffs at ports.
The World Bank logistics performance index (LPI) measures various aspects of logistics performance and compares
them between countries. The LPI provides valuable information on the role of the logistics sector for the growth and
economic performance of countries around the world.
The LPI shows that customs and logistics competences have been improved in CIV in 2016 compared with 2012. In
the same period, timeliness and international shipments scores have decreased, meaning that the delays and waiting
times have increased over time. Loss of time and delays take place not only on the road but also at the port, due to
the weak information systems, congestion and the long queuing of trucks, as well as delays in container shipping.
Figure 2.21 LPI score, Côte d’Ivoire: 2012 vs. 2016
Source: LPI, 2016
In the World Bank ‘Doing Business 2017’ report (Economy Profile 2017), CIV ranks 142nd with a score of 52.31,
after Mali (52.96) and before Senegal (147). In this report, CIV shows a decline in the time to export from 23 days
in 2005 to 25 days in 2009 and 25 days in 2014. The time to import declined from 43 days in 2005 to 36 days
in 2011 and 32 days in 2014. These results show that some logistics services and operations have been improved
during the last five years, while other services such as well-functioning soft infrastructure and smooth business and
administrative processes still need to be improved.
52 53
THE ECONOMY OF COCOA PRODUCTION IN CÔTE D’IVOIRE
opportunities to improve the sustainability of the logistics supply chain and hence the competitiveness of the sector
and its integration in the international value chain. This is precisely the main objective of this research.
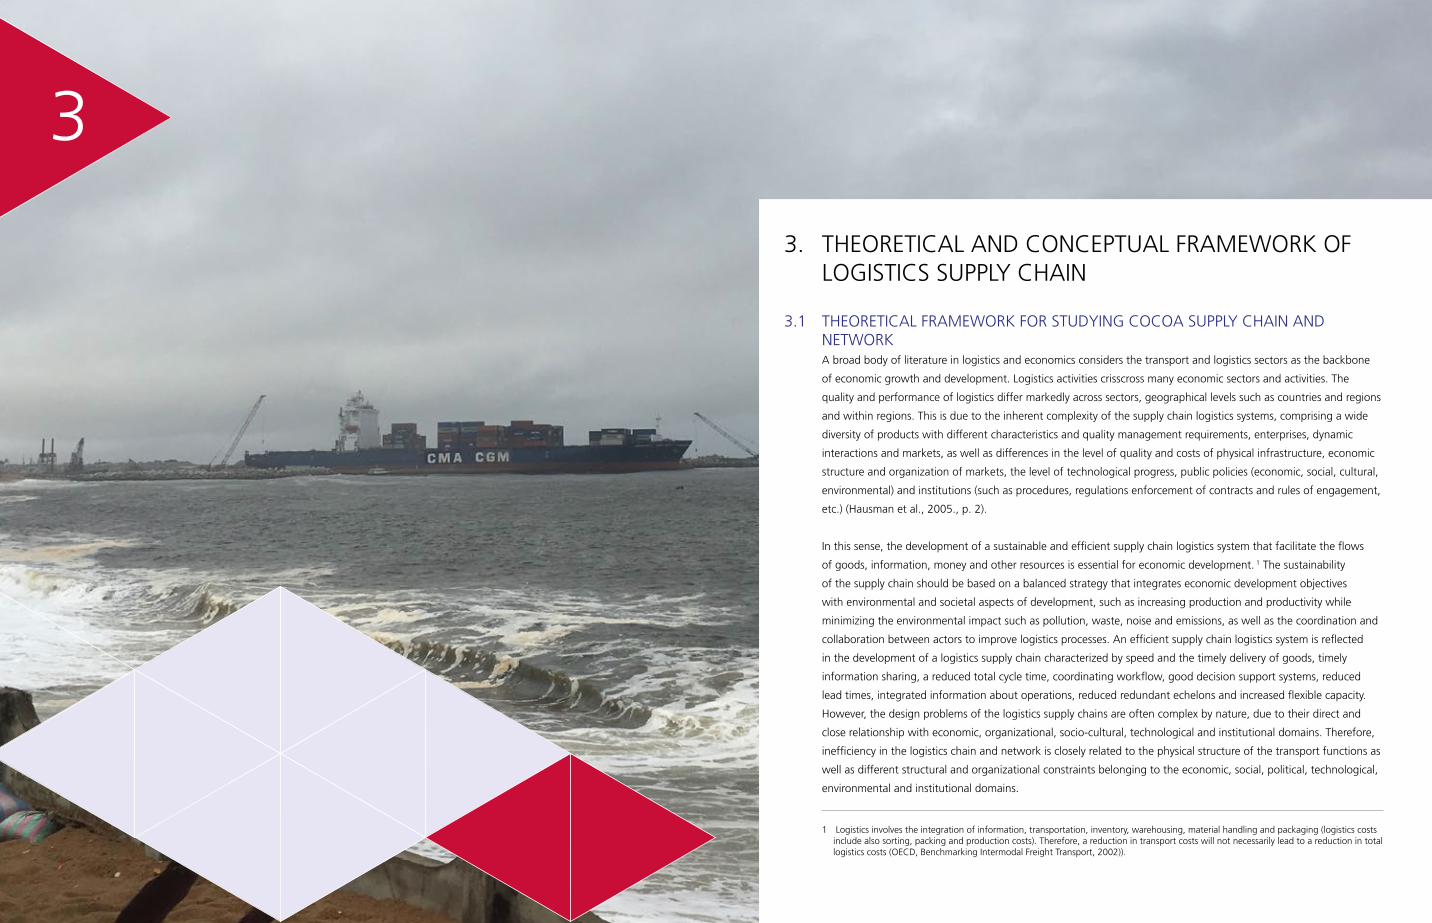
54 55
THEORETICAL AND CONCEPTUAL FRAMEWORK OF LOGISTICS SUPPLY CHAIN
3
3. THEORETICAL AND CONCEPTUAL FRAMEWORK OF LOGISTICS SUPPLY CHAIN
3.1 THEORETICAL FRAMEWORK FOR STUDYING COCOA SUPPLY CHAIN AND NETWORKA broad body of literature in logistics and economics considers the transport and logistics sectors as the backbone
of economic growth and development. Logistics activities crisscross many economic sectors and activities. The
quality and performance of logistics differ markedly across sectors, geographical levels such as countries and regions
and within regions. This is due to the inherent complexity of the supply chain logistics systems, comprising a wide
diversity of products with different characteristics and quality management requirements, enterprises, dynamic
interactions and markets, as well as differences in the level of quality and costs of physical infrastructure, economic
structure and organization of markets, the level of technological progress, public policies (economic, social, cultural,
environmental) and institutions (such as procedures, regulations enforcement of contracts and rules of engagement,
etc.) (Hausman et al., 2005., p. 2).
In this sense, the development of a sustainable and efficient supply chain logistics system that facilitate the flows
of goods, information, money and other resources is essential for economic development. 1 The sustainability
of the supply chain should be based on a balanced strategy that integrates economic development objectives
with environmental and societal aspects of development, such as increasing production and productivity while
minimizing the environmental impact such as pollution, waste, noise and emissions, as well as the coordination and
collaboration between actors to improve logistics processes. An efficient supply chain logistics system is reflected
in the development of a logistics supply chain characterized by speed and the timely delivery of goods, timely
information sharing, a reduced total cycle time, coordinating workflow, good decision support systems, reduced
lead times, integrated information about operations, reduced redundant echelons and increased flexible capacity.
However, the design problems of the logistics supply chains are often complex by nature, due to their direct and
close relationship with economic, organizational, socio-cultural, technological and institutional domains. Therefore,
inefficiency in the logistics chain and network is closely related to the physical structure of the transport functions as
well as different structural and organizational constraints belonging to the economic, social, political, technological,
environmental and institutional domains.
1 Logistics involves the integration of information, transportation, inventory, warehousing, material handling and packaging (logistics costs include also sorting, packing and production costs). Therefore, a reduction in transport costs will not necessarily lead to a reduction in total logistics costs (OECD, Benchmarking Intermodal Freight Transport, 2002)).
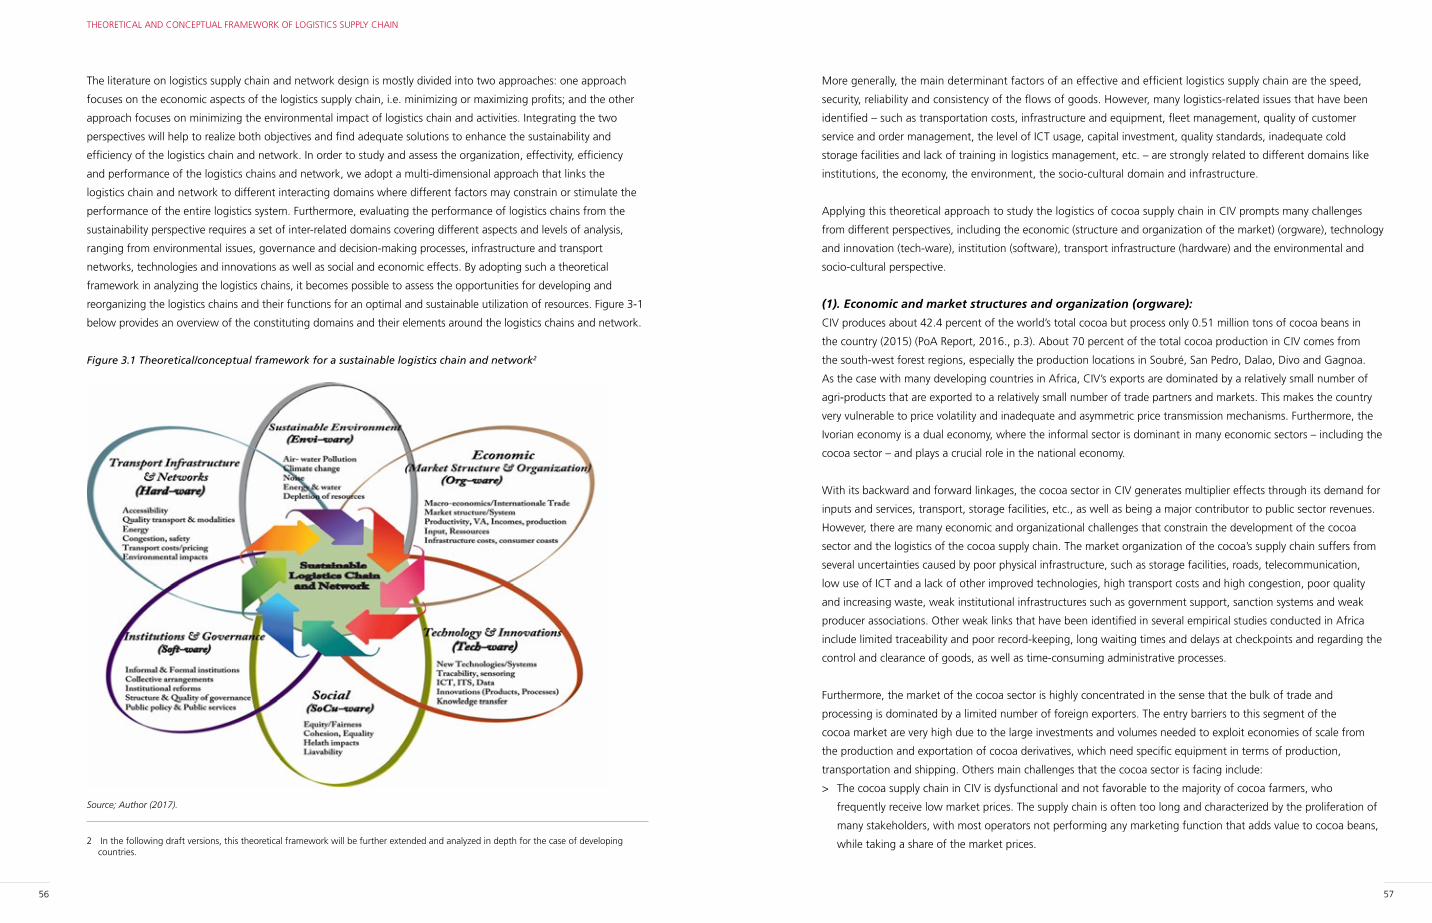
56 57
THEORETICAL AND CONCEPTUAL FRAMEWORK OF LOGISTICS SUPPLY CHAIN
More generally, the main determinant factors of an effective and efficient logistics supply chain are the speed,
security, reliability and consistency of the flows of goods. However, many logistics-related issues that have been
identified – such as transportation costs, infrastructure and equipment, fleet management, quality of customer
service and order management, the level of ICT usage, capital investment, quality standards, inadequate cold
storage facilities and lack of training in logistics management, etc. – are strongly related to different domains like
institutions, the economy, the environment, the socio-cultural domain and infrastructure.
Applying this theoretical approach to study the logistics of cocoa supply chain in CIV prompts many challenges
from different perspectives, including the economic (structure and organization of the market) (orgware), technology
and innovation (tech-ware), institution (software), transport infrastructure (hardware) and the environmental and
socio-cultural perspective.
(1). Economic and market structures and organization (orgware):
CIV produces about 42.4 percent of the world’s total cocoa but process only 0.51 million tons of cocoa beans in
the country (2015) (PoA Report, 2016., p.3). About 70 percent of the total cocoa production in CIV comes from
the south-west forest regions, especially the production locations in Soubré, San Pedro, Dalao, Divo and Gagnoa.
As the case with many developing countries in Africa, CIV’s exports are dominated by a relatively small number of
agri-products that are exported to a relatively small number of trade partners and markets. This makes the country
very vulnerable to price volatility and inadequate and asymmetric price transmission mechanisms. Furthermore, the
Ivorian economy is a dual economy, where the informal sector is dominant in many economic sectors – including the
cocoa sector – and plays a crucial role in the national economy.
With its backward and forward linkages, the cocoa sector in CIV generates multiplier effects through its demand for
inputs and services, transport, storage facilities, etc., as well as being a major contributor to public sector revenues.
However, there are many economic and organizational challenges that constrain the development of the cocoa
sector and the logistics of the cocoa supply chain. The market organization of the cocoa’s supply chain suffers from
several uncertainties caused by poor physical infrastructure, such as storage facilities, roads, telecommunication,
low use of ICT and a lack of other improved technologies, high transport costs and high congestion, poor quality
and increasing waste, weak institutional infrastructures such as government support, sanction systems and weak
producer associations. Other weak links that have been identified in several empirical studies conducted in Africa
include limited traceability and poor record-keeping, long waiting times and delays at checkpoints and regarding the
control and clearance of goods, as well as time-consuming administrative processes.
Furthermore, the market of the cocoa sector is highly concentrated in the sense that the bulk of trade and
processing is dominated by a limited number of foreign exporters. The entry barriers to this segment of the
cocoa market are very high due to the large investments and volumes needed to exploit economies of scale from
the production and exportation of cocoa derivatives, which need specific equipment in terms of production,
transportation and shipping. Others main challenges that the cocoa sector is facing include:
> The cocoa supply chain in CIV is dysfunctional and not favorable to the majority of cocoa farmers, who
frequently receive low market prices. The supply chain is often too long and characterized by the proliferation of
many stakeholders, with most operators not performing any marketing function that adds value to cocoa beans,
while taking a share of the market prices.
The literature on logistics supply chain and network design is mostly divided into two approaches: one approach
focuses on the economic aspects of the logistics supply chain, i.e. minimizing or maximizing profits; and the other
approach focuses on minimizing the environmental impact of logistics chain and activities. Integrating the two
perspectives will help to realize both objectives and find adequate solutions to enhance the sustainability and
efficiency of the logistics chain and network. In order to study and assess the organization, effectivity, efficiency
and performance of the logistics chains and network, we adopt a multi-dimensional approach that links the
logistics chain and network to different interacting domains where different factors may constrain or stimulate the
performance of the entire logistics system. Furthermore, evaluating the performance of logistics chains from the
sustainability perspective requires a set of inter-related domains covering different aspects and levels of analysis,
ranging from environmental issues, governance and decision-making processes, infrastructure and transport
networks, technologies and innovations as well as social and economic effects. By adopting such a theoretical
framework in analyzing the logistics chains, it becomes possible to assess the opportunities for developing and
reorganizing the logistics chains and their functions for an optimal and sustainable utilization of resources. Figure 3-1
below provides an overview of the constituting domains and their elements around the logistics chains and network.
Figure 3.1 Theoretical/conceptual framework for a sustainable logistics chain and network2
Source; Author (2017).
2 In the following draft versions, this theoretical framework will be further extended and analyzed in depth for the case of developing countries.
58 59
THEORETICAL AND CONCEPTUAL FRAMEWORK OF LOGISTICS SUPPLY CHAIN
Other institutional issues include: (i) property rights of land, i.e. land acquisition and ownership is one of the main
constraints to the establishment and expansion of cocoa farms because land ownership is still governed by local
tribal power structures; (ii) the persistence of patronage and clan networks continue to play important role in Ivorian
society and business; (iii) resolving contractual disputes in CIV (measured in time and costs) takes an average of 525
days, while costs typically amount to 42 percent of the claim (World Bank’s ‘Doing business’ database, 2016); and
(vi) the cost of financial services – if accessed – is high and its availability is lacking.
(4). Transport infrastructure and networks (hardware):
CIV has made significant progress in the development of roads networks during the 1960s and 1970s, although
after 1999 investments in infrastructure slowed down due to a lack of finance and the political turmoil. Spending
on infrastructure was less than 5% of GDP in the mid-2000s, which is about half of what many neighboring
West African countries devoted to infrastructure during the 1990s and 2000s. Various empirical studies show that
improvement of the country’s infrastructure endowment – such as energy supply, roads networks, rail infrastructure
and terminal capacity of ports and airports – could increase the growth rate by 2%.
The road network’s physical condition is very poor. A very large part of the roads are degraded by decades of
intensive use and lack of maintenance. The connectivity between urban and rural areas is becoming difficult,
especially in terms of the accessibility of roads to the villages where cocoa is produced.
Beside the low density and poor quality of road networks, there are several problems that have direct effects on the
transport and logistics sector in CIV, such as the increasing transport prices, high operational costs and unpredictable
delays, due – among other things – to the extraction of significant bribes by police3. As a result, transporters tend
to overload their truck to compensate for the costs of the bribes and other additional charges (for example, charge
load per axle).
(5). Environmental issues (env-ware):
Developing a sustainable logistics sector very closely depends on the sustainability of the transport sector. However,
the transport sector in CIV is a pollutant sector and it produces high level of emissions.
Worldwide, the transport sector accounts for about 25% of global carbon dioxide (CO2) emissions from fuel
combustion (in 2012) and is expected to increase by 1.7% a year by 2030, with over 80% of growth expected to
occur in developing countries. Due to the internal structure of the transport sector in CIV – which is dominated
by the informal sector and the use of old fleets and low-quality fuel – the negative effects of logistics of cocoa
supply chains should be significant. Furthermore, there are important volumes of waste and discharge of chemical
pesticides in the cocoa farms, which have important environmental effects on the entire supply chain. Therefore,
promoting sustainable freight transport and sustainable logistics supply chain in the cocoa sector provides
an opportunity to work toward reducing their heavy reliance on low-quality fuel and minimize the negative
environmental externalities of freight transport.
3 According to Foster and Pushak (2011), the average bribe per truck on the Abidjan-Lagos corridor is $88 per 100 km on the Ivorian section, compared to $12 per 100 km in Ghana.
> Farmers often lack access to market information and technology and their understanding of the quality
requirements of the market is very weak. This translates into low productivity, low income and decreasing yields.
> A fragmented and inappropriate functioning of the market results in a trading system in which quality is often
compromised.
> The majority of cocoa farmers sell their cocoa beans individually to private buyers, which often operate in areas
where it is difficult for farmers to transport the cocoa themselves.
> A widespread practice of mixing good and poor quality cocoa beans to meet minimum market quality standards.
> Limited access of farmers to productivity-enhancing inputs and resources such as fertilizers, agrochemicals,
seedlings, farm tools and credits, which affect the productivity and competitiveness of the cocoa sector.
(2). Technology, innovation and knowledge transfer (tech-ware):
The cocoa production system and methods of production in CIV have not significantly changed over recent decades.
Apart from the introduction of hybrid varieties, nothing has changed in cocoa farming and the commercialization
of cocoa. There has been very little effort at modernizing cocoa farming or farming in general. Innovations in the
sector are relatively absent due to the weak market organization of the cocoa sector, especially at the producer
and cooperative level, where the majority of farmers can slow the uptake of innovations and the use of new
technologies due to cultural beliefs.
Moreover, research aiming at cocoa development is relatively weak in CIV. As a result, the cocoa sector does not
take advantage of existing technological progress and innovations in the same way as other agricultural crops.
Finally, information and communication technologies (ICT) play a critical role in ensuring effective linkages between
actors in the logistics supply chain as well as effective control of time, costs and the quality of goods and services.
Unfortunately, the adoption of ICT in logistics management in the cocoa sector is very low and mostly limited to
modern and international companies operating in the downstream channels of the logistics chain. For example,
information sharing between actors in the cocoa sector takes place through a paper-based system and the use of
semi-automated systems, e.g. phone and/or e-mail.
(3). Institutional and governance structure (software):
The institutional and governance structure within which cocoa is produced and traded is highly complex and
not always conducive for business in the cocoa sector. The balancing power toward the informal institutions at
the cost of the formal institutions can block the implementation of structural reforms and new initiatives aiming
to restructure and modernizing the sector. This is because the sector has institutionalized specific forms of
arrangements that are accepted by all actors, which serve as the basis for conducting business in the sector.
Moreover, the low quality of institutions and governance translate into higher costs and prices, low productivity
and incomes and reduced trust in government institutions. One of the weaknesses of Ivorian institutions is that
they favor collusive behavior to manipulate the market, as well as widespread corruption practices at different
economic and political levels (Fein, 2005). Furthermore, some institutions add unnecessary costs to the actors in the
cocoa sector, such as costs of delays and loss of time at customs inspection and clearance, technical clearance and
document processing.
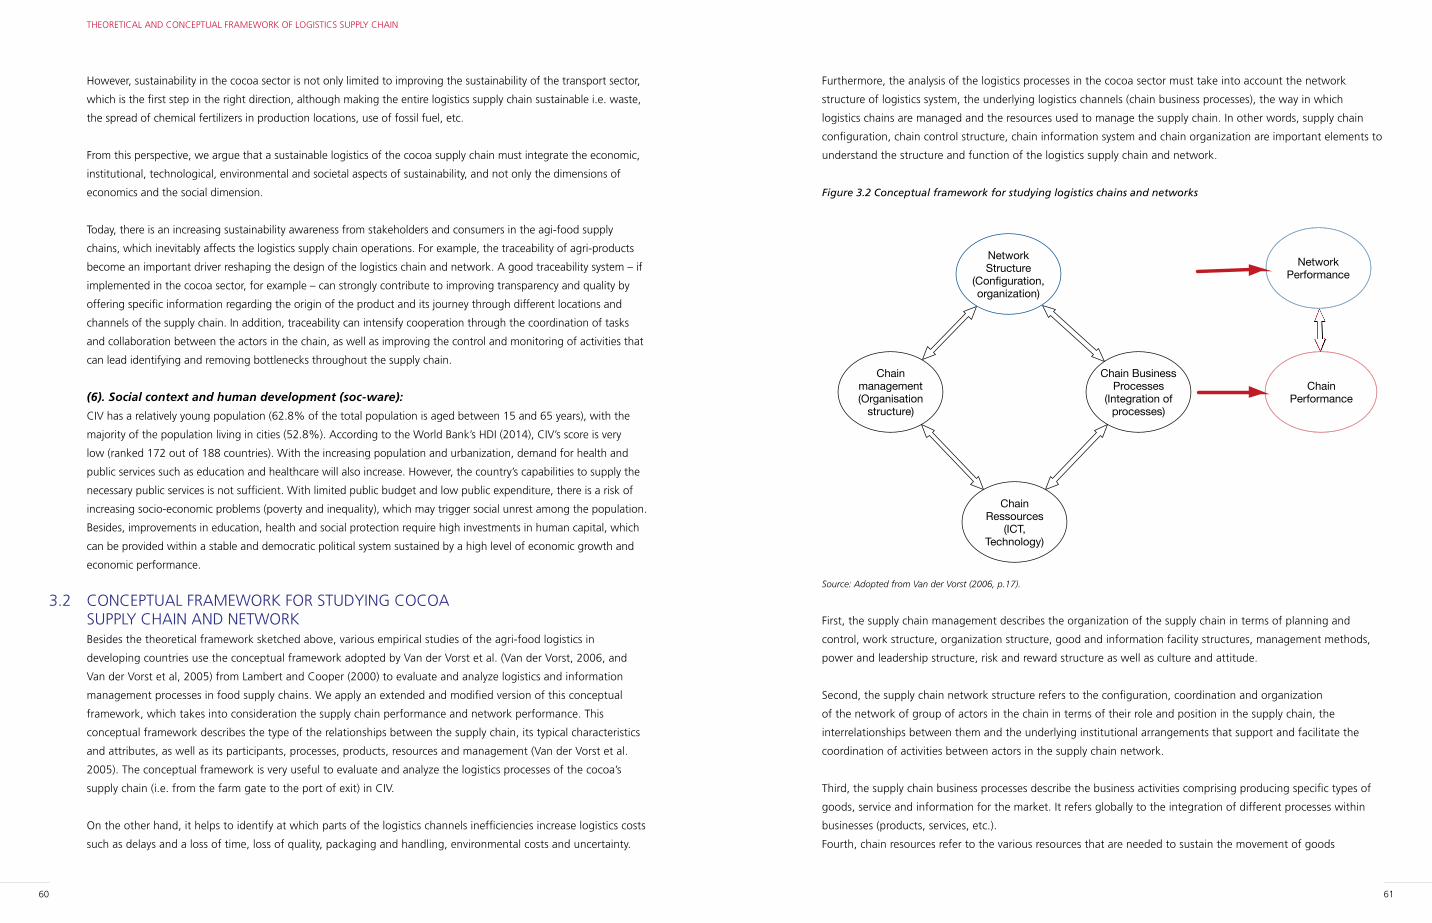
60 61
THEORETICAL AND CONCEPTUAL FRAMEWORK OF LOGISTICS SUPPLY CHAIN
Furthermore, the analysis of the logistics processes in the cocoa sector must take into account the network
structure of logistics system, the underlying logistics channels (chain business processes), the way in which
logistics chains are managed and the resources used to manage the supply chain. In other words, supply chain
configuration, chain control structure, chain information system and chain organization are important elements to
understand the structure and function of the logistics supply chain and network.
Figure 3.2 Conceptual framework for studying logistics chains and networks
Network Structure
(Configuration, organization)
Chain management(Organisation
structure)
Chain Business Processes
(Integration of processes)
Chain Ressources
(ICT, Technology)
Chain Performance
Network Performance
Improvement Opportunities
Source: Adopted from Van der Vorst (2006, p.17).
First, the supply chain management describes the organization of the supply chain in terms of planning and
control, work structure, organization structure, good and information facility structures, management methods,
power and leadership structure, risk and reward structure as well as culture and attitude.
Second, the supply chain network structure refers to the configuration, coordination and organization
of the network of group of actors in the chain in terms of their role and position in the supply chain, the
interrelationships between them and the underlying institutional arrangements that support and facilitate the
coordination of activities between actors in the supply chain network.
Third, the supply chain business processes describe the business activities comprising producing specific types of
goods, service and information for the market. It refers globally to the integration of different processes within
businesses (products, services, etc.).
Fourth, chain resources refer to the various resources that are needed to sustain the movement of goods
However, sustainability in the cocoa sector is not only limited to improving the sustainability of the transport sector,
which is the first step in the right direction, although making the entire logistics supply chain sustainable i.e. waste,
the spread of chemical fertilizers in production locations, use of fossil fuel, etc.
From this perspective, we argue that a sustainable logistics of the cocoa supply chain must integrate the economic,
institutional, technological, environmental and societal aspects of sustainability, and not only the dimensions of
economics and the social dimension.
Today, there is an increasing sustainability awareness from stakeholders and consumers in the agi-food supply
chains, which inevitably affects the logistics supply chain operations. For example, the traceability of agri-products
become an important driver reshaping the design of the logistics chain and network. A good traceability system – if
implemented in the cocoa sector, for example – can strongly contribute to improving transparency and quality by
offering specific information regarding the origin of the product and its journey through different locations and
channels of the supply chain. In addition, traceability can intensify cooperation through the coordination of tasks
and collaboration between the actors in the chain, as well as improving the control and monitoring of activities that
can lead identifying and removing bottlenecks throughout the supply chain.
(6). Social context and human development (soc-ware):
CIV has a relatively young population (62.8% of the total population is aged between 15 and 65 years), with the
majority of the population living in cities (52.8%). According to the World Bank’s HDI (2014), CIV’s score is very
low (ranked 172 out of 188 countries). With the increasing population and urbanization, demand for health and
public services such as education and healthcare will also increase. However, the country’s capabilities to supply the
necessary public services is not sufficient. With limited public budget and low public expenditure, there is a risk of
increasing socio-economic problems (poverty and inequality), which may trigger social unrest among the population.
Besides, improvements in education, health and social protection require high investments in human capital, which
can be provided within a stable and democratic political system sustained by a high level of economic growth and
economic performance.
3.2 CONCEPTUAL FRAMEWORK FOR STUDYING COCOA SUPPLY CHAIN AND NETWORKBesides the theoretical framework sketched above, various empirical studies of the agri-food logistics in
developing countries use the conceptual framework adopted by Van der Vorst et al. (Van der Vorst, 2006, and
Van der Vorst et al, 2005) from Lambert and Cooper (2000) to evaluate and analyze logistics and information
management processes in food supply chains. We apply an extended and modified version of this conceptual
framework, which takes into consideration the supply chain performance and network performance. This
conceptual framework describes the type of the relationships between the supply chain, its typical characteristics
and attributes, as well as its participants, processes, products, resources and management (Van der Vorst et al.
2005). The conceptual framework is very useful to evaluate and analyze the logistics processes of the cocoa’s
supply chain (i.e. from the farm gate to the port of exit) in CIV.
On the other hand, it helps to identify at which parts of the logistics channels inefficiencies increase logistics costs
such as delays and a loss of time, loss of quality, packaging and handling, environmental costs and uncertainty.
62 63
THEORETICAL AND CONCEPTUAL FRAMEWORK OF LOGISTICS SUPPLY CHAIN
derived from the sequence of transit and processing operations, i.e. costs of logistics services, as well as hidden
costs that reflect the time value related to delays, waiting time and loss of time due to the uncertainties (damage,
accidents, etc.).
The literature on the agri-food logistics supply chain and network has paid significant attention to the relationships
among actors in the logistics supply chain, as well as the management of supply chain and chain business processes,
the relevant network structure such as integration, coordination, collaboration and transaction costs issues.
However, as most of the literature is theoretical and abstract, there is a need for applied research on real-world cases
that may enrich the conceptual framework and extend the practical methodological tools in studying the logistics
supply chain and network. In this respect, increasing knowledge on how different logistics chains operate and
existing bottlenecks for improving efficiency and quality is important to establish an effective and efficient logistics
supply chain.
3.3 LOGISTICS OF THE COCOA SUPPLY CHAIN AND NETWORK IN CÔTE D’IVOIREThree types of cocoa supply chains have prevailed in the case of the cocoa sector in CIV: (i) the international supply
chain, where exporters reach the farmers/producers through traders/middlemen or through cooperatives; (ii) the
supply chain, where exporters/processors directly reach the primary producers; and (iii) the local supply chain, where
farmers/producers are reached by local traders through private buyers. The cocoa sector faces various challenges
ranging from production and harvest, transport, storage and inventories to quality control and export channels, etc.
A recent study conducted on the cocoa sector in CIV reveals a number of weaknesses of the supply chain (PoAI,
2017), such as: (i) the difficulty to meet world growing demand for high-quality cocoa due to the small size of
farms, low yields and lack of innovations in product and processes that make farming more effective and efficient
(PoAI., p. 20); (ii) the low level of use of new technologies for the better traceability of cocoa along the supply
chain; (iii) the high congestion at the port area and delays in shipments of cocoa due to inefficient administrative
processes and a lack of transparency, while quality control and customs clearance also take an unnecessary longer
time than needed (op cit, p.24); (iv) a lack of storage facilities/warehouses for semi-finished products that meet
the international standards, e.g. storage on clean pallets, enough ventilation, hygiene requirements and guidelines
for personnel (op cit., p. 15); (v) the poor quality of road infrastructure, which increases operating costs and
reduces speed, reliability and local capacity of truck shipments, while most of the transporters show predatory
practices (truck overloading, non-compliant operators) and a lack of professionalism and expertise in transport and
logistics processes; (vi) the difficulties of the companies to get their products to the market due to the fragmented
distribution network; and (v) a lack of transparency in business practices like the facilitation of payments made to
customs and police officials to keep products flowing through the supply chains.
Despite the identified challenges presented above, the study has identified a number of opportunities in the cocoa
sector that can be exploited to solve some aforementioned problems, as well as to transform the sector into a more
sustainable and competitive sector.
First, the trend in international demand for high-quality cocoa beans is increasing and will continue to increase in
the near future. With its abundance of natural resources (vast and fertile land, good climate, etc.), the country has
the potentialities to increase its comparative advantage and increase the volumes of production of cocoa to higher
and information between actors through the supply chain. Chain resources include people, production and
distribution facilities, warehouses, machines, new communication technologies and ICT (information, information
systems and information infrastructures).
When integrated, these four components of the supply chain can be applied to evaluate the performance of
the logistics supply chain and network and analyze the nature and source of constraints affecting the logistics
chain and network. In our case study of the logistics of the cocoa supply chain in CIV, the integration of the
components of supply chain management with supply chain processes and chain resources can shed light
on the under-performance of the supply chain and the underlying constraints and bottlenecks that limit the
development of the logistics supply chain. The integration of the supply chain networks structure with supply
chain management and supply chain processes will allow us to understand the strength and weaknesses of the
supply chain and network.
Improvement opportunities to improve the supply chain can also be considered as making part of the
configuration, control, information and the organization of the supply chain and network.
In order to develop and implement a wide logistics supply chain and network that capture various dimensions of
performance at various levels in a consistent way, an adequate and valuable set of indicators covering several levels
must be taken into account at different strategic levels, i.e. at the strategic, tactical and operational level.
Globally, the literature on agri-food supply chain takes into account the following (context-dependent) indicators
dedicated to evaluating the performance and trends in logistics practices:
> The physical state of road infrastructure and transport intensity (tons-km/total output).
> Facility network design, i.e. the location of stocking points, the position of inventory points in the network,
equipment selection, capacity planning, etc.
> Freight volume through the load capacity/factor of the vehicle by mode (ton/vehicle).
> Distance by transport mode (km), energy consumption and emissions.
> Vehicle utilization (vehicle-km/ton-km) and freight movements of goods by supply chain link (vehicle-km).
> Time costs, i.e. total time for transport and storage and related procedures (average and the maximum number
of hours/days).
> Transport and logistics costs, i.e. total costs of transport and storage and related procedures such as the total
time of document processing (hours/days) and control, as well as cost of logistics services and hidden costs (costs
of delays and uncertainties, including financial charges, obsolescence and loss of damaged or stolen goods).
Note that a wide diversity of indicators is used in the literature to evaluate the performance of the logistics supply
chain depending on the sector of activity, level of analysis (micro- meso- or macro-level) and geographical scale.
More generally, we make a distinction between two main type of indicators when calculating the costs of the supply
chain, namely transport and logistics costs. In contrast to transport costs, there are no specific indicators on logistics
at the national and sectoral level.
Transport costs are derived from the fixed and variable costs of operation processes, and the logistics costs are
64 65
THEORETICAL AND CONCEPTUAL FRAMEWORK OF LOGISTICS SUPPLY CHAIN
level if it manages to apply appropriate reforms and policy measures to modernize and restructure the sector and
improve the transport and logistics systems. Therefore, CIV is well placed to dominate cocoa production in the
world. If this happens, the country can derive higher revenues, which can provide a solid basis for implementing a
more sustainable supply chain.
Second, there is huge potential to increase cocoa consumption in the country due to the change in the demographic
structure of the population and the high level of the growth rate of the Ivorian economy. Growth opportunities
to increase the capacity of processing cocoa in CIV then become real, whether through FDI or private companies.
The benefits of value addition for cocoa producers include economic diversification, job creation, tax revenues and
indirectly the improvement of farmers’ incomes. In this respect, cocoa production and trade are means to improve
employment opportunities.
Finally, in order to achieve sustainability in production, incomes of farmers have to increased substantially. This
can be achieved through intensification and diversification of production and efficient use of resources. However,
farmers need to have access to financial credits to invest in their farms.
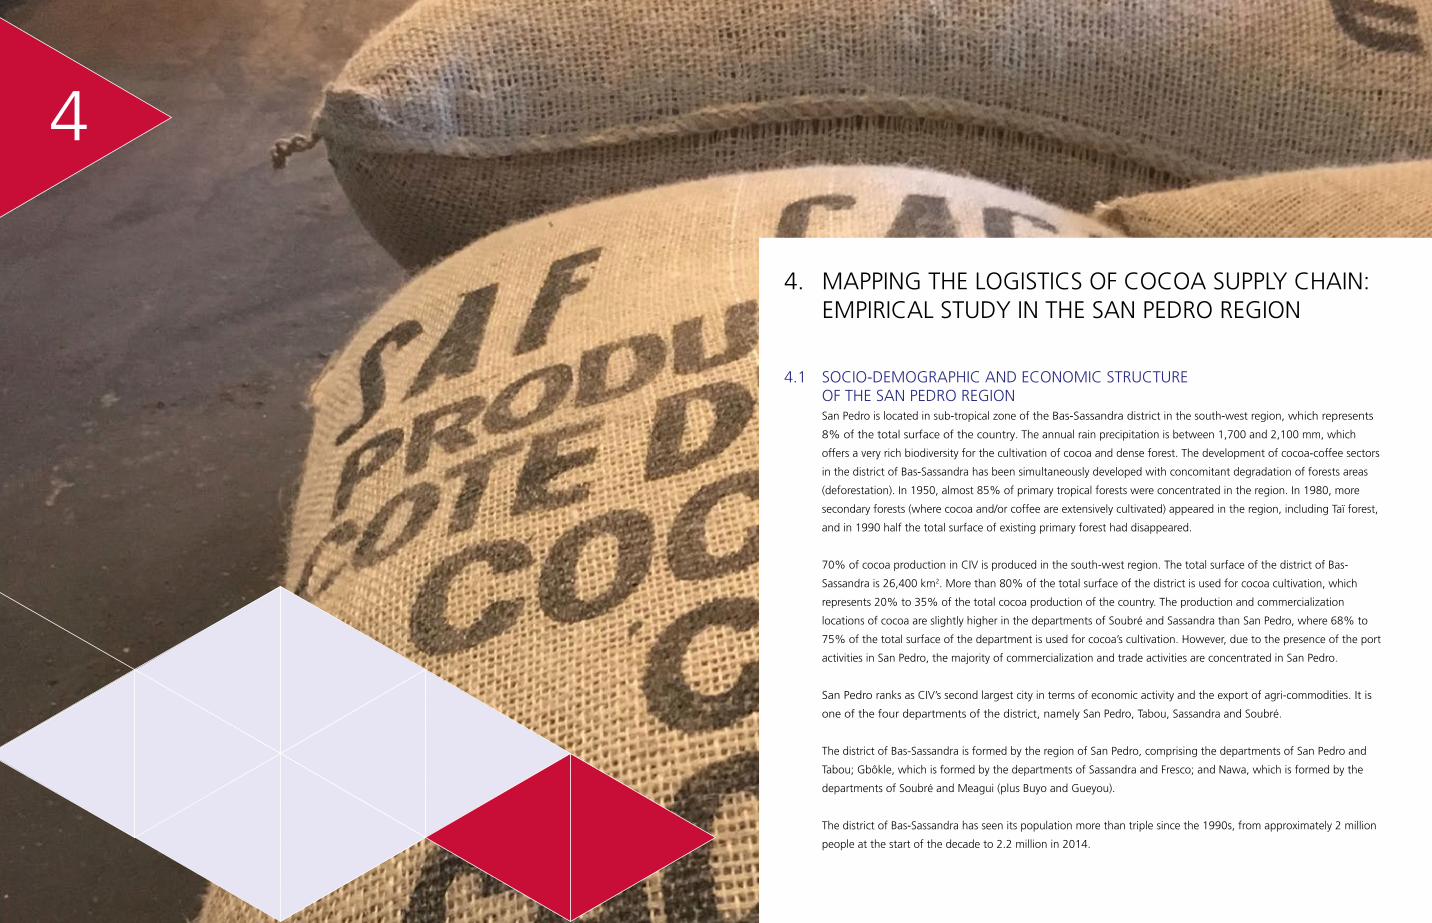
66 67
MAPPING THE LOGISTICS OF COCOA SUPPLY CHAIN: EMPIRICAL STUDY IN THE SAN PEDRO REGION
4
4. MAPPING THE LOGISTICS OF COCOA SUPPLY CHAIN: EMPIRICAL STUDY IN THE SAN PEDRO REGION
4.1 SOCIO-DEMOGRAPHIC AND ECONOMIC STRUCTURE OF THE SAN PEDRO REGIONSan Pedro is located in sub-tropical zone of the Bas-Sassandra district in the south-west region, which represents
8% of the total surface of the country. The annual rain precipitation is between 1,700 and 2,100 mm, which
offers a very rich biodiversity for the cultivation of cocoa and dense forest. The development of cocoa-coffee sectors
in the district of Bas-Sassandra has been simultaneously developed with concomitant degradation of forests areas
(deforestation). In 1950, almost 85% of primary tropical forests were concentrated in the region. In 1980, more
secondary forests (where cocoa and/or coffee are extensively cultivated) appeared in the region, including Taï forest,
and in 1990 half the total surface of existing primary forest had disappeared.
70% of cocoa production in CIV is produced in the south-west region. The total surface of the district of Bas-
Sassandra is 26,400 km2. More than 80% of the total surface of the district is used for cocoa cultivation, which
represents 20% to 35% of the total cocoa production of the country. The production and commercialization
locations of cocoa are slightly higher in the departments of Soubré and Sassandra than San Pedro, where 68% to
75% of the total surface of the department is used for cocoa’s cultivation. However, due to the presence of the port
activities in San Pedro, the majority of commercialization and trade activities are concentrated in San Pedro.
San Pedro ranks as CIV’s second largest city in terms of economic activity and the export of agri-commodities. It is
one of the four departments of the district, namely San Pedro, Tabou, Sassandra and Soubré.
The district of Bas-Sassandra is formed by the region of San Pedro, comprising the departments of San Pedro and
Tabou; Gbôkle, which is formed by the departments of Sassandra and Fresco; and Nawa, which is formed by the
departments of Soubré and Meagui (plus Buyo and Gueyou).
The district of Bas-Sassandra has seen its population more than triple since the 1990s, from approximately 2 million
people at the start of the decade to 2.2 million in 2014.
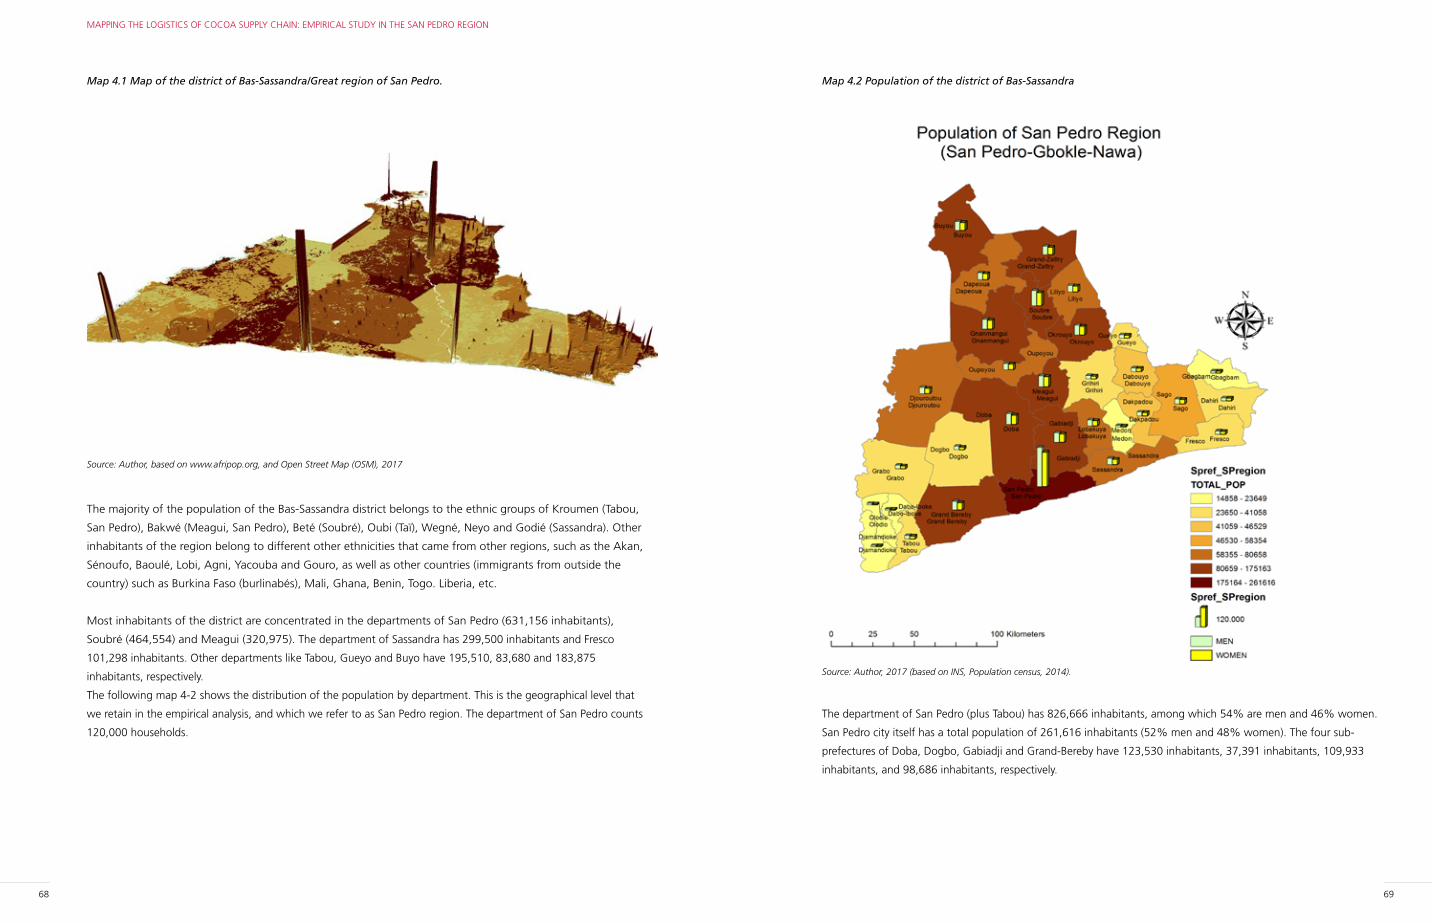
68 69
MAPPING THE LOGISTICS OF COCOA SUPPLY CHAIN: EMPIRICAL STUDY IN THE SAN PEDRO REGION
Map 4.2 Population of the district of Bas-Sassandra
Source: Author, 2017 (based on INS, Population census, 2014).
The department of San Pedro (plus Tabou) has 826,666 inhabitants, among which 54% are men and 46% women.
San Pedro city itself has a total population of 261,616 inhabitants (52% men and 48% women). The four sub-
prefectures of Doba, Dogbo, Gabiadji and Grand-Bereby have 123,530 inhabitants, 37,391 inhabitants, 109,933
inhabitants, and 98,686 inhabitants, respectively.
Map 4.1 Map of the district of Bas-Sassandra/Great region of San Pedro.
Source: Author, based on www.afripop.org, and Open Street Map (OSM), 2017
The majority of the population of the Bas-Sassandra district belongs to the ethnic groups of Kroumen (Tabou,
San Pedro), Bakwé (Meagui, San Pedro), Beté (Soubré), Oubi (Taï), Wegné, Neyo and Godié (Sassandra). Other
inhabitants of the region belong to different other ethnicities that came from other regions, such as the Akan,
Sénoufo, Baoulé, Lobi, Agni, Yacouba and Gouro, as well as other countries (immigrants from outside the
country) such as Burkina Faso (burlinabés), Mali, Ghana, Benin, Togo. Liberia, etc.
Most inhabitants of the district are concentrated in the departments of San Pedro (631,156 inhabitants),
Soubré (464,554) and Meagui (320,975). The department of Sassandra has 299,500 inhabitants and Fresco
101,298 inhabitants. Other departments like Tabou, Gueyo and Buyo have 195,510, 83,680 and 183,875
inhabitants, respectively.
The following map 4-2 shows the distribution of the population by department. This is the geographical level that
we retain in the empirical analysis, and which we refer to as San Pedro region. The department of San Pedro counts
120,000 households.
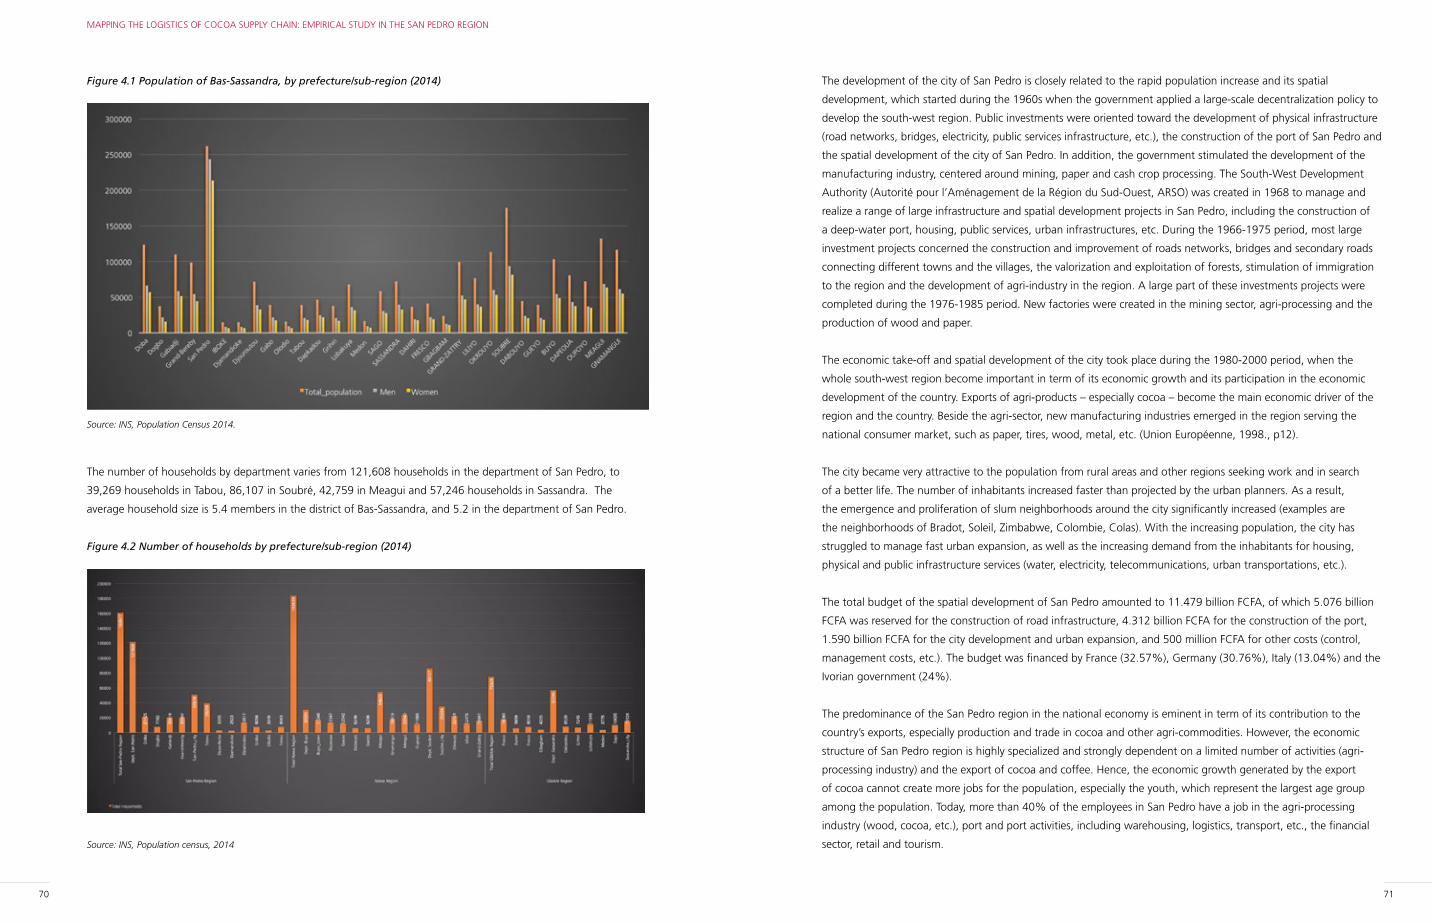
70 71
MAPPING THE LOGISTICS OF COCOA SUPPLY CHAIN: EMPIRICAL STUDY IN THE SAN PEDRO REGION
The development of the city of San Pedro is closely related to the rapid population increase and its spatial
development, which started during the 1960s when the government applied a large-scale decentralization policy to
develop the south-west region. Public investments were oriented toward the development of physical infrastructure
(road networks, bridges, electricity, public services infrastructure, etc.), the construction of the port of San Pedro and
the spatial development of the city of San Pedro. In addition, the government stimulated the development of the
manufacturing industry, centered around mining, paper and cash crop processing. The South-West Development
Authority (Autorité pour l’Aménagement de la Région du Sud-Ouest, ARSO) was created in 1968 to manage and
realize a range of large infrastructure and spatial development projects in San Pedro, including the construction of
a deep-water port, housing, public services, urban infrastructures, etc. During the 1966-1975 period, most large
investment projects concerned the construction and improvement of roads networks, bridges and secondary roads
connecting different towns and the villages, the valorization and exploitation of forests, stimulation of immigration
to the region and the development of agri-industry in the region. A large part of these investments projects were
completed during the 1976-1985 period. New factories were created in the mining sector, agri-processing and the
production of wood and paper.
The economic take-off and spatial development of the city took place during the 1980-2000 period, when the
whole south-west region become important in term of its economic growth and its participation in the economic
development of the country. Exports of agri-products – especially cocoa – become the main economic driver of the
region and the country. Beside the agri-sector, new manufacturing industries emerged in the region serving the
national consumer market, such as paper, tires, wood, metal, etc. (Union Européenne, 1998., p12).
The city became very attractive to the population from rural areas and other regions seeking work and in search
of a better life. The number of inhabitants increased faster than projected by the urban planners. As a result,
the emergence and proliferation of slum neighborhoods around the city significantly increased (examples are
the neighborhoods of Bradot, Soleil, Zimbabwe, Colombie, Colas). With the increasing population, the city has
struggled to manage fast urban expansion, as well as the increasing demand from the inhabitants for housing,
physical and public infrastructure services (water, electricity, telecommunications, urban transportations, etc.).
The total budget of the spatial development of San Pedro amounted to 11.479 billion FCFA, of which 5.076 billion
FCFA was reserved for the construction of road infrastructure, 4.312 billion FCFA for the construction of the port,
1.590 billion FCFA for the city development and urban expansion, and 500 million FCFA for other costs (control,
management costs, etc.). The budget was financed by France (32.57%), Germany (30.76%), Italy (13.04%) and the
Ivorian government (24%).
The predominance of the San Pedro region in the national economy is eminent in term of its contribution to the
country’s exports, especially production and trade in cocoa and other agri-commodities. However, the economic
structure of San Pedro region is highly specialized and strongly dependent on a limited number of activities (agri-
processing industry) and the export of cocoa and coffee. Hence, the economic growth generated by the export
of cocoa cannot create more jobs for the population, especially the youth, which represent the largest age group
among the population. Today, more than 40% of the employees in San Pedro have a job in the agri-processing
industry (wood, cocoa, etc.), port and port activities, including warehousing, logistics, transport, etc., the financial
sector, retail and tourism.
Figure 4.1 Population of Bas-Sassandra, by prefecture/sub-region (2014)
Source: INS, Population Census 2014.
The number of households by department varies from 121,608 households in the department of San Pedro, to
39,269 households in Tabou, 86,107 in Soubré, 42,759 in Meagui and 57,246 households in Sassandra. The
average household size is 5.4 members in the district of Bas-Sassandra, and 5.2 in the department of San Pedro.
Figure 4.2 Number of households by prefecture/sub-region (2014)
Source: INS, Population census, 2014
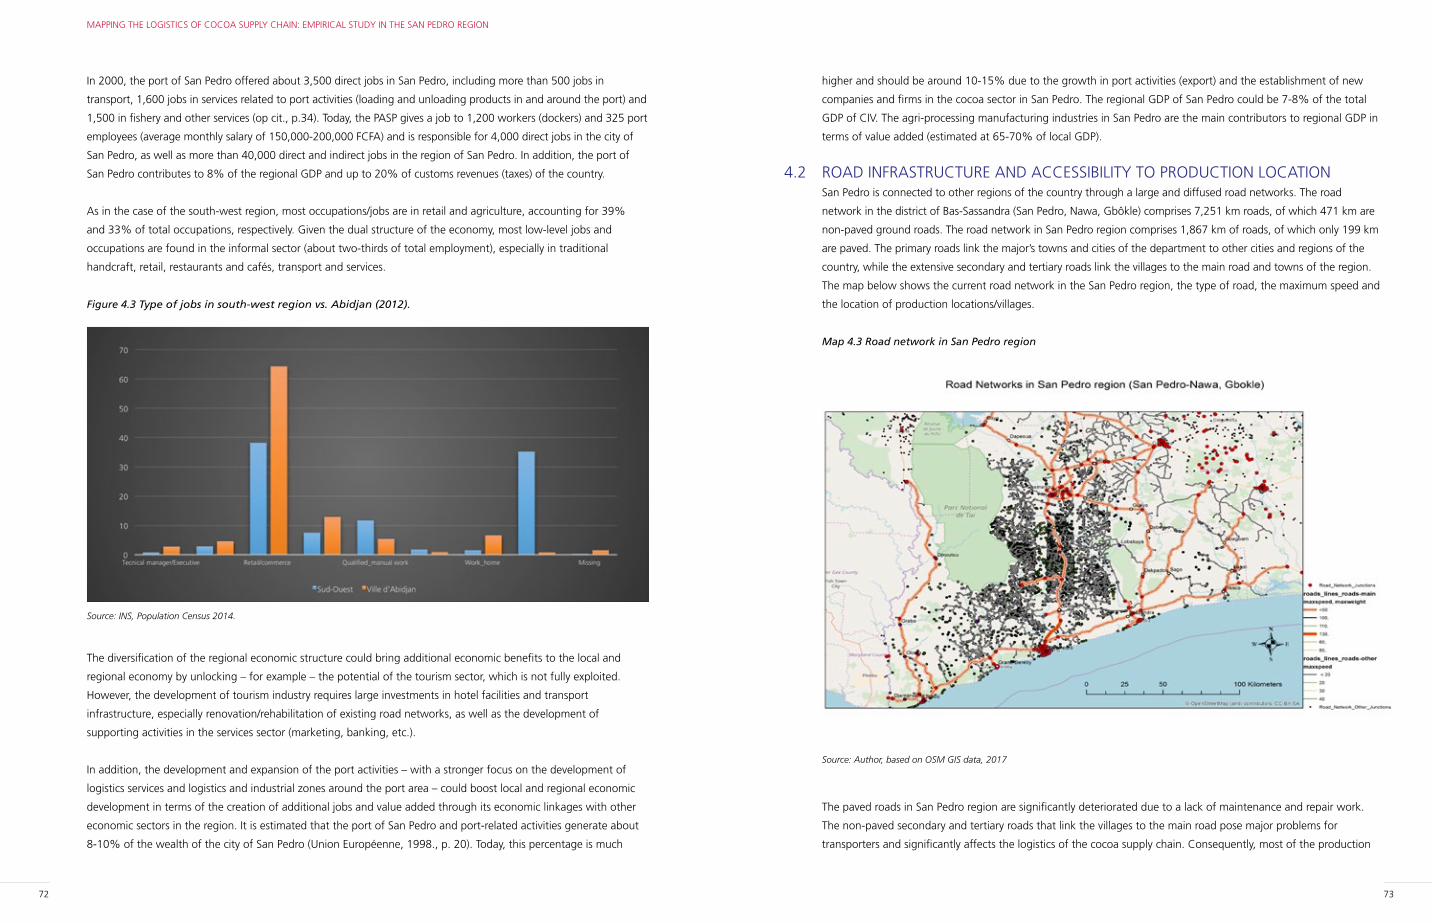
72 73
MAPPING THE LOGISTICS OF COCOA SUPPLY CHAIN: EMPIRICAL STUDY IN THE SAN PEDRO REGION
higher and should be around 10-15% due to the growth in port activities (export) and the establishment of new
companies and firms in the cocoa sector in San Pedro. The regional GDP of San Pedro could be 7-8% of the total
GDP of CIV. The agri-processing manufacturing industries in San Pedro are the main contributors to regional GDP in
terms of value added (estimated at 65-70% of local GDP).
4.2 ROAD INFRASTRUCTURE AND ACCESSIBILITY TO PRODUCTION LOCATION San Pedro is connected to other regions of the country through a large and diffused road networks. The road
network in the district of Bas-Sassandra (San Pedro, Nawa, Gbôkle) comprises 7,251 km roads, of which 471 km are
non-paved ground roads. The road network in San Pedro region comprises 1,867 km of roads, of which only 199 km
are paved. The primary roads link the major’s towns and cities of the department to other cities and regions of the
country, while the extensive secondary and tertiary roads link the villages to the main road and towns of the region.
The map below shows the current road network in the San Pedro region, the type of road, the maximum speed and
the location of production locations/villages.
Map 4.3 Road network in San Pedro region
Source: Author, based on OSM GIS data, 2017
The paved roads in San Pedro region are significantly deteriorated due to a lack of maintenance and repair work.
The non-paved secondary and tertiary roads that link the villages to the main road pose major problems for
transporters and significantly affects the logistics of the cocoa supply chain. Consequently, most of the production
In 2000, the port of San Pedro offered about 3,500 direct jobs in San Pedro, including more than 500 jobs in
transport, 1,600 jobs in services related to port activities (loading and unloading products in and around the port) and
1,500 in fishery and other services (op cit., p.34). Today, the PASP gives a job to 1,200 workers (dockers) and 325 port
employees (average monthly salary of 150,000-200,000 FCFA) and is responsible for 4,000 direct jobs in the city of
San Pedro, as well as more than 40,000 direct and indirect jobs in the region of San Pedro. In addition, the port of
San Pedro contributes to 8% of the regional GDP and up to 20% of customs revenues (taxes) of the country.
As in the case of the south-west region, most occupations/jobs are in retail and agriculture, accounting for 39%
and 33% of total occupations, respectively. Given the dual structure of the economy, most low-level jobs and
occupations are found in the informal sector (about two-thirds of total employment), especially in traditional
handcraft, retail, restaurants and cafés, transport and services.
Figure 4.3 Type of jobs in south-west region vs. Abidjan (2012).
Source: INS, Population Census 2014.
The diversification of the regional economic structure could bring additional economic benefits to the local and
regional economy by unlocking – for example – the potential of the tourism sector, which is not fully exploited.
However, the development of tourism industry requires large investments in hotel facilities and transport
infrastructure, especially renovation/rehabilitation of existing road networks, as well as the development of
supporting activities in the services sector (marketing, banking, etc.).
In addition, the development and expansion of the port activities – with a stronger focus on the development of
logistics services and logistics and industrial zones around the port area – could boost local and regional economic
development in terms of the creation of additional jobs and value added through its economic linkages with other
economic sectors in the region. It is estimated that the port of San Pedro and port-related activities generate about
8-10% of the wealth of the city of San Pedro (Union Européenne, 1998., p. 20). Today, this percentage is much
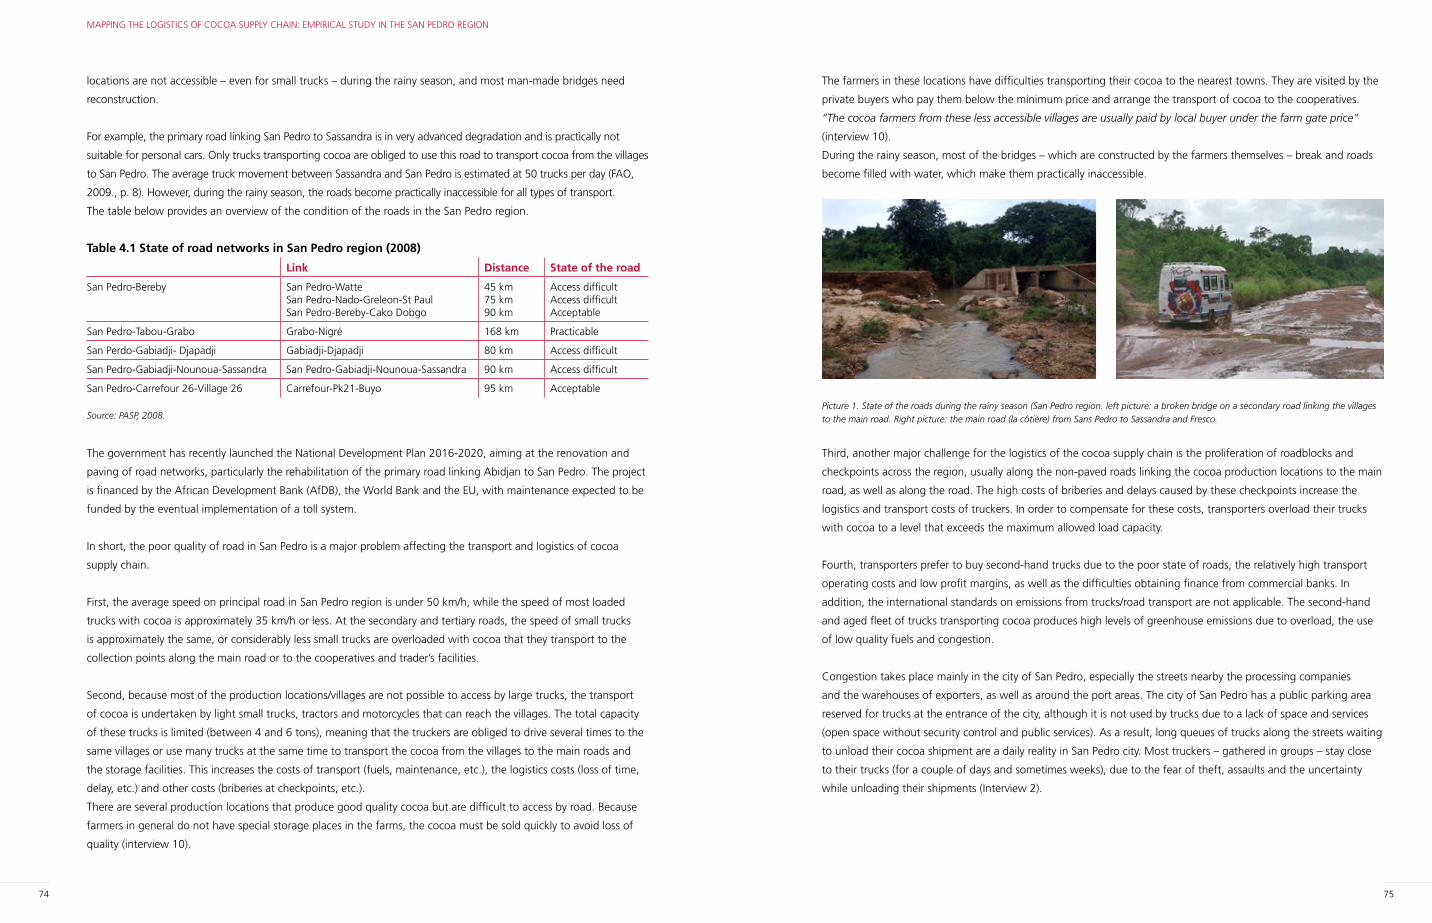
74 75
MAPPING THE LOGISTICS OF COCOA SUPPLY CHAIN: EMPIRICAL STUDY IN THE SAN PEDRO REGION
The farmers in these locations have difficulties transporting their cocoa to the nearest towns. They are visited by the
private buyers who pay them below the minimum price and arrange the transport of cocoa to the cooperatives.
“The cocoa farmers from these less accessible villages are usually paid by local buyer under the farm gate price”
(interview 10).
During the rainy season, most of the bridges – which are constructed by the farmers themselves – break and roads
become filled with water, which make them practically inaccessible.
Picture 1. State of the roads during the rainy season (San Pedro region. left picture: a broken bridge on a secondary road linking the villages
to the main road. Right picture: the main road (la côtière) from Sans Pedro to Sassandra and Fresco.
Third, another major challenge for the logistics of the cocoa supply chain is the proliferation of roadblocks and
checkpoints across the region, usually along the non-paved roads linking the cocoa production locations to the main
road, as well as along the road. The high costs of briberies and delays caused by these checkpoints increase the
logistics and transport costs of truckers. In order to compensate for these costs, transporters overload their trucks
with cocoa to a level that exceeds the maximum allowed load capacity.
Fourth, transporters prefer to buy second-hand trucks due to the poor state of roads, the relatively high transport
operating costs and low profit margins, as well as the difficulties obtaining finance from commercial banks. In
addition, the international standards on emissions from trucks/road transport are not applicable. The second-hand
and aged fleet of trucks transporting cocoa produces high levels of greenhouse emissions due to overload, the use
of low quality fuels and congestion.
Congestion takes place mainly in the city of San Pedro, especially the streets nearby the processing companies
and the warehouses of exporters, as well as around the port areas. The city of San Pedro has a public parking area
reserved for trucks at the entrance of the city, although it is not used by trucks due to a lack of space and services
(open space without security control and public services). As a result, long queues of trucks along the streets waiting
to unload their cocoa shipment are a daily reality in San Pedro city. Most truckers – gathered in groups – stay close
to their trucks (for a couple of days and sometimes weeks), due to the fear of theft, assaults and the uncertainty
while unloading their shipments (Interview 2).
locations are not accessible – even for small trucks – during the rainy season, and most man-made bridges need
reconstruction.
For example, the primary road linking San Pedro to Sassandra is in very advanced degradation and is practically not
suitable for personal cars. Only trucks transporting cocoa are obliged to use this road to transport cocoa from the villages
to San Pedro. The average truck movement between Sassandra and San Pedro is estimated at 50 trucks per day (FAO,
2009., p. 8). However, during the rainy season, the roads become practically inaccessible for all types of transport.
The table below provides an overview of the condition of the roads in the San Pedro region.
Table 4.1 State of road networks in San Pedro region (2008)
Link Distance State of the road
San Pedro-Bereby San Pedro-WatteSan Pedro-Nado-Greleon-St PaulSan Pedro-Bereby-Cako Dobgo
45 km75 km90 km
Access difficult Access difficult Acceptable
San Pedro-Tabou-Grabo Grabo-Nigré 168 km Practicable
San Perdo-Gabiadji- Djapadji Gabiadji-Djapadji 80 km Access difficult
San Pedro-Gabiadji-Nounoua-Sassandra San Pedro-Gabiadji-Nounoua-Sassandra 90 km Access difficult
San Pedro-Carrefour 26-Village 26 Carrefour-Pk21-Buyo 95 km Acceptable
Source: PASP, 2008.
The government has recently launched the National Development Plan 2016-2020, aiming at the renovation and
paving of road networks, particularly the rehabilitation of the primary road linking Abidjan to San Pedro. The project
is financed by the African Development Bank (AfDB), the World Bank and the EU, with maintenance expected to be
funded by the eventual implementation of a toll system.
In short, the poor quality of road in San Pedro is a major problem affecting the transport and logistics of cocoa
supply chain.
First, the average speed on principal road in San Pedro region is under 50 km/h, while the speed of most loaded
trucks with cocoa is approximately 35 km/h or less. At the secondary and tertiary roads, the speed of small trucks
is approximately the same, or considerably less small trucks are overloaded with cocoa that they transport to the
collection points along the main road or to the cooperatives and trader’s facilities.
Second, because most of the production locations/villages are not possible to access by large trucks, the transport
of cocoa is undertaken by light small trucks, tractors and motorcycles that can reach the villages. The total capacity
of these trucks is limited (between 4 and 6 tons), meaning that the truckers are obliged to drive several times to the
same villages or use many trucks at the same time to transport the cocoa from the villages to the main roads and
the storage facilities. This increases the costs of transport (fuels, maintenance, etc.), the logistics costs (loss of time,
delay, etc.) and other costs (briberies at checkpoints, etc.).
There are several production locations that produce good quality cocoa but are difficult to access by road. Because
farmers in general do not have special storage places in the farms, the cocoa must be sold quickly to avoid loss of
quality (interview 10).
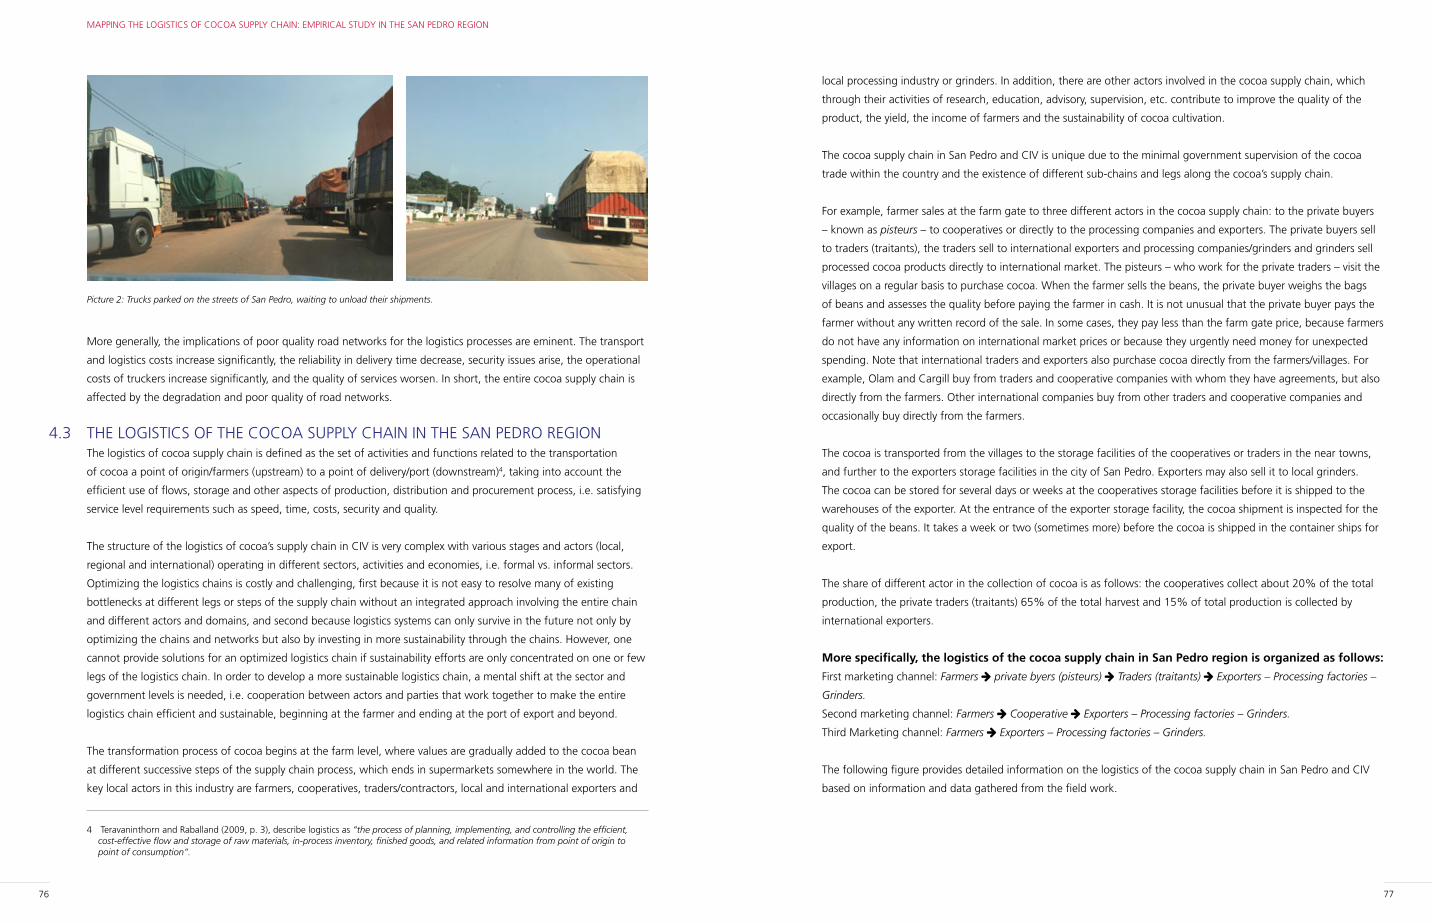
76 77
MAPPING THE LOGISTICS OF COCOA SUPPLY CHAIN: EMPIRICAL STUDY IN THE SAN PEDRO REGION
local processing industry or grinders. In addition, there are other actors involved in the cocoa supply chain, which
through their activities of research, education, advisory, supervision, etc. contribute to improve the quality of the
product, the yield, the income of farmers and the sustainability of cocoa cultivation.
The cocoa supply chain in San Pedro and CIV is unique due to the minimal government supervision of the cocoa
trade within the country and the existence of different sub-chains and legs along the cocoa’s supply chain.
For example, farmer sales at the farm gate to three different actors in the cocoa supply chain: to the private buyers
– known as pisteurs – to cooperatives or directly to the processing companies and exporters. The private buyers sell
to traders (traitants), the traders sell to international exporters and processing companies/grinders and grinders sell
processed cocoa products directly to international market. The pisteurs – who work for the private traders – visit the
villages on a regular basis to purchase cocoa. When the farmer sells the beans, the private buyer weighs the bags
of beans and assesses the quality before paying the farmer in cash. It is not unusual that the private buyer pays the
farmer without any written record of the sale. In some cases, they pay less than the farm gate price, because farmers
do not have any information on international market prices or because they urgently need money for unexpected
spending. Note that international traders and exporters also purchase cocoa directly from the farmers/villages. For
example, Olam and Cargill buy from traders and cooperative companies with whom they have agreements, but also
directly from the farmers. Other international companies buy from other traders and cooperative companies and
occasionally buy directly from the farmers.
The cocoa is transported from the villages to the storage facilities of the cooperatives or traders in the near towns,
and further to the exporters storage facilities in the city of San Pedro. Exporters may also sell it to local grinders.
The cocoa can be stored for several days or weeks at the cooperatives storage facilities before it is shipped to the
warehouses of the exporter. At the entrance of the exporter storage facility, the cocoa shipment is inspected for the
quality of the beans. It takes a week or two (sometimes more) before the cocoa is shipped in the container ships for
export.
The share of different actor in the collection of cocoa is as follows: the cooperatives collect about 20% of the total
production, the private traders (traitants) 65% of the total harvest and 15% of total production is collected by
international exporters.
More specifically, the logistics of the cocoa supply chain in San Pedro region is organized as follows:
First marketing channel: Farmers private byers (pisteurs) Traders (traitants) Exporters – Processing factories –
Grinders.
Second marketing channel: Farmers Cooperative Exporters – Processing factories – Grinders.
Third Marketing channel: Farmers Exporters – Processing factories – Grinders.
The following figure provides detailed information on the logistics of the cocoa supply chain in San Pedro and CIV
based on information and data gathered from the field work.
Picture 2: Trucks parked on the streets of San Pedro, waiting to unload their shipments.
More generally, the implications of poor quality road networks for the logistics processes are eminent. The transport
and logistics costs increase significantly, the reliability in delivery time decrease, security issues arise, the operational
costs of truckers increase significantly, and the quality of services worsen. In short, the entire cocoa supply chain is
affected by the degradation and poor quality of road networks.
4.3 THE LOGISTICS OF THE COCOA SUPPLY CHAIN IN THE SAN PEDRO REGIONThe logistics of cocoa supply chain is defined as the set of activities and functions related to the transportation
of cocoa a point of origin/farmers (upstream) to a point of delivery/port (downstream)4, taking into account the
efficient use of flows, storage and other aspects of production, distribution and procurement process, i.e. satisfying
service level requirements such as speed, time, costs, security and quality.
The structure of the logistics of cocoa’s supply chain in CIV is very complex with various stages and actors (local,
regional and international) operating in different sectors, activities and economies, i.e. formal vs. informal sectors.
Optimizing the logistics chains is costly and challenging, first because it is not easy to resolve many of existing
bottlenecks at different legs or steps of the supply chain without an integrated approach involving the entire chain
and different actors and domains, and second because logistics systems can only survive in the future not only by
optimizing the chains and networks but also by investing in more sustainability through the chains. However, one
cannot provide solutions for an optimized logistics chain if sustainability efforts are only concentrated on one or few
legs of the logistics chain. In order to develop a more sustainable logistics chain, a mental shift at the sector and
government levels is needed, i.e. cooperation between actors and parties that work together to make the entire
logistics chain efficient and sustainable, beginning at the farmer and ending at the port of export and beyond.
The transformation process of cocoa begins at the farm level, where values are gradually added to the cocoa bean
at different successive steps of the supply chain process, which ends in supermarkets somewhere in the world. The
key local actors in this industry are farmers, cooperatives, traders/contractors, local and international exporters and
4 Teravaninthorn and Raballand (2009, p. 3), describe logistics as “the process of planning, implementing, and controlling the efficient, cost-effective flow and storage of raw materials, in-process inventory, finished goods, and related information from point of origin to point of consumption”.
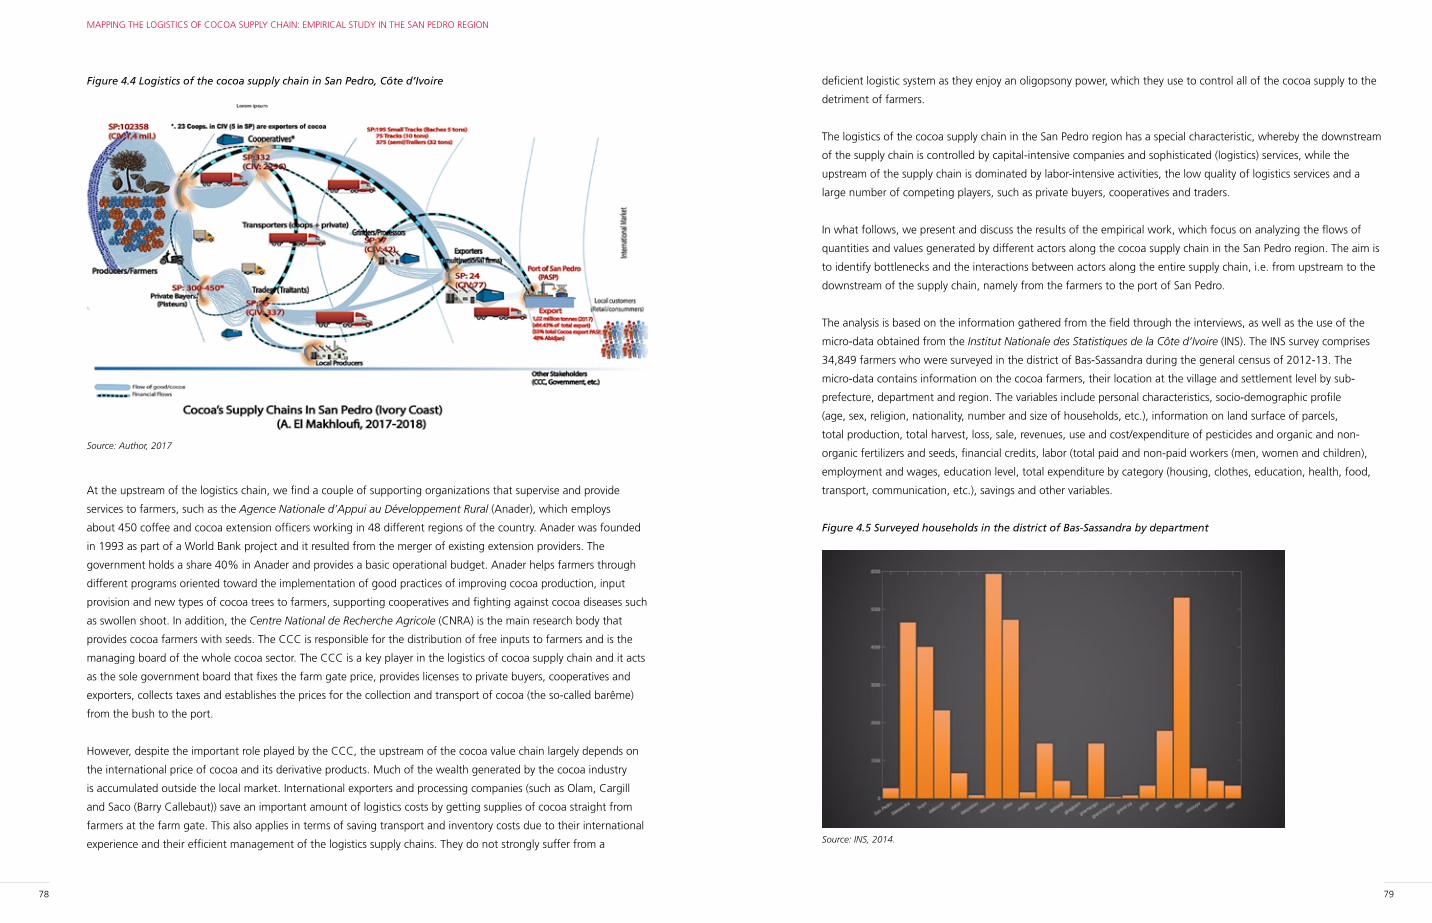
78 79
MAPPING THE LOGISTICS OF COCOA SUPPLY CHAIN: EMPIRICAL STUDY IN THE SAN PEDRO REGION
deficient logistic system as they enjoy an oligopsony power, which they use to control all of the cocoa supply to the
detriment of farmers.
The logistics of the cocoa supply chain in the San Pedro region has a special characteristic, whereby the downstream
of the supply chain is controlled by capital-intensive companies and sophisticated (logistics) services, while the
upstream of the supply chain is dominated by labor-intensive activities, the low quality of logistics services and a
large number of competing players, such as private buyers, cooperatives and traders.
In what follows, we present and discuss the results of the empirical work, which focus on analyzing the flows of
quantities and values generated by different actors along the cocoa supply chain in the San Pedro region. The aim is
to identify bottlenecks and the interactions between actors along the entire supply chain, i.e. from upstream to the
downstream of the supply chain, namely from the farmers to the port of San Pedro.
The analysis is based on the information gathered from the field through the interviews, as well as the use of the
micro-data obtained from the Institut Nationale des Statistiques de la Côte d’Ivoire (INS). The INS survey comprises
34,849 farmers who were surveyed in the district of Bas-Sassandra during the general census of 2012-13. The
micro-data contains information on the cocoa farmers, their location at the village and settlement level by sub-
prefecture, department and region. The variables include personal characteristics, socio-demographic profile
(age, sex, religion, nationality, number and size of households, etc.), information on land surface of parcels,
total production, total harvest, loss, sale, revenues, use and cost/expenditure of pesticides and organic and non-
organic fertilizers and seeds, financial credits, labor (total paid and non-paid workers (men, women and children),
employment and wages, education level, total expenditure by category (housing, clothes, education, health, food,
transport, communication, etc.), savings and other variables.
Figure 4.5 Surveyed households in the district of Bas-Sassandra by department
Source: INS, 2014.
Figure 4.4 Logistics of the cocoa supply chain in San Pedro, Côte d’Ivoire
Source: Author, 2017
At the upstream of the logistics chain, we find a couple of supporting organizations that supervise and provide
services to farmers, such as the Agence Nationale d’Appui au Développement Rural (Anader), which employs
about 450 coffee and cocoa extension officers working in 48 different regions of the country. Anader was founded
in 1993 as part of a World Bank project and it resulted from the merger of existing extension providers. The
government holds a share 40% in Anader and provides a basic operational budget. Anader helps farmers through
different programs oriented toward the implementation of good practices of improving cocoa production, input
provision and new types of cocoa trees to farmers, supporting cooperatives and fighting against cocoa diseases such
as swollen shoot. In addition, the Centre National de Recherche Agricole (CNRA) is the main research body that
provides cocoa farmers with seeds. The CCC is responsible for the distribution of free inputs to farmers and is the
managing board of the whole cocoa sector. The CCC is a key player in the logistics of cocoa supply chain and it acts
as the sole government board that fixes the farm gate price, provides licenses to private buyers, cooperatives and
exporters, collects taxes and establishes the prices for the collection and transport of cocoa (the so-called barême)
from the bush to the port.
However, despite the important role played by the CCC, the upstream of the cocoa value chain largely depends on
the international price of cocoa and its derivative products. Much of the wealth generated by the cocoa industry
is accumulated outside the local market. International exporters and processing companies (such as Olam, Cargill
and Saco (Barry Callebaut)) save an important amount of logistics costs by getting supplies of cocoa straight from
farmers at the farm gate. This also applies in terms of saving transport and inventory costs due to their international
experience and their efficient management of the logistics supply chains. They do not strongly suffer from a
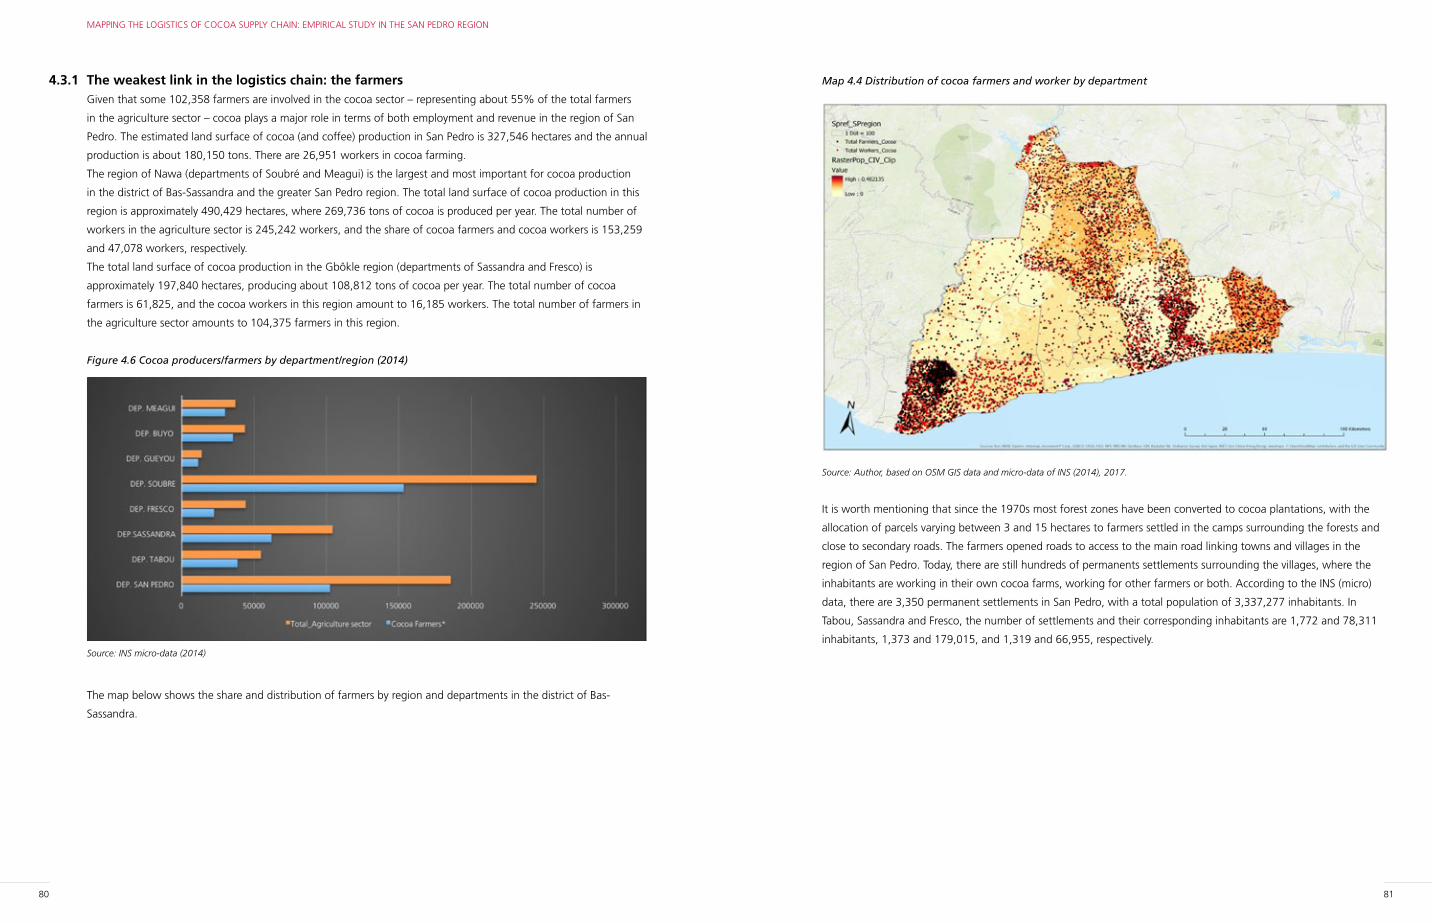
80 81
MAPPING THE LOGISTICS OF COCOA SUPPLY CHAIN: EMPIRICAL STUDY IN THE SAN PEDRO REGION
Map 4.4 Distribution of cocoa farmers and worker by department
Source: Author, based on OSM GIS data and micro-data of INS (2014), 2017.
It is worth mentioning that since the 1970s most forest zones have been converted to cocoa plantations, with the
allocation of parcels varying between 3 and 15 hectares to farmers settled in the camps surrounding the forests and
close to secondary roads. The farmers opened roads to access to the main road linking towns and villages in the
region of San Pedro. Today, there are still hundreds of permanents settlements surrounding the villages, where the
inhabitants are working in their own cocoa farms, working for other farmers or both. According to the INS (micro)
data, there are 3,350 permanent settlements in San Pedro, with a total population of 3,337,277 inhabitants. In
Tabou, Sassandra and Fresco, the number of settlements and their corresponding inhabitants are 1,772 and 78,311
inhabitants, 1,373 and 179,015, and 1,319 and 66,955, respectively.
4.3.1 The weakest link in the logistics chain: the farmersGiven that some 102,358 farmers are involved in the cocoa sector – representing about 55% of the total farmers
in the agriculture sector – cocoa plays a major role in terms of both employment and revenue in the region of San
Pedro. The estimated land surface of cocoa (and coffee) production in San Pedro is 327,546 hectares and the annual
production is about 180,150 tons. There are 26,951 workers in cocoa farming.
The region of Nawa (departments of Soubré and Meagui) is the largest and most important for cocoa production
in the district of Bas-Sassandra and the greater San Pedro region. The total land surface of cocoa production in this
region is approximately 490,429 hectares, where 269,736 tons of cocoa is produced per year. The total number of
workers in the agriculture sector is 245,242 workers, and the share of cocoa farmers and cocoa workers is 153,259
and 47,078 workers, respectively.
The total land surface of cocoa production in the Gbôkle region (departments of Sassandra and Fresco) is
approximately 197,840 hectares, producing about 108,812 tons of cocoa per year. The total number of cocoa
farmers is 61,825, and the cocoa workers in this region amount to 16,185 workers. The total number of farmers in
the agriculture sector amounts to 104,375 farmers in this region.
Figure 4.6 Cocoa producers/farmers by department/region (2014)
Source: INS micro-data (2014)
The map below shows the share and distribution of farmers by region and departments in the district of Bas-
Sassandra.
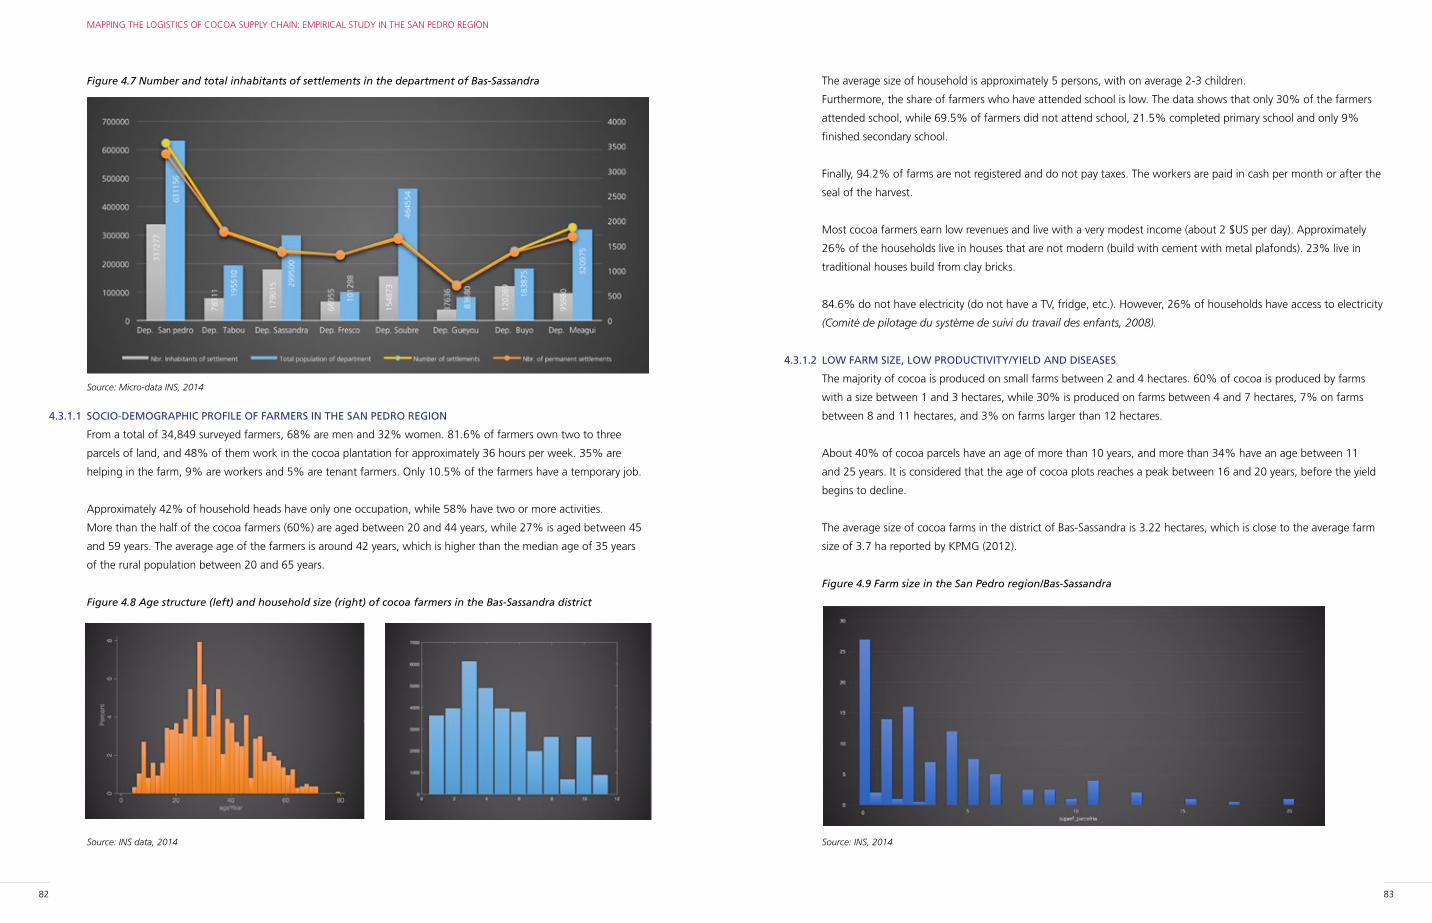
82 83
MAPPING THE LOGISTICS OF COCOA SUPPLY CHAIN: EMPIRICAL STUDY IN THE SAN PEDRO REGION
The average size of household is approximately 5 persons, with on average 2-3 children.
Furthermore, the share of farmers who have attended school is low. The data shows that only 30% of the farmers
attended school, while 69.5% of farmers did not attend school, 21.5% completed primary school and only 9%
finished secondary school.
Finally, 94.2% of farms are not registered and do not pay taxes. The workers are paid in cash per month or after the
seal of the harvest.
Most cocoa farmers earn low revenues and live with a very modest income (about 2 $US per day). Approximately
26% of the households live in houses that are not modern (build with cement with metal plafonds). 23% live in
traditional houses build from clay bricks.
84.6% do not have electricity (do not have a TV, fridge, etc.). However, 26% of households have access to electricity
(Comité de pilotage du système de suivi du travail des enfants, 2008).
4.3.1.2 LOW FARM SIZE, LOW PRODUCTIVITY/YIELD AND DISEASES
The majority of cocoa is produced on small farms between 2 and 4 hectares. 60% of cocoa is produced by farms
with a size between 1 and 3 hectares, while 30% is produced on farms between 4 and 7 hectares, 7% on farms
between 8 and 11 hectares, and 3% on farms larger than 12 hectares.
About 40% of cocoa parcels have an age of more than 10 years, and more than 34% have an age between 11
and 25 years. It is considered that the age of cocoa plots reaches a peak between 16 and 20 years, before the yield
begins to decline.
The average size of cocoa farms in the district of Bas-Sassandra is 3.22 hectares, which is close to the average farm
size of 3.7 ha reported by KPMG (2012).
Figure 4.9 Farm size in the San Pedro region/Bas-Sassandra
Source: INS, 2014
Figure 4.7 Number and total inhabitants of settlements in the department of Bas-Sassandra
Source: Micro-data INS, 2014
4.3.1.1 SOCIO-DEMOGRAPHIC PROFILE OF FARMERS IN THE SAN PEDRO REGION
From a total of 34,849 surveyed farmers, 68% are men and 32% women. 81.6% of farmers own two to three
parcels of land, and 48% of them work in the cocoa plantation for approximately 36 hours per week. 35% are
helping in the farm, 9% are workers and 5% are tenant farmers. Only 10.5% of the farmers have a temporary job.
Approximately 42% of household heads have only one occupation, while 58% have two or more activities.
More than the half of the cocoa farmers (60%) are aged between 20 and 44 years, while 27% is aged between 45
and 59 years. The average age of the farmers is around 42 years, which is higher than the median age of 35 years
of the rural population between 20 and 65 years.
Figure 4.8 Age structure (left) and household size (right) of cocoa farmers in the Bas-Sassandra district
Source: INS data, 2014
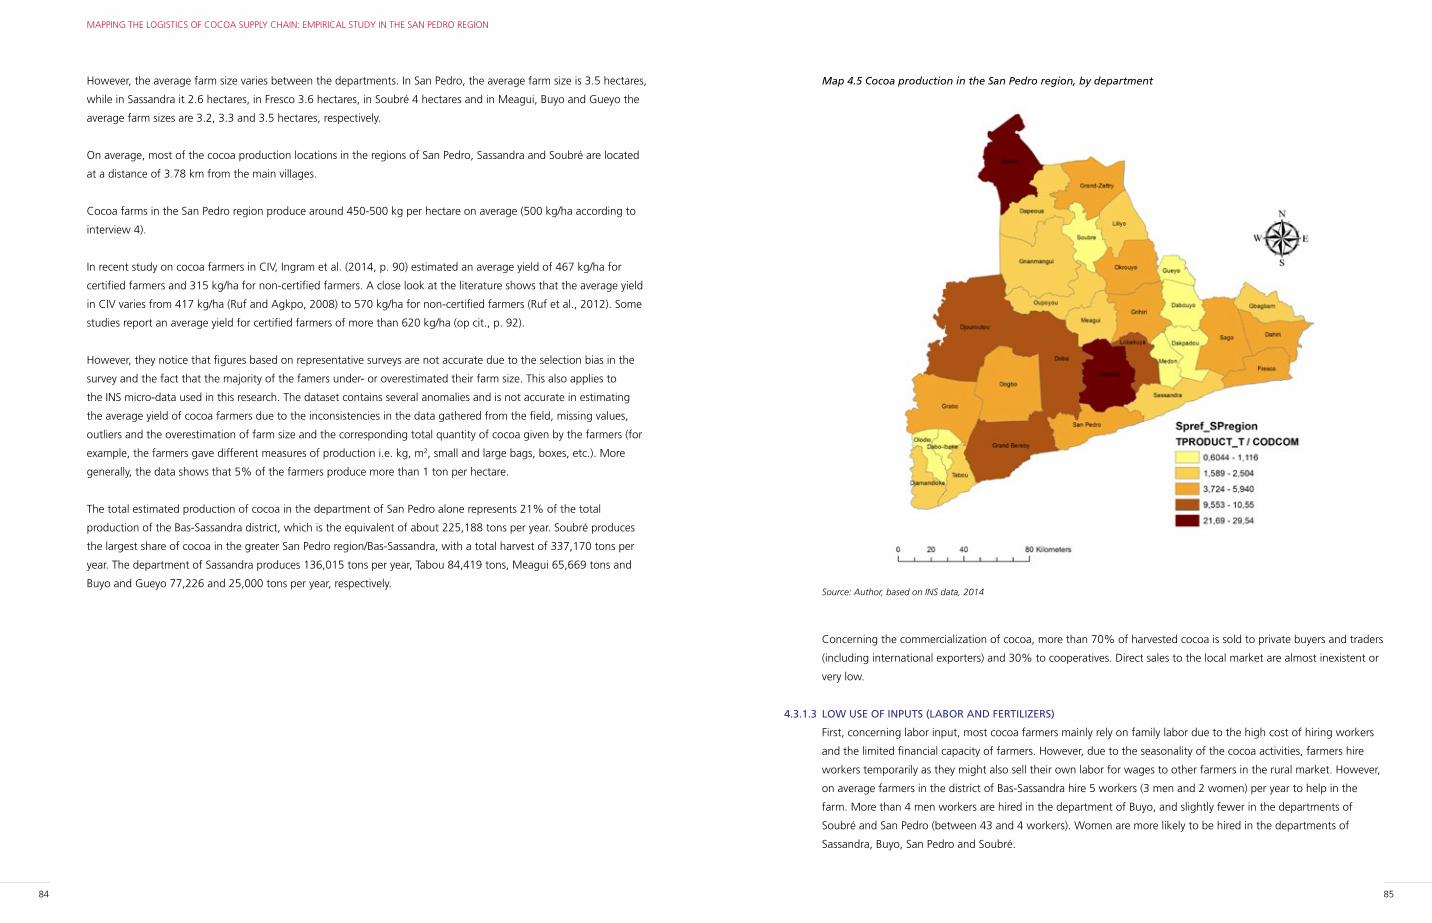
84 85
MAPPING THE LOGISTICS OF COCOA SUPPLY CHAIN: EMPIRICAL STUDY IN THE SAN PEDRO REGION
Map 4.5 Cocoa production in the San Pedro region, by department
Source: Author, based on INS data, 2014
Concerning the commercialization of cocoa, more than 70% of harvested cocoa is sold to private buyers and traders
(including international exporters) and 30% to cooperatives. Direct sales to the local market are almost inexistent or
very low.
4.3.1.3 LOW USE OF INPUTS (LABOR AND FERTILIZERS)
First, concerning labor input, most cocoa farmers mainly rely on family labor due to the high cost of hiring workers
and the limited financial capacity of farmers. However, due to the seasonality of the cocoa activities, farmers hire
workers temporarily as they might also sell their own labor for wages to other farmers in the rural market. However,
on average farmers in the district of Bas-Sassandra hire 5 workers (3 men and 2 women) per year to help in the
farm. More than 4 men workers are hired in the department of Buyo, and slightly fewer in the departments of
Soubré and San Pedro (between 43 and 4 workers). Women are more likely to be hired in the departments of
Sassandra, Buyo, San Pedro and Soubré.
However, the average farm size varies between the departments. In San Pedro, the average farm size is 3.5 hectares,
while in Sassandra it 2.6 hectares, in Fresco 3.6 hectares, in Soubré 4 hectares and in Meagui, Buyo and Gueyo the
average farm sizes are 3.2, 3.3 and 3.5 hectares, respectively.
On average, most of the cocoa production locations in the regions of San Pedro, Sassandra and Soubré are located
at a distance of 3.78 km from the main villages.
Cocoa farms in the San Pedro region produce around 450-500 kg per hectare on average (500 kg/ha according to
interview 4).
In recent study on cocoa farmers in CIV, Ingram et al. (2014, p. 90) estimated an average yield of 467 kg/ha for
certified farmers and 315 kg/ha for non-certified farmers. A close look at the literature shows that the average yield
in CIV varies from 417 kg/ha (Ruf and Agkpo, 2008) to 570 kg/ha for non-certified farmers (Ruf et al., 2012). Some
studies report an average yield for certified farmers of more than 620 kg/ha (op cit., p. 92).
However, they notice that figures based on representative surveys are not accurate due to the selection bias in the
survey and the fact that the majority of the famers under- or overestimated their farm size. This also applies to
the INS micro-data used in this research. The dataset contains several anomalies and is not accurate in estimating
the average yield of cocoa farmers due to the inconsistencies in the data gathered from the field, missing values,
outliers and the overestimation of farm size and the corresponding total quantity of cocoa given by the farmers (for
example, the farmers gave different measures of production i.e. kg, m2, small and large bags, boxes, etc.). More
generally, the data shows that 5% of the farmers produce more than 1 ton per hectare.
The total estimated production of cocoa in the department of San Pedro alone represents 21% of the total
production of the Bas-Sassandra district, which is the equivalent of about 225,188 tons per year. Soubré produces
the largest share of cocoa in the greater San Pedro region/Bas-Sassandra, with a total harvest of 337,170 tons per
year. The department of Sassandra produces 136,015 tons per year, Tabou 84,419 tons, Meagui 65,669 tons and
Buyo and Gueyo 77,226 and 25,000 tons per year, respectively.
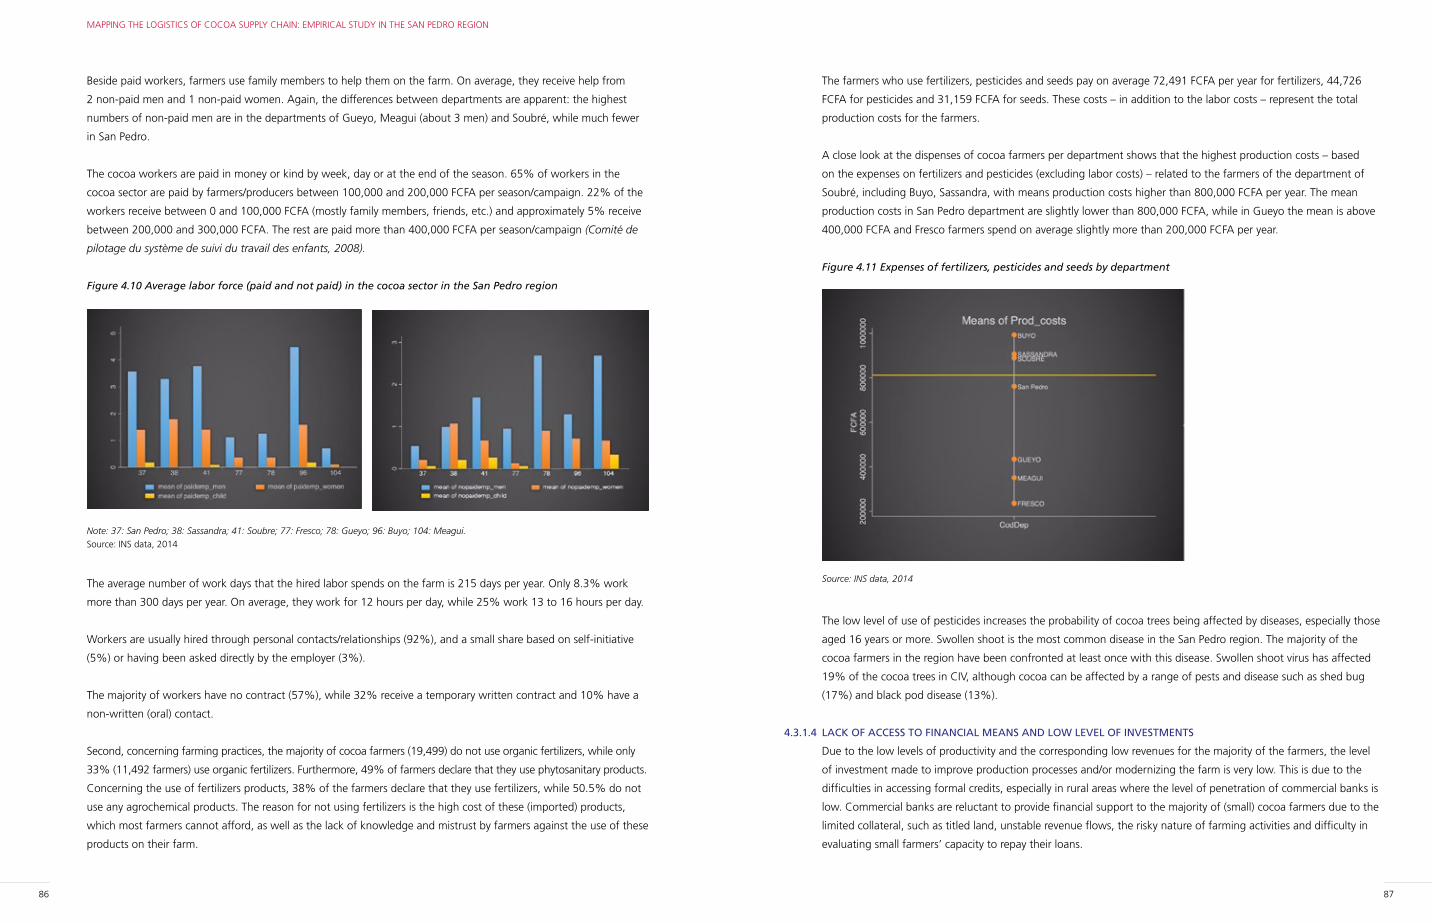
86 87
MAPPING THE LOGISTICS OF COCOA SUPPLY CHAIN: EMPIRICAL STUDY IN THE SAN PEDRO REGION
The farmers who use fertilizers, pesticides and seeds pay on average 72,491 FCFA per year for fertilizers, 44,726
FCFA for pesticides and 31,159 FCFA for seeds. These costs – in addition to the labor costs – represent the total
production costs for the farmers.
A close look at the dispenses of cocoa farmers per department shows that the highest production costs – based
on the expenses on fertilizers and pesticides (excluding labor costs) – related to the farmers of the department of
Soubré, including Buyo, Sassandra, with means production costs higher than 800,000 FCFA per year. The mean
production costs in San Pedro department are slightly lower than 800,000 FCFA, while in Gueyo the mean is above
400,000 FCFA and Fresco farmers spend on average slightly more than 200,000 FCFA per year.
Figure 4.11 Expenses of fertilizers, pesticides and seeds by department
Source: INS data, 2014
The low level of use of pesticides increases the probability of cocoa trees being affected by diseases, especially those
aged 16 years or more. Swollen shoot is the most common disease in the San Pedro region. The majority of the
cocoa farmers in the region have been confronted at least once with this disease. Swollen shoot virus has affected
19% of the cocoa trees in CIV, although cocoa can be affected by a range of pests and disease such as shed bug
(17%) and black pod disease (13%).
4.3.1.4 LACK OF ACCESS TO FINANCIAL MEANS AND LOW LEVEL OF INVESTMENTS
Due to the low levels of productivity and the corresponding low revenues for the majority of the farmers, the level
of investment made to improve production processes and/or modernizing the farm is very low. This is due to the
difficulties in accessing formal credits, especially in rural areas where the level of penetration of commercial banks is
low. Commercial banks are reluctant to provide financial support to the majority of (small) cocoa farmers due to the
limited collateral, such as titled land, unstable revenue flows, the risky nature of farming activities and difficulty in
evaluating small farmers’ capacity to repay their loans.
Beside paid workers, farmers use family members to help them on the farm. On average, they receive help from
2 non-paid men and 1 non-paid women. Again, the differences between departments are apparent: the highest
numbers of non-paid men are in the departments of Gueyo, Meagui (about 3 men) and Soubré, while much fewer
in San Pedro.
The cocoa workers are paid in money or kind by week, day or at the end of the season. 65% of workers in the
cocoa sector are paid by farmers/producers between 100,000 and 200,000 FCFA per season/campaign. 22% of the
workers receive between 0 and 100,000 FCFA (mostly family members, friends, etc.) and approximately 5% receive
between 200,000 and 300,000 FCFA. The rest are paid more than 400,000 FCFA per season/campaign (Comité de
pilotage du système de suivi du travail des enfants, 2008).
Figure 4.10 Average labor force (paid and not paid) in the cocoa sector in the San Pedro region
Note: 37: San Pedro; 38: Sassandra; 41: Soubre; 77: Fresco; 78: Gueyo; 96: Buyo; 104: Meagui.
Source: INS data, 2014
The average number of work days that the hired labor spends on the farm is 215 days per year. Only 8.3% work
more than 300 days per year. On average, they work for 12 hours per day, while 25% work 13 to 16 hours per day.
Workers are usually hired through personal contacts/relationships (92%), and a small share based on self-initiative
(5%) or having been asked directly by the employer (3%).
The majority of workers have no contract (57%), while 32% receive a temporary written contract and 10% have a
non-written (oral) contact.
Second, concerning farming practices, the majority of cocoa farmers (19,499) do not use organic fertilizers, while only
33% (11,492 farmers) use organic fertilizers. Furthermore, 49% of farmers declare that they use phytosanitary products.
Concerning the use of fertilizers products, 38% of the farmers declare that they use fertilizers, while 50.5% do not
use any agrochemical products. The reason for not using fertilizers is the high cost of these (imported) products,
which most farmers cannot afford, as well as the lack of knowledge and mistrust by farmers against the use of these
products on their farm.
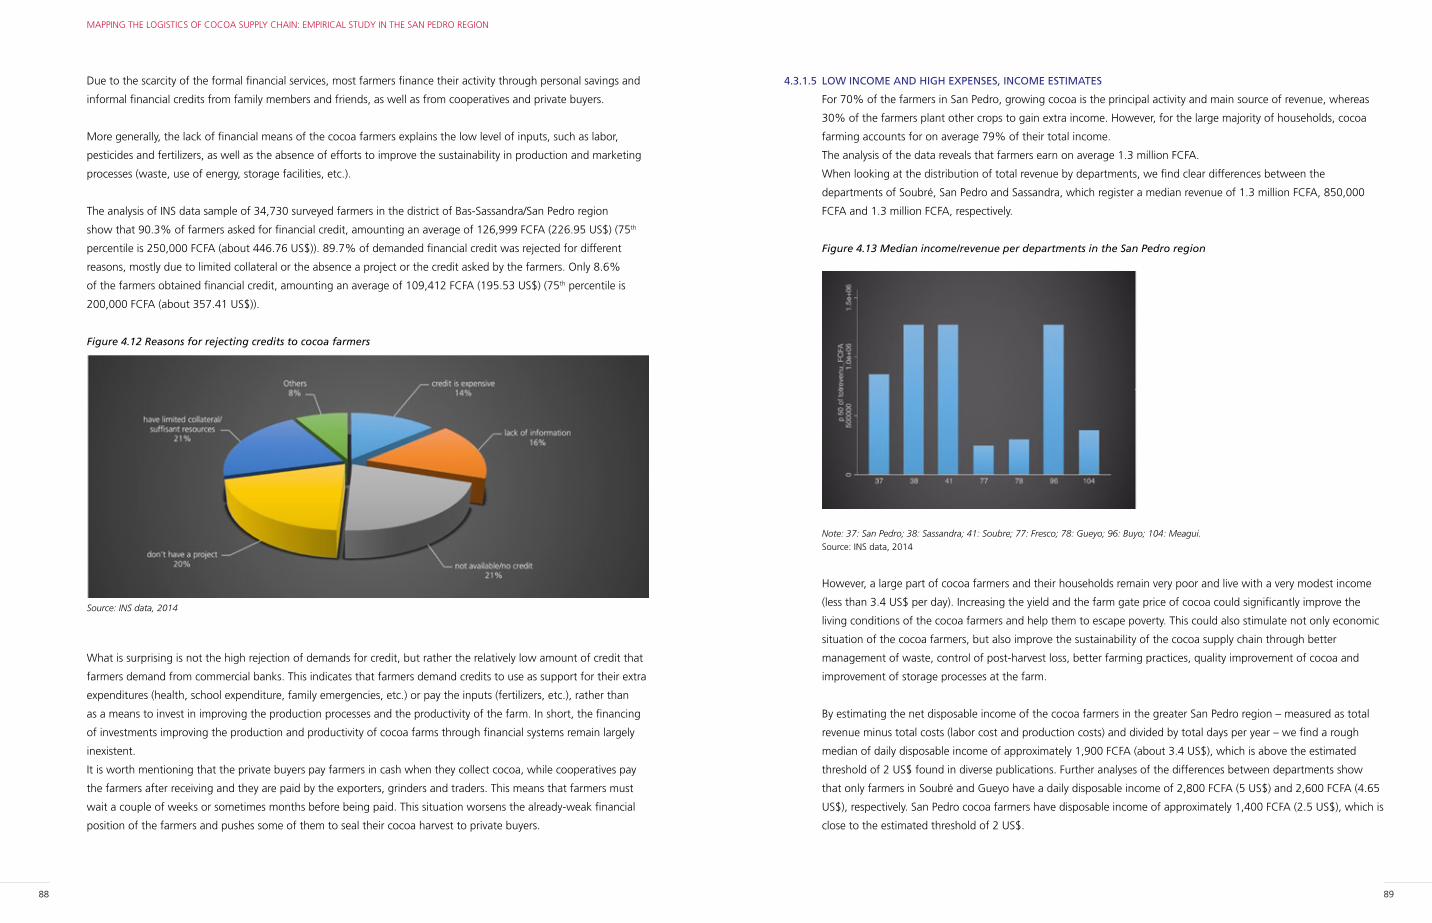
88 89
MAPPING THE LOGISTICS OF COCOA SUPPLY CHAIN: EMPIRICAL STUDY IN THE SAN PEDRO REGION
4.3.1.5 LOW INCOME AND HIGH EXPENSES, INCOME ESTIMATES
For 70% of the farmers in San Pedro, growing cocoa is the principal activity and main source of revenue, whereas
30% of the farmers plant other crops to gain extra income. However, for the large majority of households, cocoa
farming accounts for on average 79% of their total income.
The analysis of the data reveals that farmers earn on average 1.3 million FCFA.
When looking at the distribution of total revenue by departments, we find clear differences between the
departments of Soubré, San Pedro and Sassandra, which register a median revenue of 1.3 million FCFA, 850,000
FCFA and 1.3 million FCFA, respectively.
Figure 4.13 Median income/revenue per departments in the San Pedro region
Note: 37: San Pedro; 38: Sassandra; 41: Soubre; 77: Fresco; 78: Gueyo; 96: Buyo; 104: Meagui.
Source: INS data, 2014
However, a large part of cocoa farmers and their households remain very poor and live with a very modest income
(less than 3.4 US$ per day). Increasing the yield and the farm gate price of cocoa could significantly improve the
living conditions of the cocoa farmers and help them to escape poverty. This could also stimulate not only economic
situation of the cocoa farmers, but also improve the sustainability of the cocoa supply chain through better
management of waste, control of post-harvest loss, better farming practices, quality improvement of cocoa and
improvement of storage processes at the farm.
By estimating the net disposable income of the cocoa farmers in the greater San Pedro region – measured as total
revenue minus total costs (labor cost and production costs) and divided by total days per year – we find a rough
median of daily disposable income of approximately 1,900 FCFA (about 3.4 US$), which is above the estimated
threshold of 2 US$ found in diverse publications. Further analyses of the differences between departments show
that only farmers in Soubré and Gueyo have a daily disposable income of 2,800 FCFA (5 US$) and 2,600 FCFA (4.65
US$), respectively. San Pedro cocoa farmers have disposable income of approximately 1,400 FCFA (2.5 US$), which is
close to the estimated threshold of 2 US$.
Due to the scarcity of the formal financial services, most farmers finance their activity through personal savings and
informal financial credits from family members and friends, as well as from cooperatives and private buyers.
More generally, the lack of financial means of the cocoa farmers explains the low level of inputs, such as labor,
pesticides and fertilizers, as well as the absence of efforts to improve the sustainability in production and marketing
processes (waste, use of energy, storage facilities, etc.).
The analysis of INS data sample of 34,730 surveyed farmers in the district of Bas-Sassandra/San Pedro region
show that 90.3% of farmers asked for financial credit, amounting an average of 126,999 FCFA (226.95 US$) (75th
percentile is 250,000 FCFA (about 446.76 US$)). 89.7% of demanded financial credit was rejected for different
reasons, mostly due to limited collateral or the absence a project or the credit asked by the farmers. Only 8.6%
of the farmers obtained financial credit, amounting an average of 109,412 FCFA (195.53 US$) (75th percentile is
200,000 FCFA (about 357.41 US$)).
Figure 4.12 Reasons for rejecting credits to cocoa farmers
Source: INS data, 2014
What is surprising is not the high rejection of demands for credit, but rather the relatively low amount of credit that
farmers demand from commercial banks. This indicates that farmers demand credits to use as support for their extra
expenditures (health, school expenditure, family emergencies, etc.) or pay the inputs (fertilizers, etc.), rather than
as a means to invest in improving the production processes and the productivity of the farm. In short, the financing
of investments improving the production and productivity of cocoa farms through financial systems remain largely
inexistent.
It is worth mentioning that the private buyers pay farmers in cash when they collect cocoa, while cooperatives pay
the farmers after receiving and they are paid by the exporters, grinders and traders. This means that farmers must
wait a couple of weeks or sometimes months before being paid. This situation worsens the already-weak financial
position of the farmers and pushes some of them to seal their cocoa harvest to private buyers.
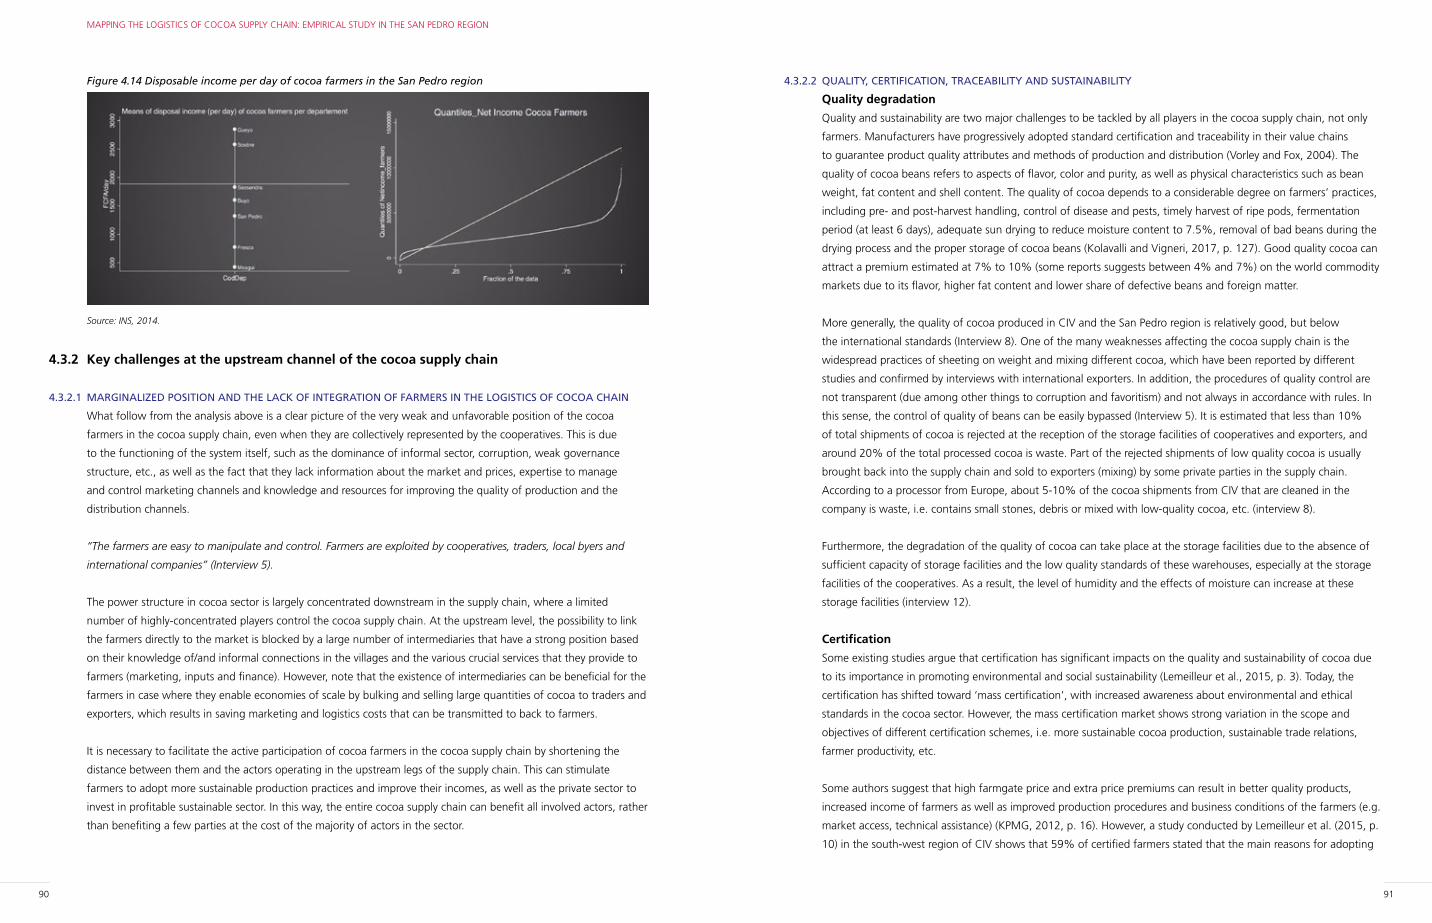
90 91
MAPPING THE LOGISTICS OF COCOA SUPPLY CHAIN: EMPIRICAL STUDY IN THE SAN PEDRO REGION
4.3.2.2 QUALITY, CERTIFICATION, TRACEABILITY AND SUSTAINABILITY
Quality degradation
Quality and sustainability are two major challenges to be tackled by all players in the cocoa supply chain, not only
farmers. Manufacturers have progressively adopted standard certification and traceability in their value chains
to guarantee product quality attributes and methods of production and distribution (Vorley and Fox, 2004). The
quality of cocoa beans refers to aspects of flavor, color and purity, as well as physical characteristics such as bean
weight, fat content and shell content. The quality of cocoa depends to a considerable degree on farmers’ practices,
including pre- and post-harvest handling, control of disease and pests, timely harvest of ripe pods, fermentation
period (at least 6 days), adequate sun drying to reduce moisture content to 7.5%, removal of bad beans during the
drying process and the proper storage of cocoa beans (Kolavalli and Vigneri, 2017, p. 127). Good quality cocoa can
attract a premium estimated at 7% to 10% (some reports suggests between 4% and 7%) on the world commodity
markets due to its flavor, higher fat content and lower share of defective beans and foreign matter.
More generally, the quality of cocoa produced in CIV and the San Pedro region is relatively good, but below
the international standards (Interview 8). One of the many weaknesses affecting the cocoa supply chain is the
widespread practices of sheeting on weight and mixing different cocoa, which have been reported by different
studies and confirmed by interviews with international exporters. In addition, the procedures of quality control are
not transparent (due among other things to corruption and favoritism) and not always in accordance with rules. In
this sense, the control of quality of beans can be easily bypassed (Interview 5). It is estimated that less than 10%
of total shipments of cocoa is rejected at the reception of the storage facilities of cooperatives and exporters, and
around 20% of the total processed cocoa is waste. Part of the rejected shipments of low quality cocoa is usually
brought back into the supply chain and sold to exporters (mixing) by some private parties in the supply chain.
According to a processor from Europe, about 5-10% of the cocoa shipments from CIV that are cleaned in the
company is waste, i.e. contains small stones, debris or mixed with low-quality cocoa, etc. (interview 8).
Furthermore, the degradation of the quality of cocoa can take place at the storage facilities due to the absence of
sufficient capacity of storage facilities and the low quality standards of these warehouses, especially at the storage
facilities of the cooperatives. As a result, the level of humidity and the effects of moisture can increase at these
storage facilities (interview 12).
Certification
Some existing studies argue that certification has significant impacts on the quality and sustainability of cocoa due
to its importance in promoting environmental and social sustainability (Lemeilleur et al., 2015, p. 3). Today, the
certification has shifted toward ‘mass certification’, with increased awareness about environmental and ethical
standards in the cocoa sector. However, the mass certification market shows strong variation in the scope and
objectives of different certification schemes, i.e. more sustainable cocoa production, sustainable trade relations,
farmer productivity, etc.
Some authors suggest that high farmgate price and extra price premiums can result in better quality products,
increased income of farmers as well as improved production procedures and business conditions of the farmers (e.g.
market access, technical assistance) (KPMG, 2012, p. 16). However, a study conducted by Lemeilleur et al. (2015, p.
10) in the south-west region of CIV shows that 59% of certified farmers stated that the main reasons for adopting
Figure 4.14 Disposable income per day of cocoa farmers in the San Pedro region
Source: INS, 2014.
4.3.2 Key challenges at the upstream channel of the cocoa supply chain
4.3.2.1 MARGINALIZED POSITION AND THE LACK OF INTEGRATION OF FARMERS IN THE LOGISTICS OF COCOA CHAIN
What follow from the analysis above is a clear picture of the very weak and unfavorable position of the cocoa
farmers in the cocoa supply chain, even when they are collectively represented by the cooperatives. This is due
to the functioning of the system itself, such as the dominance of informal sector, corruption, weak governance
structure, etc., as well as the fact that they lack information about the market and prices, expertise to manage
and control marketing channels and knowledge and resources for improving the quality of production and the
distribution channels.
“The farmers are easy to manipulate and control. Farmers are exploited by cooperatives, traders, local byers and
international companies” (Interview 5).
The power structure in cocoa sector is largely concentrated downstream in the supply chain, where a limited
number of highly-concentrated players control the cocoa supply chain. At the upstream level, the possibility to link
the farmers directly to the market is blocked by a large number of intermediaries that have a strong position based
on their knowledge of/and informal connections in the villages and the various crucial services that they provide to
farmers (marketing, inputs and finance). However, note that the existence of intermediaries can be beneficial for the
farmers in case where they enable economies of scale by bulking and selling large quantities of cocoa to traders and
exporters, which results in saving marketing and logistics costs that can be transmitted to back to farmers.
It is necessary to facilitate the active participation of cocoa farmers in the cocoa supply chain by shortening the
distance between them and the actors operating in the upstream legs of the supply chain. This can stimulate
farmers to adopt more sustainable production practices and improve their incomes, as well as the private sector to
invest in profitable sustainable sector. In this way, the entire cocoa supply chain can benefit all involved actors, rather
than benefiting a few parties at the cost of the majority of actors in the sector.
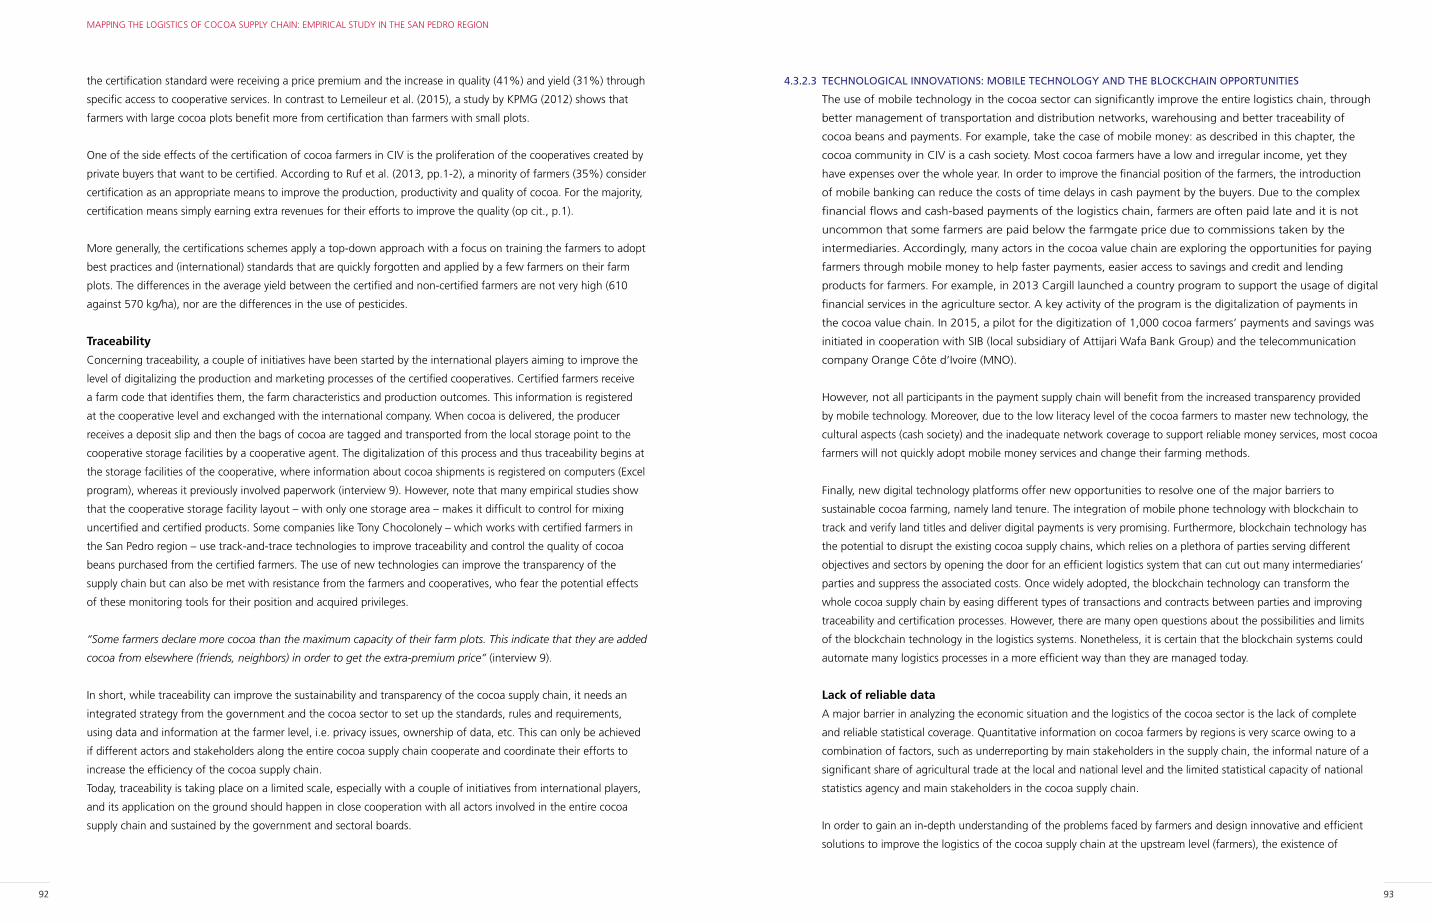
92 93
MAPPING THE LOGISTICS OF COCOA SUPPLY CHAIN: EMPIRICAL STUDY IN THE SAN PEDRO REGION
4.3.2.3 TECHNOLOGICAL INNOVATIONS: MOBILE TECHNOLOGY AND THE BLOCKCHAIN OPPORTUNITIES
The use of mobile technology in the cocoa sector can significantly improve the entire logistics chain, through
better management of transportation and distribution networks, warehousing and better traceability of
cocoa beans and payments. For example, take the case of mobile money: as described in this chapter, the
cocoa community in CIV is a cash society. Most cocoa farmers have a low and irregular income, yet they
have expenses over the whole year. In order to improve the financial position of the farmers, the introduction
of mobile banking can reduce the costs of time delays in cash payment by the buyers. Due to the complex
financial flows and cash-based payments of the logistics chain, farmers are often paid late and it is not
uncommon that some farmers are paid below the farmgate price due to commissions taken by the
intermediaries. Accordingly, many actors in the cocoa value chain are exploring the opportunities for paying
farmers through mobile money to help faster payments, easier access to savings and credit and lending
products for farmers. For example, in 2013 Cargill launched a country program to support the usage of digital
financial services in the agriculture sector. A key activity of the program is the digitalization of payments in
the cocoa value chain. In 2015, a pilot for the digitization of 1,000 cocoa farmers’ payments and savings was
initiated in cooperation with SIB (local subsidiary of Attijari Wafa Bank Group) and the telecommunication
company Orange Côte d’Ivoire (MNO).
However, not all participants in the payment supply chain will benefit from the increased transparency provided
by mobile technology. Moreover, due to the low literacy level of the cocoa farmers to master new technology, the
cultural aspects (cash society) and the inadequate network coverage to support reliable money services, most cocoa
farmers will not quickly adopt mobile money services and change their farming methods.
Finally, new digital technology platforms offer new opportunities to resolve one of the major barriers to
sustainable cocoa farming, namely land tenure. The integration of mobile phone technology with blockchain to
track and verify land titles and deliver digital payments is very promising. Furthermore, blockchain technology has
the potential to disrupt the existing cocoa supply chains, which relies on a plethora of parties serving different
objectives and sectors by opening the door for an efficient logistics system that can cut out many intermediaries’
parties and suppress the associated costs. Once widely adopted, the blockchain technology can transform the
whole cocoa supply chain by easing different types of transactions and contracts between parties and improving
traceability and certification processes. However, there are many open questions about the possibilities and limits
of the blockchain technology in the logistics systems. Nonetheless, it is certain that the blockchain systems could
automate many logistics processes in a more efficient way than they are managed today.
Lack of reliable data
A major barrier in analyzing the economic situation and the logistics of the cocoa sector is the lack of complete
and reliable statistical coverage. Quantitative information on cocoa farmers by regions is very scarce owing to a
combination of factors, such as underreporting by main stakeholders in the supply chain, the informal nature of a
significant share of agricultural trade at the local and national level and the limited statistical capacity of national
statistics agency and main stakeholders in the cocoa supply chain.
In order to gain an in-depth understanding of the problems faced by farmers and design innovative and efficient
solutions to improve the logistics of the cocoa supply chain at the upstream level (farmers), the existence of
the certification standard were receiving a price premium and the increase in quality (41%) and yield (31%) through
specific access to cooperative services. In contrast to Lemeileur et al. (2015), a study by KPMG (2012) shows that
farmers with large cocoa plots benefit more from certification than farmers with small plots.
One of the side effects of the certification of cocoa farmers in CIV is the proliferation of the cooperatives created by
private buyers that want to be certified. According to Ruf et al. (2013, pp.1-2), a minority of farmers (35%) consider
certification as an appropriate means to improve the production, productivity and quality of cocoa. For the majority,
certification means simply earning extra revenues for their efforts to improve the quality (op cit., p.1).
More generally, the certifications schemes apply a top-down approach with a focus on training the farmers to adopt
best practices and (international) standards that are quickly forgotten and applied by a few farmers on their farm
plots. The differences in the average yield between the certified and non-certified farmers are not very high (610
against 570 kg/ha), nor are the differences in the use of pesticides.
Traceability
Concerning traceability, a couple of initiatives have been started by the international players aiming to improve the
level of digitalizing the production and marketing processes of the certified cooperatives. Certified farmers receive
a farm code that identifies them, the farm characteristics and production outcomes. This information is registered
at the cooperative level and exchanged with the international company. When cocoa is delivered, the producer
receives a deposit slip and then the bags of cocoa are tagged and transported from the local storage point to the
cooperative storage facilities by a cooperative agent. The digitalization of this process and thus traceability begins at
the storage facilities of the cooperative, where information about cocoa shipments is registered on computers (Excel
program), whereas it previously involved paperwork (interview 9). However, note that many empirical studies show
that the cooperative storage facility layout – with only one storage area – makes it difficult to control for mixing
uncertified and certified products. Some companies like Tony Chocolonely – which works with certified farmers in
the San Pedro region – use track-and-trace technologies to improve traceability and control the quality of cocoa
beans purchased from the certified farmers. The use of new technologies can improve the transparency of the
supply chain but can also be met with resistance from the farmers and cooperatives, who fear the potential effects
of these monitoring tools for their position and acquired privileges.
“Some farmers declare more cocoa than the maximum capacity of their farm plots. This indicate that they are added
cocoa from elsewhere (friends, neighbors) in order to get the extra-premium price” (interview 9).
In short, while traceability can improve the sustainability and transparency of the cocoa supply chain, it needs an
integrated strategy from the government and the cocoa sector to set up the standards, rules and requirements,
using data and information at the farmer level, i.e. privacy issues, ownership of data, etc. This can only be achieved
if different actors and stakeholders along the entire cocoa supply chain cooperate and coordinate their efforts to
increase the efficiency of the cocoa supply chain.
Today, traceability is taking place on a limited scale, especially with a couple of initiatives from international players,
and its application on the ground should happen in close cooperation with all actors involved in the entire cocoa
supply chain and sustained by the government and sectoral boards.
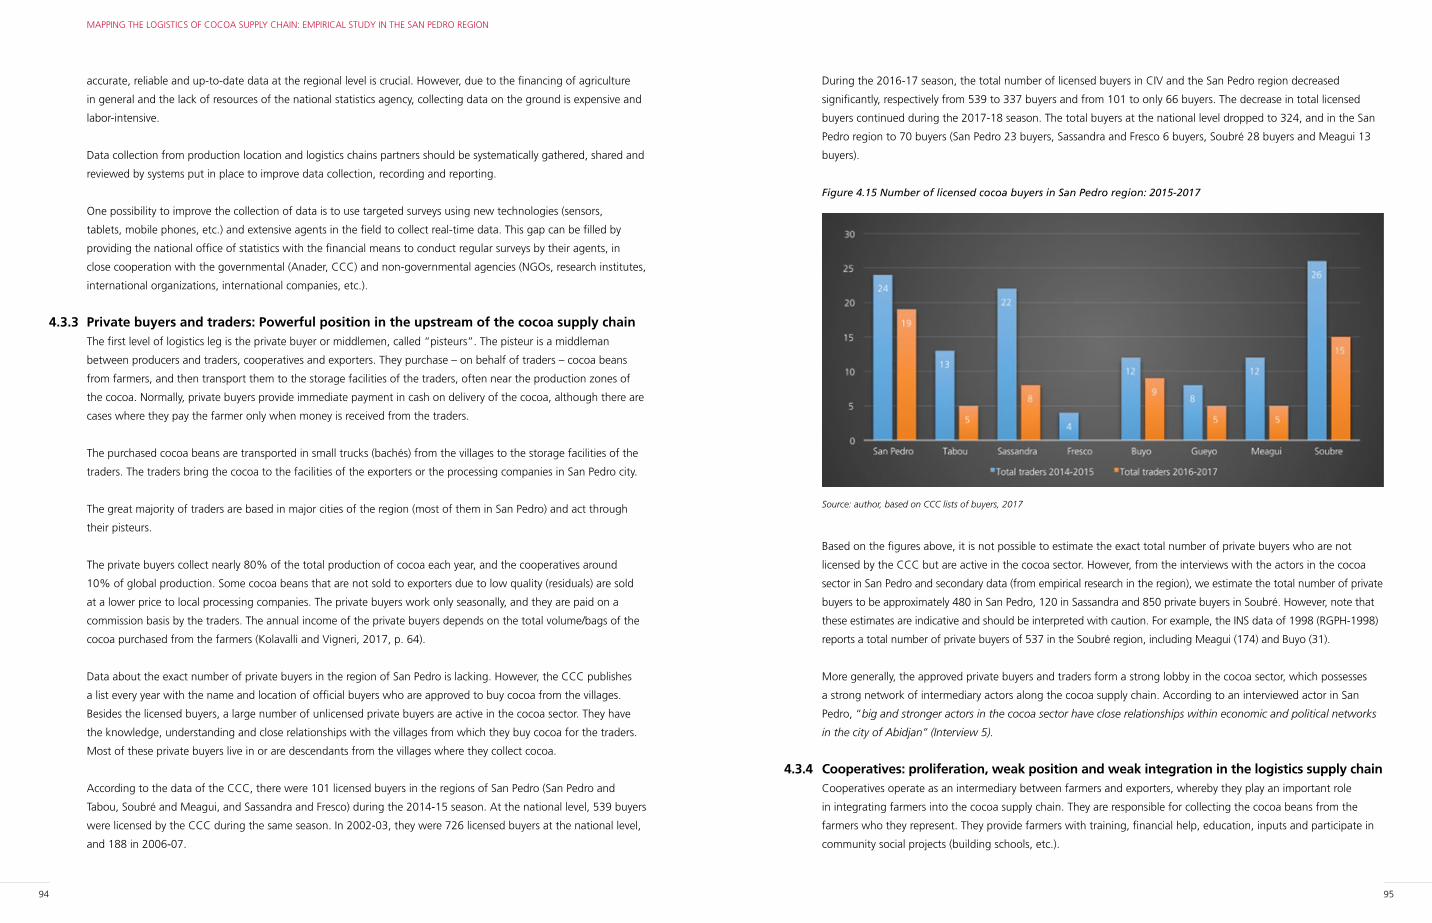
94 95
MAPPING THE LOGISTICS OF COCOA SUPPLY CHAIN: EMPIRICAL STUDY IN THE SAN PEDRO REGION
During the 2016-17 season, the total number of licensed buyers in CIV and the San Pedro region decreased
significantly, respectively from 539 to 337 buyers and from 101 to only 66 buyers. The decrease in total licensed
buyers continued during the 2017-18 season. The total buyers at the national level dropped to 324, and in the San
Pedro region to 70 buyers (San Pedro 23 buyers, Sassandra and Fresco 6 buyers, Soubré 28 buyers and Meagui 13
buyers).
Figure 4.15 Number of licensed cocoa buyers in San Pedro region: 2015-2017
Source: author, based on CCC lists of buyers, 2017
Based on the figures above, it is not possible to estimate the exact total number of private buyers who are not
licensed by the CCC but are active in the cocoa sector. However, from the interviews with the actors in the cocoa
sector in San Pedro and secondary data (from empirical research in the region), we estimate the total number of private
buyers to be approximately 480 in San Pedro, 120 in Sassandra and 850 private buyers in Soubré. However, note that
these estimates are indicative and should be interpreted with caution. For example, the INS data of 1998 (RGPH-1998)
reports a total number of private buyers of 537 in the Soubré region, including Meagui (174) and Buyo (31).
More generally, the approved private buyers and traders form a strong lobby in the cocoa sector, which possesses
a strong network of intermediary actors along the cocoa supply chain. According to an interviewed actor in San
Pedro, “big and stronger actors in the cocoa sector have close relationships within economic and political networks
in the city of Abidjan” (Interview 5).
4.3.4 Cooperatives: proliferation, weak position and weak integration in the logistics supply chain Cooperatives operate as an intermediary between farmers and exporters, whereby they play an important role
in integrating farmers into the cocoa supply chain. They are responsible for collecting the cocoa beans from the
farmers who they represent. They provide farmers with training, financial help, education, inputs and participate in
community social projects (building schools, etc.).
accurate, reliable and up-to-date data at the regional level is crucial. However, due to the financing of agriculture
in general and the lack of resources of the national statistics agency, collecting data on the ground is expensive and
labor-intensive.
Data collection from production location and logistics chains partners should be systematically gathered, shared and
reviewed by systems put in place to improve data collection, recording and reporting.
One possibility to improve the collection of data is to use targeted surveys using new technologies (sensors,
tablets, mobile phones, etc.) and extensive agents in the field to collect real-time data. This gap can be filled by
providing the national office of statistics with the financial means to conduct regular surveys by their agents, in
close cooperation with the governmental (Anader, CCC) and non-governmental agencies (NGOs, research institutes,
international organizations, international companies, etc.).
4.3.3 Private buyers and traders: Powerful position in the upstream of the cocoa supply chainThe first level of logistics leg is the private buyer or middlemen, called “pisteurs”. The pisteur is a middleman
between producers and traders, cooperatives and exporters. They purchase – on behalf of traders – cocoa beans
from farmers, and then transport them to the storage facilities of the traders, often near the production zones of
the cocoa. Normally, private buyers provide immediate payment in cash on delivery of the cocoa, although there are
cases where they pay the farmer only when money is received from the traders.
The purchased cocoa beans are transported in small trucks (bachés) from the villages to the storage facilities of the
traders. The traders bring the cocoa to the facilities of the exporters or the processing companies in San Pedro city.
The great majority of traders are based in major cities of the region (most of them in San Pedro) and act through
their pisteurs.
The private buyers collect nearly 80% of the total production of cocoa each year, and the cooperatives around
10% of global production. Some cocoa beans that are not sold to exporters due to low quality (residuals) are sold
at a lower price to local processing companies. The private buyers work only seasonally, and they are paid on a
commission basis by the traders. The annual income of the private buyers depends on the total volume/bags of the
cocoa purchased from the farmers (Kolavalli and Vigneri, 2017, p. 64).
Data about the exact number of private buyers in the region of San Pedro is lacking. However, the CCC publishes
a list every year with the name and location of official buyers who are approved to buy cocoa from the villages.
Besides the licensed buyers, a large number of unlicensed private buyers are active in the cocoa sector. They have
the knowledge, understanding and close relationships with the villages from which they buy cocoa for the traders.
Most of these private buyers live in or are descendants from the villages where they collect cocoa.
According to the data of the CCC, there were 101 licensed buyers in the regions of San Pedro (San Pedro and
Tabou, Soubré and Meagui, and Sassandra and Fresco) during the 2014-15 season. At the national level, 539 buyers
were licensed by the CCC during the same season. In 2002-03, they were 726 licensed buyers at the national level,
and 188 in 2006-07.
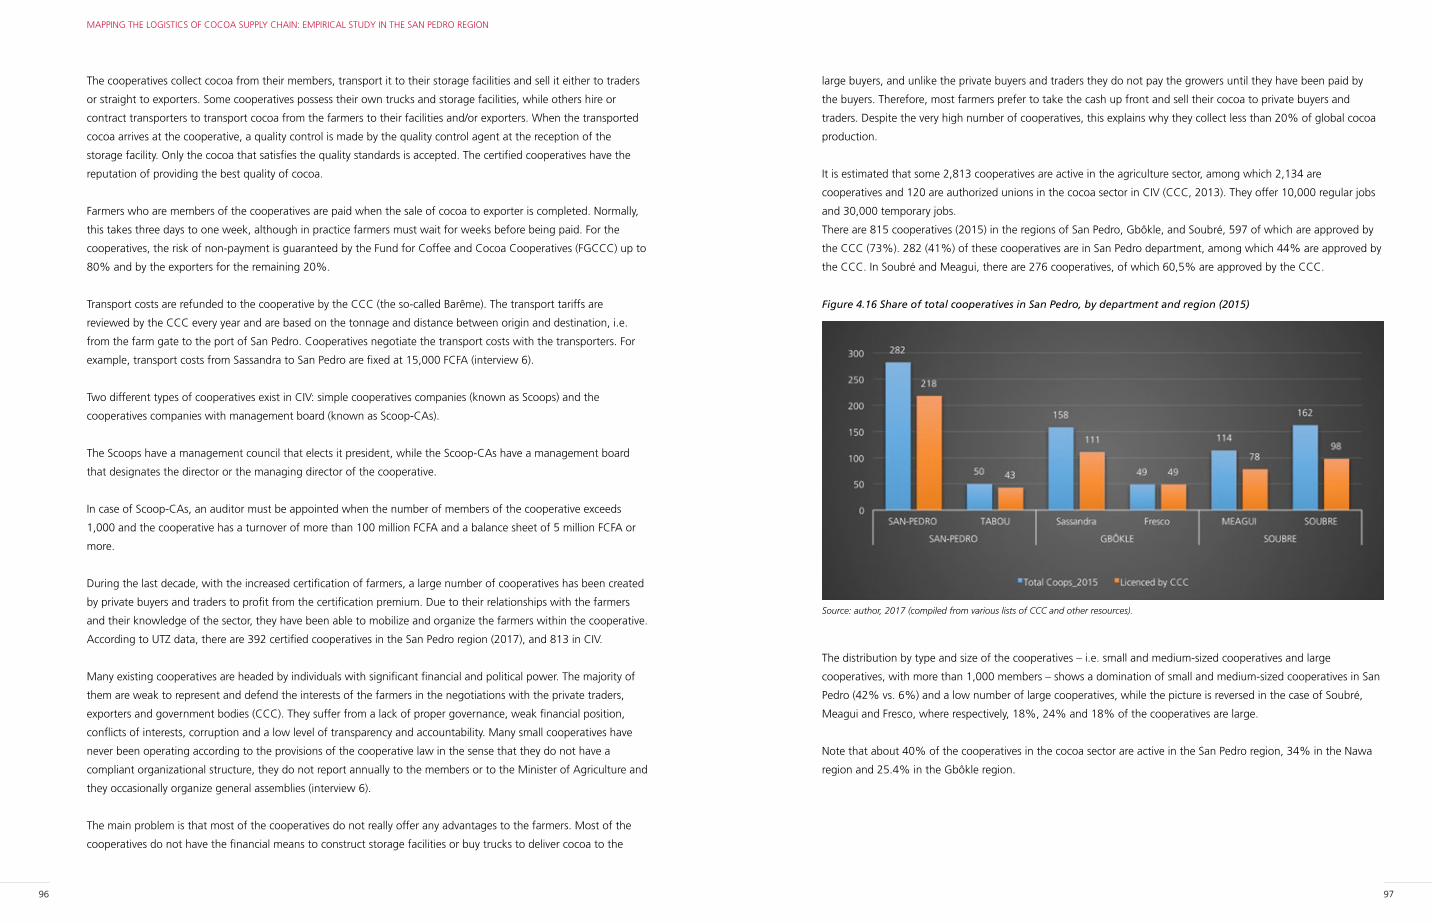
96 97
MAPPING THE LOGISTICS OF COCOA SUPPLY CHAIN: EMPIRICAL STUDY IN THE SAN PEDRO REGION
large buyers, and unlike the private buyers and traders they do not pay the growers until they have been paid by
the buyers. Therefore, most farmers prefer to take the cash up front and sell their cocoa to private buyers and
traders. Despite the very high number of cooperatives, this explains why they collect less than 20% of global cocoa
production.
It is estimated that some 2,813 cooperatives are active in the agriculture sector, among which 2,134 are
cooperatives and 120 are authorized unions in the cocoa sector in CIV (CCC, 2013). They offer 10,000 regular jobs
and 30,000 temporary jobs.
There are 815 cooperatives (2015) in the regions of San Pedro, Gbôkle, and Soubré, 597 of which are approved by
the CCC (73%). 282 (41%) of these cooperatives are in San Pedro department, among which 44% are approved by
the CCC. In Soubré and Meagui, there are 276 cooperatives, of which 60,5% are approved by the CCC.
Figure 4.16 Share of total cooperatives in San Pedro, by department and region (2015)
Source: author, 2017 (compiled from various lists of CCC and other resources).
The distribution by type and size of the cooperatives – i.e. small and medium-sized cooperatives and large
cooperatives, with more than 1,000 members – shows a domination of small and medium-sized cooperatives in San
Pedro (42% vs. 6%) and a low number of large cooperatives, while the picture is reversed in the case of Soubré,
Meagui and Fresco, where respectively, 18%, 24% and 18% of the cooperatives are large.
Note that about 40% of the cooperatives in the cocoa sector are active in the San Pedro region, 34% in the Nawa
region and 25.4% in the Gbôkle region.
The cooperatives collect cocoa from their members, transport it to their storage facilities and sell it either to traders
or straight to exporters. Some cooperatives possess their own trucks and storage facilities, while others hire or
contract transporters to transport cocoa from the farmers to their facilities and/or exporters. When the transported
cocoa arrives at the cooperative, a quality control is made by the quality control agent at the reception of the
storage facility. Only the cocoa that satisfies the quality standards is accepted. The certified cooperatives have the
reputation of providing the best quality of cocoa.
Farmers who are members of the cooperatives are paid when the sale of cocoa to exporter is completed. Normally,
this takes three days to one week, although in practice farmers must wait for weeks before being paid. For the
cooperatives, the risk of non-payment is guaranteed by the Fund for Coffee and Cocoa Cooperatives (FGCCC) up to
80% and by the exporters for the remaining 20%.
Transport costs are refunded to the cooperative by the CCC (the so-called Barême). The transport tariffs are
reviewed by the CCC every year and are based on the tonnage and distance between origin and destination, i.e.
from the farm gate to the port of San Pedro. Cooperatives negotiate the transport costs with the transporters. For
example, transport costs from Sassandra to San Pedro are fixed at 15,000 FCFA (interview 6).
Two different types of cooperatives exist in CIV: simple cooperatives companies (known as Scoops) and the
cooperatives companies with management board (known as Scoop-CAs).
The Scoops have a management council that elects it president, while the Scoop-CAs have a management board
that designates the director or the managing director of the cooperative.
In case of Scoop-CAs, an auditor must be appointed when the number of members of the cooperative exceeds
1,000 and the cooperative has a turnover of more than 100 million FCFA and a balance sheet of 5 million FCFA or
more.
During the last decade, with the increased certification of farmers, a large number of cooperatives has been created
by private buyers and traders to profit from the certification premium. Due to their relationships with the farmers
and their knowledge of the sector, they have been able to mobilize and organize the farmers within the cooperative.
According to UTZ data, there are 392 certified cooperatives in the San Pedro region (2017), and 813 in CIV.
Many existing cooperatives are headed by individuals with significant financial and political power. The majority of
them are weak to represent and defend the interests of the farmers in the negotiations with the private traders,
exporters and government bodies (CCC). They suffer from a lack of proper governance, weak financial position,
conflicts of interests, corruption and a low level of transparency and accountability. Many small cooperatives have
never been operating according to the provisions of the cooperative law in the sense that they do not have a
compliant organizational structure, they do not report annually to the members or to the Minister of Agriculture and
they occasionally organize general assemblies (interview 6).
The main problem is that most of the cooperatives do not really offer any advantages to the farmers. Most of the
cooperatives do not have the financial means to construct storage facilities or buy trucks to deliver cocoa to the
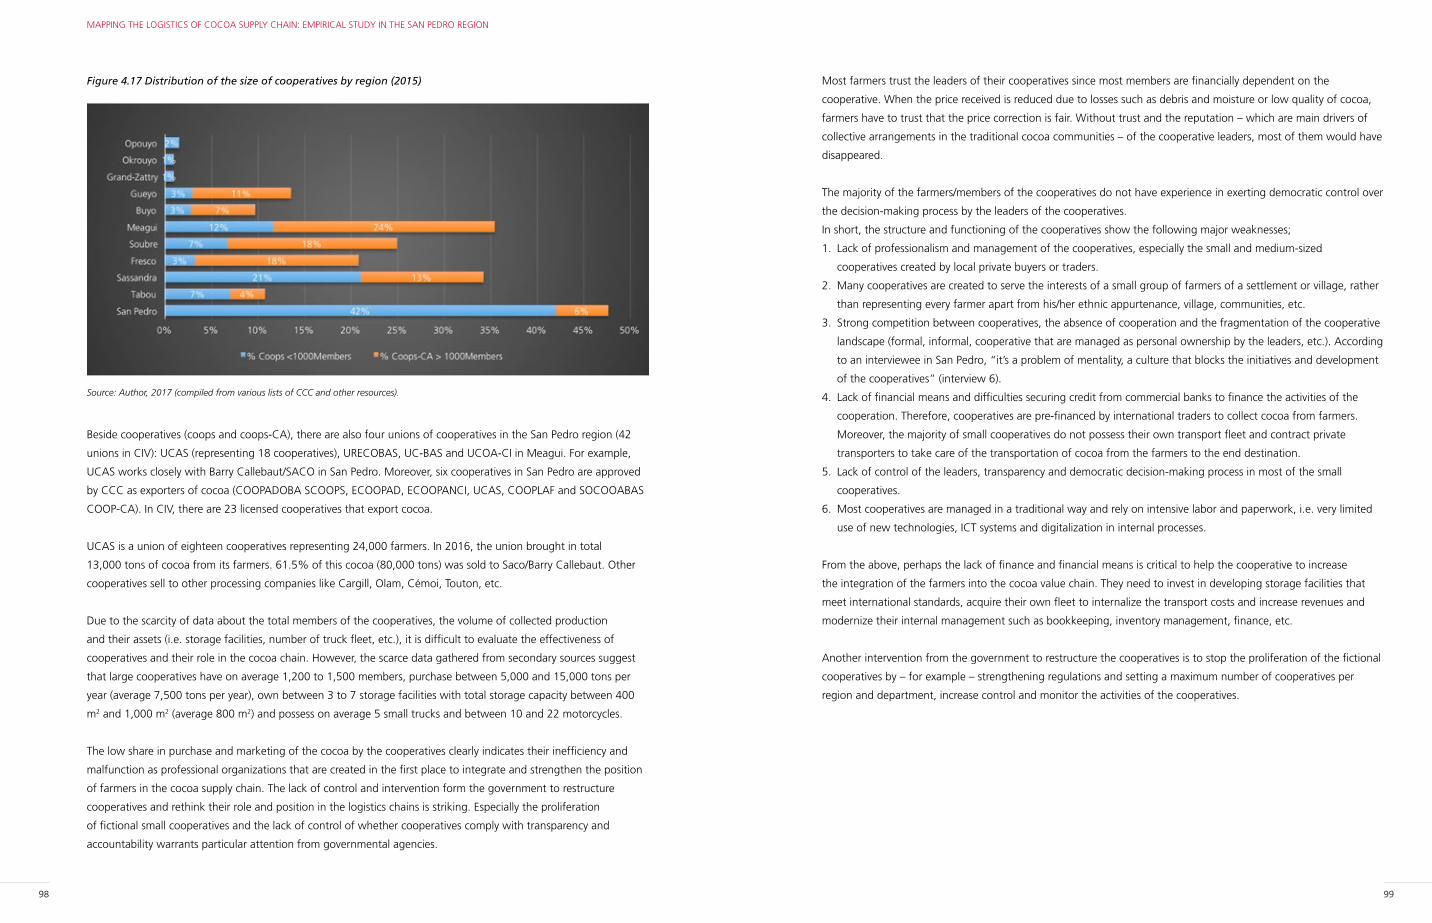
98 99
MAPPING THE LOGISTICS OF COCOA SUPPLY CHAIN: EMPIRICAL STUDY IN THE SAN PEDRO REGION
Most farmers trust the leaders of their cooperatives since most members are financially dependent on the
cooperative. When the price received is reduced due to losses such as debris and moisture or low quality of cocoa,
farmers have to trust that the price correction is fair. Without trust and the reputation – which are main drivers of
collective arrangements in the traditional cocoa communities – of the cooperative leaders, most of them would have
disappeared.
The majority of the farmers/members of the cooperatives do not have experience in exerting democratic control over
the decision-making process by the leaders of the cooperatives.
In short, the structure and functioning of the cooperatives show the following major weaknesses;
1. Lack of professionalism and management of the cooperatives, especially the small and medium-sized
cooperatives created by local private buyers or traders.
2. Many cooperatives are created to serve the interests of a small group of farmers of a settlement or village, rather
than representing every farmer apart from his/her ethnic appurtenance, village, communities, etc.
3. Strong competition between cooperatives, the absence of cooperation and the fragmentation of the cooperative
landscape (formal, informal, cooperative that are managed as personal ownership by the leaders, etc.). According
to an interviewee in San Pedro, “it’s a problem of mentality, a culture that blocks the initiatives and development
of the cooperatives” (interview 6).
4. Lack of financial means and difficulties securing credit from commercial banks to finance the activities of the
cooperation. Therefore, cooperatives are pre-financed by international traders to collect cocoa from farmers.
Moreover, the majority of small cooperatives do not possess their own transport fleet and contract private
transporters to take care of the transportation of cocoa from the farmers to the end destination.
5. Lack of control of the leaders, transparency and democratic decision-making process in most of the small
cooperatives.
6. Most cooperatives are managed in a traditional way and rely on intensive labor and paperwork, i.e. very limited
use of new technologies, ICT systems and digitalization in internal processes.
From the above, perhaps the lack of finance and financial means is critical to help the cooperative to increase
the integration of the farmers into the cocoa value chain. They need to invest in developing storage facilities that
meet international standards, acquire their own fleet to internalize the transport costs and increase revenues and
modernize their internal management such as bookkeeping, inventory management, finance, etc.
Another intervention from the government to restructure the cooperatives is to stop the proliferation of the fictional
cooperatives by – for example – strengthening regulations and setting a maximum number of cooperatives per
region and department, increase control and monitor the activities of the cooperatives.
Figure 4.17 Distribution of the size of cooperatives by region (2015)
Source: Author, 2017 (compiled from various lists of CCC and other resources).
Beside cooperatives (coops and coops-CA), there are also four unions of cooperatives in the San Pedro region (42
unions in CIV): UCAS (representing 18 cooperatives), URECOBAS, UC-BAS and UCOA-CI in Meagui. For example,
UCAS works closely with Barry Callebaut/SACO in San Pedro. Moreover, six cooperatives in San Pedro are approved
by CCC as exporters of cocoa (COOPADOBA SCOOPS, ECOOPAD, ECOOPANCI, UCAS, COOPLAF and SOCOOABAS
COOP-CA). In CIV, there are 23 licensed cooperatives that export cocoa.
UCAS is a union of eighteen cooperatives representing 24,000 farmers. In 2016, the union brought in total
13,000 tons of cocoa from its farmers. 61.5% of this cocoa (80,000 tons) was sold to Saco/Barry Callebaut. Other
cooperatives sell to other processing companies like Cargill, Olam, Cémoi, Touton, etc.
Due to the scarcity of data about the total members of the cooperatives, the volume of collected production
and their assets (i.e. storage facilities, number of truck fleet, etc.), it is difficult to evaluate the effectiveness of
cooperatives and their role in the cocoa chain. However, the scarce data gathered from secondary sources suggest
that large cooperatives have on average 1,200 to 1,500 members, purchase between 5,000 and 15,000 tons per
year (average 7,500 tons per year), own between 3 to 7 storage facilities with total storage capacity between 400
m2 and 1,000 m2 (average 800 m2) and possess on average 5 small trucks and between 10 and 22 motorcycles.
The low share in purchase and marketing of the cocoa by the cooperatives clearly indicates their inefficiency and
malfunction as professional organizations that are created in the first place to integrate and strengthen the position
of farmers in the cocoa supply chain. The lack of control and intervention form the government to restructure
cooperatives and rethink their role and position in the logistics chains is striking. Especially the proliferation
of fictional small cooperatives and the lack of control of whether cooperatives comply with transparency and
accountability warrants particular attention from governmental agencies.
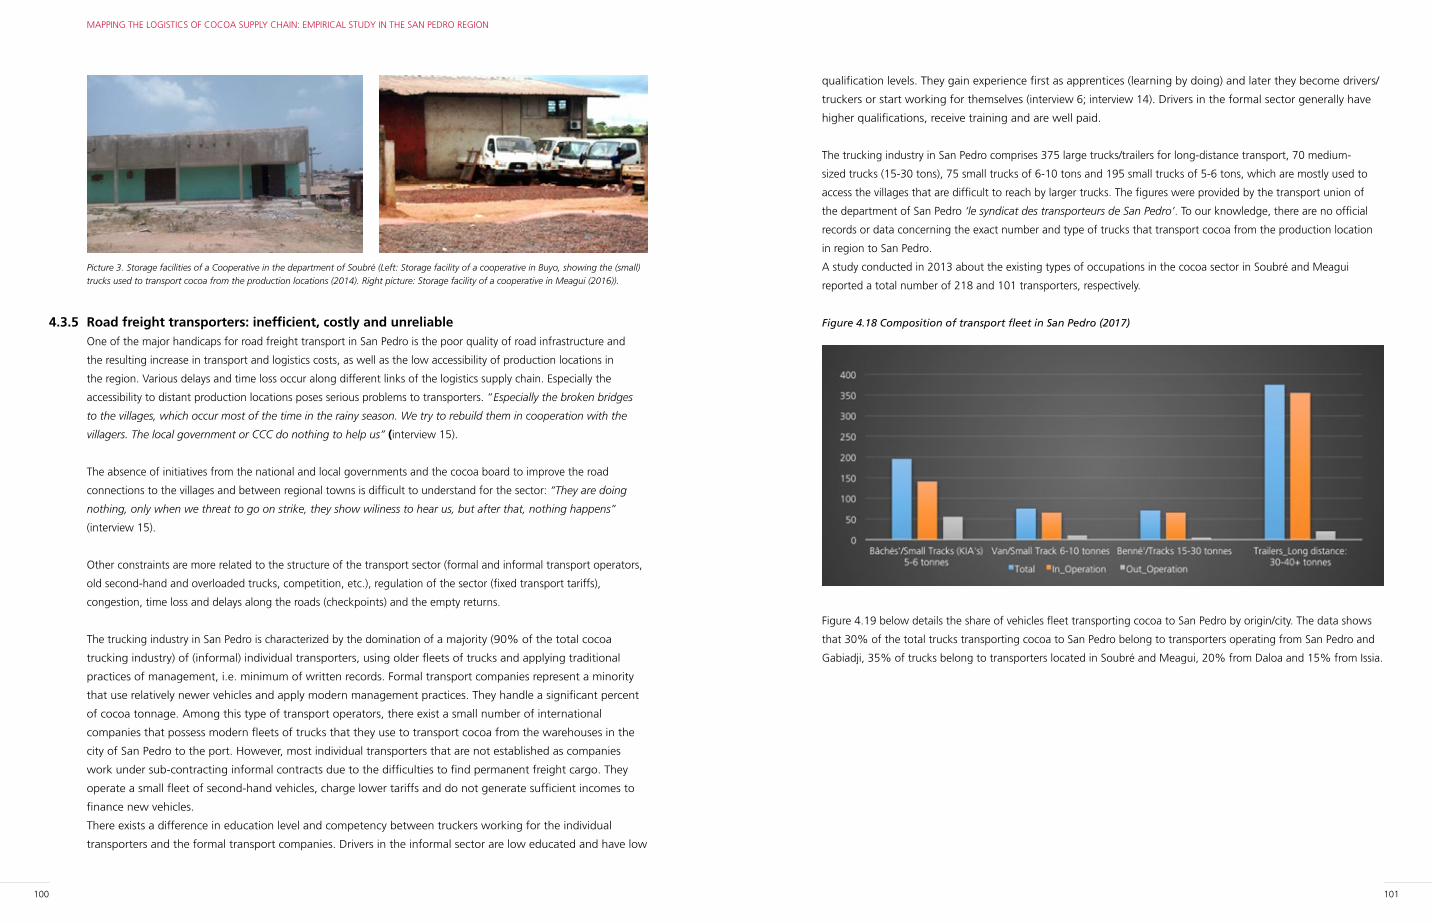
100 101
MAPPING THE LOGISTICS OF COCOA SUPPLY CHAIN: EMPIRICAL STUDY IN THE SAN PEDRO REGION
qualification levels. They gain experience first as apprentices (learning by doing) and later they become drivers/
truckers or start working for themselves (interview 6; interview 14). Drivers in the formal sector generally have
higher qualifications, receive training and are well paid.
The trucking industry in San Pedro comprises 375 large trucks/trailers for long-distance transport, 70 medium-
sized trucks (15-30 tons), 75 small trucks of 6-10 tons and 195 small trucks of 5-6 tons, which are mostly used to
access the villages that are difficult to reach by larger trucks. The figures were provided by the transport union of
the department of San Pedro ‘le syndicat des transporteurs de San Pedro’. To our knowledge, there are no official
records or data concerning the exact number and type of trucks that transport cocoa from the production location
in region to San Pedro.
A study conducted in 2013 about the existing types of occupations in the cocoa sector in Soubré and Meagui
reported a total number of 218 and 101 transporters, respectively.
Figure 4.18 Composition of transport fleet in San Pedro (2017)
Figure 4.19 below details the share of vehicles fleet transporting cocoa to San Pedro by origin/city. The data shows
that 30% of the total trucks transporting cocoa to San Pedro belong to transporters operating from San Pedro and
Gabiadji, 35% of trucks belong to transporters located in Soubré and Meagui, 20% from Daloa and 15% from Issia.
Picture 3. Storage facilities of a Cooperative in the department of Soubré (Left: Storage facility of a cooperative in Buyo, showing the (small)
trucks used to transport cocoa from the production locations (2014). Right picture: Storage facility of a cooperative in Meagui (2016)).
4.3.5 Road freight transporters: inefficient, costly and unreliable One of the major handicaps for road freight transport in San Pedro is the poor quality of road infrastructure and
the resulting increase in transport and logistics costs, as well as the low accessibility of production locations in
the region. Various delays and time loss occur along different links of the logistics supply chain. Especially the
accessibility to distant production locations poses serious problems to transporters. “Especially the broken bridges
to the villages, which occur most of the time in the rainy season. We try to rebuild them in cooperation with the
villagers. The local government or CCC do nothing to help us” (interview 15).
The absence of initiatives from the national and local governments and the cocoa board to improve the road
connections to the villages and between regional towns is difficult to understand for the sector: “They are doing
nothing, only when we threat to go on strike, they show wiliness to hear us, but after that, nothing happens”
(interview 15).
Other constraints are more related to the structure of the transport sector (formal and informal transport operators,
old second-hand and overloaded trucks, competition, etc.), regulation of the sector (fixed transport tariffs),
congestion, time loss and delays along the roads (checkpoints) and the empty returns.
The trucking industry in San Pedro is characterized by the domination of a majority (90% of the total cocoa
trucking industry) of (informal) individual transporters, using older fleets of trucks and applying traditional
practices of management, i.e. minimum of written records. Formal transport companies represent a minority
that use relatively newer vehicles and apply modern management practices. They handle a significant percent
of cocoa tonnage. Among this type of transport operators, there exist a small number of international
companies that possess modern fleets of trucks that they use to transport cocoa from the warehouses in the
city of San Pedro to the port. However, most individual transporters that are not established as companies
work under sub-contracting informal contracts due to the difficulties to find permanent freight cargo. They
operate a small fleet of second-hand vehicles, charge lower tariffs and do not generate sufficient incomes to
finance new vehicles.
There exists a difference in education level and competency between truckers working for the individual
transporters and the formal transport companies. Drivers in the informal sector are low educated and have low
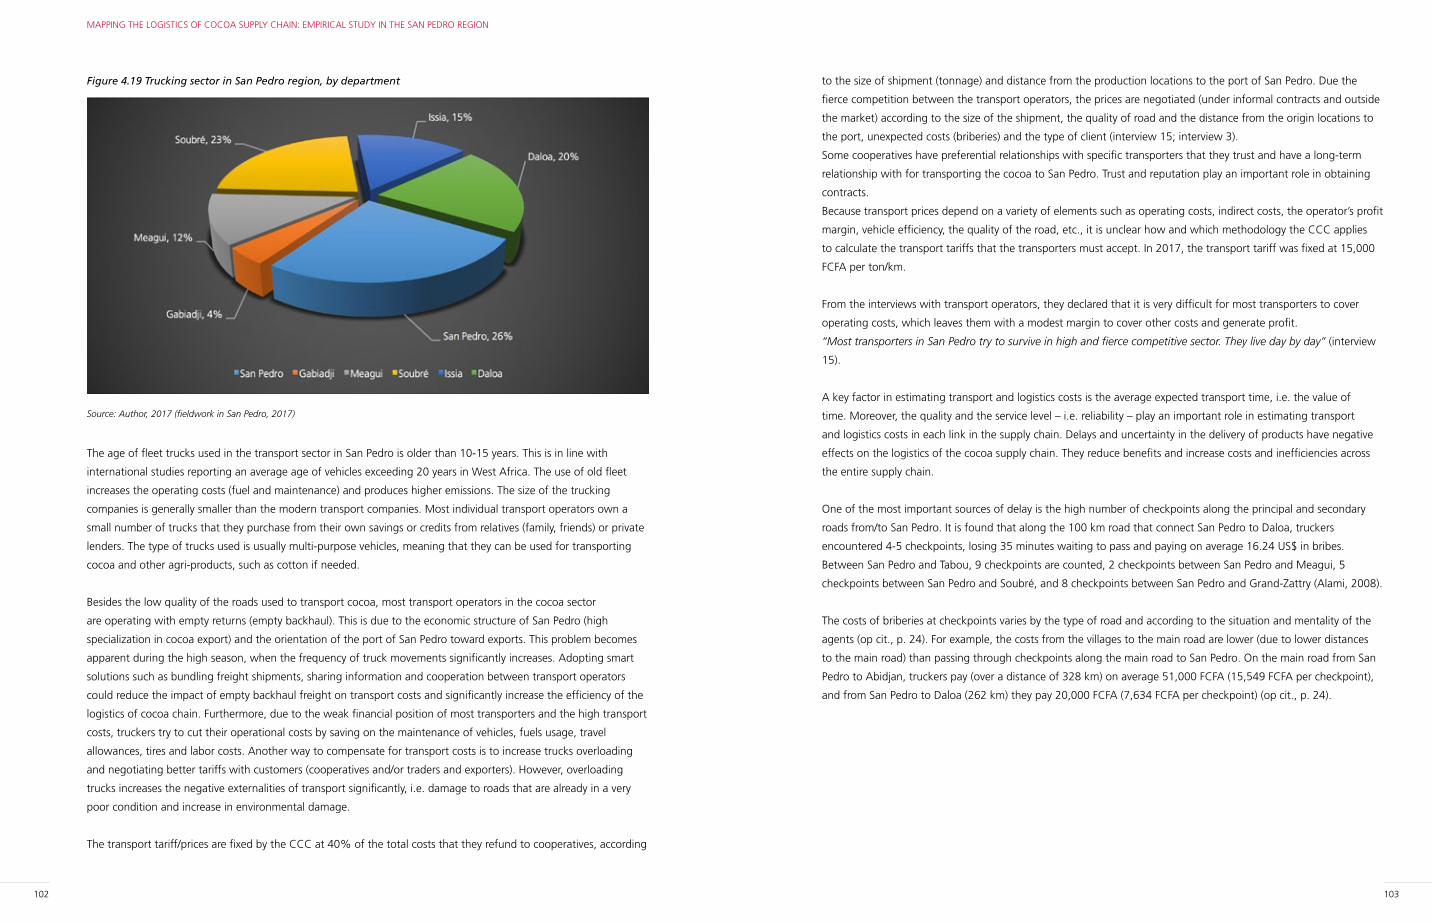
102 103
MAPPING THE LOGISTICS OF COCOA SUPPLY CHAIN: EMPIRICAL STUDY IN THE SAN PEDRO REGION
to the size of shipment (tonnage) and distance from the production locations to the port of San Pedro. Due the
fierce competition between the transport operators, the prices are negotiated (under informal contracts and outside
the market) according to the size of the shipment, the quality of road and the distance from the origin locations to
the port, unexpected costs (briberies) and the type of client (interview 15; interview 3).
Some cooperatives have preferential relationships with specific transporters that they trust and have a long-term
relationship with for transporting the cocoa to San Pedro. Trust and reputation play an important role in obtaining
contracts.
Because transport prices depend on a variety of elements such as operating costs, indirect costs, the operator’s profit
margin, vehicle efficiency, the quality of the road, etc., it is unclear how and which methodology the CCC applies
to calculate the transport tariffs that the transporters must accept. In 2017, the transport tariff was fixed at 15,000
FCFA per ton/km.
From the interviews with transport operators, they declared that it is very difficult for most transporters to cover
operating costs, which leaves them with a modest margin to cover other costs and generate profit.
“Most transporters in San Pedro try to survive in high and fierce competitive sector. They live day by day” (interview
15).
A key factor in estimating transport and logistics costs is the average expected transport time, i.e. the value of
time. Moreover, the quality and the service level – i.e. reliability – play an important role in estimating transport
and logistics costs in each link in the supply chain. Delays and uncertainty in the delivery of products have negative
effects on the logistics of the cocoa supply chain. They reduce benefits and increase costs and inefficiencies across
the entire supply chain.
One of the most important sources of delay is the high number of checkpoints along the principal and secondary
roads from/to San Pedro. It is found that along the 100 km road that connect San Pedro to Daloa, truckers
encountered 4-5 checkpoints, losing 35 minutes waiting to pass and paying on average 16.24 US$ in bribes.
Between San Pedro and Tabou, 9 checkpoints are counted, 2 checkpoints between San Pedro and Meagui, 5
checkpoints between San Pedro and Soubré, and 8 checkpoints between San Pedro and Grand-Zattry (Alami, 2008).
The costs of briberies at checkpoints varies by the type of road and according to the situation and mentality of the
agents (op cit., p. 24). For example, the costs from the villages to the main road are lower (due to lower distances
to the main road) than passing through checkpoints along the main road to San Pedro. On the main road from San
Pedro to Abidjan, truckers pay (over a distance of 328 km) on average 51,000 FCFA (15,549 FCFA per checkpoint),
and from San Pedro to Daloa (262 km) they pay 20,000 FCFA (7,634 FCFA per checkpoint) (op cit., p. 24).
Figure 4.19 Trucking sector in San Pedro region, by department
Source: Author, 2017 (fieldwork in San Pedro, 2017)
The age of fleet trucks used in the transport sector in San Pedro is older than 10-15 years. This is in line with
international studies reporting an average age of vehicles exceeding 20 years in West Africa. The use of old fleet
increases the operating costs (fuel and maintenance) and produces higher emissions. The size of the trucking
companies is generally smaller than the modern transport companies. Most individual transport operators own a
small number of trucks that they purchase from their own savings or credits from relatives (family, friends) or private
lenders. The type of trucks used is usually multi-purpose vehicles, meaning that they can be used for transporting
cocoa and other agri-products, such as cotton if needed.
Besides the low quality of the roads used to transport cocoa, most transport operators in the cocoa sector
are operating with empty returns (empty backhaul). This is due to the economic structure of San Pedro (high
specialization in cocoa export) and the orientation of the port of San Pedro toward exports. This problem becomes
apparent during the high season, when the frequency of truck movements significantly increases. Adopting smart
solutions such as bundling freight shipments, sharing information and cooperation between transport operators
could reduce the impact of empty backhaul freight on transport costs and significantly increase the efficiency of the
logistics of cocoa chain. Furthermore, due to the weak financial position of most transporters and the high transport
costs, truckers try to cut their operational costs by saving on the maintenance of vehicles, fuels usage, travel
allowances, tires and labor costs. Another way to compensate for transport costs is to increase trucks overloading
and negotiating better tariffs with customers (cooperatives and/or traders and exporters). However, overloading
trucks increases the negative externalities of transport significantly, i.e. damage to roads that are already in a very
poor condition and increase in environmental damage.
The transport tariff/prices are fixed by the CCC at 40% of the total costs that they refund to cooperatives, according
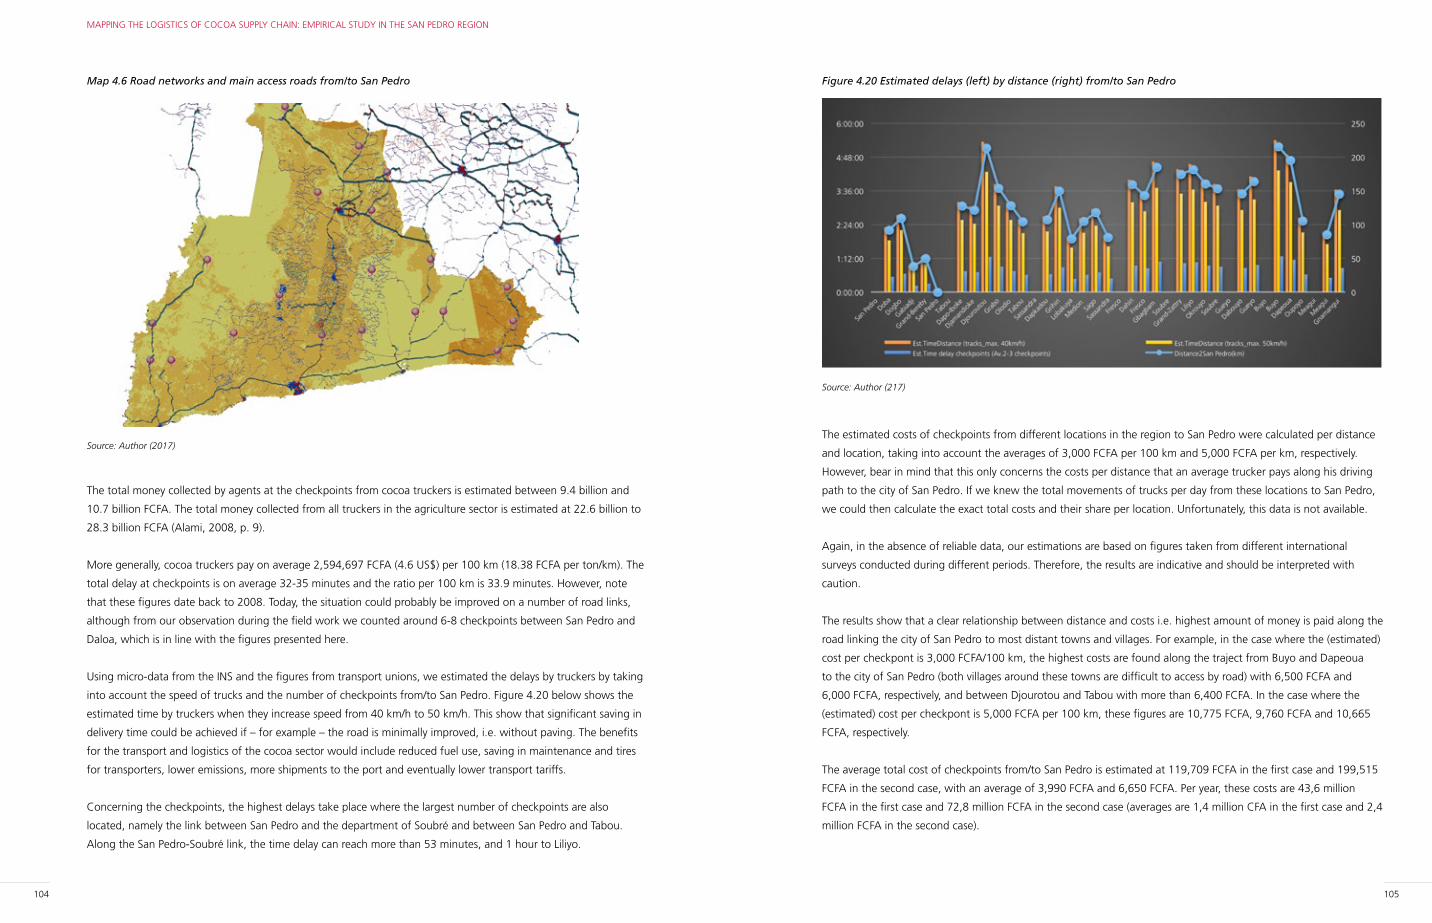
104 105
MAPPING THE LOGISTICS OF COCOA SUPPLY CHAIN: EMPIRICAL STUDY IN THE SAN PEDRO REGION
Figure 4.20 Estimated delays (left) by distance (right) from/to San Pedro
Source: Author (217)
The estimated costs of checkpoints from different locations in the region to San Pedro were calculated per distance
and location, taking into account the averages of 3,000 FCFA per 100 km and 5,000 FCFA per km, respectively.
However, bear in mind that this only concerns the costs per distance that an average trucker pays along his driving
path to the city of San Pedro. If we knew the total movements of trucks per day from these locations to San Pedro,
we could then calculate the exact total costs and their share per location. Unfortunately, this data is not available.
Again, in the absence of reliable data, our estimations are based on figures taken from different international
surveys conducted during different periods. Therefore, the results are indicative and should be interpreted with
caution.
The results show that a clear relationship between distance and costs i.e. highest amount of money is paid along the
road linking the city of San Pedro to most distant towns and villages. For example, in the case where the (estimated)
cost per checkpont is 3,000 FCFA/100 km, the highest costs are found along the traject from Buyo and Dapeoua
to the city of San Pedro (both villages around these towns are difficult to access by road) with 6,500 FCFA and
6,000 FCFA, respectively, and between Djourotou and Tabou with more than 6,400 FCFA. In the case where the
(estimated) cost per checkpont is 5,000 FCFA per 100 km, these figures are 10,775 FCFA, 9,760 FCFA and 10,665
FCFA, respectively.
The average total cost of checkpoints from/to San Pedro is estimated at 119,709 FCFA in the first case and 199,515
FCFA in the second case, with an average of 3,990 FCFA and 6,650 FCFA. Per year, these costs are 43,6 million
FCFA in the first case and 72,8 million FCFA in the second case (averages are 1,4 million CFA in the first case and 2,4
million FCFA in the second case).
Map 4.6 Road networks and main access roads from/to San Pedro
Source: Author (2017)
The total money collected by agents at the checkpoints from cocoa truckers is estimated between 9.4 billion and
10.7 billion FCFA. The total money collected from all truckers in the agriculture sector is estimated at 22.6 billion to
28.3 billion FCFA (Alami, 2008, p. 9).
More generally, cocoa truckers pay on average 2,594,697 FCFA (4.6 US$) per 100 km (18.38 FCFA per ton/km). The
total delay at checkpoints is on average 32-35 minutes and the ratio per 100 km is 33.9 minutes. However, note
that these figures date back to 2008. Today, the situation could probably be improved on a number of road links,
although from our observation during the field work we counted around 6-8 checkpoints between San Pedro and
Daloa, which is in line with the figures presented here.
Using micro-data from the INS and the figures from transport unions, we estimated the delays by truckers by taking
into account the speed of trucks and the number of checkpoints from/to San Pedro. Figure 4.20 below shows the
estimated time by truckers when they increase speed from 40 km/h to 50 km/h. This show that significant saving in
delivery time could be achieved if – for example – the road is minimally improved, i.e. without paving. The benefits
for the transport and logistics of the cocoa sector would include reduced fuel use, saving in maintenance and tires
for transporters, lower emissions, more shipments to the port and eventually lower transport tariffs.
Concerning the checkpoints, the highest delays take place where the largest number of checkpoints are also
located, namely the link between San Pedro and the department of Soubré and between San Pedro and Tabou.
Along the San Pedro-Soubré link, the time delay can reach more than 53 minutes, and 1 hour to Liliyo.
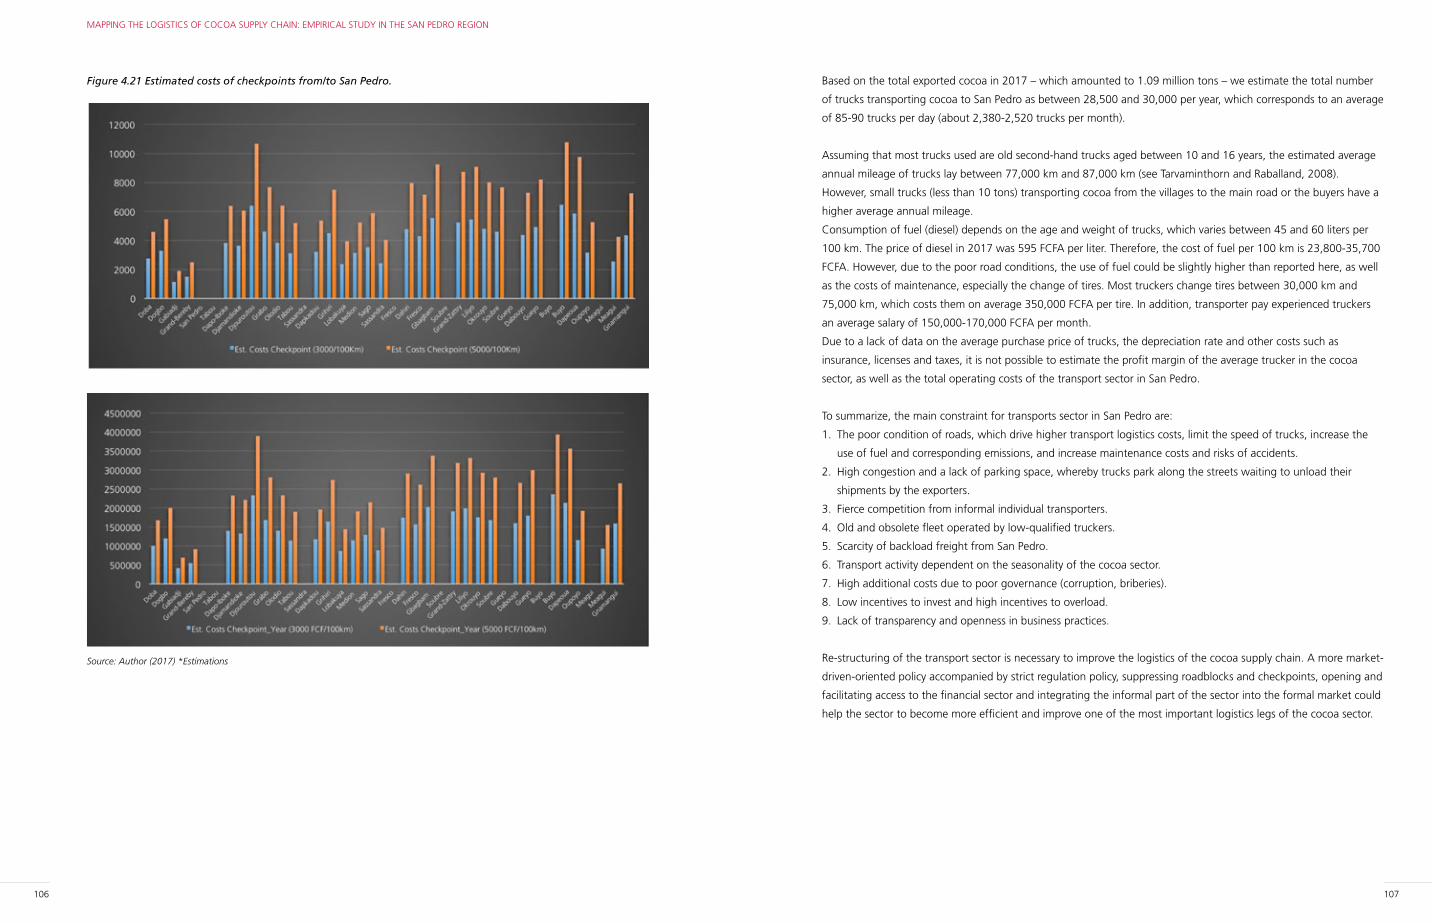
106 107
MAPPING THE LOGISTICS OF COCOA SUPPLY CHAIN: EMPIRICAL STUDY IN THE SAN PEDRO REGION
Based on the total exported cocoa in 2017 – which amounted to 1.09 million tons – we estimate the total number
of trucks transporting cocoa to San Pedro as between 28,500 and 30,000 per year, which corresponds to an average
of 85-90 trucks per day (about 2,380-2,520 trucks per month).
Assuming that most trucks used are old second-hand trucks aged between 10 and 16 years, the estimated average
annual mileage of trucks lay between 77,000 km and 87,000 km (see Tarvaminthorn and Raballand, 2008).
However, small trucks (less than 10 tons) transporting cocoa from the villages to the main road or the buyers have a
higher average annual mileage.
Consumption of fuel (diesel) depends on the age and weight of trucks, which varies between 45 and 60 liters per
100 km. The price of diesel in 2017 was 595 FCFA per liter. Therefore, the cost of fuel per 100 km is 23,800-35,700
FCFA. However, due to the poor road conditions, the use of fuel could be slightly higher than reported here, as well
as the costs of maintenance, especially the change of tires. Most truckers change tires between 30,000 km and
75,000 km, which costs them on average 350,000 FCFA per tire. In addition, transporter pay experienced truckers
an average salary of 150,000-170,000 FCFA per month.
Due to a lack of data on the average purchase price of trucks, the depreciation rate and other costs such as
insurance, licenses and taxes, it is not possible to estimate the profit margin of the average trucker in the cocoa
sector, as well as the total operating costs of the transport sector in San Pedro.
To summarize, the main constraint for transports sector in San Pedro are:
1. The poor condition of roads, which drive higher transport logistics costs, limit the speed of trucks, increase the
use of fuel and corresponding emissions, and increase maintenance costs and risks of accidents.
2. High congestion and a lack of parking space, whereby trucks park along the streets waiting to unload their
shipments by the exporters.
3. Fierce competition from informal individual transporters.
4. Old and obsolete fleet operated by low-qualified truckers.
5. Scarcity of backload freight from San Pedro.
6. Transport activity dependent on the seasonality of the cocoa sector.
7. High additional costs due to poor governance (corruption, briberies).
8. Low incentives to invest and high incentives to overload.
9. Lack of transparency and openness in business practices.
Re-structuring of the transport sector is necessary to improve the logistics of the cocoa supply chain. A more market-
driven-oriented policy accompanied by strict regulation policy, suppressing roadblocks and checkpoints, opening and
facilitating access to the financial sector and integrating the informal part of the sector into the formal market could
help the sector to become more efficient and improve one of the most important logistics legs of the cocoa sector.
Figure 4.21 Estimated costs of checkpoints from/to San Pedro.
Source: Author (2017) *Estimations
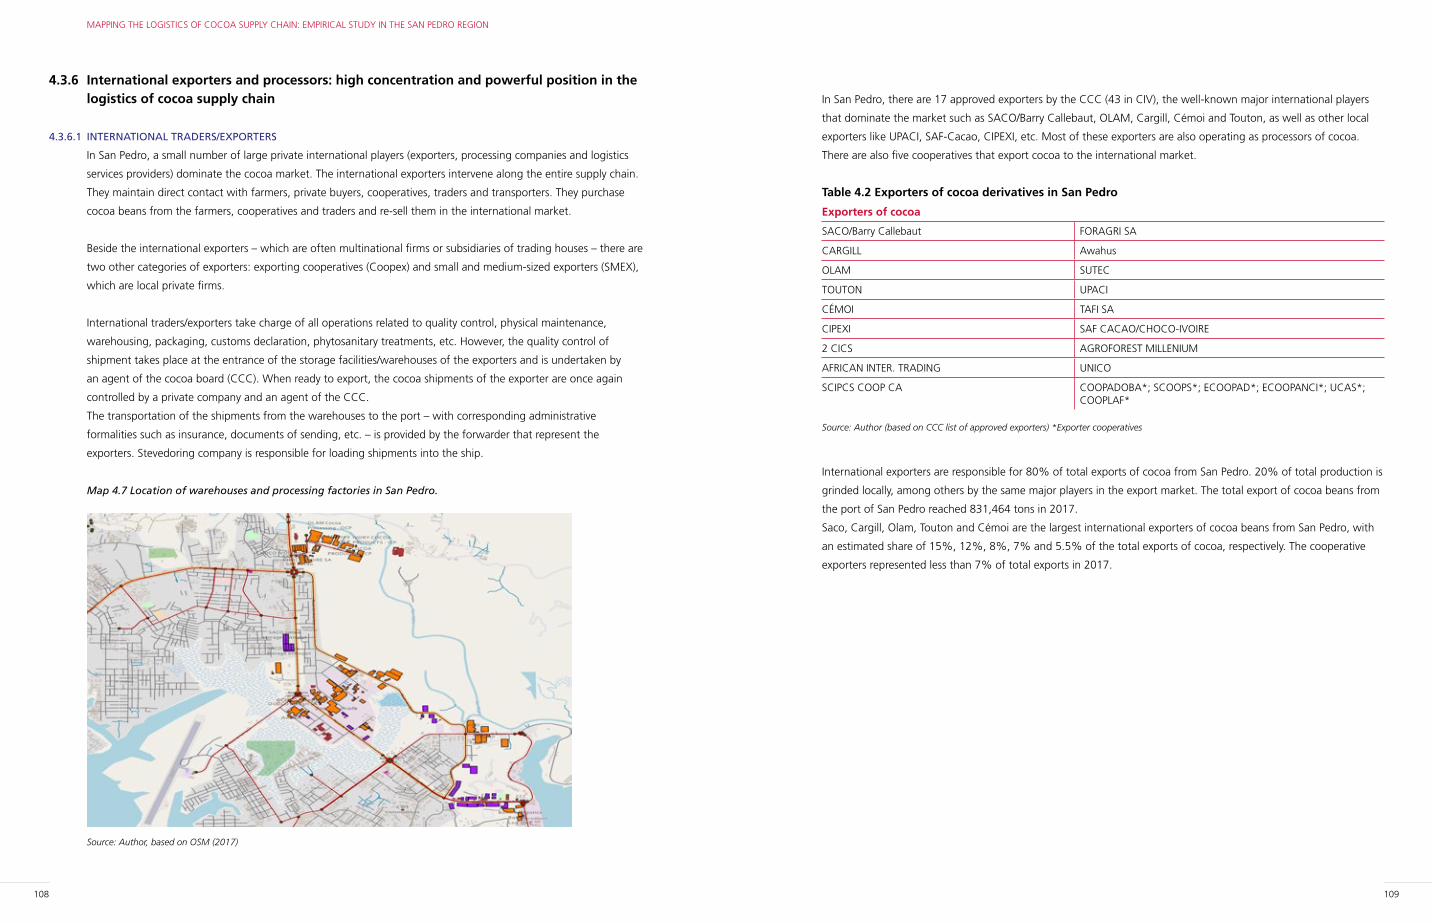
108 109
MAPPING THE LOGISTICS OF COCOA SUPPLY CHAIN: EMPIRICAL STUDY IN THE SAN PEDRO REGION
In San Pedro, there are 17 approved exporters by the CCC (43 in CIV), the well-known major international players
that dominate the market such as SACO/Barry Callebaut, OLAM, Cargill, Cémoi and Touton, as well as other local
exporters like UPACI, SAF-Cacao, CIPEXI, etc. Most of these exporters are also operating as processors of cocoa.
There are also five cooperatives that export cocoa to the international market.
Table 4.2 Exporters of cocoa derivatives in San Pedro
Exporters of cocoa
SACO/Barry Callebaut FORAGRI SA
CARGILL Awahus
OLAM SUTEC
TOUTON UPACI
CÉMOI TAFI SA
CIPEXI SAF CACAO/CHOCO-IVOIRE
2 CICS AGROFOREST MILLENIUM
AFRICAN INTER. TRADING UNICO
SCIPCS COOP CA COOPADOBA*; SCOOPS*; ECOOPAD*; ECOOPANCI*; UCAS*; COOPLAF*
Source: Author (based on CCC list of approved exporters) *Exporter cooperatives
International exporters are responsible for 80% of total exports of cocoa from San Pedro. 20% of total production is
grinded locally, among others by the same major players in the export market. The total export of cocoa beans from
the port of San Pedro reached 831,464 tons in 2017.
Saco, Cargill, Olam, Touton and Cémoi are the largest international exporters of cocoa beans from San Pedro, with
an estimated share of 15%, 12%, 8%, 7% and 5.5% of the total exports of cocoa, respectively. The cooperative
exporters represented less than 7% of total exports in 2017.
4.3.6 International exporters and processors: high concentration and powerful position in the logistics of cocoa supply chain
4.3.6.1 INTERNATIONAL TRADERS/EXPORTERS
In San Pedro, a small number of large private international players (exporters, processing companies and logistics
services providers) dominate the cocoa market. The international exporters intervene along the entire supply chain.
They maintain direct contact with farmers, private buyers, cooperatives, traders and transporters. They purchase
cocoa beans from the farmers, cooperatives and traders and re-sell them in the international market.
Beside the international exporters – which are often multinational firms or subsidiaries of trading houses – there are
two other categories of exporters: exporting cooperatives (Coopex) and small and medium-sized exporters (SMEX),
which are local private firms.
International traders/exporters take charge of all operations related to quality control, physical maintenance,
warehousing, packaging, customs declaration, phytosanitary treatments, etc. However, the quality control of
shipment takes place at the entrance of the storage facilities/warehouses of the exporters and is undertaken by
an agent of the cocoa board (CCC). When ready to export, the cocoa shipments of the exporter are once again
controlled by a private company and an agent of the CCC.
The transportation of the shipments from the warehouses to the port – with corresponding administrative
formalities such as insurance, documents of sending, etc. – is provided by the forwarder that represent the
exporters. Stevedoring company is responsible for loading shipments into the ship.
Map 4.7 Location of warehouses and processing factories in San Pedro.
Source: Author, based on OSM (2017)
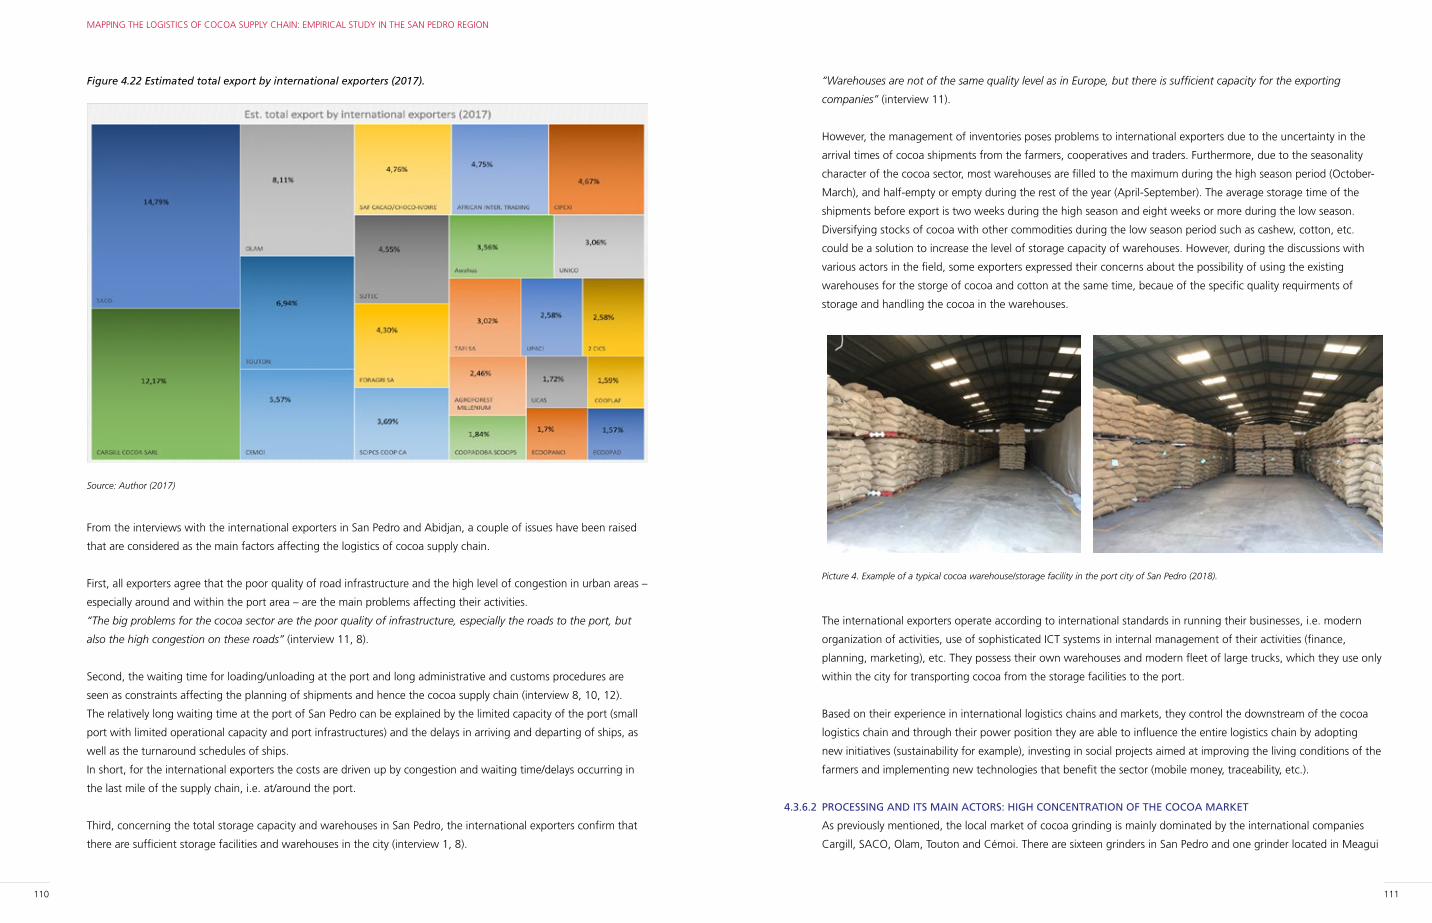
110 111
MAPPING THE LOGISTICS OF COCOA SUPPLY CHAIN: EMPIRICAL STUDY IN THE SAN PEDRO REGION
“Warehouses are not of the same quality level as in Europe, but there is sufficient capacity for the exporting
companies” (interview 11).
However, the management of inventories poses problems to international exporters due to the uncertainty in the
arrival times of cocoa shipments from the farmers, cooperatives and traders. Furthermore, due to the seasonality
character of the cocoa sector, most warehouses are filled to the maximum during the high season period (October-
March), and half-empty or empty during the rest of the year (April-September). The average storage time of the
shipments before export is two weeks during the high season and eight weeks or more during the low season.
Diversifying stocks of cocoa with other commodities during the low season period such as cashew, cotton, etc.
could be a solution to increase the level of storage capacity of warehouses. However, during the discussions with
various actors in the field, some exporters expressed their concerns about the possibility of using the existing
warehouses for the storge of cocoa and cotton at the same time, becaue of the specific quality requirments of
storage and handling the cocoa in the warehouses.
Picture 4. Example of a typical cocoa warehouse/storage facility in the port city of San Pedro (2018).
The international exporters operate according to international standards in running their businesses, i.e. modern
organization of activities, use of sophisticated ICT systems in internal management of their activities (finance,
planning, marketing), etc. They possess their own warehouses and modern fleet of large trucks, which they use only
within the city for transporting cocoa from the storage facilities to the port.
Based on their experience in international logistics chains and markets, they control the downstream of the cocoa
logistics chain and through their power position they are able to influence the entire logistics chain by adopting
new initiatives (sustainability for example), investing in social projects aimed at improving the living conditions of the
farmers and implementing new technologies that benefit the sector (mobile money, traceability, etc.).
4.3.6.2 PROCESSING AND ITS MAIN ACTORS: HIGH CONCENTRATION OF THE COCOA MARKET
As previously mentioned, the local market of cocoa grinding is mainly dominated by the international companies
Cargill, SACO, Olam, Touton and Cémoi. There are sixteen grinders in San Pedro and one grinder located in Meagui
Figure 4.22 Estimated total export by international exporters (2017).
Source: Author (2017)
From the interviews with the international exporters in San Pedro and Abidjan, a couple of issues have been raised
that are considered as the main factors affecting the logistics of cocoa supply chain.
First, all exporters agree that the poor quality of road infrastructure and the high level of congestion in urban areas –
especially around and within the port area – are the main problems affecting their activities.
“The big problems for the cocoa sector are the poor quality of infrastructure, especially the roads to the port, but
also the high congestion on these roads” (interview 11, 8).
Second, the waiting time for loading/unloading at the port and long administrative and customs procedures are
seen as constraints affecting the planning of shipments and hence the cocoa supply chain (interview 8, 10, 12).
The relatively long waiting time at the port of San Pedro can be explained by the limited capacity of the port (small
port with limited operational capacity and port infrastructures) and the delays in arriving and departing of ships, as
well as the turnaround schedules of ships.
In short, for the international exporters the costs are driven up by congestion and waiting time/delays occurring in
the last mile of the supply chain, i.e. at/around the port.
Third, concerning the total storage capacity and warehouses in San Pedro, the international exporters confirm that
there are sufficient storage facilities and warehouses in the city (interview 1, 8).
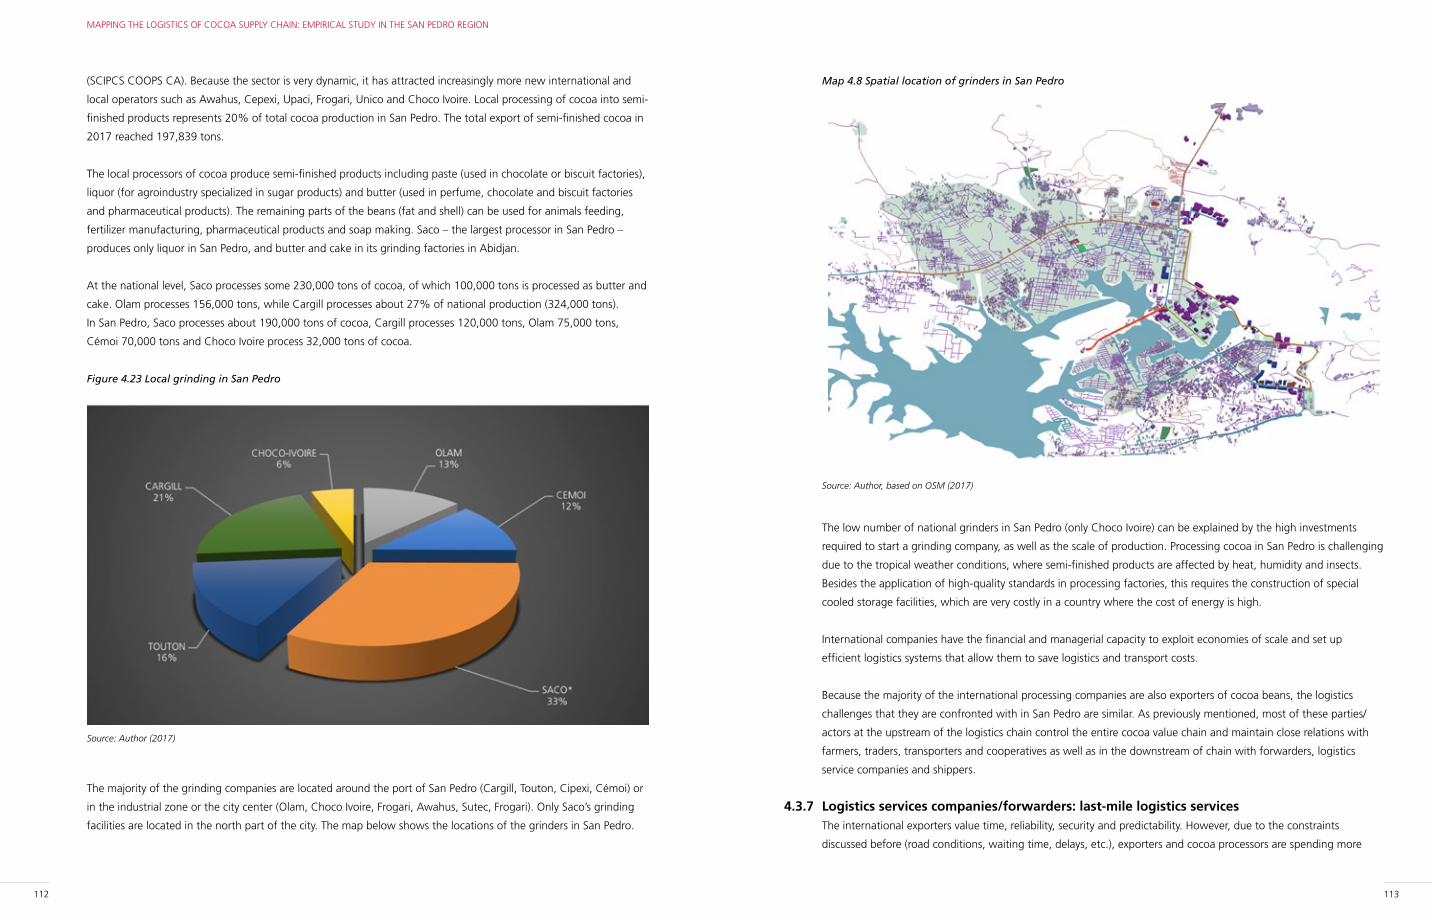
112 113
MAPPING THE LOGISTICS OF COCOA SUPPLY CHAIN: EMPIRICAL STUDY IN THE SAN PEDRO REGION
Map 4.8 Spatial location of grinders in San Pedro
Source: Author, based on OSM (2017)
The low number of national grinders in San Pedro (only Choco Ivoire) can be explained by the high investments
required to start a grinding company, as well as the scale of production. Processing cocoa in San Pedro is challenging
due to the tropical weather conditions, where semi-finished products are affected by heat, humidity and insects.
Besides the application of high-quality standards in processing factories, this requires the construction of special
cooled storage facilities, which are very costly in a country where the cost of energy is high.
International companies have the financial and managerial capacity to exploit economies of scale and set up
efficient logistics systems that allow them to save logistics and transport costs.
Because the majority of the international processing companies are also exporters of cocoa beans, the logistics
challenges that they are confronted with in San Pedro are similar. As previously mentioned, most of these parties/
actors at the upstream of the logistics chain control the entire cocoa value chain and maintain close relations with
farmers, traders, transporters and cooperatives as well as in the downstream of chain with forwarders, logistics
service companies and shippers.
4.3.7 Logistics services companies/forwarders: last-mile logistics services The international exporters value time, reliability, security and predictability. However, due to the constraints
discussed before (road conditions, waiting time, delays, etc.), exporters and cocoa processors are spending more
(SCIPCS COOPS CA). Because the sector is very dynamic, it has attracted increasingly more new international and
local operators such as Awahus, Cepexi, Upaci, Frogari, Unico and Choco Ivoire. Local processing of cocoa into semi-
finished products represents 20% of total cocoa production in San Pedro. The total export of semi-finished cocoa in
2017 reached 197,839 tons.
The local processors of cocoa produce semi-finished products including paste (used in chocolate or biscuit factories),
liquor (for agroindustry specialized in sugar products) and butter (used in perfume, chocolate and biscuit factories
and pharmaceutical products). The remaining parts of the beans (fat and shell) can be used for animals feeding,
fertilizer manufacturing, pharmaceutical products and soap making. Saco – the largest processor in San Pedro –
produces only liquor in San Pedro, and butter and cake in its grinding factories in Abidjan.
At the national level, Saco processes some 230,000 tons of cocoa, of which 100,000 tons is processed as butter and
cake. Olam processes 156,000 tons, while Cargill processes about 27% of national production (324,000 tons).
In San Pedro, Saco processes about 190,000 tons of cocoa, Cargill processes 120,000 tons, Olam 75,000 tons,
Cémoi 70,000 tons and Choco Ivoire process 32,000 tons of cocoa.
Figure 4.23 Local grinding in San Pedro
Source: Author (2017)
The majority of the grinding companies are located around the port of San Pedro (Cargill, Touton, Cipexi, Cémoi) or
in the industrial zone or the city center (Olam, Choco Ivoire, Frogari, Awahus, Sutec, Frogari). Only Saco’s grinding
facilities are located in the north part of the city. The map below shows the locations of the grinders in San Pedro.
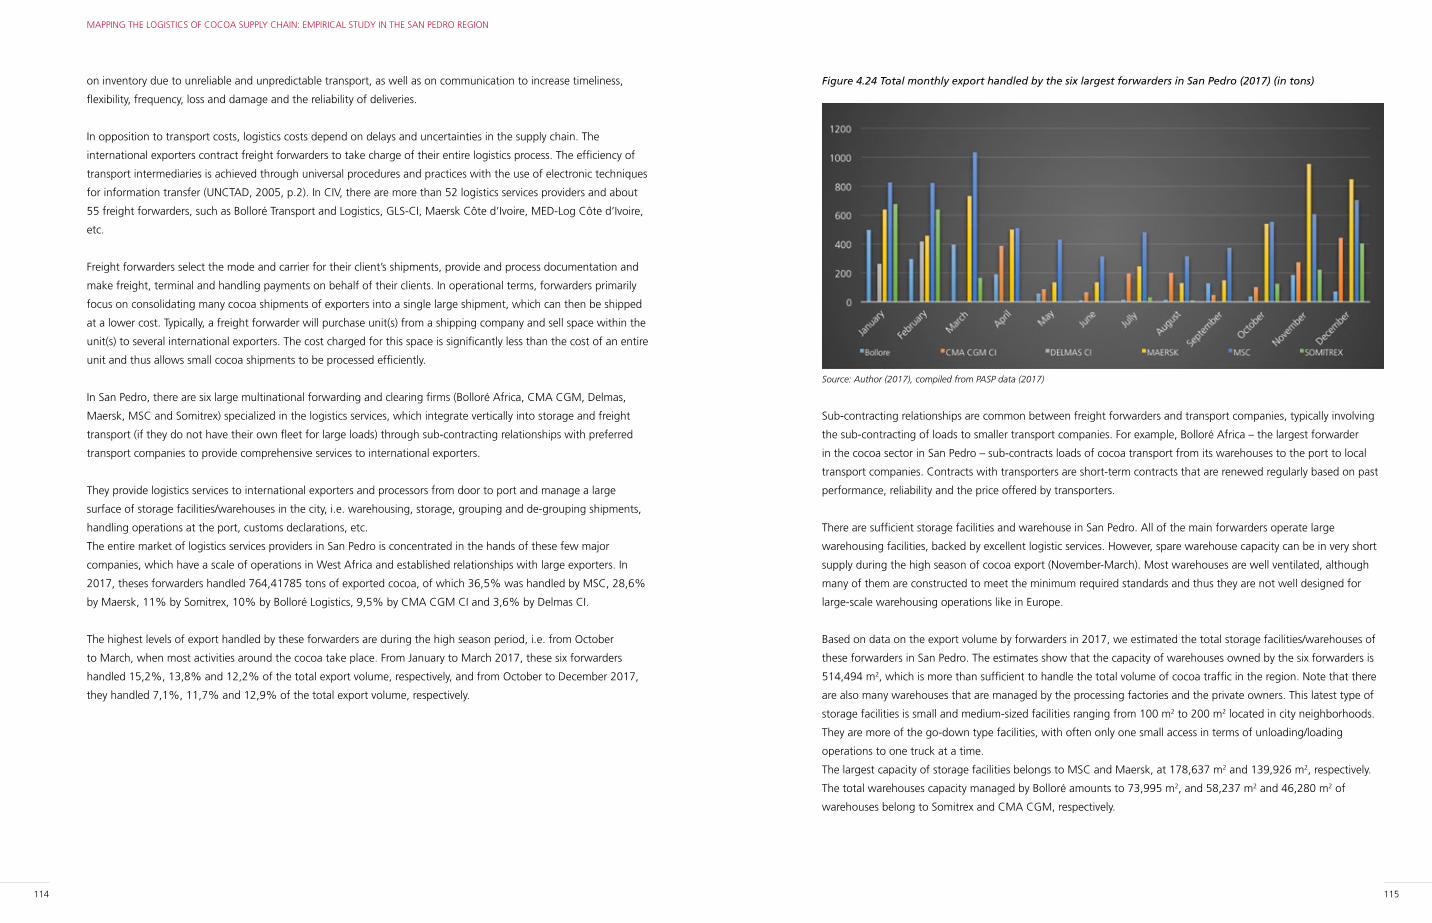
114 115
MAPPING THE LOGISTICS OF COCOA SUPPLY CHAIN: EMPIRICAL STUDY IN THE SAN PEDRO REGION
Figure 4.24 Total monthly export handled by the six largest forwarders in San Pedro (2017) (in tons)
Source: Author (2017), compiled from PASP data (2017)
Sub-contracting relationships are common between freight forwarders and transport companies, typically involving
the sub-contracting of loads to smaller transport companies. For example, Bolloré Africa – the largest forwarder
in the cocoa sector in San Pedro – sub-contracts loads of cocoa transport from its warehouses to the port to local
transport companies. Contracts with transporters are short-term contracts that are renewed regularly based on past
performance, reliability and the price offered by transporters.
There are sufficient storage facilities and warehouse in San Pedro. All of the main forwarders operate large
warehousing facilities, backed by excellent logistic services. However, spare warehouse capacity can be in very short
supply during the high season of cocoa export (November-March). Most warehouses are well ventilated, although
many of them are constructed to meet the minimum required standards and thus they are not well designed for
large-scale warehousing operations like in Europe.
Based on data on the export volume by forwarders in 2017, we estimated the total storage facilities/warehouses of
these forwarders in San Pedro. The estimates show that the capacity of warehouses owned by the six forwarders is
514,494 m2, which is more than sufficient to handle the total volume of cocoa traffic in the region. Note that there
are also many warehouses that are managed by the processing factories and the private owners. This latest type of
storage facilities is small and medium-sized facilities ranging from 100 m2 to 200 m2 located in city neighborhoods.
They are more of the go-down type facilities, with often only one small access in terms of unloading/loading
operations to one truck at a time.
The largest capacity of storage facilities belongs to MSC and Maersk, at 178,637 m2 and 139,926 m2, respectively.
The total warehouses capacity managed by Bolloré amounts to 73,995 m2, and 58,237 m2 and 46,280 m2 of
warehouses belong to Somitrex and CMA CGM, respectively.
on inventory due to unreliable and unpredictable transport, as well as on communication to increase timeliness,
flexibility, frequency, loss and damage and the reliability of deliveries.
In opposition to transport costs, logistics costs depend on delays and uncertainties in the supply chain. The
international exporters contract freight forwarders to take charge of their entire logistics process. The efficiency of
transport intermediaries is achieved through universal procedures and practices with the use of electronic techniques
for information transfer (UNCTAD, 2005, p.2). In CIV, there are more than 52 logistics services providers and about
55 freight forwarders, such as Bolloré Transport and Logistics, GLS-CI, Maersk Côte d’Ivoire, MED-Log Côte d’Ivoire,
etc.
Freight forwarders select the mode and carrier for their client’s shipments, provide and process documentation and
make freight, terminal and handling payments on behalf of their clients. In operational terms, forwarders primarily
focus on consolidating many cocoa shipments of exporters into a single large shipment, which can then be shipped
at a lower cost. Typically, a freight forwarder will purchase unit(s) from a shipping company and sell space within the
unit(s) to several international exporters. The cost charged for this space is significantly less than the cost of an entire
unit and thus allows small cocoa shipments to be processed efficiently.
In San Pedro, there are six large multinational forwarding and clearing firms (Bolloré Africa, CMA CGM, Delmas,
Maersk, MSC and Somitrex) specialized in the logistics services, which integrate vertically into storage and freight
transport (if they do not have their own fleet for large loads) through sub-contracting relationships with preferred
transport companies to provide comprehensive services to international exporters.
They provide logistics services to international exporters and processors from door to port and manage a large
surface of storage facilities/warehouses in the city, i.e. warehousing, storage, grouping and de-grouping shipments,
handling operations at the port, customs declarations, etc.
The entire market of logistics services providers in San Pedro is concentrated in the hands of these few major
companies, which have a scale of operations in West Africa and established relationships with large exporters. In
2017, theses forwarders handled 764,41785 tons of exported cocoa, of which 36,5% was handled by MSC, 28,6%
by Maersk, 11% by Somitrex, 10% by Bolloré Logistics, 9,5% by CMA CGM CI and 3,6% by Delmas CI.
The highest levels of export handled by these forwarders are during the high season period, i.e. from October
to March, when most activities around the cocoa take place. From January to March 2017, these six forwarders
handled 15,2%, 13,8% and 12,2% of the total export volume, respectively, and from October to December 2017,
they handled 7,1%, 11,7% and 12,9% of the total export volume, respectively.
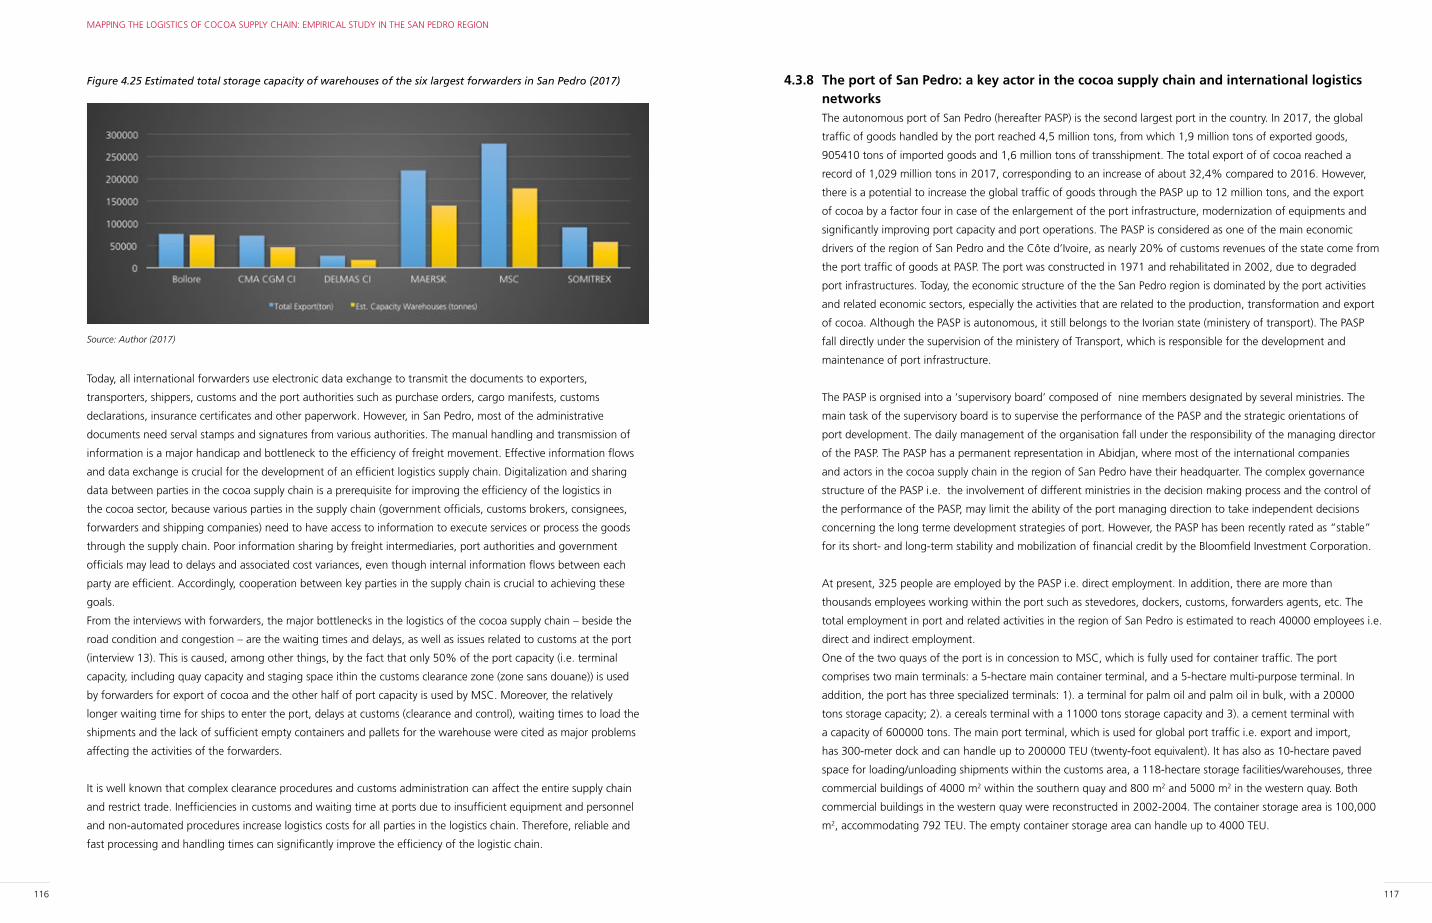
116 117
MAPPING THE LOGISTICS OF COCOA SUPPLY CHAIN: EMPIRICAL STUDY IN THE SAN PEDRO REGION
4.3.8 The port of San Pedro: a key actor in the cocoa supply chain and international logistics networksThe autonomous port of San Pedro (hereafter PASP) is the second largest port in the country. In 2017, the global
traffic of goods handled by the port reached 4,5 million tons, from which 1,9 million tons of exported goods,
905410 tons of imported goods and 1,6 million tons of transshipment. The total export of of cocoa reached a
record of 1,029 million tons in 2017, corresponding to an increase of about 32,4% compared to 2016. However,
there is a potential to increase the global traffic of goods through the PASP up to 12 million tons, and the export
of cocoa by a factor four in case of the enlargement of the port infrastructure, modernization of equipments and
significantly improving port capacity and port operations. The PASP is considered as one of the main economic
drivers of the region of San Pedro and the Côte d’Ivoire, as nearly 20% of customs revenues of the state come from
the port traffic of goods at PASP. The port was constructed in 1971 and rehabilitated in 2002, due to degraded
port infrastructures. Today, the economic structure of the the San Pedro region is dominated by the port activities
and related economic sectors, especially the activities that are related to the production, transformation and export
of cocoa. Although the PASP is autonomous, it still belongs to the Ivorian state (ministery of transport). The PASP
fall directly under the supervision of the ministery of Transport, which is responsible for the development and
maintenance of port infrastructure.
The PASP is orgnised into a ‘supervisory board’ composed of nine members designated by several ministries. The
main task of the supervisory board is to supervise the performance of the PASP and the strategic orientations of
port development. The daily management of the organisation fall under the responsibility of the managing director
of the PASP. The PASP has a permanent representation in Abidjan, where most of the international companies
and actors in the cocoa supply chain in the region of San Pedro have their headquarter. The complex governance
structure of the PASP i.e. the involvement of different ministries in the decision making process and the control of
the performance of the PASP, may limit the ability of the port managing direction to take independent decisions
concerning the long terme development strategies of port. However, the PASP has been recently rated as “stable”
for its short- and long-term stability and mobilization of financial credit by the Bloomfield Investment Corporation.
At present, 325 people are employed by the PASP i.e. direct employment. In addition, there are more than
thousands employees working within the port such as stevedores, dockers, customs, forwarders agents, etc. The
total employment in port and related activities in the region of San Pedro is estimated to reach 40000 employees i.e.
direct and indirect employment.
One of the two quays of the port is in concession to MSC, which is fully used for container traffic. The port
comprises two main terminals: a 5-hectare main container terminal, and a 5-hectare multi-purpose terminal. In
addition, the port has three specialized terminals: 1). a terminal for palm oil and palm oil in bulk, with a 20000
tons storage capacity; 2). a cereals terminal with a 11000 tons storage capacity and 3). a cement terminal with
a capacity of 600000 tons. The main port terminal, which is used for global port traffic i.e. export and import,
has 300-meter dock and can handle up to 200000 TEU (twenty-foot equivalent). It has also as 10-hectare paved
space for loading/unloading shipments within the customs area, a 118-hectare storage facilities/warehouses, three
commercial buildings of 4000 m2 within the southern quay and 800 m2 and 5000 m2 in the western quay. Both
commercial buildings in the western quay were reconstructed in 2002-2004. The container storage area is 100,000
m2, accommodating 792 TEU. The empty container storage area can handle up to 4000 TEU.
Figure 4.25 Estimated total storage capacity of warehouses of the six largest forwarders in San Pedro (2017)
Source: Author (2017)
Today, all international forwarders use electronic data exchange to transmit the documents to exporters,
transporters, shippers, customs and the port authorities such as purchase orders, cargo manifests, customs
declarations, insurance certificates and other paperwork. However, in San Pedro, most of the administrative
documents need serval stamps and signatures from various authorities. The manual handling and transmission of
information is a major handicap and bottleneck to the efficiency of freight movement. Effective information flows
and data exchange is crucial for the development of an efficient logistics supply chain. Digitalization and sharing
data between parties in the cocoa supply chain is a prerequisite for improving the efficiency of the logistics in
the cocoa sector, because various parties in the supply chain (government officials, customs brokers, consignees,
forwarders and shipping companies) need to have access to information to execute services or process the goods
through the supply chain. Poor information sharing by freight intermediaries, port authorities and government
officials may lead to delays and associated cost variances, even though internal information flows between each
party are efficient. Accordingly, cooperation between key parties in the supply chain is crucial to achieving these
goals.
From the interviews with forwarders, the major bottlenecks in the logistics of the cocoa supply chain – beside the
road condition and congestion – are the waiting times and delays, as well as issues related to customs at the port
(interview 13). This is caused, among other things, by the fact that only 50% of the port capacity (i.e. terminal
capacity, including quay capacity and staging space ithin the customs clearance zone (zone sans douane)) is used
by forwarders for export of cocoa and the other half of port capacity is used by MSC. Moreover, the relatively
longer waiting time for ships to enter the port, delays at customs (clearance and control), waiting times to load the
shipments and the lack of sufficient empty containers and pallets for the warehouse were cited as major problems
affecting the activities of the forwarders.
It is well known that complex clearance procedures and customs administration can affect the entire supply chain
and restrict trade. Inefficiencies in customs and waiting time at ports due to insufficient equipment and personnel
and non-automated procedures increase logistics costs for all parties in the logistics chain. Therefore, reliable and
fast processing and handling times can significantly improve the efficiency of the logistic chain.
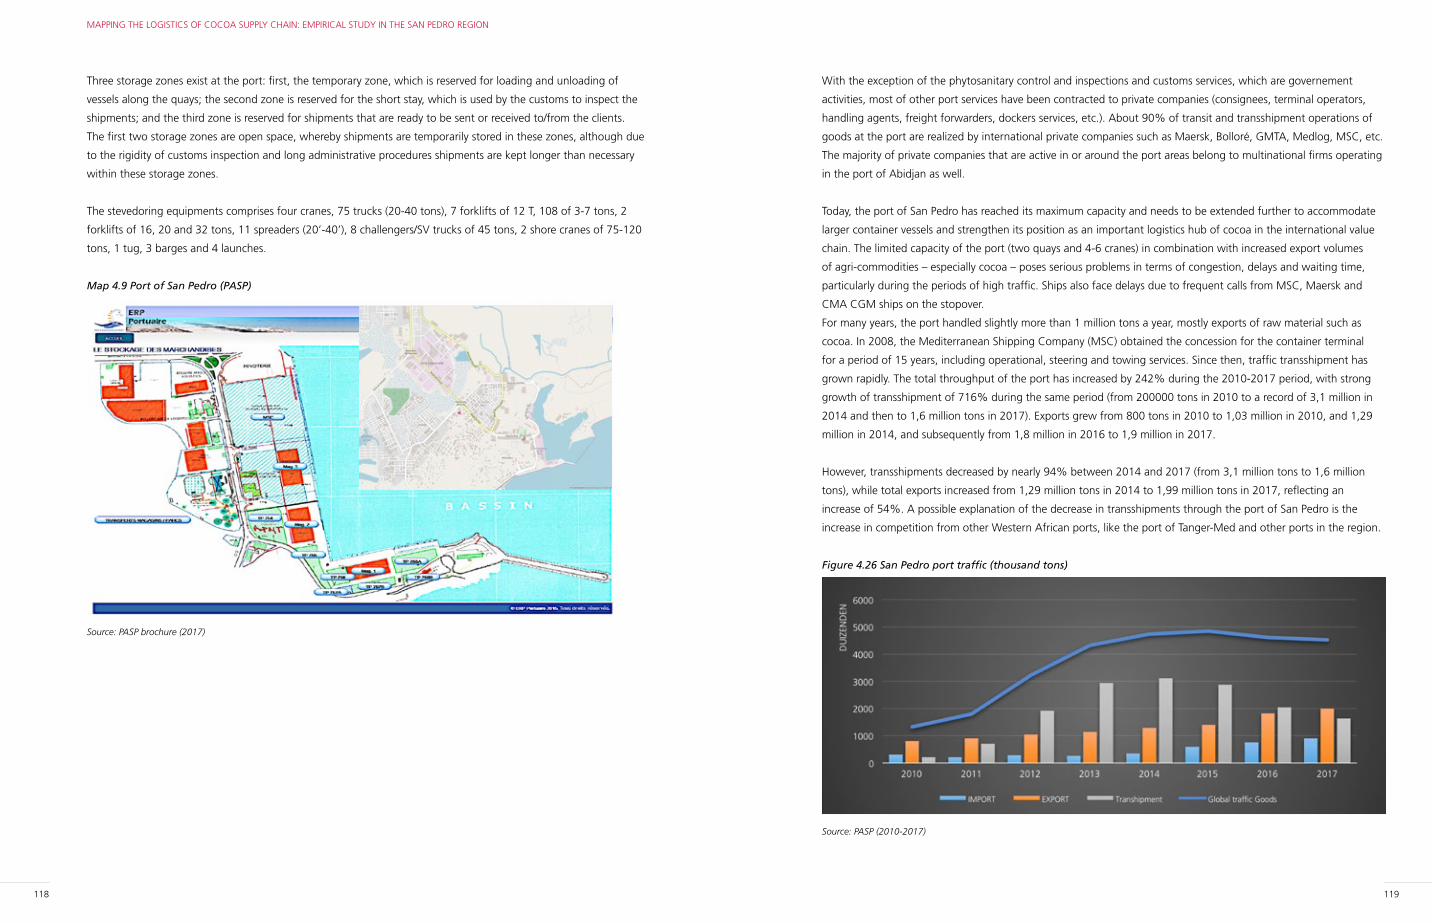
118 119
MAPPING THE LOGISTICS OF COCOA SUPPLY CHAIN: EMPIRICAL STUDY IN THE SAN PEDRO REGION
With the exception of the phytosanitary control and inspections and customs services, which are governement
activities, most of other port services have been contracted to private companies (consignees, terminal operators,
handling agents, freight forwarders, dockers services, etc.). About 90% of transit and transshipment operations of
goods at the port are realized by international private companies such as Maersk, Bolloré, GMTA, Medlog, MSC, etc.
The majority of private companies that are active in or around the port areas belong to multinational firms operating
in the port of Abidjan as well.
Today, the port of San Pedro has reached its maximum capacity and needs to be extended further to accommodate
larger container vessels and strengthen its position as an important logistics hub of cocoa in the international value
chain. The limited capacity of the port (two quays and 4-6 cranes) in combination with increased export volumes
of agri-commodities – especially cocoa – poses serious problems in terms of congestion, delays and waiting time,
particularly during the periods of high traffic. Ships also face delays due to frequent calls from MSC, Maersk and
CMA CGM ships on the stopover.
For many years, the port handled slightly more than 1 million tons a year, mostly exports of raw material such as
cocoa. In 2008, the Mediterranean Shipping Company (MSC) obtained the concession for the container terminal
for a period of 15 years, including operational, steering and towing services. Since then, traffic transshipment has
grown rapidly. The total throughput of the port has increased by 242% during the 2010-2017 period, with strong
growth of transshipment of 716% during the same period (from 200000 tons in 2010 to a record of 3,1 million in
2014 and then to 1,6 million tons in 2017). Exports grew from 800 tons in 2010 to 1,03 million in 2010, and 1,29
million in 2014, and subsequently from 1,8 million in 2016 to 1,9 million in 2017.
However, transshipments decreased by nearly 94% between 2014 and 2017 (from 3,1 million tons to 1,6 million
tons), while total exports increased from 1,29 million tons in 2014 to 1,99 million tons in 2017, reflecting an
increase of 54%. A possible explanation of the decrease in transshipments through the port of San Pedro is the
increase in competition from other Western African ports, like the port of Tanger-Med and other ports in the region.
Figure 4.26 San Pedro port traffic (thousand tons)
Source: PASP (2010-2017)
Three storage zones exist at the port: first, the temporary zone, which is reserved for loading and unloading of
vessels along the quays; the second zone is reserved for the short stay, which is used by the customs to inspect the
shipments; and the third zone is reserved for shipments that are ready to be sent or received to/from the clients.
The first two storage zones are open space, whereby shipments are temporarily stored in these zones, although due
to the rigidity of customs inspection and long administrative procedures shipments are kept longer than necessary
within these storage zones.
The stevedoring equipments comprises four cranes, 75 trucks (20-40 tons), 7 forklifts of 12 T, 108 of 3-7 tons, 2
forklifts of 16, 20 and 32 tons, 11 spreaders (20’-40’), 8 challengers/SV trucks of 45 tons, 2 shore cranes of 75-120
tons, 1 tug, 3 barges and 4 launches.
Map 4.9 Port of San Pedro (PASP)
Source: PASP brochure (2017)
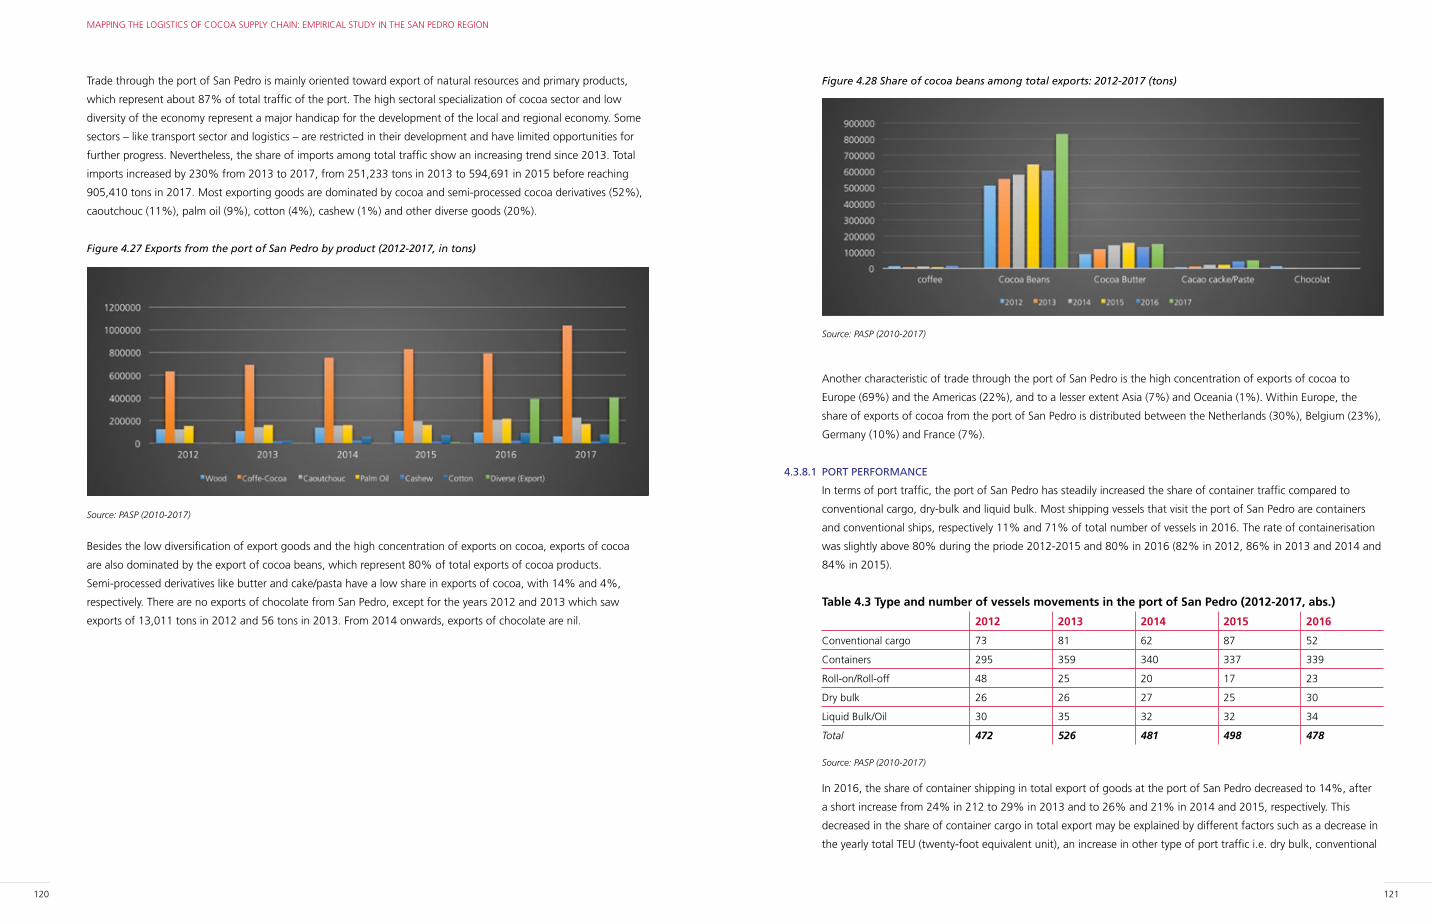
120 121
MAPPING THE LOGISTICS OF COCOA SUPPLY CHAIN: EMPIRICAL STUDY IN THE SAN PEDRO REGION
Figure 4.28 Share of cocoa beans among total exports: 2012-2017 (tons)
Source: PASP (2010-2017)
Another characteristic of trade through the port of San Pedro is the high concentration of exports of cocoa to
Europe (69%) and the Americas (22%), and to a lesser extent Asia (7%) and Oceania (1%). Within Europe, the
share of exports of cocoa from the port of San Pedro is distributed between the Netherlands (30%), Belgium (23%),
Germany (10%) and France (7%).
4.3.8.1 PORT PERFORMANCE
In terms of port traffic, the port of San Pedro has steadily increased the share of container traffic compared to
conventional cargo, dry-bulk and liquid bulk. Most shipping vessels that visit the port of San Pedro are containers
and conventional ships, respectively 11% and 71% of total number of vessels in 2016. The rate of containerisation
was slightly above 80% during the priode 2012-2015 and 80% in 2016 (82% in 2012, 86% in 2013 and 2014 and
84% in 2015).
Table 4.3 Type and number of vessels movements in the port of San Pedro (2012-2017, abs.)
2012 2013 2014 2015 2016
Conventional cargo 73 81 62 87 52
Containers 295 359 340 337 339
Roll-on/Roll-off 48 25 20 17 23
Dry bulk 26 26 27 25 30
Liquid Bulk/Oil 30 35 32 32 34
Total 472 526 481 498 478
Source: PASP (2010-2017)
In 2016, the share of container shipping in total export of goods at the port of San Pedro decreased to 14%, after
a short increase from 24% in 212 to 29% in 2013 and to 26% and 21% in 2014 and 2015, respectively. This
decreased in the share of container cargo in total export may be explained by different factors such as a decrease in
the yearly total TEU (twenty-foot equivalent unit), an increase in other type of port traffic i.e. dry bulk, conventional
Trade through the port of San Pedro is mainly oriented toward export of natural resources and primary products,
which represent about 87% of total traffic of the port. The high sectoral specialization of cocoa sector and low
diversity of the economy represent a major handicap for the development of the local and regional economy. Some
sectors – like transport sector and logistics – are restricted in their development and have limited opportunities for
further progress. Nevertheless, the share of imports among total traffic show an increasing trend since 2013. Total
imports increased by 230% from 2013 to 2017, from 251,233 tons in 2013 to 594,691 in 2015 before reaching
905,410 tons in 2017. Most exporting goods are dominated by cocoa and semi-processed cocoa derivatives (52%),
caoutchouc (11%), palm oil (9%), cotton (4%), cashew (1%) and other diverse goods (20%).
Figure 4.27 Exports from the port of San Pedro by product (2012-2017, in tons)
Source: PASP (2010-2017)
Besides the low diversification of export goods and the high concentration of exports on cocoa, exports of cocoa
are also dominated by the export of cocoa beans, which represent 80% of total exports of cocoa products.
Semi-processed derivatives like butter and cake/pasta have a low share in exports of cocoa, with 14% and 4%,
respectively. There are no exports of chocolate from San Pedro, except for the years 2012 and 2013 which saw
exports of 13,011 tons in 2012 and 56 tons in 2013. From 2014 onwards, exports of chocolate are nil.
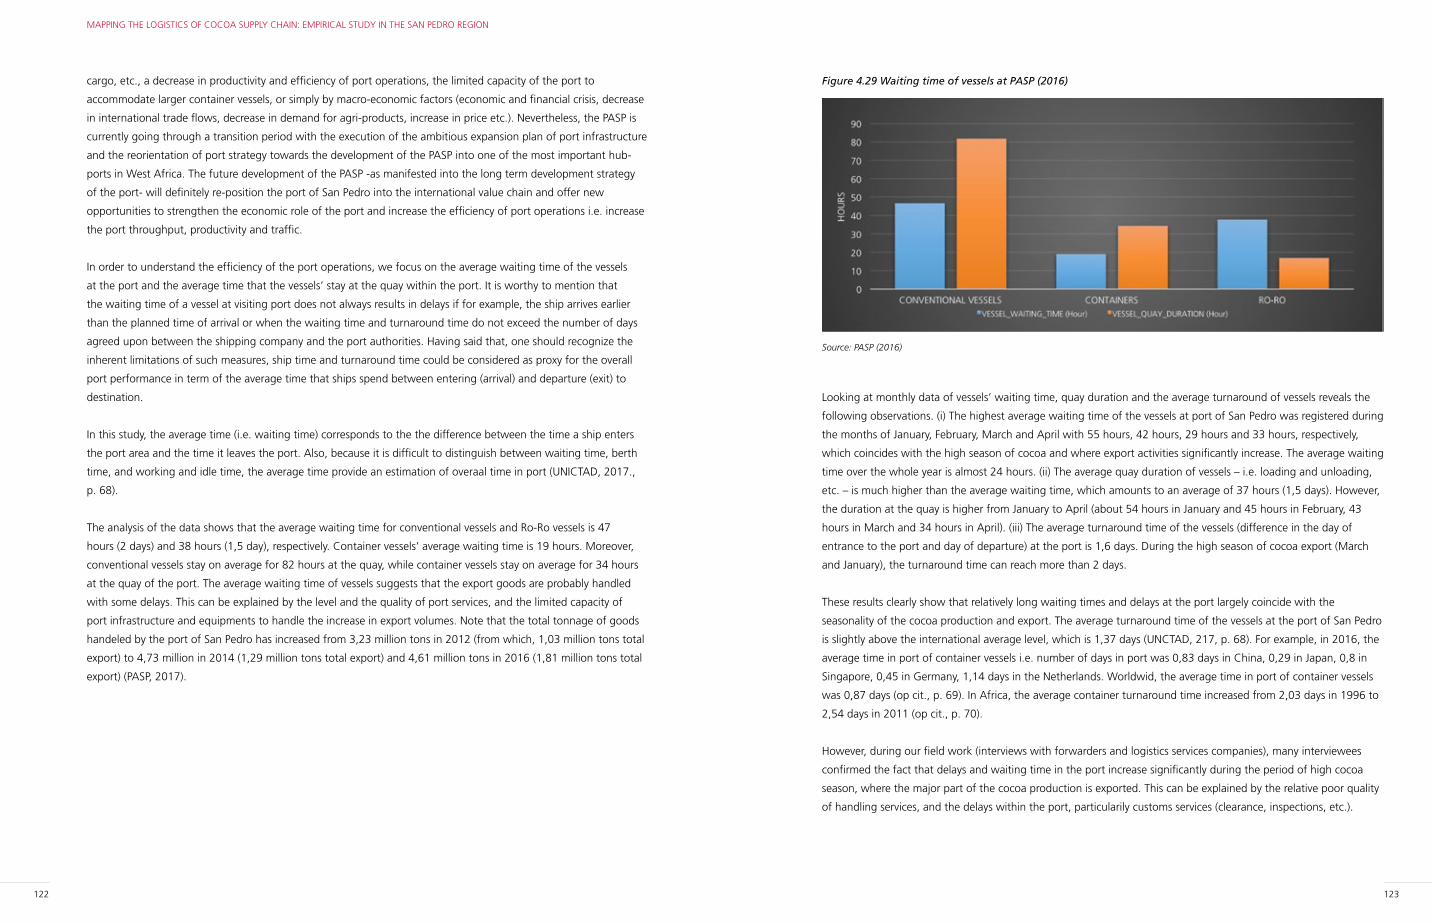
122 123
MAPPING THE LOGISTICS OF COCOA SUPPLY CHAIN: EMPIRICAL STUDY IN THE SAN PEDRO REGION
Figure 4.29 Waiting time of vessels at PASP (2016)
Source: PASP (2016)
Looking at monthly data of vessels’ waiting time, quay duration and the average turnaround of vessels reveals the
following observations. (i) The highest average waiting time of the vessels at port of San Pedro was registered during
the months of January, February, March and April with 55 hours, 42 hours, 29 hours and 33 hours, respectively,
which coincides with the high season of cocoa and where export activities significantly increase. The average waiting
time over the whole year is almost 24 hours. (ii) The average quay duration of vessels – i.e. loading and unloading,
etc. – is much higher than the average waiting time, which amounts to an average of 37 hours (1,5 days). However,
the duration at the quay is higher from January to April (about 54 hours in January and 45 hours in February, 43
hours in March and 34 hours in April). (iii) The average turnaround time of the vessels (difference in the day of
entrance to the port and day of departure) at the port is 1,6 days. During the high season of cocoa export (March
and January), the turnaround time can reach more than 2 days.
These results clearly show that relatively long waiting times and delays at the port largely coincide with the
seasonality of the cocoa production and export. The average turnaround time of the vessels at the port of San Pedro
is slightly above the international average level, which is 1,37 days (UNCTAD, 217, p. 68). For example, in 2016, the
average time in port of container vessels i.e. number of days in port was 0,83 days in China, 0,29 in Japan, 0,8 in
Singapore, 0,45 in Germany, 1,14 days in the Netherlands. Worldwid, the average time in port of container vessels
was 0,87 days (op cit., p. 69). In Africa, the average container turnaround time increased from 2,03 days in 1996 to
2,54 days in 2011 (op cit., p. 70).
However, during our field work (interviews with forwarders and logistics services companies), many interviewees
confirmed the fact that delays and waiting time in the port increase significantly during the period of high cocoa
season, where the major part of the cocoa production is exported. This can be explained by the relative poor quality
of handling services, and the delays within the port, particularily customs services (clearance, inspections, etc.).
cargo, etc., a decrease in productivity and efficiency of port operations, the limited capacity of the port to
accommodate larger container vessels, or simply by macro-economic factors (economic and financial crisis, decrease
in international trade flows, decrease in demand for agri-products, increase in price etc.). Nevertheless, the PASP is
currently going through a transition period with the execution of the ambitious expansion plan of port infrastructure
and the reorientation of port strategy towards the development of the PASP into one of the most important hub-
ports in West Africa. The future development of the PASP -as manifested into the long term development strategy
of the port- will definitely re-position the port of San Pedro into the international value chain and offer new
opportunities to strengthen the economic role of the port and increase the efficiency of port operations i.e. increase
the port throughput, productivity and traffic.
In order to understand the efficiency of the port operations, we focus on the average waiting time of the vessels
at the port and the average time that the vessels’ stay at the quay within the port. It is worthy to mention that
the waiting time of a vessel at visiting port does not always results in delays if for example, the ship arrives earlier
than the planned time of arrival or when the waiting time and turnaround time do not exceed the number of days
agreed upon between the shipping company and the port authorities. Having said that, one should recognize the
inherent limitations of such measures, ship time and turnaround time could be considered as proxy for the overall
port performance in term of the average time that ships spend between entering (arrival) and departure (exit) to
destination.
In this study, the average time (i.e. waiting time) corresponds to the the difference between the time a ship enters
the port area and the time it leaves the port. Also, because it is difficult to distinguish between waiting time, berth
time, and working and idle time, the average time provide an estimation of overaal time in port (UNICTAD, 2017.,
p. 68).
The analysis of the data shows that the average waiting time for conventional vessels and Ro-Ro vessels is 47
hours (2 days) and 38 hours (1,5 day), respectively. Container vessels’ average waiting time is 19 hours. Moreover,
conventional vessels stay on average for 82 hours at the quay, while container vessels stay on average for 34 hours
at the quay of the port. The average waiting time of vessels suggests that the export goods are probably handled
with some delays. This can be explained by the level and the quality of port services, and the limited capacity of
port infrastructure and equipments to handle the increase in export volumes. Note that the total tonnage of goods
handeled by the port of San Pedro has increased from 3,23 million tons in 2012 (from which, 1,03 million tons total
export) to 4,73 million in 2014 (1,29 million tons total export) and 4,61 million tons in 2016 (1,81 million tons total
export) (PASP, 2017).
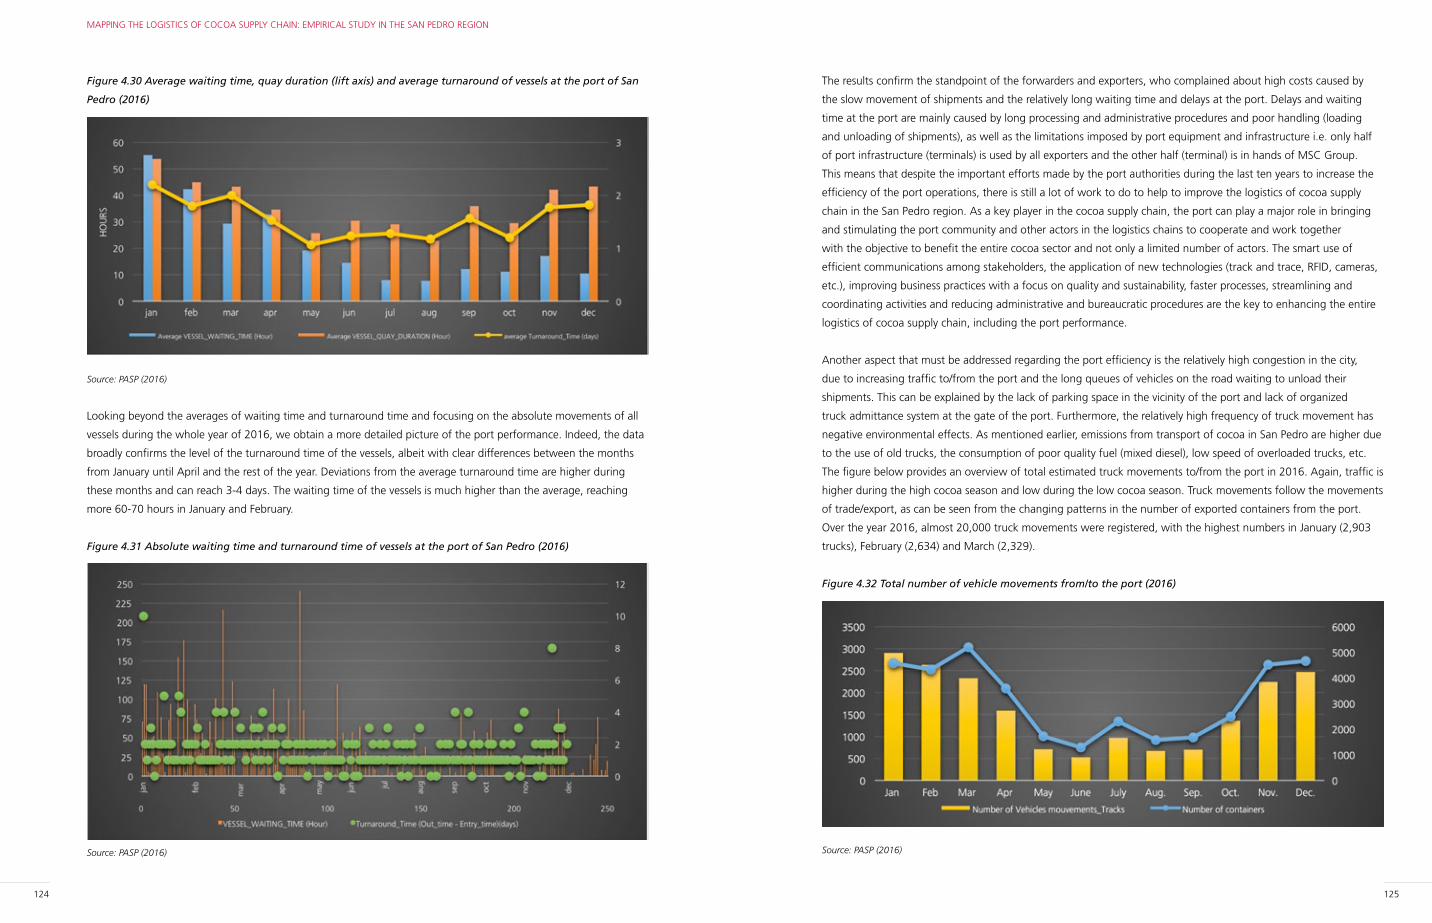
124 125
MAPPING THE LOGISTICS OF COCOA SUPPLY CHAIN: EMPIRICAL STUDY IN THE SAN PEDRO REGION
The results confirm the standpoint of the forwarders and exporters, who complained about high costs caused by
the slow movement of shipments and the relatively long waiting time and delays at the port. Delays and waiting
time at the port are mainly caused by long processing and administrative procedures and poor handling (loading
and unloading of shipments), as well as the limitations imposed by port equipment and infrastructure i.e. only half
of port infrastructure (terminals) is used by all exporters and the other half (terminal) is in hands of MSC Group.
This means that despite the important efforts made by the port authorities during the last ten years to increase the
efficiency of the port operations, there is still a lot of work to do to help to improve the logistics of cocoa supply
chain in the San Pedro region. As a key player in the cocoa supply chain, the port can play a major role in bringing
and stimulating the port community and other actors in the logistics chains to cooperate and work together
with the objective to benefit the entire cocoa sector and not only a limited number of actors. The smart use of
efficient communications among stakeholders, the application of new technologies (track and trace, RFID, cameras,
etc.), improving business practices with a focus on quality and sustainability, faster processes, streamlining and
coordinating activities and reducing administrative and bureaucratic procedures are the key to enhancing the entire
logistics of cocoa supply chain, including the port performance.
Another aspect that must be addressed regarding the port efficiency is the relatively high congestion in the city,
due to increasing traffic to/from the port and the long queues of vehicles on the road waiting to unload their
shipments. This can be explained by the lack of parking space in the vicinity of the port and lack of organized
truck admittance system at the gate of the port. Furthermore, the relatively high frequency of truck movement has
negative environmental effects. As mentioned earlier, emissions from transport of cocoa in San Pedro are higher due
to the use of old trucks, the consumption of poor quality fuel (mixed diesel), low speed of overloaded trucks, etc.
The figure below provides an overview of total estimated truck movements to/from the port in 2016. Again, traffic is
higher during the high cocoa season and low during the low cocoa season. Truck movements follow the movements
of trade/export, as can be seen from the changing patterns in the number of exported containers from the port.
Over the year 2016, almost 20,000 truck movements were registered, with the highest numbers in January (2,903
trucks), February (2,634) and March (2,329).
Figure 4.32 Total number of vehicle movements from/to the port (2016)
Source: PASP (2016)
Figure 4.30 Average waiting time, quay duration (lift axis) and average turnaround of vessels at the port of San
Pedro (2016)
Source: PASP (2016)
Looking beyond the averages of waiting time and turnaround time and focusing on the absolute movements of all
vessels during the whole year of 2016, we obtain a more detailed picture of the port performance. Indeed, the data
broadly confirms the level of the turnaround time of the vessels, albeit with clear differences between the months
from January until April and the rest of the year. Deviations from the average turnaround time are higher during
these months and can reach 3-4 days. The waiting time of the vessels is much higher than the average, reaching
more 60-70 hours in January and February.
Figure 4.31 Absolute waiting time and turnaround time of vessels at the port of San Pedro (2016)
Source: PASP (2016)
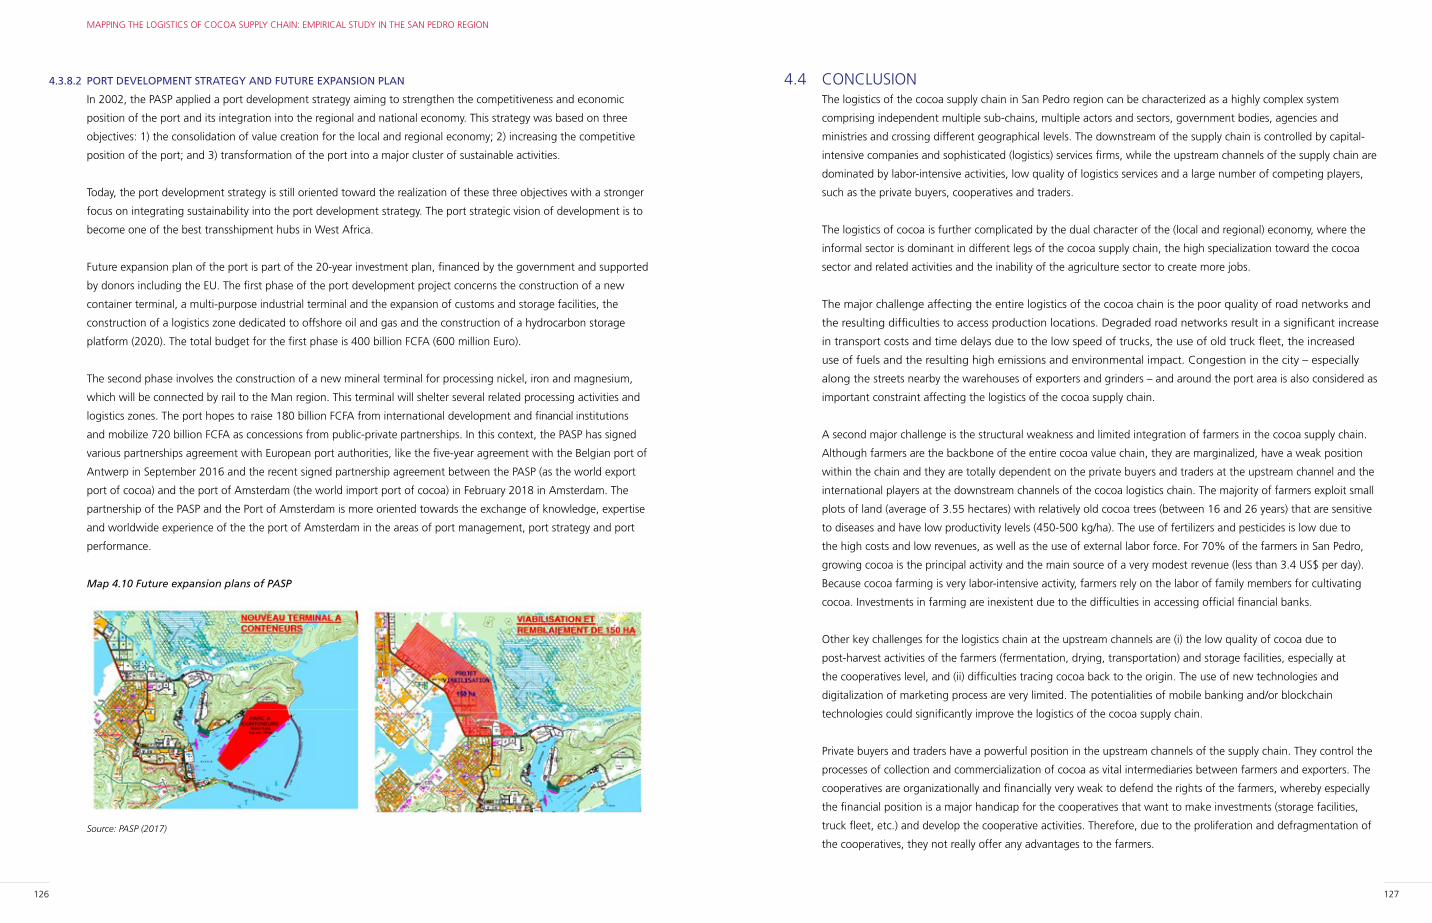
126 127
MAPPING THE LOGISTICS OF COCOA SUPPLY CHAIN: EMPIRICAL STUDY IN THE SAN PEDRO REGION
4.4 CONCLUSIONThe logistics of the cocoa supply chain in San Pedro region can be characterized as a highly complex system
comprising independent multiple sub-chains, multiple actors and sectors, government bodies, agencies and
ministries and crossing different geographical levels. The downstream of the supply chain is controlled by capital-
intensive companies and sophisticated (logistics) services firms, while the upstream channels of the supply chain are
dominated by labor-intensive activities, low quality of logistics services and a large number of competing players,
such as the private buyers, cooperatives and traders.
The logistics of cocoa is further complicated by the dual character of the (local and regional) economy, where the
informal sector is dominant in different legs of the cocoa supply chain, the high specialization toward the cocoa
sector and related activities and the inability of the agriculture sector to create more jobs.
The major challenge affecting the entire logistics of the cocoa chain is the poor quality of road networks and
the resulting difficulties to access production locations. Degraded road networks result in a significant increase
in transport costs and time delays due to the low speed of trucks, the use of old truck fleet, the increased
use of fuels and the resulting high emissions and environmental impact. Congestion in the city – especially
along the streets nearby the warehouses of exporters and grinders – and around the port area is also considered as
important constraint affecting the logistics of the cocoa supply chain.
A second major challenge is the structural weakness and limited integration of farmers in the cocoa supply chain.
Although farmers are the backbone of the entire cocoa value chain, they are marginalized, have a weak position
within the chain and they are totally dependent on the private buyers and traders at the upstream channel and the
international players at the downstream channels of the cocoa logistics chain. The majority of farmers exploit small
plots of land (average of 3.55 hectares) with relatively old cocoa trees (between 16 and 26 years) that are sensitive
to diseases and have low productivity levels (450-500 kg/ha). The use of fertilizers and pesticides is low due to
the high costs and low revenues, as well as the use of external labor force. For 70% of the farmers in San Pedro,
growing cocoa is the principal activity and the main source of a very modest revenue (less than 3.4 US$ per day).
Because cocoa farming is very labor-intensive activity, farmers rely on the labor of family members for cultivating
cocoa. Investments in farming are inexistent due to the difficulties in accessing official financial banks.
Other key challenges for the logistics chain at the upstream channels are (i) the low quality of cocoa due to
post-harvest activities of the farmers (fermentation, drying, transportation) and storage facilities, especially at
the cooperatives level, and (ii) difficulties tracing cocoa back to the origin. The use of new technologies and
digitalization of marketing process are very limited. The potentialities of mobile banking and/or blockchain
technologies could significantly improve the logistics of the cocoa supply chain.
Private buyers and traders have a powerful position in the upstream channels of the supply chain. They control the
processes of collection and commercialization of cocoa as vital intermediaries between farmers and exporters. The
cooperatives are organizationally and financially very weak to defend the rights of the farmers, whereby especially
the financial position is a major handicap for the cooperatives that want to make investments (storage facilities,
truck fleet, etc.) and develop the cooperative activities. Therefore, due to the proliferation and defragmentation of
the cooperatives, they not really offer any advantages to the farmers.
4.3.8.2 PORT DEVELOPMENT STRATEGY AND FUTURE EXPANSION PLAN
In 2002, the PASP applied a port development strategy aiming to strengthen the competitiveness and economic
position of the port and its integration into the regional and national economy. This strategy was based on three
objectives: 1) the consolidation of value creation for the local and regional economy; 2) increasing the competitive
position of the port; and 3) transformation of the port into a major cluster of sustainable activities.
Today, the port development strategy is still oriented toward the realization of these three objectives with a stronger
focus on integrating sustainability into the port development strategy. The port strategic vision of development is to
become one of the best transshipment hubs in West Africa.
Future expansion plan of the port is part of the 20-year investment plan, financed by the government and supported
by donors including the EU. The first phase of the port development project concerns the construction of a new
container terminal, a multi-purpose industrial terminal and the expansion of customs and storage facilities, the
construction of a logistics zone dedicated to offshore oil and gas and the construction of a hydrocarbon storage
platform (2020). The total budget for the first phase is 400 billion FCFA (600 million Euro).
The second phase involves the construction of a new mineral terminal for processing nickel, iron and magnesium,
which will be connected by rail to the Man region. This terminal will shelter several related processing activities and
logistics zones. The port hopes to raise 180 billion FCFA from international development and financial institutions
and mobilize 720 billion FCFA as concessions from public-private partnerships. In this context, the PASP has signed
various partnerships agreement with European port authorities, like the five-year agreement with the Belgian port of
Antwerp in September 2016 and the recent signed partnership agreement between the PASP (as the world export
port of cocoa) and the port of Amsterdam (the world import port of cocoa) in February 2018 in Amsterdam. The
partnership of the PASP and the Port of Amsterdam is more oriented towards the exchange of knowledge, expertise
and worldwide experience of the the port of Amsterdam in the areas of port management, port strategy and port
performance.
Map 4.10 Future expansion plans of PASP
Source: PASP (2017)
128 129
MAPPING THE LOGISTICS OF COCOA SUPPLY CHAIN: EMPIRICAL STUDY IN THE SAN PEDRO REGION
The lack of integration between logistics and transport sectors in San Pedro, the absence of a multi-modal transport
system, market distortions in the cocoa and transport sectors (informal and formal activities and the dominance of
small number of actors) and the poor quality of road network further impede not only the port, the cocoa sector,
the transport sector and logistics system, but also the entire economic structure of the region and the country.
Optimized logistics in the cocoa supply chain can only be developed by making the whole system stronger by
integrating both the weakest legs (farmers, cooperatives) and eliminating the unnecessary intermediaries as well
as the disintegrated links (transporters) and the strongest links (international exporters, processing companies and
forwarders) into a new improved system where actors can easily exchange the flows of goods, information and
money in a transparent and effective way. Re-structuring the logistics of the cocoa supply chain can be accompanied
by policy reforms that touch the domains of institutions, governance, the economy and the socio-cultural domain.
However, note that developing an efficient logistics system cannot be realized without improving the sustainability
of the entire logistics chain. Providing solutions for an optimized logistics chain in which sustainability efforts are
only concentrated on one or few legs of the logistics chain is useless. In order to develop a more sustainable logistics
chain, a mental shift at the sector and government levels is needed, i.e. cooperation between actors and parties that
work together to make the entire logistics chain efficient and sustainable, beginning at the farmers and ending at
the port of export and beyond.
Furthermore, creating specific governmental bodies representing the top sector logistics, integrating the transport
sector as is the case in the Netherlands and bringing the entire cocoa sector under one ministry or government
agency can increase sectoral integration (agriculture, transport, logistics) and hence provide opportunities to
accelerate structural economic change and growth.
Furthermore, the situation of the road freight transporters does not help much to improve the logistics of the cocoa
supply chain. The majority of transporters are confronted with many challenges, such as (i) the poor condition
of roads, which drives higher transport logistics costs, limits the speed of trucks, increases the use of fuel and
corresponding emissions, and increases maintenance costs, congestion and risks of accidents, (ii) the use of old and
obsolete fleet operated by low-qualified truckers, (iii) the overload of trucks and the high costs and waiting time/
delays at the roadblocks and checkpoints along the roads, (iv) high competition from the informal transporters, (v)
a lack of financial means to invest in new truck fleet, (vi) empty returns/backhaul, (viii) high additional costs due to
poor governance (corruption, bribery) and (ix) a lack of transparency and openness in business practices.
At the downstream channel of the logistics supply chain, we find the international exporters, processing companies
and logistics services companies/forwarders and shippers. More generally, the actors in the downstream side of
the cocoa supply chain represent the strongest leg of the cocoa supply chain in the sense that they have direct
connections/relations with all other players in the cocoa supply chain. However, despite their modern management
practice, financial capacity, technological level and knowledge of managing logistics processes, they are confronted
with serious challenges affecting their activities in San Pedro. The main challenges and bottlenecks that affect
the activities of international exporters and processing companies are the logistics costs, which are driven up by
congestion and waiting time/delays occurring in the last mile of the supply chain, i.e. at/around the port. As a result,
the management of inventories is difficult due to the uncertainty in the arrival times of cocoa shipments from the
farmers, cooperatives and traders, as well as the seasonal character of the cocoa sector, i.e. most warehouses are
half-empty during half of the year.
Finally, because international exporters value time, reliability, security and predictability, the relatively longer waiting
time at the port, delays at the customs and control, the waiting time to load/unload the shipments, the lack of
sufficient empty containers and pallets for the warehouse are most commonly cited as bottlenecks that affect the
activities of the forwarders. Further analyses of the performance of the port of San Pedro partly confirm these
suggestions, especially the slow movement of shipments and the waiting time and delays at the port caused by
the limited capacity of port infrastructure and equipment. Moreover, the waiting vehicles in the port area or within
the port are caused by the absence of parking areas in the port area and the lack of an organized truck admittance
system at the gate of the port.
More generally, the power structure in the cocoa sector is largely concentrated at the downstream of the supply
chain, where a limited number of highly concentrated players control many channels of the cocoa supply chain.
At the upstream level, the possibility to link the farmers directly to the market is blocked by a large number of
intermediaries that have a strong position at the upstream level of the supply chain. The intermediaries possess the
knowledge, information and informal connections with the villages and they provide farmers with various services
such as marketing, inputs and financial credits.
It is necessary to facilitate the active participation of cocoa farmers in the cocoa supply chain by shortening the
distance between them and the actors operating in the upstream legs of the supply chain. This can stimulate
farmers to adopt more sustainable production practices and improve their incomes, as well as the private sector to
invest in the profitable sustainable sector. In this way, the entire cocoa supply chain can benefit all involved actors,
instead of benefiting a few parties at the cost of the majority of actors in the sector.
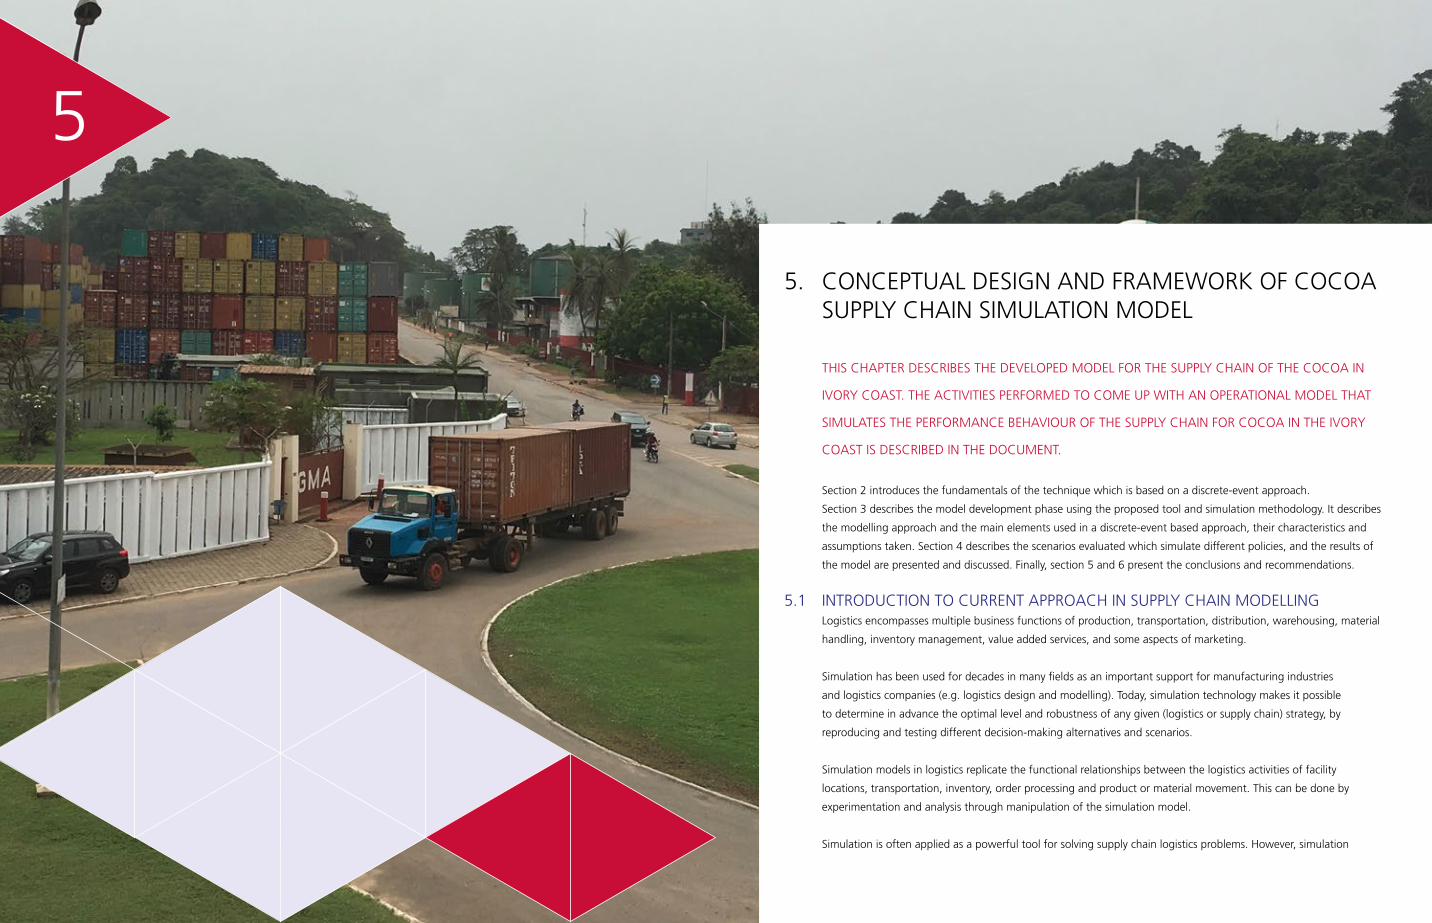
130 131
CONCEPTUAL DESIGN AND FRAMEWORK OF COCOA SUPPLY CHAIN SIMULATION MODEL
5
5. CONCEPTUAL DESIGN AND FRAMEWORK OF COCOA SUPPLY CHAIN SIMULATION MODEL
THIS CHAPTER DESCRIBES THE DEVELOPED MODEL FOR THE SUPPLY CHAIN OF THE COCOA IN
IVORY COAST. THE ACTIVITIES PERFORMED TO COME UP WITH AN OPERATIONAL MODEL THAT
SIMULATES THE PERFORMANCE BEHAVIOUR OF THE SUPPLY CHAIN FOR COCOA IN THE IVORY
COAST IS DESCRIBED IN THE DOCUMENT.
Section 2 introduces the fundamentals of the technique which is based on a discrete-event approach.
Section 3 describes the model development phase using the proposed tool and simulation methodology. It describes
the modelling approach and the main elements used in a discrete-event based approach, their characteristics and
assumptions taken. Section 4 describes the scenarios evaluated which simulate different policies, and the results of
the model are presented and discussed. Finally, section 5 and 6 present the conclusions and recommendations.
5.1 INTRODUCTION TO CURRENT APPROACH IN SUPPLY CHAIN MODELLINGLogistics encompasses multiple business functions of production, transportation, distribution, warehousing, material
handling, inventory management, value added services, and some aspects of marketing.
Simulation has been used for decades in many fields as an important support for manufacturing industries
and logistics companies (e.g. logistics design and modelling). Today, simulation technology makes it possible
to determine in advance the optimal level and robustness of any given (logistics or supply chain) strategy, by
reproducing and testing different decision-making alternatives and scenarios.
Simulation models in logistics replicate the functional relationships between the logistics activities of facility
locations, transportation, inventory, order processing and product or material movement. This can be done by
experimentation and analysis through manipulation of the simulation model.
Simulation is often applied as a powerful tool for solving supply chain logistics problems. However, simulation
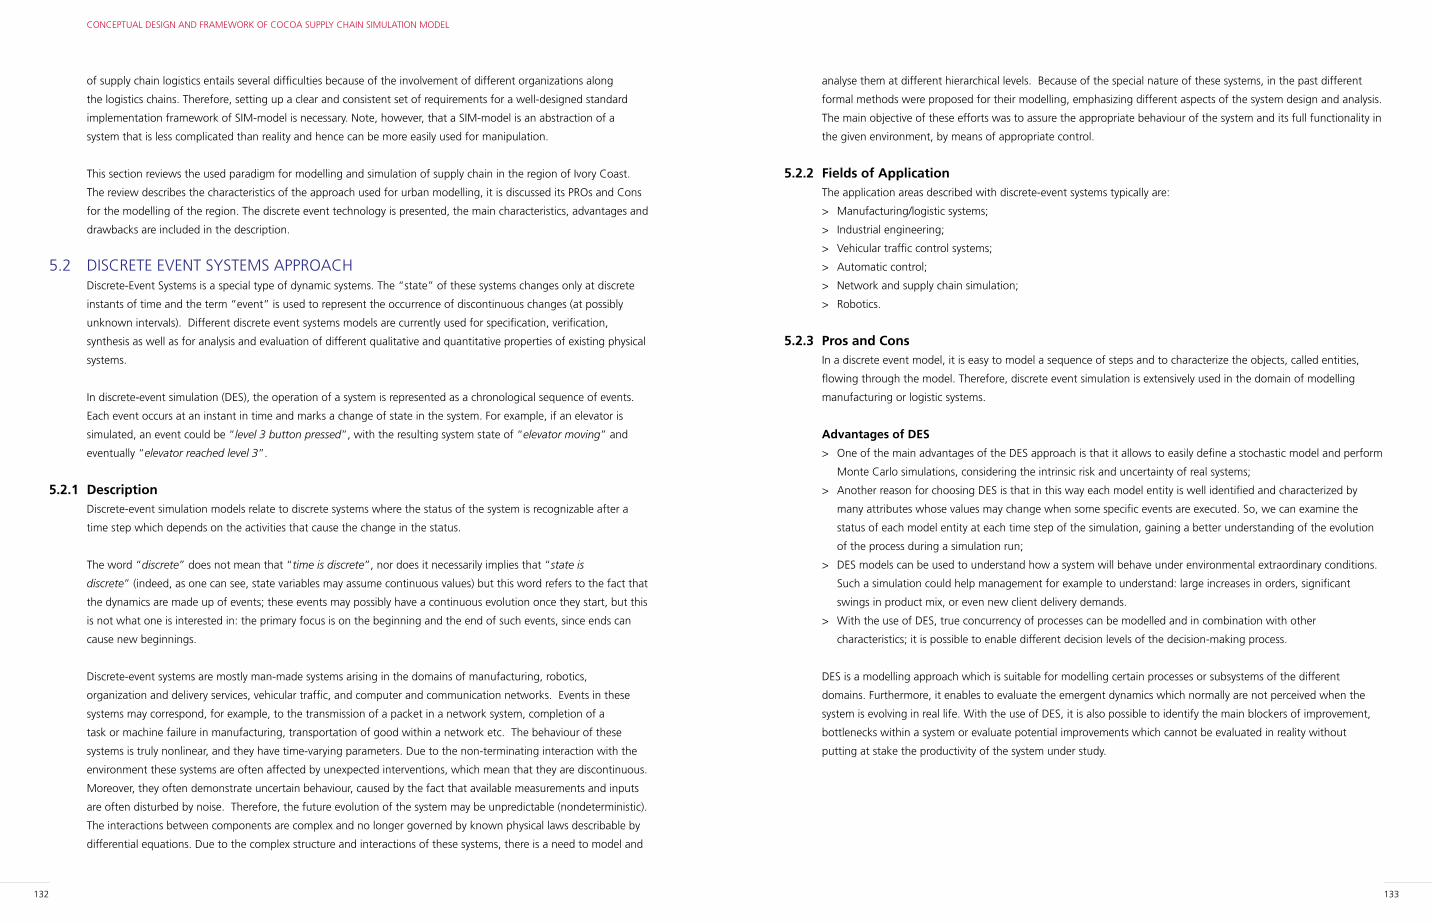
132 133
CONCEPTUAL DESIGN AND FRAMEWORK OF COCOA SUPPLY CHAIN SIMULATION MODEL
analyse them at different hierarchical levels. Because of the special nature of these systems, in the past different
formal methods were proposed for their modelling, emphasizing different aspects of the system design and analysis.
The main objective of these efforts was to assure the appropriate behaviour of the system and its full functionality in
the given environment, by means of appropriate control.
5.2.2 Fields of ApplicationThe application areas described with discrete-event systems typically are:
> Manufacturing/logistic systems;
> Industrial engineering;
> Vehicular traffic control systems;
> Automatic control;
> Network and supply chain simulation;
> Robotics.
5.2.3 Pros and ConsIn a discrete event model, it is easy to model a sequence of steps and to characterize the objects, called entities,
flowing through the model. Therefore, discrete event simulation is extensively used in the domain of modelling
manufacturing or logistic systems.
Advantages of DES
> One of the main advantages of the DES approach is that it allows to easily define a stochastic model and perform
Monte Carlo simulations, considering the intrinsic risk and uncertainty of real systems;
> Another reason for choosing DES is that in this way each model entity is well identified and characterized by
many attributes whose values may change when some specific events are executed. So, we can examine the
status of each model entity at each time step of the simulation, gaining a better understanding of the evolution
of the process during a simulation run;
> DES models can be used to understand how a system will behave under environmental extraordinary conditions.
Such a simulation could help management for example to understand: large increases in orders, significant
swings in product mix, or even new client delivery demands.
> With the use of DES, true concurrency of processes can be modelled and in combination with other
characteristics; it is possible to enable different decision levels of the decision-making process.
DES is a modelling approach which is suitable for modelling certain processes or subsystems of the different
domains. Furthermore, it enables to evaluate the emergent dynamics which normally are not perceived when the
system is evolving in real life. With the use of DES, it is also possible to identify the main blockers of improvement,
bottlenecks within a system or evaluate potential improvements which cannot be evaluated in reality without
putting at stake the productivity of the system under study.
of supply chain logistics entails several difficulties because of the involvement of different organizations along
the logistics chains. Therefore, setting up a clear and consistent set of requirements for a well-designed standard
implementation framework of SIM-model is necessary. Note, however, that a SIM-model is an abstraction of a
system that is less complicated than reality and hence can be more easily used for manipulation.
This section reviews the used paradigm for modelling and simulation of supply chain in the region of Ivory Coast.
The review describes the characteristics of the approach used for urban modelling, it is discussed its PROs and Cons
for the modelling of the region. The discrete event technology is presented, the main characteristics, advantages and
drawbacks are included in the description.
5.2 DISCRETE EVENT SYSTEMS APPROACHDiscrete-Event Systems is a special type of dynamic systems. The “state” of these systems changes only at discrete
instants of time and the term “event” is used to represent the occurrence of discontinuous changes (at possibly
unknown intervals). Different discrete event systems models are currently used for specification, verification,
synthesis as well as for analysis and evaluation of different qualitative and quantitative properties of existing physical
systems.
In discrete-event simulation (DES), the operation of a system is represented as a chronological sequence of events.
Each event occurs at an instant in time and marks a change of state in the system. For example, if an elevator is
simulated, an event could be “level 3 button pressed”, with the resulting system state of “elevator moving” and
eventually “elevator reached level 3”.
5.2.1 DescriptionDiscrete-event simulation models relate to discrete systems where the status of the system is recognizable after a
time step which depends on the activities that cause the change in the status.
The word “discrete” does not mean that “time is discrete”, nor does it necessarily implies that “state is
discrete” (indeed, as one can see, state variables may assume continuous values) but this word refers to the fact that
the dynamics are made up of events; these events may possibly have a continuous evolution once they start, but this
is not what one is interested in: the primary focus is on the beginning and the end of such events, since ends can
cause new beginnings.
Discrete-event systems are mostly man-made systems arising in the domains of manufacturing, robotics,
organization and delivery services, vehicular traffic, and computer and communication networks. Events in these
systems may correspond, for example, to the transmission of a packet in a network system, completion of a
task or machine failure in manufacturing, transportation of good within a network etc. The behaviour of these
systems is truly nonlinear, and they have time-varying parameters. Due to the non-terminating interaction with the
environment these systems are often affected by unexpected interventions, which mean that they are discontinuous.
Moreover, they often demonstrate uncertain behaviour, caused by the fact that available measurements and inputs
are often disturbed by noise. Therefore, the future evolution of the system may be unpredictable (nondeterministic).
The interactions between components are complex and no longer governed by known physical laws describable by
differential equations. Due to the complex structure and interactions of these systems, there is a need to model and
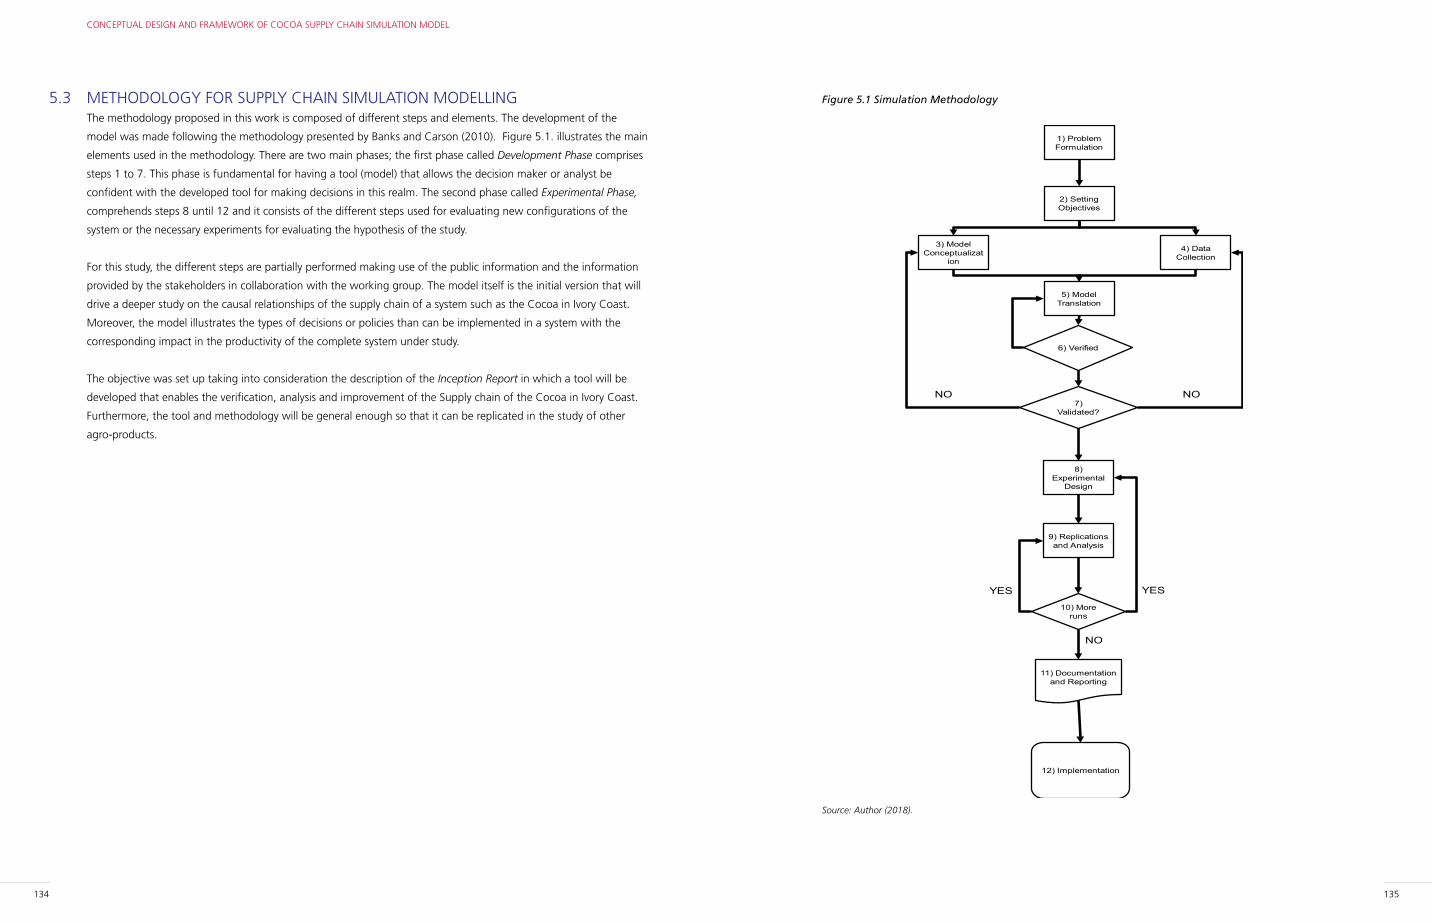
134 135
CONCEPTUAL DESIGN AND FRAMEWORK OF COCOA SUPPLY CHAIN SIMULATION MODEL
Figure 5.1 Simulation Methodology
Source: Author (2018).
6) Verified
7) Validated?
10) More runs
12) Implementation
1) ProblemFormulation
4) Data Collection
2) SettingObjectives
3) ModelConceptualizat
ion
8) Experimental
Design
5) ModelTranslation
9) Replicationsand Analysis
11) Documentationand Reporting
NO NO
NO
YES YES
5.3 METHODOLOGY FOR SUPPLY CHAIN SIMULATION MODELLINGThe methodology proposed in this work is composed of different steps and elements. The development of the
model was made following the methodology presented by Banks and Carson (2010). Figure 5.1. illustrates the main
elements used in the methodology. There are two main phases; the first phase called Development Phase comprises
steps 1 to 7. This phase is fundamental for having a tool (model) that allows the decision maker or analyst be
confident with the developed tool for making decisions in this realm. The second phase called Experimental Phase,
comprehends steps 8 until 12 and it consists of the different steps used for evaluating new configurations of the
system or the necessary experiments for evaluating the hypothesis of the study.
For this study, the different steps are partially performed making use of the public information and the information
provided by the stakeholders in collaboration with the working group. The model itself is the initial version that will
drive a deeper study on the causal relationships of the supply chain of a system such as the Cocoa in Ivory Coast.
Moreover, the model illustrates the types of decisions or policies than can be implemented in a system with the
corresponding impact in the productivity of the complete system under study.
The objective was set up taking into consideration the description of the Inception Report in which a tool will be
developed that enables the verification, analysis and improvement of the Supply chain of the Cocoa in Ivory Coast.
Furthermore, the tool and methodology will be general enough so that it can be replicated in the study of other
agro-products.
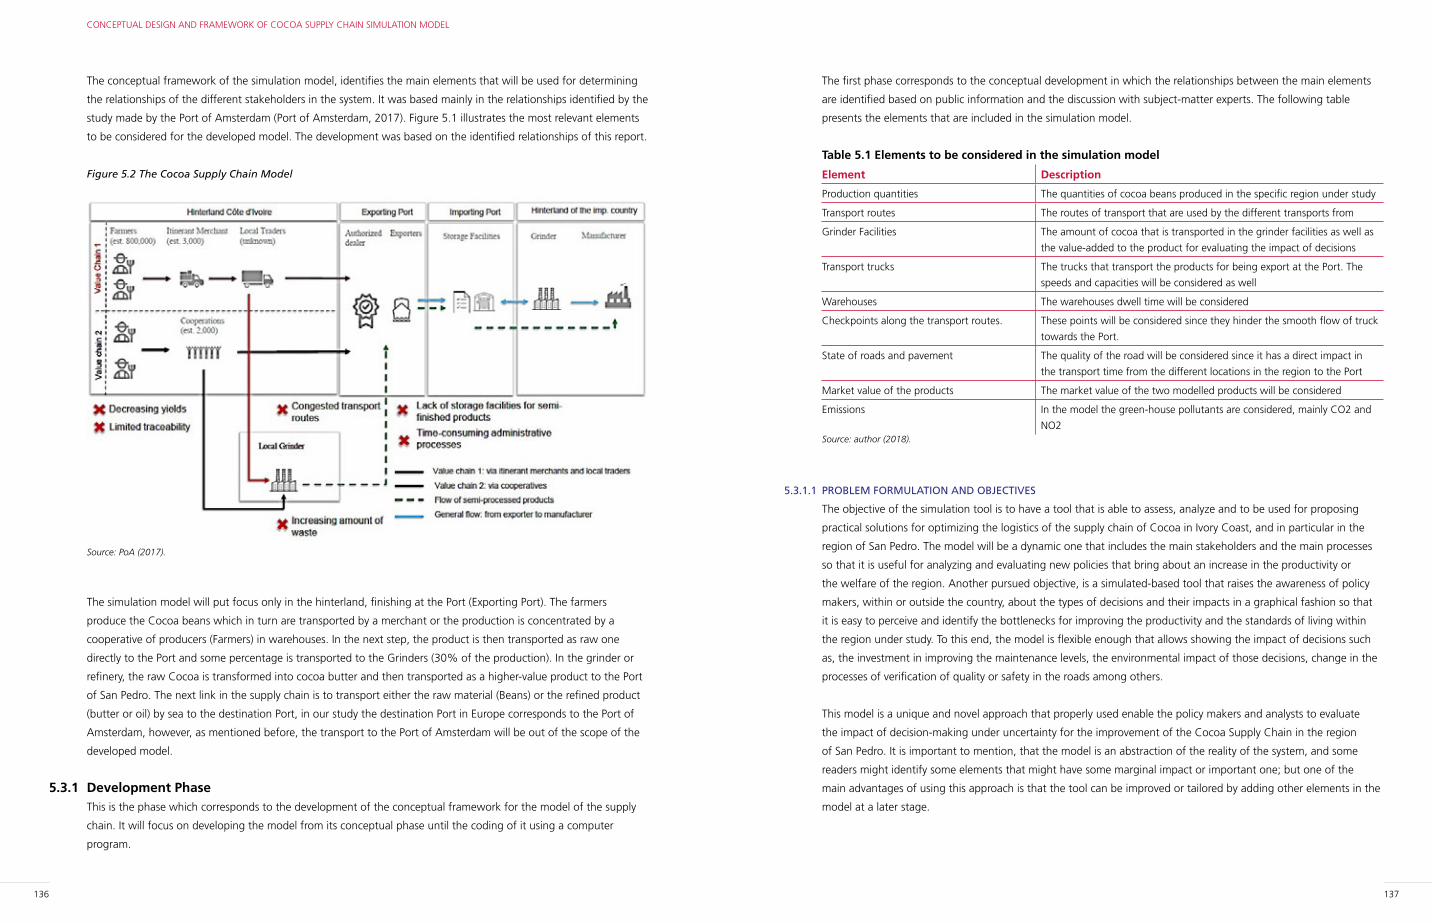
136 137
CONCEPTUAL DESIGN AND FRAMEWORK OF COCOA SUPPLY CHAIN SIMULATION MODEL
The first phase corresponds to the conceptual development in which the relationships between the main elements
are identified based on public information and the discussion with subject-matter experts. The following table
presents the elements that are included in the simulation model.
Table 5.1 Elements to be considered in the simulation model
Element Description
Production quantities The quantities of cocoa beans produced in the specific region under study
Transport routes The routes of transport that are used by the different transports from
Grinder Facilities The amount of cocoa that is transported in the grinder facilities as well as
the value-added to the product for evaluating the impact of decisions
Transport trucks The trucks that transport the products for being export at the Port. The
speeds and capacities will be considered as well
Warehouses The warehouses dwell time will be considered
Checkpoints along the transport routes. These points will be considered since they hinder the smooth flow of truck
towards the Port.
State of roads and pavement The quality of the road will be considered since it has a direct impact in
the transport time from the different locations in the region to the Port
Market value of the products The market value of the two modelled products will be considered
Emissions In the model the green-house pollutants are considered, mainly CO2 and
NO2Source: author (2018).
5.3.1.1 PROBLEM FORMULATION AND OBJECTIVES
The objective of the simulation tool is to have a tool that is able to assess, analyze and to be used for proposing
practical solutions for optimizing the logistics of the supply chain of Cocoa in Ivory Coast, and in particular in the
region of San Pedro. The model will be a dynamic one that includes the main stakeholders and the main processes
so that it is useful for analyzing and evaluating new policies that bring about an increase in the productivity or
the welfare of the region. Another pursued objective, is a simulated-based tool that raises the awareness of policy
makers, within or outside the country, about the types of decisions and their impacts in a graphical fashion so that
it is easy to perceive and identify the bottlenecks for improving the productivity and the standards of living within
the region under study. To this end, the model is flexible enough that allows showing the impact of decisions such
as, the investment in improving the maintenance levels, the environmental impact of those decisions, change in the
processes of verification of quality or safety in the roads among others.
This model is a unique and novel approach that properly used enable the policy makers and analysts to evaluate
the impact of decision-making under uncertainty for the improvement of the Cocoa Supply Chain in the region
of San Pedro. It is important to mention, that the model is an abstraction of the reality of the system, and some
readers might identify some elements that might have some marginal impact or important one; but one of the
main advantages of using this approach is that the tool can be improved or tailored by adding other elements in the
model at a later stage.
The conceptual framework of the simulation model, identifies the main elements that will be used for determining
the relationships of the different stakeholders in the system. It was based mainly in the relationships identified by the
study made by the Port of Amsterdam (Port of Amsterdam, 2017). Figure 5.1 illustrates the most relevant elements
to be considered for the developed model. The development was based on the identified relationships of this report.
Figure 5.2 The Cocoa Supply Chain Model
Source: PoA (2017).
The simulation model will put focus only in the hinterland, finishing at the Port (Exporting Port). The farmers
produce the Cocoa beans which in turn are transported by a merchant or the production is concentrated by a
cooperative of producers (Farmers) in warehouses. In the next step, the product is then transported as raw one
directly to the Port and some percentage is transported to the Grinders (30% of the production). In the grinder or
refinery, the raw Cocoa is transformed into cocoa butter and then transported as a higher-value product to the Port
of San Pedro. The next link in the supply chain is to transport either the raw material (Beans) or the refined product
(butter or oil) by sea to the destination Port, in our study the destination Port in Europe corresponds to the Port of
Amsterdam, however, as mentioned before, the transport to the Port of Amsterdam will be out of the scope of the
developed model.
5.3.1 Development Phase This is the phase which corresponds to the development of the conceptual framework for the model of the supply
chain. It will focus on developing the model from its conceptual phase until the coding of it using a computer
program.
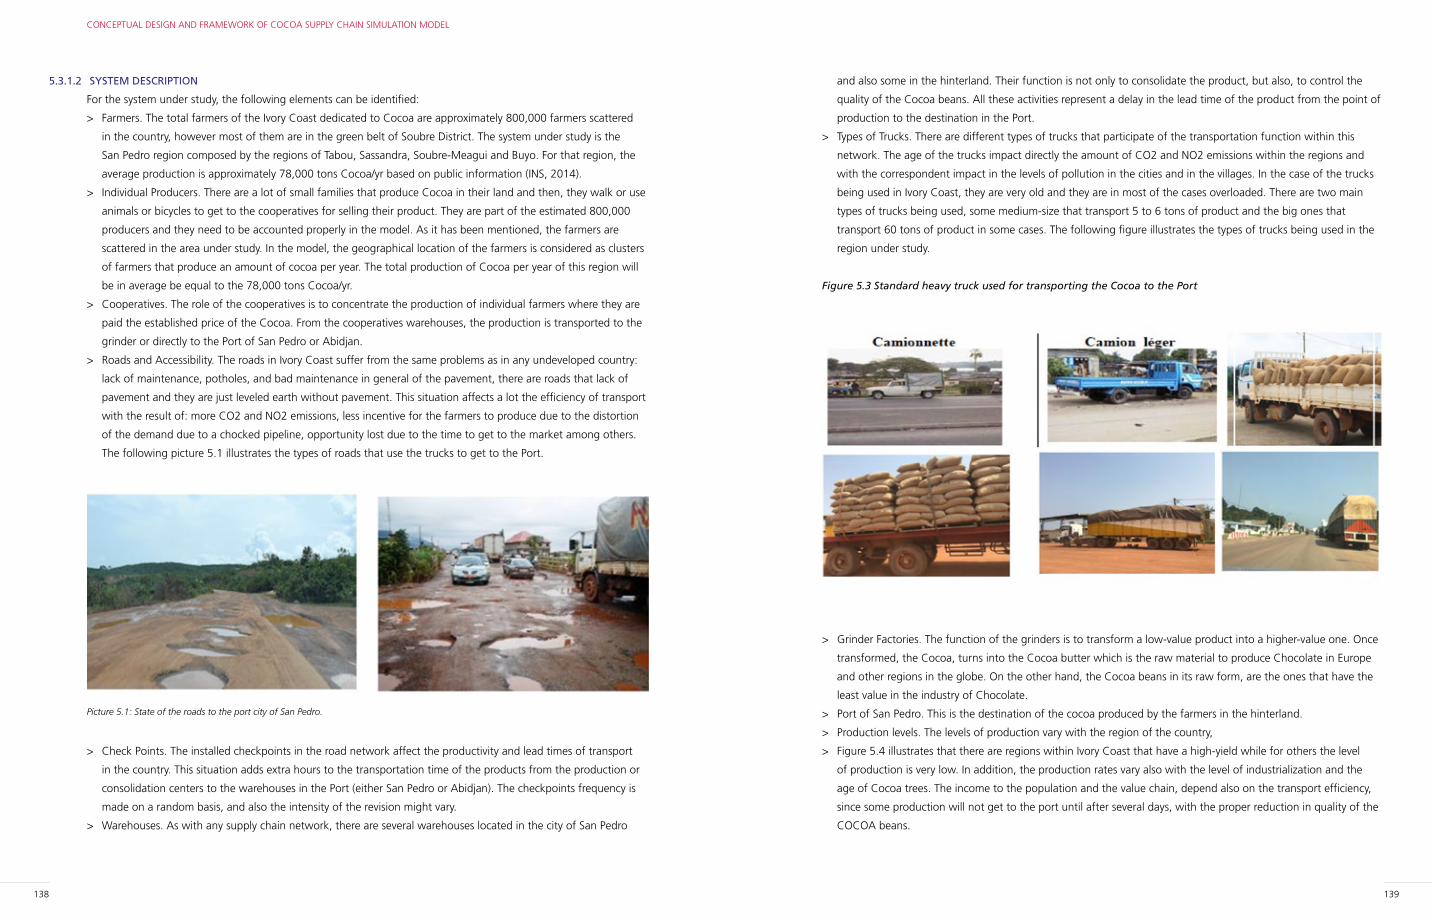
138 139
CONCEPTUAL DESIGN AND FRAMEWORK OF COCOA SUPPLY CHAIN SIMULATION MODEL
and also some in the hinterland. Their function is not only to consolidate the product, but also, to control the
quality of the Cocoa beans. All these activities represent a delay in the lead time of the product from the point of
production to the destination in the Port.
> Types of Trucks. There are different types of trucks that participate of the transportation function within this
network. The age of the trucks impact directly the amount of CO2 and NO2 emissions within the regions and
with the correspondent impact in the levels of pollution in the cities and in the villages. In the case of the trucks
being used in Ivory Coast, they are very old and they are in most of the cases overloaded. There are two main
types of trucks being used, some medium-size that transport 5 to 6 tons of product and the big ones that
transport 60 tons of product in some cases. The following figure illustrates the types of trucks being used in the
region under study.
Figure 5.3 Standard heavy truck used for transporting the Cocoa to the Port
> Grinder Factories. The function of the grinders is to transform a low-value product into a higher-value one. Once
transformed, the Cocoa, turns into the Cocoa butter which is the raw material to produce Chocolate in Europe
and other regions in the globe. On the other hand, the Cocoa beans in its raw form, are the ones that have the
least value in the industry of Chocolate.
> Port of San Pedro. This is the destination of the cocoa produced by the farmers in the hinterland.
> Production levels. The levels of production vary with the region of the country,
> Figure 5.4 illustrates that there are regions within Ivory Coast that have a high-yield while for others the level
of production is very low. In addition, the production rates vary also with the level of industrialization and the
age of Cocoa trees. The income to the population and the value chain, depend also on the transport efficiency,
since some production will not get to the port until after several days, with the proper reduction in quality of the
COCOA beans.
5.3.1.2 SYSTEM DESCRIPTION
For the system under study, the following elements can be identified:
> Farmers. The total farmers of the Ivory Coast dedicated to Cocoa are approximately 800,000 farmers scattered
in the country, however most of them are in the green belt of Soubre District. The system under study is the
San Pedro region composed by the regions of Tabou, Sassandra, Soubre-Meagui and Buyo. For that region, the
average production is approximately 78,000 tons Cocoa/yr based on public information (INS, 2014).
> Individual Producers. There are a lot of small families that produce Cocoa in their land and then, they walk or use
animals or bicycles to get to the cooperatives for selling their product. They are part of the estimated 800,000
producers and they need to be accounted properly in the model. As it has been mentioned, the farmers are
scattered in the area under study. In the model, the geographical location of the farmers is considered as clusters
of farmers that produce an amount of cocoa per year. The total production of Cocoa per year of this region will
be in average be equal to the 78,000 tons Cocoa/yr.
> Cooperatives. The role of the cooperatives is to concentrate the production of individual farmers where they are
paid the established price of the Cocoa. From the cooperatives warehouses, the production is transported to the
grinder or directly to the Port of San Pedro or Abidjan.
> Roads and Accessibility. The roads in Ivory Coast suffer from the same problems as in any undeveloped country:
lack of maintenance, potholes, and bad maintenance in general of the pavement, there are roads that lack of
pavement and they are just leveled earth without pavement. This situation affects a lot the efficiency of transport
with the result of: more CO2 and NO2 emissions, less incentive for the farmers to produce due to the distortion
of the demand due to a chocked pipeline, opportunity lost due to the time to get to the market among others.
The following picture 5.1 illustrates the types of roads that use the trucks to get to the Port.
Picture 5.1: State of the roads to the port city of San Pedro.
> Check Points. The installed checkpoints in the road network affect the productivity and lead times of transport
in the country. This situation adds extra hours to the transportation time of the products from the production or
consolidation centers to the warehouses in the Port (either San Pedro or Abidjan). The checkpoints frequency is
made on a random basis, and also the intensity of the revision might vary.
> Warehouses. As with any supply chain network, there are several warehouses located in the city of San Pedro
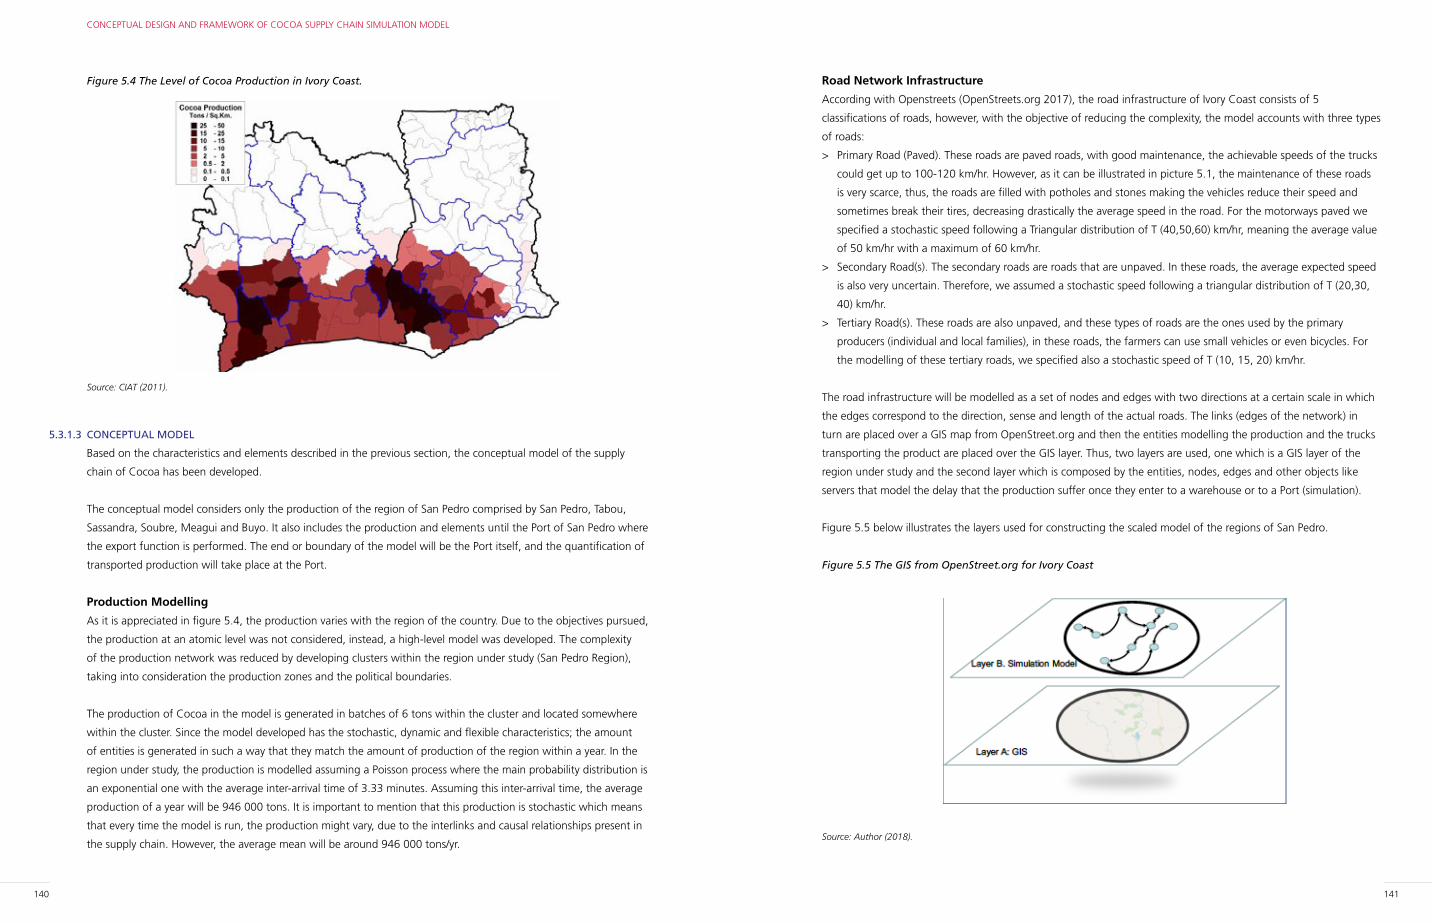
140 141
CONCEPTUAL DESIGN AND FRAMEWORK OF COCOA SUPPLY CHAIN SIMULATION MODEL
Road Network Infrastructure
According with Openstreets (OpenStreets.org 2017), the road infrastructure of Ivory Coast consists of 5
classifications of roads, however, with the objective of reducing the complexity, the model accounts with three types
of roads:
> Primary Road (Paved). These roads are paved roads, with good maintenance, the achievable speeds of the trucks
could get up to 100-120 km/hr. However, as it can be illustrated in picture 5.1, the maintenance of these roads
is very scarce, thus, the roads are filled with potholes and stones making the vehicles reduce their speed and
sometimes break their tires, decreasing drastically the average speed in the road. For the motorways paved we
specified a stochastic speed following a Triangular distribution of T (40,50,60) km/hr, meaning the average value
of 50 km/hr with a maximum of 60 km/hr.
> Secondary Road(s). The secondary roads are roads that are unpaved. In these roads, the average expected speed
is also very uncertain. Therefore, we assumed a stochastic speed following a triangular distribution of T (20,30,
40) km/hr.
> Tertiary Road(s). These roads are also unpaved, and these types of roads are the ones used by the primary
producers (individual and local families), in these roads, the farmers can use small vehicles or even bicycles. For
the modelling of these tertiary roads, we specified also a stochastic speed of T (10, 15, 20) km/hr.
The road infrastructure will be modelled as a set of nodes and edges with two directions at a certain scale in which
the edges correspond to the direction, sense and length of the actual roads. The links (edges of the network) in
turn are placed over a GIS map from OpenStreet.org and then the entities modelling the production and the trucks
transporting the product are placed over the GIS layer. Thus, two layers are used, one which is a GIS layer of the
region under study and the second layer which is composed by the entities, nodes, edges and other objects like
servers that model the delay that the production suffer once they enter to a warehouse or to a Port (simulation).
Figure 5.5 below illustrates the layers used for constructing the scaled model of the regions of San Pedro.
Figure 5.5 The GIS from OpenStreet.org for Ivory Coast
Source: Author (2018).
Figure 5.4 The Level of Cocoa Production in Ivory Coast.
Source: CIAT (2011).
5.3.1.3 CONCEPTUAL MODEL
Based on the characteristics and elements described in the previous section, the conceptual model of the supply
chain of Cocoa has been developed.
The conceptual model considers only the production of the region of San Pedro comprised by San Pedro, Tabou,
Sassandra, Soubre, Meagui and Buyo. It also includes the production and elements until the Port of San Pedro where
the export function is performed. The end or boundary of the model will be the Port itself, and the quantification of
transported production will take place at the Port.
Production Modelling
As it is appreciated in figure 5.4, the production varies with the region of the country. Due to the objectives pursued,
the production at an atomic level was not considered, instead, a high-level model was developed. The complexity
of the production network was reduced by developing clusters within the region under study (San Pedro Region),
taking into consideration the production zones and the political boundaries.
The production of Cocoa in the model is generated in batches of 6 tons within the cluster and located somewhere
within the cluster. Since the model developed has the stochastic, dynamic and flexible characteristics; the amount
of entities is generated in such a way that they match the amount of production of the region within a year. In the
region under study, the production is modelled assuming a Poisson process where the main probability distribution is
an exponential one with the average inter-arrival time of 3.33 minutes. Assuming this inter-arrival time, the average
production of a year will be 946 000 tons. It is important to mention that this production is stochastic which means
that every time the model is run, the production might vary, due to the interlinks and causal relationships present in
the supply chain. However, the average mean will be around 946 000 tons/yr.
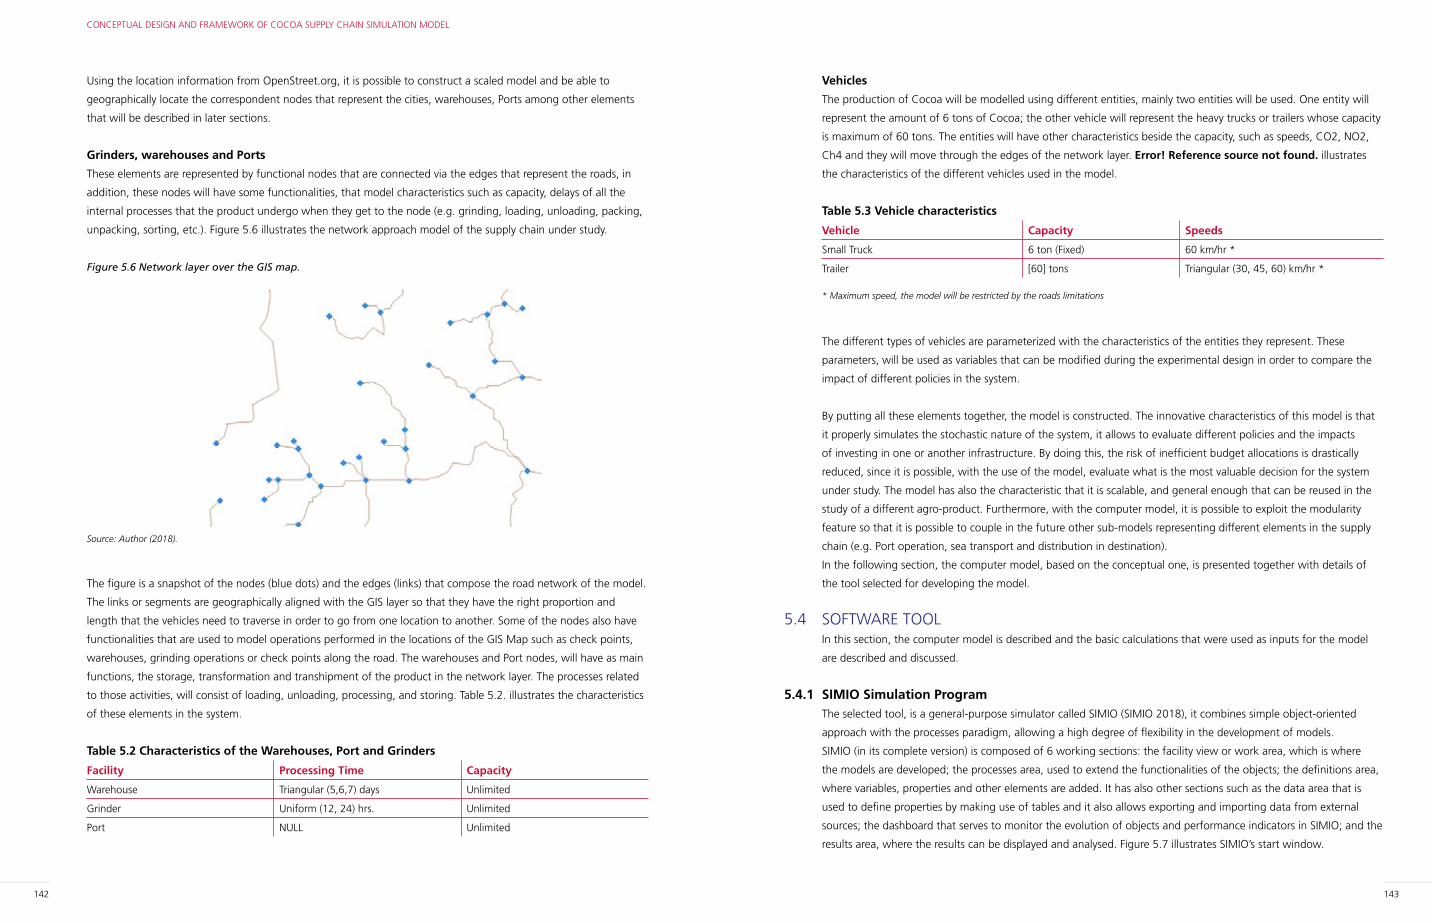
142 143
CONCEPTUAL DESIGN AND FRAMEWORK OF COCOA SUPPLY CHAIN SIMULATION MODEL
Vehicles
The production of Cocoa will be modelled using different entities, mainly two entities will be used. One entity will
represent the amount of 6 tons of Cocoa; the other vehicle will represent the heavy trucks or trailers whose capacity
is maximum of 60 tons. The entities will have other characteristics beside the capacity, such as speeds, CO2, NO2,
Ch4 and they will move through the edges of the network layer. Error! Reference source not found. illustrates
the characteristics of the different vehicles used in the model.
Table 5.3 Vehicle characteristics
Vehicle Capacity Speeds
Small Truck 6 ton (Fixed) 60 km/hr *
Trailer [60] tons Triangular (30, 45, 60) km/hr *
* Maximum speed, the model will be restricted by the roads limitations
The different types of vehicles are parameterized with the characteristics of the entities they represent. These
parameters, will be used as variables that can be modified during the experimental design in order to compare the
impact of different policies in the system.
By putting all these elements together, the model is constructed. The innovative characteristics of this model is that
it properly simulates the stochastic nature of the system, it allows to evaluate different policies and the impacts
of investing in one or another infrastructure. By doing this, the risk of inefficient budget allocations is drastically
reduced, since it is possible, with the use of the model, evaluate what is the most valuable decision for the system
under study. The model has also the characteristic that it is scalable, and general enough that can be reused in the
study of a different agro-product. Furthermore, with the computer model, it is possible to exploit the modularity
feature so that it is possible to couple in the future other sub-models representing different elements in the supply
chain (e.g. Port operation, sea transport and distribution in destination).
In the following section, the computer model, based on the conceptual one, is presented together with details of
the tool selected for developing the model.
5.4 SOFTWARE TOOLIn this section, the computer model is described and the basic calculations that were used as inputs for the model
are described and discussed.
5.4.1 SIMIO Simulation ProgramThe selected tool, is a general-purpose simulator called SIMIO (SIMIO 2018), it combines simple object-oriented
approach with the processes paradigm, allowing a high degree of flexibility in the development of models.
SIMIO (in its complete version) is composed of 6 working sections: the facility view or work area, which is where
the models are developed; the processes area, used to extend the functionalities of the objects; the definitions area,
where variables, properties and other elements are added. It has also other sections such as the data area that is
used to define properties by making use of tables and it also allows exporting and importing data from external
sources; the dashboard that serves to monitor the evolution of objects and performance indicators in SIMIO; and the
results area, where the results can be displayed and analysed. Figure 5.7 illustrates SIMIO’s start window.
Using the location information from OpenStreet.org, it is possible to construct a scaled model and be able to
geographically locate the correspondent nodes that represent the cities, warehouses, Ports among other elements
that will be described in later sections.
Grinders, warehouses and Ports
These elements are represented by functional nodes that are connected via the edges that represent the roads, in
addition, these nodes will have some functionalities, that model characteristics such as capacity, delays of all the
internal processes that the product undergo when they get to the node (e.g. grinding, loading, unloading, packing,
unpacking, sorting, etc.). Figure 5.6 illustrates the network approach model of the supply chain under study.
Figure 5.6 Network layer over the GIS map.
Source: Author (2018).
The figure is a snapshot of the nodes (blue dots) and the edges (links) that compose the road network of the model.
The links or segments are geographically aligned with the GIS layer so that they have the right proportion and
length that the vehicles need to traverse in order to go from one location to another. Some of the nodes also have
functionalities that are used to model operations performed in the locations of the GIS Map such as check points,
warehouses, grinding operations or check points along the road. The warehouses and Port nodes, will have as main
functions, the storage, transformation and transhipment of the product in the network layer. The processes related
to those activities, will consist of loading, unloading, processing, and storing. Table 5.2. illustrates the characteristics
of these elements in the system.
Table 5.2 Characteristics of the Warehouses, Port and Grinders
Facility Processing Time Capacity
Warehouse Triangular (5,6,7) days Unlimited
Grinder Uniform (12, 24) hrs. Unlimited
Port NULL Unlimited
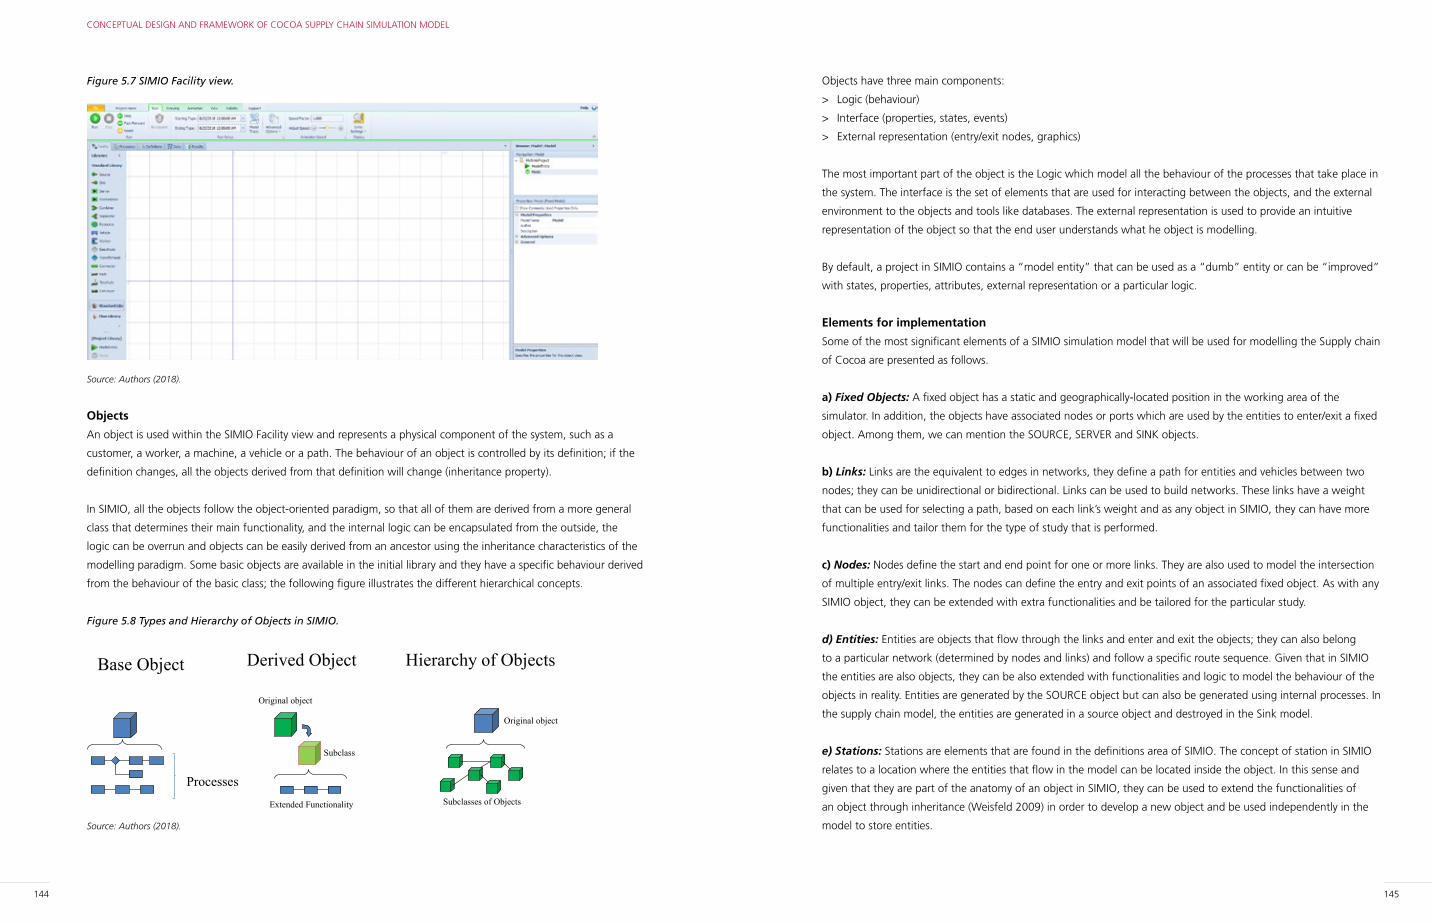
144 145
CONCEPTUAL DESIGN AND FRAMEWORK OF COCOA SUPPLY CHAIN SIMULATION MODEL
Objects have three main components:
> Logic (behaviour)
> Interface (properties, states, events)
> External representation (entry/exit nodes, graphics)
The most important part of the object is the Logic which model all the behaviour of the processes that take place in
the system. The interface is the set of elements that are used for interacting between the objects, and the external
environment to the objects and tools like databases. The external representation is used to provide an intuitive
representation of the object so that the end user understands what he object is modelling.
By default, a project in SIMIO contains a “model entity” that can be used as a “dumb” entity or can be “improved”
with states, properties, attributes, external representation or a particular logic.
Elements for implementation
Some of the most significant elements of a SIMIO simulation model that will be used for modelling the Supply chain
of Cocoa are presented as follows.
a) Fixed Objects: A fixed object has a static and geographically-located position in the working area of the
simulator. In addition, the objects have associated nodes or ports which are used by the entities to enter/exit a fixed
object. Among them, we can mention the SOURCE, SERVER and SINK objects.
b) Links: Links are the equivalent to edges in networks, they define a path for entities and vehicles between two
nodes; they can be unidirectional or bidirectional. Links can be used to build networks. These links have a weight
that can be used for selecting a path, based on each link’s weight and as any object in SIMIO, they can have more
functionalities and tailor them for the type of study that is performed.
c) Nodes: Nodes define the start and end point for one or more links. They are also used to model the intersection
of multiple entry/exit links. The nodes can define the entry and exit points of an associated fixed object. As with any
SIMIO object, they can be extended with extra functionalities and be tailored for the particular study.
d) Entities: Entities are objects that flow through the links and enter and exit the objects; they can also belong
to a particular network (determined by nodes and links) and follow a specific route sequence. Given that in SIMIO
the entities are also objects, they can be also extended with functionalities and logic to model the behaviour of the
objects in reality. Entities are generated by the SOURCE object but can also be generated using internal processes. In
the supply chain model, the entities are generated in a source object and destroyed in the Sink model.
e) Stations: Stations are elements that are found in the definitions area of SIMIO. The concept of station in SIMIO
relates to a location where the entities that flow in the model can be located inside the object. In this sense and
given that they are part of the anatomy of an object in SIMIO, they can be used to extend the functionalities of
an object through inheritance (Weisfeld 2009) in order to develop a new object and be used independently in the
model to store entities.
Figure 5.7 SIMIO Facility view.
Source: Authors (2018).
Objects
An object is used within the SIMIO Facility view and represents a physical component of the system, such as a
customer, a worker, a machine, a vehicle or a path. The behaviour of an object is controlled by its definition; if the
definition changes, all the objects derived from that definition will change (inheritance property).
In SIMIO, all the objects follow the object-oriented paradigm, so that all of them are derived from a more general
class that determines their main functionality, and the internal logic can be encapsulated from the outside, the
logic can be overrun and objects can be easily derived from an ancestor using the inheritance characteristics of the
modelling paradigm. Some basic objects are available in the initial library and they have a specific behaviour derived
from the behaviour of the basic class; the following figure illustrates the different hierarchical concepts.
Figure 5.8 Types and Hierarchy of Objects in SIMIO.
Base Object Hierarchy of ObjectsDerived Object
Processes
Original object
Subclass
Extended Functionality Subclasses of Objects
Original object
Source: Authors (2018).
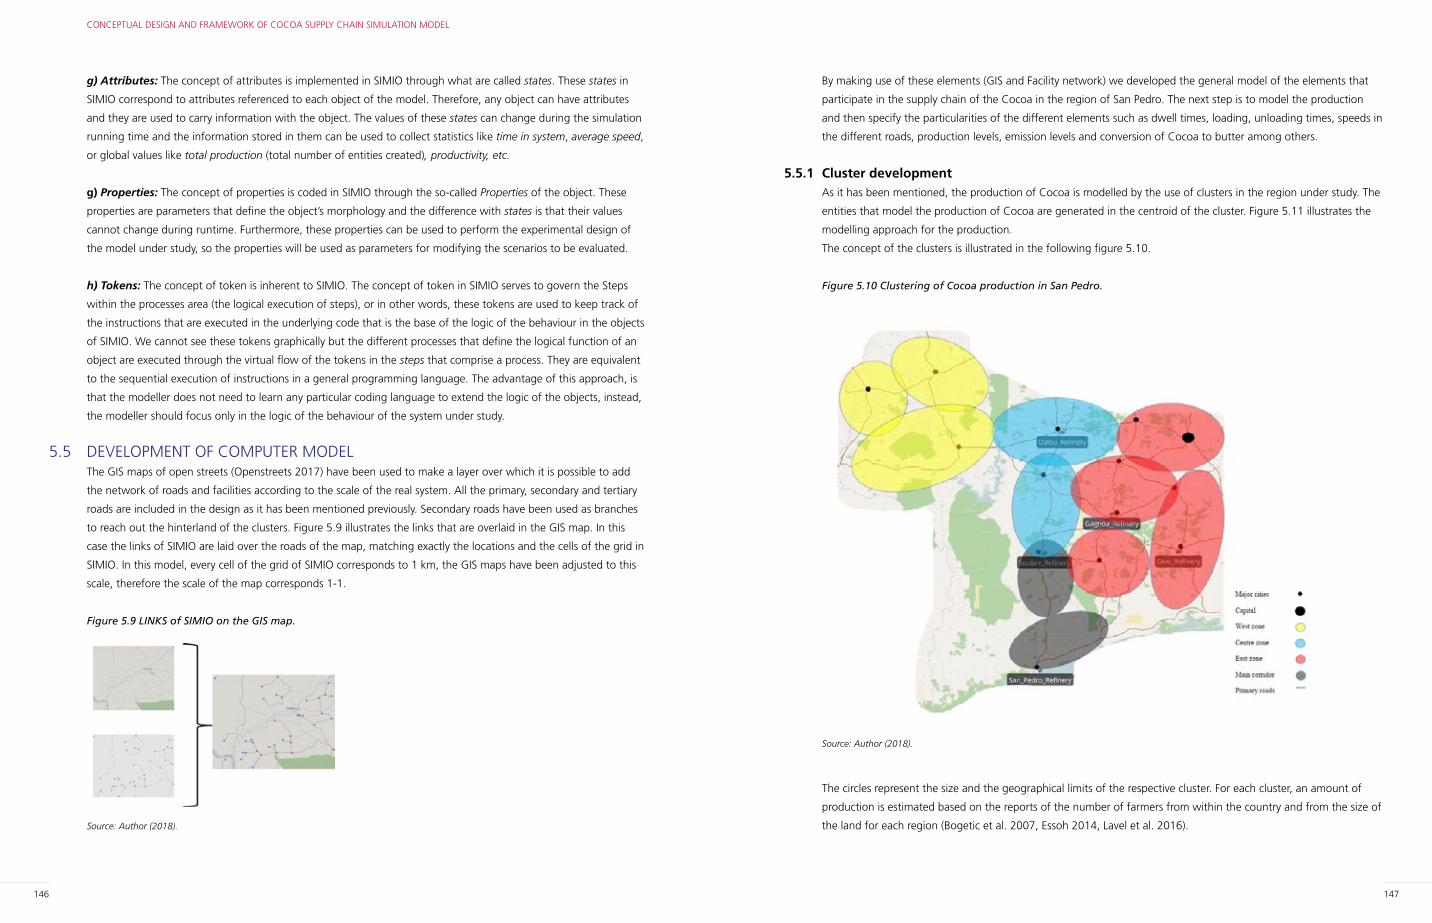
146 147
CONCEPTUAL DESIGN AND FRAMEWORK OF COCOA SUPPLY CHAIN SIMULATION MODEL
By making use of these elements (GIS and Facility network) we developed the general model of the elements that
participate in the supply chain of the Cocoa in the region of San Pedro. The next step is to model the production
and then specify the particularities of the different elements such as dwell times, loading, unloading times, speeds in
the different roads, production levels, emission levels and conversion of Cocoa to butter among others.
5.5.1 Cluster development As it has been mentioned, the production of Cocoa is modelled by the use of clusters in the region under study. The
entities that model the production of Cocoa are generated in the centroid of the cluster. Figure 5.11 illustrates the
modelling approach for the production.
The concept of the clusters is illustrated in the following figure 5.10.
Figure 5.10 Clustering of Cocoa production in San Pedro.
Source: Author (2018).
The circles represent the size and the geographical limits of the respective cluster. For each cluster, an amount of
production is estimated based on the reports of the number of farmers from within the country and from the size of
the land for each region (Bogetic et al. 2007, Essoh 2014, Lavel et al. 2016).
g) Attributes: The concept of attributes is implemented in SIMIO through what are called states. These states in
SIMIO correspond to attributes referenced to each object of the model. Therefore, any object can have attributes
and they are used to carry information with the object. The values of these states can change during the simulation
running time and the information stored in them can be used to collect statistics like time in system, average speed,
or global values like total production (total number of entities created), productivity, etc.
g) Properties: The concept of properties is coded in SIMIO through the so-called Properties of the object. These
properties are parameters that define the object’s morphology and the difference with states is that their values
cannot change during runtime. Furthermore, these properties can be used to perform the experimental design of
the model under study, so the properties will be used as parameters for modifying the scenarios to be evaluated.
h) Tokens: The concept of token is inherent to SIMIO. The concept of token in SIMIO serves to govern the Steps
within the processes area (the logical execution of steps), or in other words, these tokens are used to keep track of
the instructions that are executed in the underlying code that is the base of the logic of the behaviour in the objects
of SIMIO. We cannot see these tokens graphically but the different processes that define the logical function of an
object are executed through the virtual flow of the tokens in the steps that comprise a process. They are equivalent
to the sequential execution of instructions in a general programming language. The advantage of this approach, is
that the modeller does not need to learn any particular coding language to extend the logic of the objects, instead,
the modeller should focus only in the logic of the behaviour of the system under study.
5.5 DEVELOPMENT OF COMPUTER MODELThe GIS maps of open streets (Openstreets 2017) have been used to make a layer over which it is possible to add
the network of roads and facilities according to the scale of the real system. All the primary, secondary and tertiary
roads are included in the design as it has been mentioned previously. Secondary roads have been used as branches
to reach out the hinterland of the clusters. Figure 5.9 illustrates the links that are overlaid in the GIS map. In this
case the links of SIMIO are laid over the roads of the map, matching exactly the locations and the cells of the grid in
SIMIO. In this model, every cell of the grid of SIMIO corresponds to 1 km, the GIS maps have been adjusted to this
scale, therefore the scale of the map corresponds 1-1.
Figure 5.9 LINKS of SIMIO on the GIS map.
Source: Author (2018).
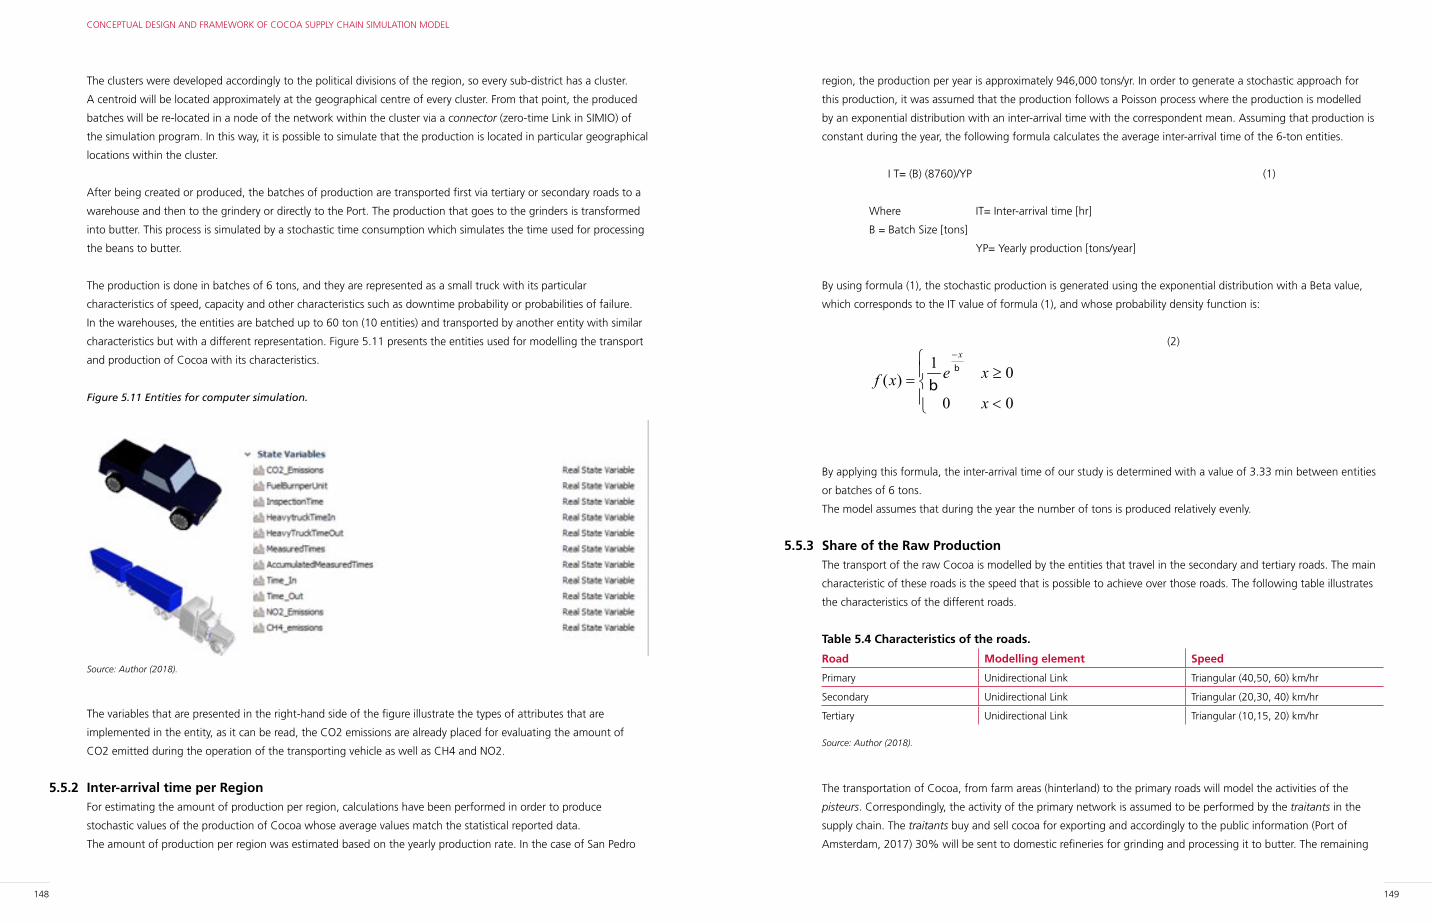
148 149
CONCEPTUAL DESIGN AND FRAMEWORK OF COCOA SUPPLY CHAIN SIMULATION MODEL
region, the production per year is approximately 946,000 tons/yr. In order to generate a stochastic approach for
this production, it was assumed that the production follows a Poisson process where the production is modelled
by an exponential distribution with an inter-arrival time with the correspondent mean. Assuming that production is
constant during the year, the following formula calculates the average inter-arrival time of the 6-ton entities.
I T= (B) (8760)/YP (1)
Where IT= Inter-arrival time [hr]
B = Batch Size [tons]
YP= Yearly production [tons/year]
By using formula (1), the stochastic production is generated using the exponential distribution with a Beta value,
which corresponds to the IT value of formula (1), and whose probability density function is:
<
≥=
−
00
01)(
x
xexf
xb
b
(2)
By applying this formula, the inter-arrival time of our study is determined with a value of 3.33 min between entities
or batches of 6 tons.
The model assumes that during the year the number of tons is produced relatively evenly.
5.5.3 Share of the Raw ProductionThe transport of the raw Cocoa is modelled by the entities that travel in the secondary and tertiary roads. The main
characteristic of these roads is the speed that is possible to achieve over those roads. The following table illustrates
the characteristics of the different roads.
Table 5.4 Characteristics of the roads.
Road Modelling element Speed
Primary Unidirectional Link Triangular (40,50, 60) km/hr
Secondary Unidirectional Link Triangular (20,30, 40) km/hr
Tertiary Unidirectional Link Triangular (10,15, 20) km/hr
Source: Author (2018).
The transportation of Cocoa, from farm areas (hinterland) to the primary roads will model the activities of the
pisteurs. Correspondingly, the activity of the primary network is assumed to be performed by the traitants in the
supply chain. The traitants buy and sell cocoa for exporting and accordingly to the public information (Port of
Amsterdam, 2017) 30% will be sent to domestic refineries for grinding and processing it to butter. The remaining
The clusters were developed accordingly to the political divisions of the region, so every sub-district has a cluster.
A centroid will be located approximately at the geographical centre of every cluster. From that point, the produced
batches will be re-located in a node of the network within the cluster via a connector (zero-time Link in SIMIO) of
the simulation program. In this way, it is possible to simulate that the production is located in particular geographical
locations within the cluster.
After being created or produced, the batches of production are transported first via tertiary or secondary roads to a
warehouse and then to the grindery or directly to the Port. The production that goes to the grinders is transformed
into butter. This process is simulated by a stochastic time consumption which simulates the time used for processing
the beans to butter.
The production is done in batches of 6 tons, and they are represented as a small truck with its particular
characteristics of speed, capacity and other characteristics such as downtime probability or probabilities of failure.
In the warehouses, the entities are batched up to 60 ton (10 entities) and transported by another entity with similar
characteristics but with a different representation. Figure 5.11 presents the entities used for modelling the transport
and production of Cocoa with its characteristics.
Figure 5.11 Entities for computer simulation.
Source: Author (2018).
The variables that are presented in the right-hand side of the figure illustrate the types of attributes that are
implemented in the entity, as it can be read, the CO2 emissions are already placed for evaluating the amount of
CO2 emitted during the operation of the transporting vehicle as well as CH4 and NO2.
5.5.2 Inter-arrival time per RegionFor estimating the amount of production per region, calculations have been performed in order to produce
stochastic values of the production of Cocoa whose average values match the statistical reported data.
The amount of production per region was estimated based on the yearly production rate. In the case of San Pedro
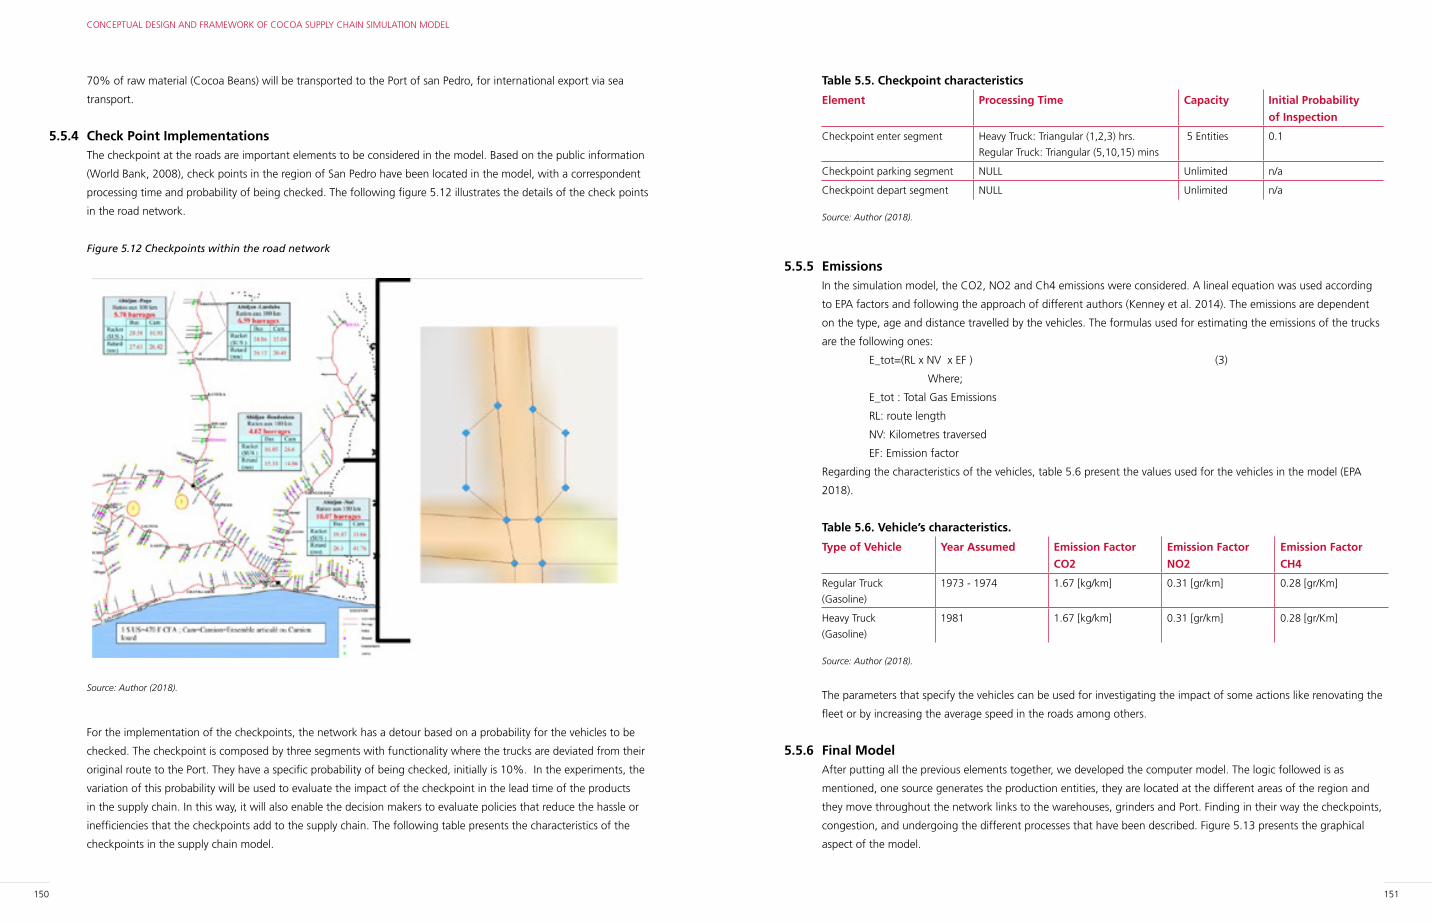
150 151
CONCEPTUAL DESIGN AND FRAMEWORK OF COCOA SUPPLY CHAIN SIMULATION MODEL
Table 5.5. Checkpoint characteristics
Element Processing Time Capacity Initial Probability
of Inspection
Checkpoint enter segment Heavy Truck: Triangular (1,2,3) hrs.
Regular Truck: Triangular (5,10,15) mins
5 Entities 0.1
Checkpoint parking segment NULL Unlimited n/a
Checkpoint depart segment NULL Unlimited n/a
Source: Author (2018).
5.5.5 Emissions In the simulation model, the CO2, NO2 and Ch4 emissions were considered. A lineal equation was used according
to EPA factors and following the approach of different authors (Kenney et al. 2014). The emissions are dependent
on the type, age and distance travelled by the vehicles. The formulas used for estimating the emissions of the trucks
are the following ones:
E_tot=(RL x NV x EF ) (3)
Where;
E_tot : Total Gas Emissions
RL: route length
NV: Kilometres traversed
EF: Emission factor
Regarding the characteristics of the vehicles, table 5.6 present the values used for the vehicles in the model (EPA
2018).
Table 5.6. Vehicle’s characteristics.
Type of Vehicle Year Assumed Emission Factor
CO2
Emission Factor
NO2
Emission Factor
CH4
Regular Truck
(Gasoline)
1973 - 1974 1.67 [kg/km] 0.31 [gr/km] 0.28 [gr/Km]
Heavy Truck
(Gasoline)
1981 1.67 [kg/km] 0.31 [gr/km] 0.28 [gr/Km]
Source: Author (2018).
The parameters that specify the vehicles can be used for investigating the impact of some actions like renovating the
fleet or by increasing the average speed in the roads among others.
5.5.6 Final Model After putting all the previous elements together, we developed the computer model. The logic followed is as
mentioned, one source generates the production entities, they are located at the different areas of the region and
they move throughout the network links to the warehouses, grinders and Port. Finding in their way the checkpoints,
congestion, and undergoing the different processes that have been described. Figure 5.13 presents the graphical
aspect of the model.
70% of raw material (Cocoa Beans) will be transported to the Port of san Pedro, for international export via sea
transport.
5.5.4 Check Point ImplementationsThe checkpoint at the roads are important elements to be considered in the model. Based on the public information
(World Bank, 2008), check points in the region of San Pedro have been located in the model, with a correspondent
processing time and probability of being checked. The following figure 5.12 illustrates the details of the check points
in the road network.
Figure 5.12 Checkpoints within the road network
Source: Author (2018).
For the implementation of the checkpoints, the network has a detour based on a probability for the vehicles to be
checked. The checkpoint is composed by three segments with functionality where the trucks are deviated from their
original route to the Port. They have a specific probability of being checked, initially is 10%. In the experiments, the
variation of this probability will be used to evaluate the impact of the checkpoint in the lead time of the products
in the supply chain. In this way, it will also enable the decision makers to evaluate policies that reduce the hassle or
inefficiencies that the checkpoints add to the supply chain. The following table presents the characteristics of the
checkpoints in the supply chain model.
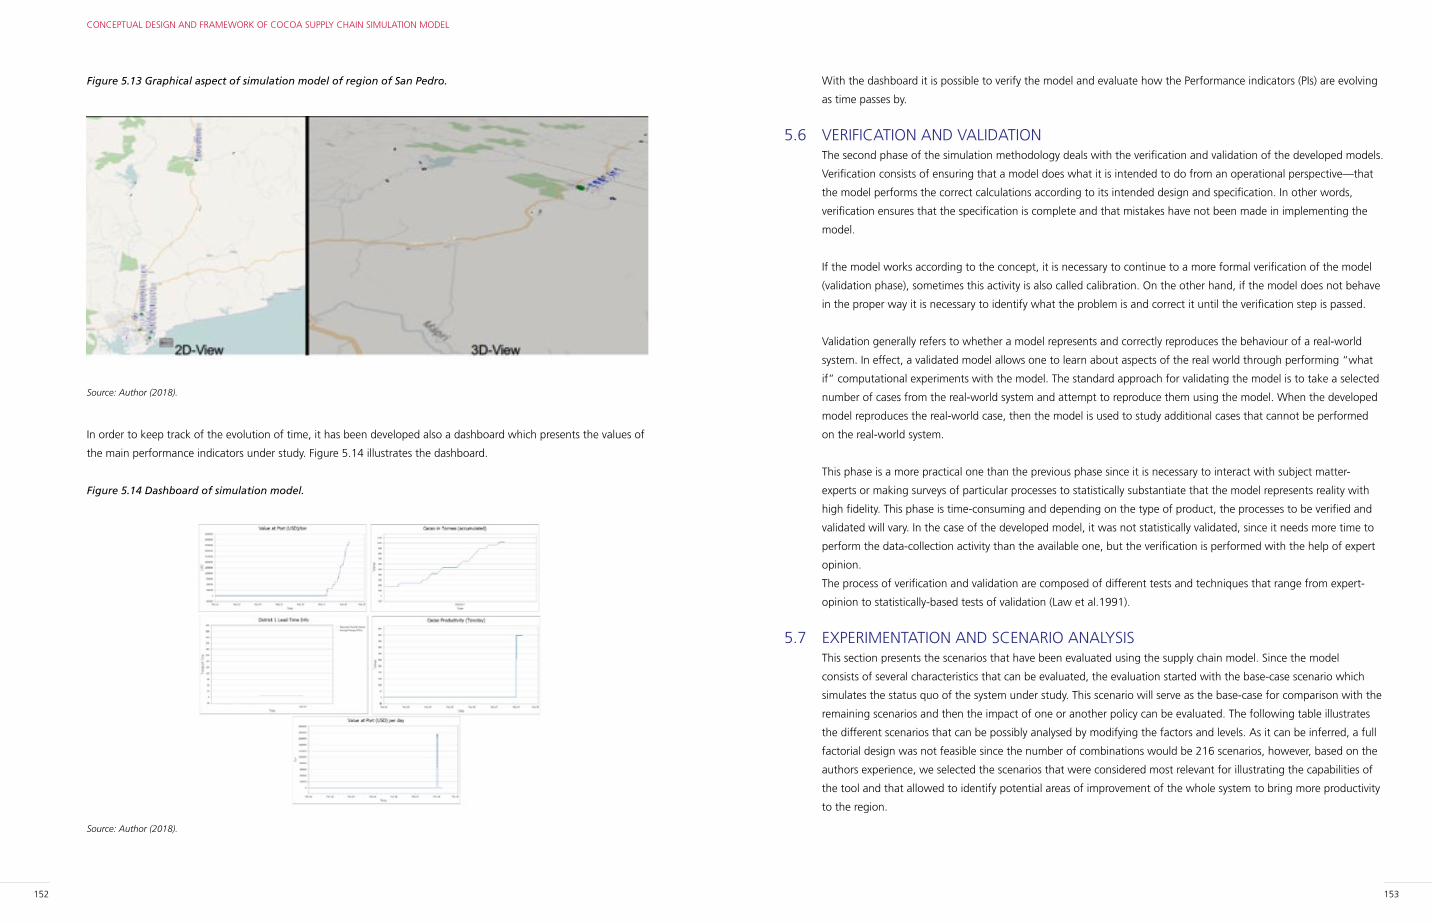
152 153
CONCEPTUAL DESIGN AND FRAMEWORK OF COCOA SUPPLY CHAIN SIMULATION MODEL
With the dashboard it is possible to verify the model and evaluate how the Performance indicators (PIs) are evolving
as time passes by.
5.6 VERIFICATION AND VALIDATIONThe second phase of the simulation methodology deals with the verification and validation of the developed models.
Verification consists of ensuring that a model does what it is intended to do from an operational perspective—that
the model performs the correct calculations according to its intended design and specification. In other words,
verification ensures that the specification is complete and that mistakes have not been made in implementing the
model.
If the model works according to the concept, it is necessary to continue to a more formal verification of the model
(validation phase), sometimes this activity is also called calibration. On the other hand, if the model does not behave
in the proper way it is necessary to identify what the problem is and correct it until the verification step is passed.
Validation generally refers to whether a model represents and correctly reproduces the behaviour of a real-world
system. In effect, a validated model allows one to learn about aspects of the real world through performing “what
if” computational experiments with the model. The standard approach for validating the model is to take a selected
number of cases from the real-world system and attempt to reproduce them using the model. When the developed
model reproduces the real-world case, then the model is used to study additional cases that cannot be performed
on the real-world system.
This phase is a more practical one than the previous phase since it is necessary to interact with subject matter-
experts or making surveys of particular processes to statistically substantiate that the model represents reality with
high fidelity. This phase is time-consuming and depending on the type of product, the processes to be verified and
validated will vary. In the case of the developed model, it was not statistically validated, since it needs more time to
perform the data-collection activity than the available one, but the verification is performed with the help of expert
opinion.
The process of verification and validation are composed of different tests and techniques that range from expert-
opinion to statistically-based tests of validation (Law et al.1991).
5.7 EXPERIMENTATION AND SCENARIO ANALYSISThis section presents the scenarios that have been evaluated using the supply chain model. Since the model
consists of several characteristics that can be evaluated, the evaluation started with the base-case scenario which
simulates the status quo of the system under study. This scenario will serve as the base-case for comparison with the
remaining scenarios and then the impact of one or another policy can be evaluated. The following table illustrates
the different scenarios that can be possibly analysed by modifying the factors and levels. As it can be inferred, a full
factorial design was not feasible since the number of combinations would be 216 scenarios, however, based on the
authors experience, we selected the scenarios that were considered most relevant for illustrating the capabilities of
the tool and that allowed to identify potential areas of improvement of the whole system to bring more productivity
to the region.
Figure 5.13 Graphical aspect of simulation model of region of San Pedro.
Source: Author (2018).
In order to keep track of the evolution of time, it has been developed also a dashboard which presents the values of
the main performance indicators under study. Figure 5.14 illustrates the dashboard.
Figure 5.14 Dashboard of simulation model.
Source: Author (2018).
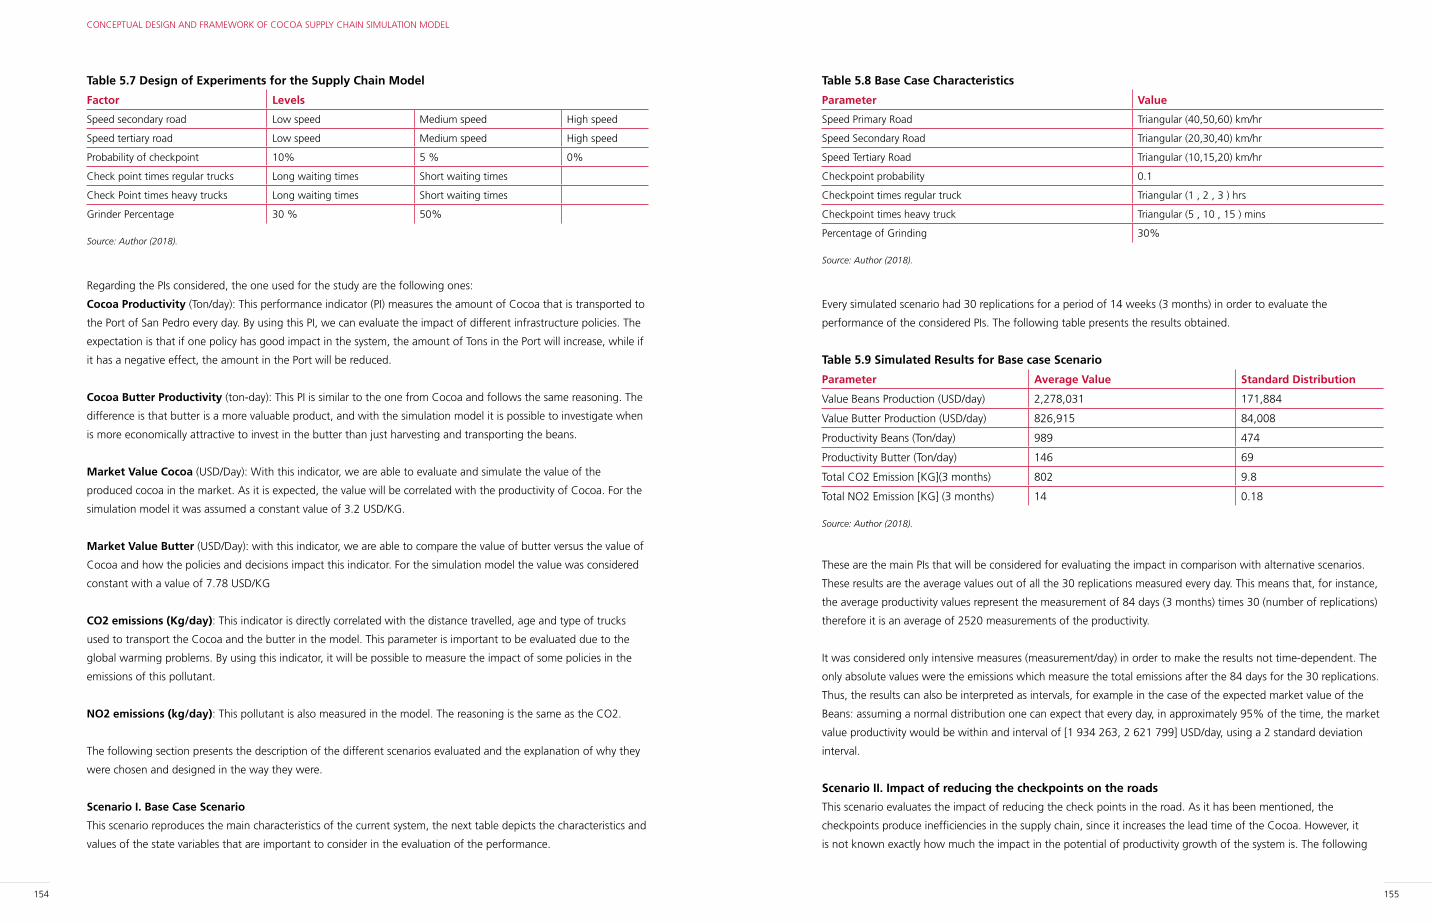
154 155
CONCEPTUAL DESIGN AND FRAMEWORK OF COCOA SUPPLY CHAIN SIMULATION MODEL
Table 5.8 Base Case Characteristics
Parameter Value
Speed Primary Road Triangular (40,50,60) km/hr
Speed Secondary Road Triangular (20,30,40) km/hr
Speed Tertiary Road Triangular (10,15,20) km/hr
Checkpoint probability 0.1
Checkpoint times regular truck Triangular (1 , 2 , 3 ) hrs
Checkpoint times heavy truck Triangular (5 , 10 , 15 ) mins
Percentage of Grinding 30%
Source: Author (2018).
Every simulated scenario had 30 replications for a period of 14 weeks (3 months) in order to evaluate the
performance of the considered PIs. The following table presents the results obtained.
Table 5.9 Simulated Results for Base case Scenario
Parameter Average Value Standard Distribution
Value Beans Production (USD/day) 2,278,031 171,884
Value Butter Production (USD/day) 826,915 84,008
Productivity Beans (Ton/day) 989 474
Productivity Butter (Ton/day) 146 69
Total CO2 Emission [KG](3 months) 802 9.8
Total NO2 Emission [KG] (3 months) 14 0.18
Source: Author (2018).
These are the main PIs that will be considered for evaluating the impact in comparison with alternative scenarios.
These results are the average values out of all the 30 replications measured every day. This means that, for instance,
the average productivity values represent the measurement of 84 days (3 months) times 30 (number of replications)
therefore it is an average of 2520 measurements of the productivity.
It was considered only intensive measures (measurement/day) in order to make the results not time-dependent. The
only absolute values were the emissions which measure the total emissions after the 84 days for the 30 replications.
Thus, the results can also be interpreted as intervals, for example in the case of the expected market value of the
Beans: assuming a normal distribution one can expect that every day, in approximately 95% of the time, the market
value productivity would be within and interval of [1 934 263, 2 621 799] USD/day, using a 2 standard deviation
interval.
Scenario II. Impact of reducing the checkpoints on the roads
This scenario evaluates the impact of reducing the check points in the road. As it has been mentioned, the
checkpoints produce inefficiencies in the supply chain, since it increases the lead time of the Cocoa. However, it
is not known exactly how much the impact in the potential of productivity growth of the system is. The following
Table 5.7 Design of Experiments for the Supply Chain Model
Factor Levels
Speed secondary road Low speed Medium speed High speed
Speed tertiary road Low speed Medium speed High speed
Probability of checkpoint 10% 5 % 0%
Check point times regular trucks Long waiting times Short waiting times
Check Point times heavy trucks Long waiting times Short waiting times
Grinder Percentage 30 % 50%
Source: Author (2018).
Regarding the PIs considered, the one used for the study are the following ones:
Cocoa Productivity (Ton/day): This performance indicator (PI) measures the amount of Cocoa that is transported to
the Port of San Pedro every day. By using this PI, we can evaluate the impact of different infrastructure policies. The
expectation is that if one policy has good impact in the system, the amount of Tons in the Port will increase, while if
it has a negative effect, the amount in the Port will be reduced.
Cocoa Butter Productivity (ton-day): This PI is similar to the one from Cocoa and follows the same reasoning. The
difference is that butter is a more valuable product, and with the simulation model it is possible to investigate when
is more economically attractive to invest in the butter than just harvesting and transporting the beans.
Market Value Cocoa (USD/Day): With this indicator, we are able to evaluate and simulate the value of the
produced cocoa in the market. As it is expected, the value will be correlated with the productivity of Cocoa. For the
simulation model it was assumed a constant value of 3.2 USD/KG.
Market Value Butter (USD/Day): with this indicator, we are able to compare the value of butter versus the value of
Cocoa and how the policies and decisions impact this indicator. For the simulation model the value was considered
constant with a value of 7.78 USD/KG
CO2 emissions (Kg/day): This indicator is directly correlated with the distance travelled, age and type of trucks
used to transport the Cocoa and the butter in the model. This parameter is important to be evaluated due to the
global warming problems. By using this indicator, it will be possible to measure the impact of some policies in the
emissions of this pollutant.
NO2 emissions (kg/day): This pollutant is also measured in the model. The reasoning is the same as the CO2.
The following section presents the description of the different scenarios evaluated and the explanation of why they
were chosen and designed in the way they were.
Scenario I. Base Case Scenario
This scenario reproduces the main characteristics of the current system, the next table depicts the characteristics and
values of the state variables that are important to consider in the evaluation of the performance.
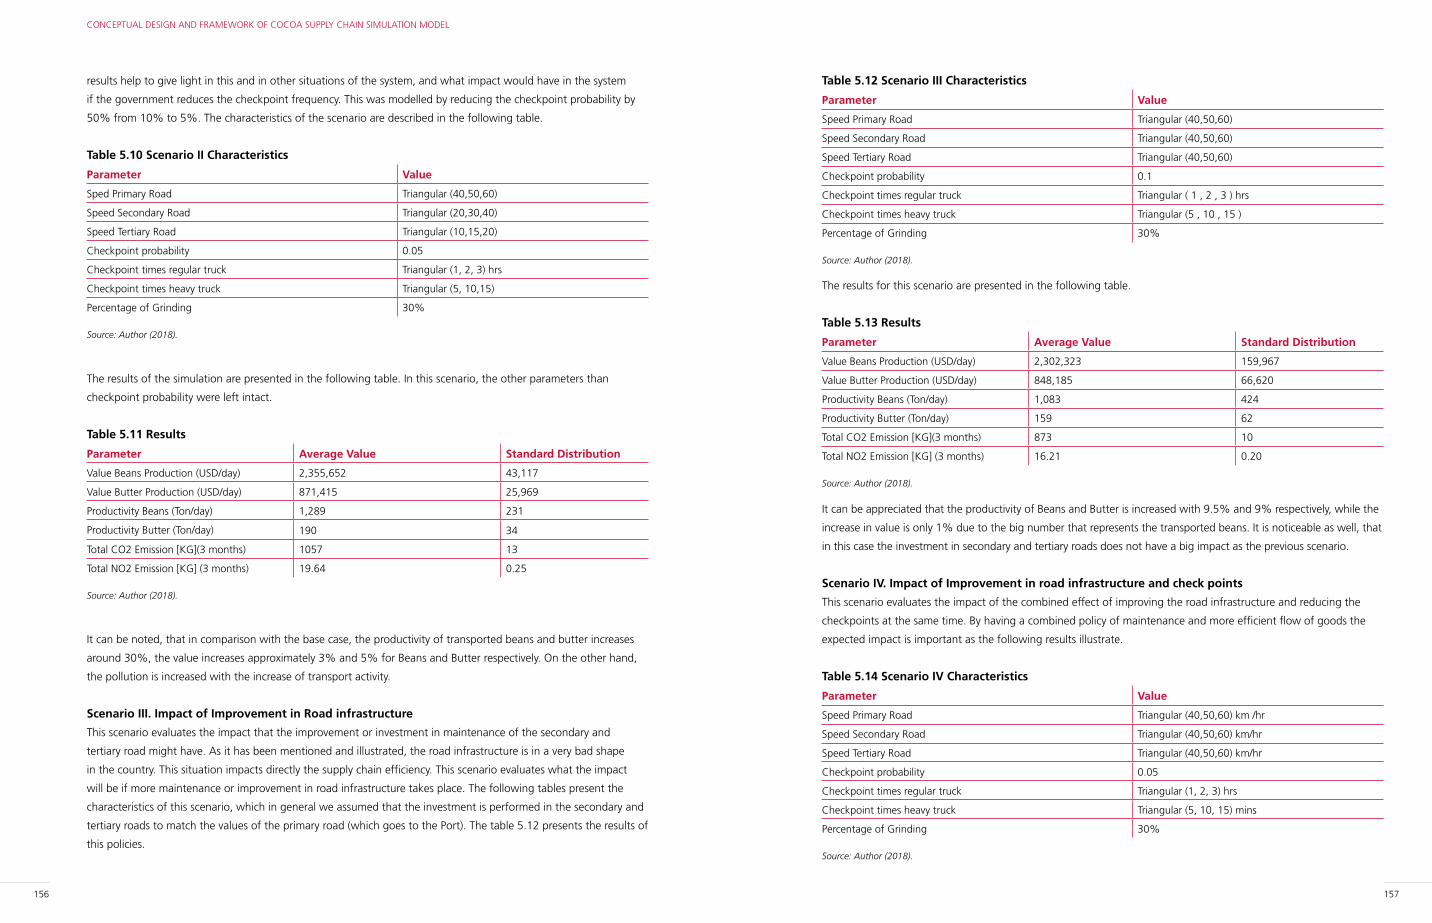
156 157
CONCEPTUAL DESIGN AND FRAMEWORK OF COCOA SUPPLY CHAIN SIMULATION MODEL
Table 5.12 Scenario III Characteristics
Parameter Value
Speed Primary Road Triangular (40,50,60)
Speed Secondary Road Triangular (40,50,60)
Speed Tertiary Road Triangular (40,50,60)
Checkpoint probability 0.1
Checkpoint times regular truck Triangular ( 1 , 2 , 3 ) hrs
Checkpoint times heavy truck Triangular (5 , 10 , 15 )
Percentage of Grinding 30%
Source: Author (2018).
The results for this scenario are presented in the following table.
Table 5.13 Results
Parameter Average Value Standard Distribution
Value Beans Production (USD/day) 2,302,323 159,967
Value Butter Production (USD/day) 848,185 66,620
Productivity Beans (Ton/day) 1,083 424
Productivity Butter (Ton/day) 159 62
Total CO2 Emission [KG](3 months) 873 10
Total NO2 Emission [KG] (3 months) 16.21 0.20
Source: Author (2018).
It can be appreciated that the productivity of Beans and Butter is increased with 9.5% and 9% respectively, while the
increase in value is only 1% due to the big number that represents the transported beans. It is noticeable as well, that
in this case the investment in secondary and tertiary roads does not have a big impact as the previous scenario.
Scenario IV. Impact of Improvement in road infrastructure and check points
This scenario evaluates the impact of the combined effect of improving the road infrastructure and reducing the
checkpoints at the same time. By having a combined policy of maintenance and more efficient flow of goods the
expected impact is important as the following results illustrate.
Table 5.14 Scenario IV Characteristics
Parameter Value
Speed Primary Road Triangular (40,50,60) km /hr
Speed Secondary Road Triangular (40,50,60) km/hr
Speed Tertiary Road Triangular (40,50,60) km/hr
Checkpoint probability 0.05
Checkpoint times regular truck Triangular (1, 2, 3) hrs
Checkpoint times heavy truck Triangular (5, 10, 15) mins
Percentage of Grinding 30%
Source: Author (2018).
results help to give light in this and in other situations of the system, and what impact would have in the system
if the government reduces the checkpoint frequency. This was modelled by reducing the checkpoint probability by
50% from 10% to 5%. The characteristics of the scenario are described in the following table.
Table 5.10 Scenario II Characteristics
Parameter Value
Sped Primary Road Triangular (40,50,60)
Speed Secondary Road Triangular (20,30,40)
Speed Tertiary Road Triangular (10,15,20)
Checkpoint probability 0.05
Checkpoint times regular truck Triangular (1, 2, 3) hrs
Checkpoint times heavy truck Triangular (5, 10,15)
Percentage of Grinding 30%
Source: Author (2018).
The results of the simulation are presented in the following table. In this scenario, the other parameters than
checkpoint probability were left intact.
Table 5.11 Results
Parameter Average Value Standard Distribution
Value Beans Production (USD/day) 2,355,652 43,117
Value Butter Production (USD/day) 871,415 25,969
Productivity Beans (Ton/day) 1,289 231
Productivity Butter (Ton/day) 190 34
Total CO2 Emission [KG](3 months) 1057 13
Total NO2 Emission [KG] (3 months) 19.64 0.25
Source: Author (2018).
It can be noted, that in comparison with the base case, the productivity of transported beans and butter increases
around 30%, the value increases approximately 3% and 5% for Beans and Butter respectively. On the other hand,
the pollution is increased with the increase of transport activity.
Scenario III. Impact of Improvement in Road infrastructure
This scenario evaluates the impact that the improvement or investment in maintenance of the secondary and
tertiary road might have. As it has been mentioned and illustrated, the road infrastructure is in a very bad shape
in the country. This situation impacts directly the supply chain efficiency. This scenario evaluates what the impact
will be if more maintenance or improvement in road infrastructure takes place. The following tables present the
characteristics of this scenario, which in general we assumed that the investment is performed in the secondary and
tertiary roads to match the values of the primary road (which goes to the Port). The table 5.12 presents the results of
this policies.
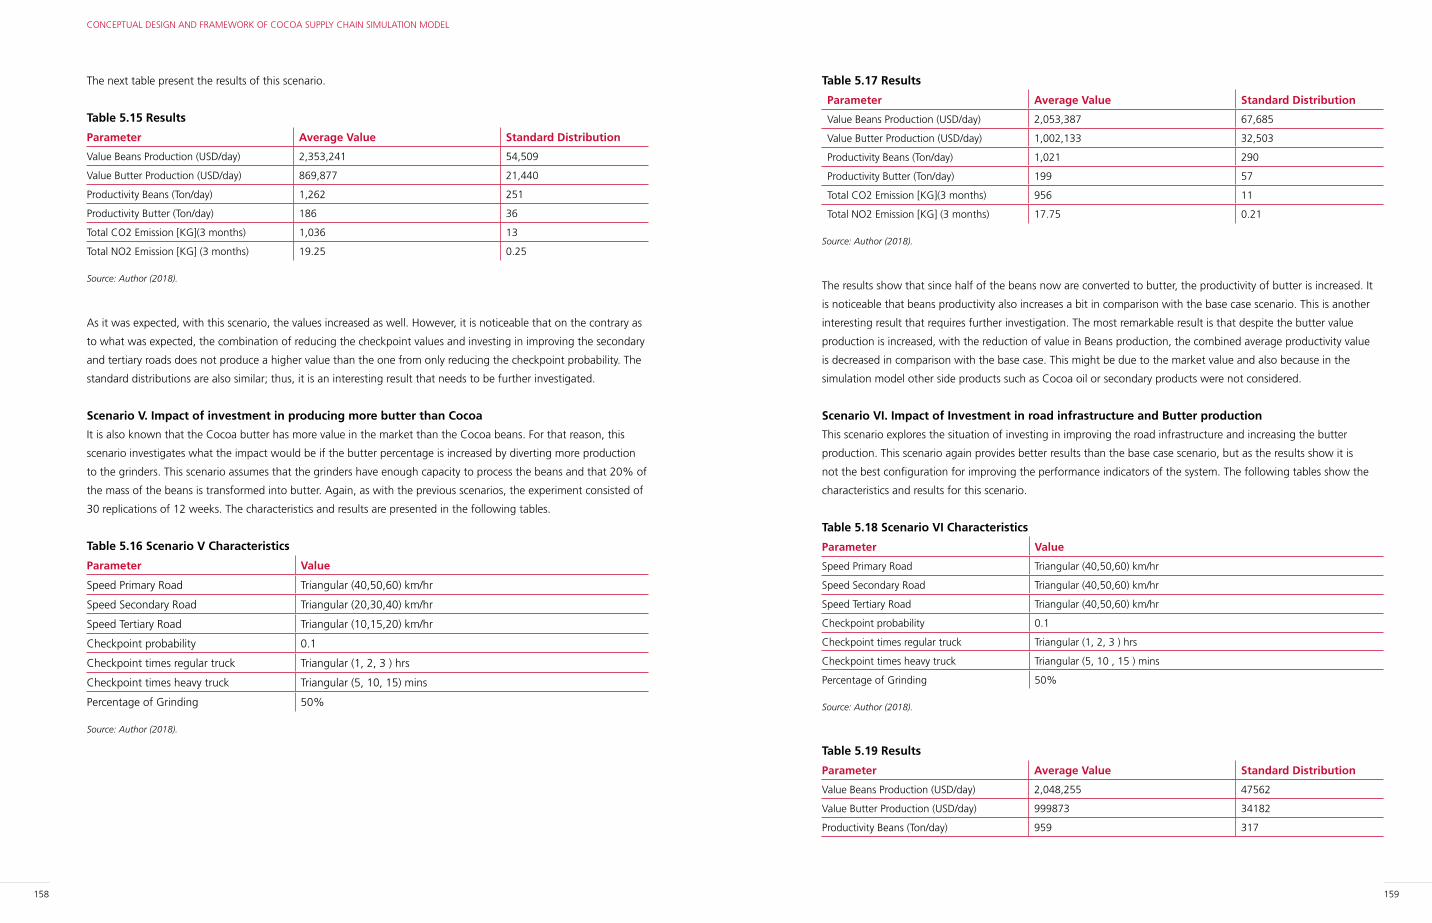
158 159
CONCEPTUAL DESIGN AND FRAMEWORK OF COCOA SUPPLY CHAIN SIMULATION MODEL
Table 5.17 Results
Parameter Average Value Standard Distribution
Value Beans Production (USD/day) 2,053,387 67,685
Value Butter Production (USD/day) 1,002,133 32,503
Productivity Beans (Ton/day) 1,021 290
Productivity Butter (Ton/day) 199 57
Total CO2 Emission [KG](3 months) 956 11
Total NO2 Emission [KG] (3 months) 17.75 0.21
Source: Author (2018).
The results show that since half of the beans now are converted to butter, the productivity of butter is increased. It
is noticeable that beans productivity also increases a bit in comparison with the base case scenario. This is another
interesting result that requires further investigation. The most remarkable result is that despite the butter value
production is increased, with the reduction of value in Beans production, the combined average productivity value
is decreased in comparison with the base case. This might be due to the market value and also because in the
simulation model other side products such as Cocoa oil or secondary products were not considered.
Scenario VI. Impact of Investment in road infrastructure and Butter production
This scenario explores the situation of investing in improving the road infrastructure and increasing the butter
production. This scenario again provides better results than the base case scenario, but as the results show it is
not the best configuration for improving the performance indicators of the system. The following tables show the
characteristics and results for this scenario.
Table 5.18 Scenario VI Characteristics
Parameter Value
Speed Primary Road Triangular (40,50,60) km/hr
Speed Secondary Road Triangular (40,50,60) km/hr
Speed Tertiary Road Triangular (40,50,60) km/hr
Checkpoint probability 0.1
Checkpoint times regular truck Triangular (1, 2, 3 ) hrs
Checkpoint times heavy truck Triangular (5, 10 , 15 ) mins
Percentage of Grinding 50%
Source: Author (2018).
Table 5.19 Results
Parameter Average Value Standard Distribution
Value Beans Production (USD/day) 2,048,255 47562
Value Butter Production (USD/day) 999873 34182
Productivity Beans (Ton/day) 959 317
The next table present the results of this scenario.
Table 5.15 Results
Parameter Average Value Standard Distribution
Value Beans Production (USD/day) 2,353,241 54,509
Value Butter Production (USD/day) 869,877 21,440
Productivity Beans (Ton/day) 1,262 251
Productivity Butter (Ton/day) 186 36
Total CO2 Emission [KG](3 months) 1,036 13
Total NO2 Emission [KG] (3 months) 19.25 0.25
Source: Author (2018).
As it was expected, with this scenario, the values increased as well. However, it is noticeable that on the contrary as
to what was expected, the combination of reducing the checkpoint values and investing in improving the secondary
and tertiary roads does not produce a higher value than the one from only reducing the checkpoint probability. The
standard distributions are also similar; thus, it is an interesting result that needs to be further investigated.
Scenario V. Impact of investment in producing more butter than Cocoa
It is also known that the Cocoa butter has more value in the market than the Cocoa beans. For that reason, this
scenario investigates what the impact would be if the butter percentage is increased by diverting more production
to the grinders. This scenario assumes that the grinders have enough capacity to process the beans and that 20% of
the mass of the beans is transformed into butter. Again, as with the previous scenarios, the experiment consisted of
30 replications of 12 weeks. The characteristics and results are presented in the following tables.
Table 5.16 Scenario V Characteristics
Parameter Value
Speed Primary Road Triangular (40,50,60) km/hr
Speed Secondary Road Triangular (20,30,40) km/hr
Speed Tertiary Road Triangular (10,15,20) km/hr
Checkpoint probability 0.1
Checkpoint times regular truck Triangular (1, 2, 3 ) hrs
Checkpoint times heavy truck Triangular (5, 10, 15) mins
Percentage of Grinding 50%
Source: Author (2018).
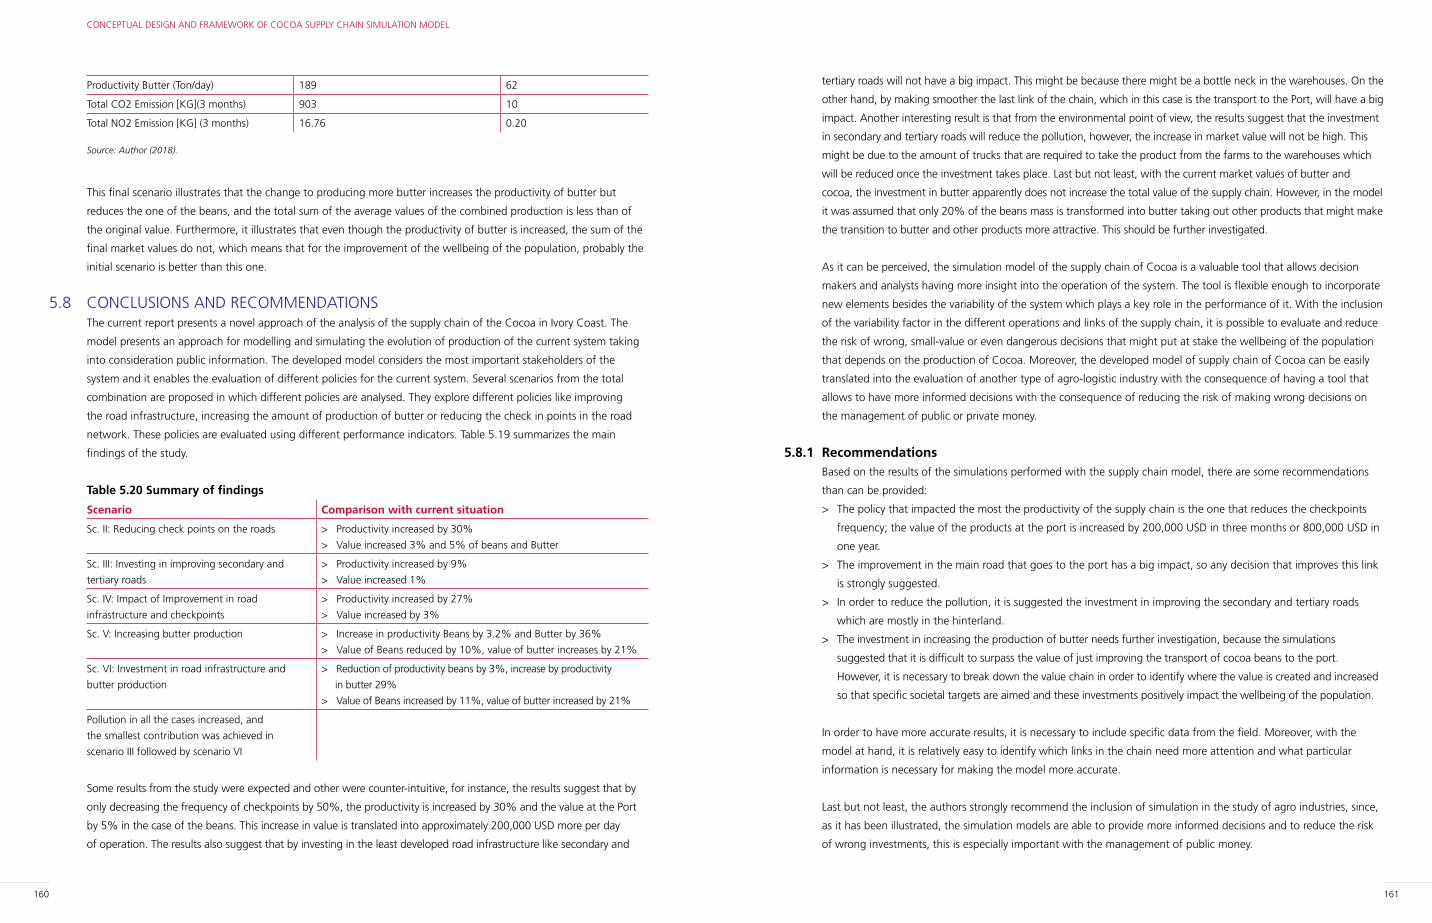
160 161
CONCEPTUAL DESIGN AND FRAMEWORK OF COCOA SUPPLY CHAIN SIMULATION MODEL
tertiary roads will not have a big impact. This might be because there might be a bottle neck in the warehouses. On the
other hand, by making smoother the last link of the chain, which in this case is the transport to the Port, will have a big
impact. Another interesting result is that from the environmental point of view, the results suggest that the investment
in secondary and tertiary roads will reduce the pollution, however, the increase in market value will not be high. This
might be due to the amount of trucks that are required to take the product from the farms to the warehouses which
will be reduced once the investment takes place. Last but not least, with the current market values of butter and
cocoa, the investment in butter apparently does not increase the total value of the supply chain. However, in the model
it was assumed that only 20% of the beans mass is transformed into butter taking out other products that might make
the transition to butter and other products more attractive. This should be further investigated.
As it can be perceived, the simulation model of the supply chain of Cocoa is a valuable tool that allows decision
makers and analysts having more insight into the operation of the system. The tool is flexible enough to incorporate
new elements besides the variability of the system which plays a key role in the performance of it. With the inclusion
of the variability factor in the different operations and links of the supply chain, it is possible to evaluate and reduce
the risk of wrong, small-value or even dangerous decisions that might put at stake the wellbeing of the population
that depends on the production of Cocoa. Moreover, the developed model of supply chain of Cocoa can be easily
translated into the evaluation of another type of agro-logistic industry with the consequence of having a tool that
allows to have more informed decisions with the consequence of reducing the risk of making wrong decisions on
the management of public or private money.
5.8.1 RecommendationsBased on the results of the simulations performed with the supply chain model, there are some recommendations
than can be provided:
> The policy that impacted the most the productivity of the supply chain is the one that reduces the checkpoints
frequency; the value of the products at the port is increased by 200,000 USD in three months or 800,000 USD in
one year.
> The improvement in the main road that goes to the port has a big impact, so any decision that improves this link
is strongly suggested.
> In order to reduce the pollution, it is suggested the investment in improving the secondary and tertiary roads
which are mostly in the hinterland.
> The investment in increasing the production of butter needs further investigation, because the simulations
suggested that it is difficult to surpass the value of just improving the transport of cocoa beans to the port.
However, it is necessary to break down the value chain in order to identify where the value is created and increased
so that specific societal targets are aimed and these investments positively impact the wellbeing of the population.
In order to have more accurate results, it is necessary to include specific data from the field. Moreover, with the
model at hand, it is relatively easy to identify which links in the chain need more attention and what particular
information is necessary for making the model more accurate.
Last but not least, the authors strongly recommend the inclusion of simulation in the study of agro industries, since,
as it has been illustrated, the simulation models are able to provide more informed decisions and to reduce the risk
of wrong investments, this is especially important with the management of public money.
Productivity Butter (Ton/day) 189 62
Total CO2 Emission [KG](3 months) 903 10
Total NO2 Emission [KG] (3 months) 16.76 0.20
Source: Author (2018).
This final scenario illustrates that the change to producing more butter increases the productivity of butter but
reduces the one of the beans, and the total sum of the average values of the combined production is less than of
the original value. Furthermore, it illustrates that even though the productivity of butter is increased, the sum of the
final market values do not, which means that for the improvement of the wellbeing of the population, probably the
initial scenario is better than this one.
5.8 CONCLUSIONS AND RECOMMENDATIONSThe current report presents a novel approach of the analysis of the supply chain of the Cocoa in Ivory Coast. The
model presents an approach for modelling and simulating the evolution of production of the current system taking
into consideration public information. The developed model considers the most important stakeholders of the
system and it enables the evaluation of different policies for the current system. Several scenarios from the total
combination are proposed in which different policies are analysed. They explore different policies like improving
the road infrastructure, increasing the amount of production of butter or reducing the check in points in the road
network. These policies are evaluated using different performance indicators. Table 5.19 summarizes the main
findings of the study.
Table 5.20 Summary of findings
Scenario Comparison with current situation
Sc. II: Reducing check points on the roads > Productivity increased by 30%
> Value increased 3% and 5% of beans and Butter
Sc. III: Investing in improving secondary and
tertiary roads
> Productivity increased by 9%
> Value increased 1%
Sc. IV: Impact of Improvement in road
infrastructure and checkpoints
> Productivity increased by 27%
> Value increased by 3%
Sc. V: Increasing butter production > Increase in productivity Beans by 3.2% and Butter by 36%
> Value of Beans reduced by 10%, value of butter increases by 21%
Sc. VI: Investment in road infrastructure and
butter production
> Reduction of productivity beans by 3%, increase by productivity
in butter 29%
> Value of Beans increased by 11%, value of butter increased by 21%
Pollution in all the cases increased, and
the smallest contribution was achieved in
scenario III followed by scenario VI
Some results from the study were expected and other were counter-intuitive, for instance, the results suggest that by
only decreasing the frequency of checkpoints by 50%, the productivity is increased by 30% and the value at the Port
by 5% in the case of the beans. This increase in value is translated into approximately 200,000 USD more per day
of operation. The results also suggest that by investing in the least developed road infrastructure like secondary and
162 163
SERIOUS GAMING FOR SUSTAINABLE LOGISTICS, SUPPLY CHAIN AND PORT DEVELOPMENT SAN PEDRO
6
6. SERIOUS GAMING FOR SUSTAINABLE LOGISTICS, SUPPLY CHAIN AND PORT DEVELOPMENT SAN PEDRO
6.1 INTRODUCTION AND CONCEPT To aid the discussions at institutional level (authorities, policy makers, NGOs, and private companies) and create
better awareness, we have developed the application of the gaming and training tool “Port of the Future” (PoF)
(see below). Similar tools have been successfully utilised by Deltares in earlier and ongoing green port and supply
chain projects and has proved to be an effective communication and consultative tool. The gaming tool aids the
better perception of the cause-effect relations (with regard to the impact pathways) that may be abstract and not
easy to perceive by some stakeholders. The gaming tool gives the participants an introduction to create support
and awareness with a port development where the new growth paradigm is needed that can promote economic
development, but which at the same time ensures climatic and environmental sustainability. Gaming sessions will be
arranged in form of workshops with group discussions with specific tasks and outputs.
6.1.1 The Port of the Future gaming and training toolThe Port of the Future strategic planning tool makes use of 10 basic steps as illustrated by Figure 6.1, in which
different aspects of the participation and consultation process are tackled. During the process awareness on social
and environmental aspects are conveyed towards stakeholders in order to create an equal understanding amongst
the stakeholders on the social and environmental impact of future interventions that are part of the development
strategy.
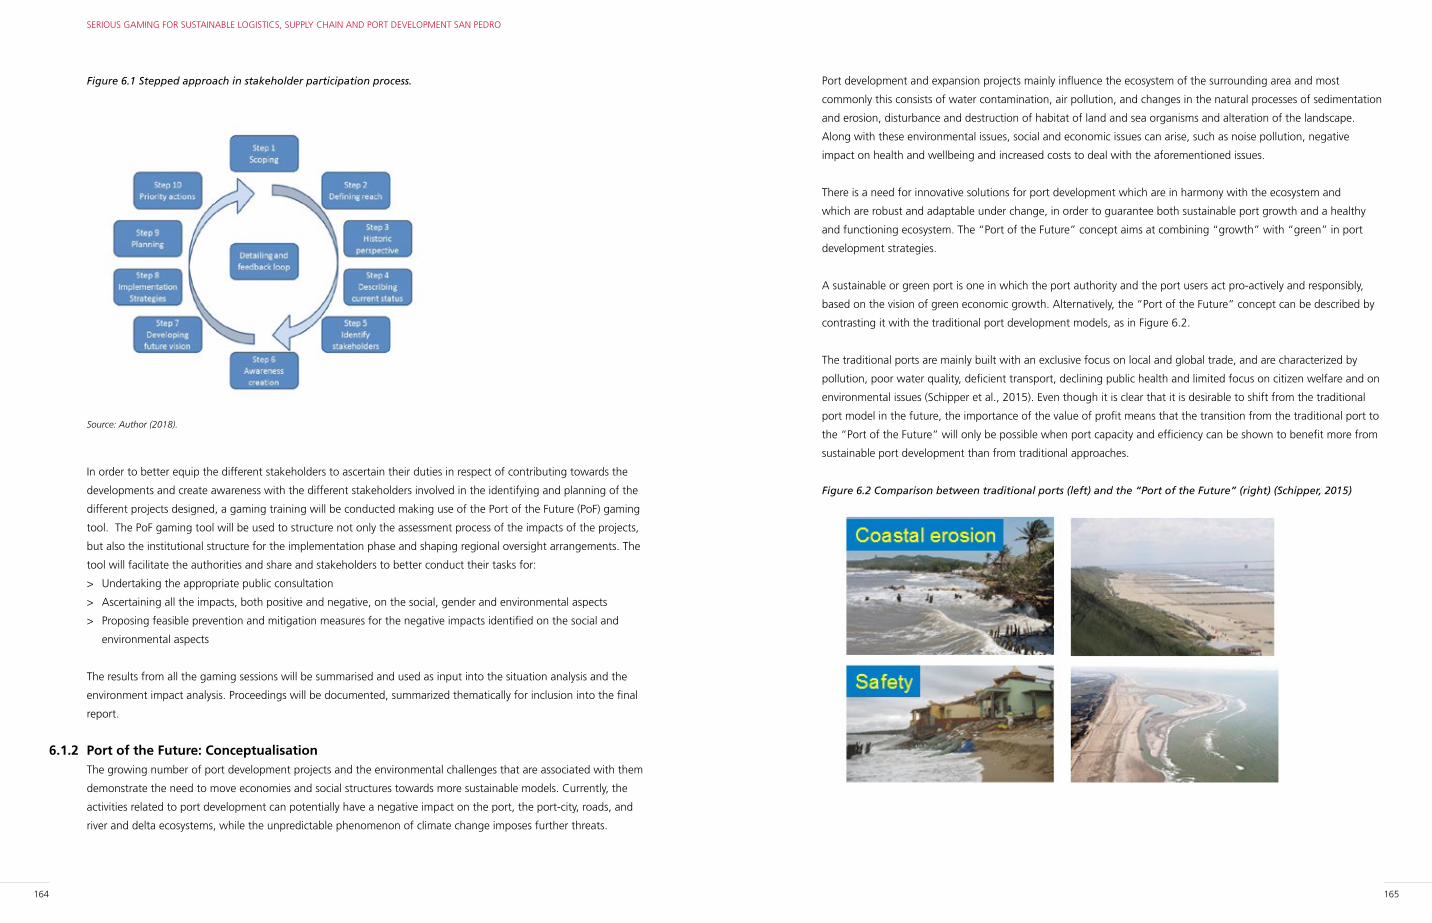
164 165
SERIOUS GAMING FOR SUSTAINABLE LOGISTICS, SUPPLY CHAIN AND PORT DEVELOPMENT SAN PEDRO
Port development and expansion projects mainly influence the ecosystem of the surrounding area and most
commonly this consists of water contamination, air pollution, and changes in the natural processes of sedimentation
and erosion, disturbance and destruction of habitat of land and sea organisms and alteration of the landscape.
Along with these environmental issues, social and economic issues can arise, such as noise pollution, negative
impact on health and wellbeing and increased costs to deal with the aforementioned issues.
There is a need for innovative solutions for port development which are in harmony with the ecosystem and
which are robust and adaptable under change, in order to guarantee both sustainable port growth and a healthy
and functioning ecosystem. The “Port of the Future” concept aims at combining “growth” with “green” in port
development strategies.
A sustainable or green port is one in which the port authority and the port users act pro-actively and responsibly,
based on the vision of green economic growth. Alternatively, the “Port of the Future” concept can be described by
contrasting it with the traditional port development models, as in Figure 6.2.
The traditional ports are mainly built with an exclusive focus on local and global trade, and are characterized by
pollution, poor water quality, deficient transport, declining public health and limited focus on citizen welfare and on
environmental issues (Schipper et al., 2015). Even though it is clear that it is desirable to shift from the traditional
port model in the future, the importance of the value of profit means that the transition from the traditional port to
the “Port of the Future” will only be possible when port capacity and efficiency can be shown to benefit more from
sustainable port development than from traditional approaches.
Figure 6.2 Comparison between traditional ports (left) and the “Port of the Future” (right) (Schipper, 2015)
Figure 6.1 Stepped approach in stakeholder participation process.
Source: Author (2018).
In order to better equip the different stakeholders to ascertain their duties in respect of contributing towards the
developments and create awareness with the different stakeholders involved in the identifying and planning of the
different projects designed, a gaming training will be conducted making use of the Port of the Future (PoF) gaming
tool. The PoF gaming tool will be used to structure not only the assessment process of the impacts of the projects,
but also the institutional structure for the implementation phase and shaping regional oversight arrangements. The
tool will facilitate the authorities and share and stakeholders to better conduct their tasks for:
> Undertaking the appropriate public consultation
> Ascertaining all the impacts, both positive and negative, on the social, gender and environmental aspects
> Proposing feasible prevention and mitigation measures for the negative impacts identified on the social and
environmental aspects
The results from all the gaming sessions will be summarised and used as input into the situation analysis and the
environment impact analysis. Proceedings will be documented, summarized thematically for inclusion into the final
report.
6.1.2 Port of the Future: ConceptualisationThe growing number of port development projects and the environmental challenges that are associated with them
demonstrate the need to move economies and social structures towards more sustainable models. Currently, the
activities related to port development can potentially have a negative impact on the port, the port-city, roads, and
river and delta ecosystems, while the unpredictable phenomenon of climate change imposes further threats.
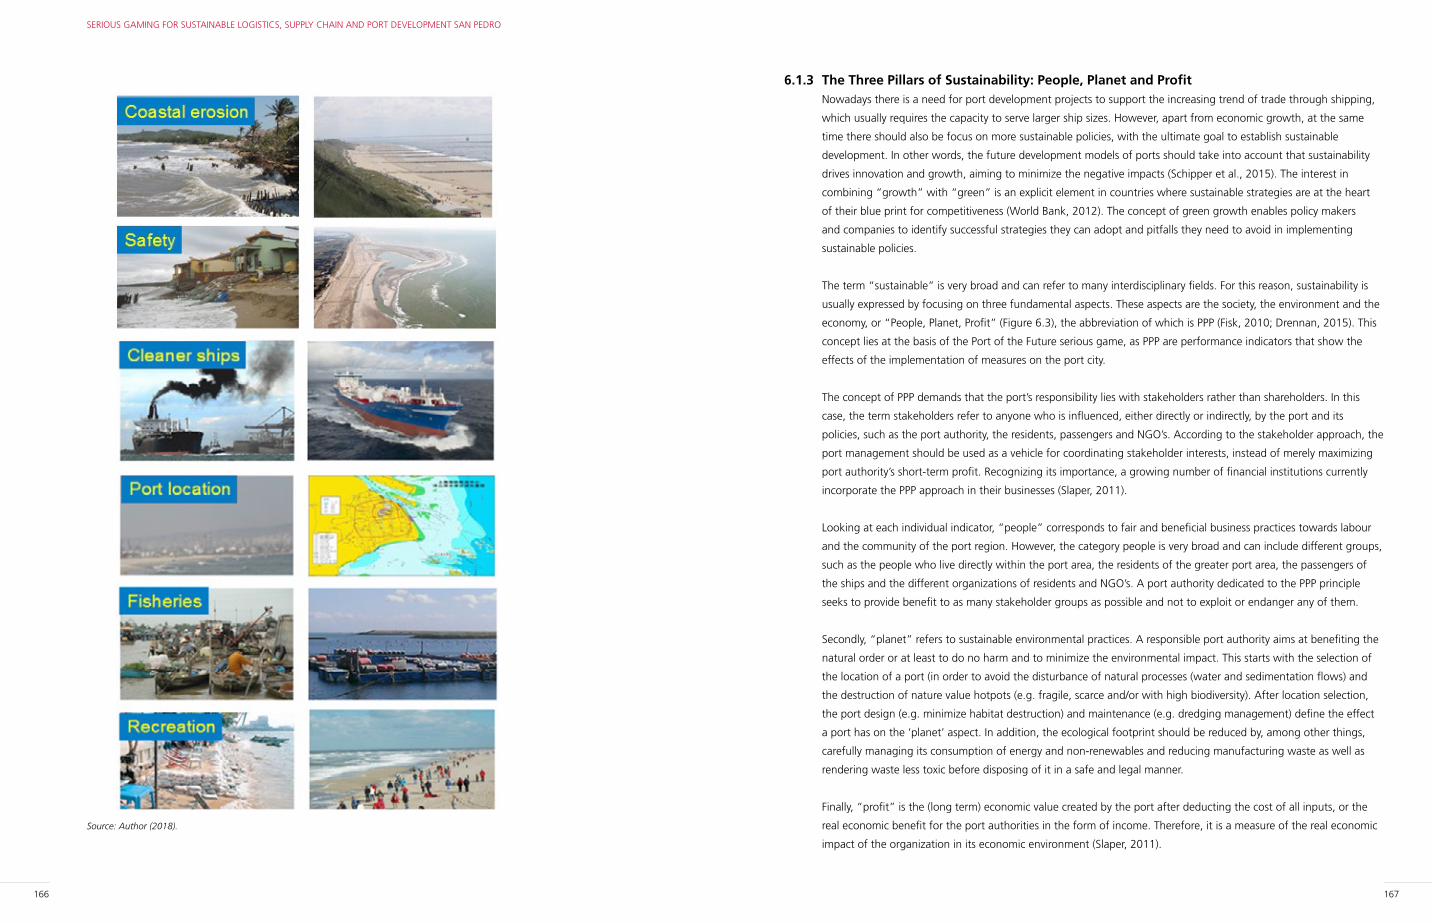
166 167
SERIOUS GAMING FOR SUSTAINABLE LOGISTICS, SUPPLY CHAIN AND PORT DEVELOPMENT SAN PEDRO
6.1.3 The Three Pillars of Sustainability: People, Planet and ProfitNowadays there is a need for port development projects to support the increasing trend of trade through shipping,
which usually requires the capacity to serve larger ship sizes. However, apart from economic growth, at the same
time there should also be focus on more sustainable policies, with the ultimate goal to establish sustainable
development. In other words, the future development models of ports should take into account that sustainability
drives innovation and growth, aiming to minimize the negative impacts (Schipper et al., 2015). The interest in
combining “growth” with “green” is an explicit element in countries where sustainable strategies are at the heart
of their blue print for competitiveness (World Bank, 2012). The concept of green growth enables policy makers
and companies to identify successful strategies they can adopt and pitfalls they need to avoid in implementing
sustainable policies.
The term “sustainable” is very broad and can refer to many interdisciplinary fields. For this reason, sustainability is
usually expressed by focusing on three fundamental aspects. These aspects are the society, the environment and the
economy, or “People, Planet, Profit” (Figure 6.3), the abbreviation of which is PPP (Fisk, 2010; Drennan, 2015). This
concept lies at the basis of the Port of the Future serious game, as PPP are performance indicators that show the
effects of the implementation of measures on the port city.
The concept of PPP demands that the port’s responsibility lies with stakeholders rather than shareholders. In this
case, the term stakeholders refer to anyone who is influenced, either directly or indirectly, by the port and its
policies, such as the port authority, the residents, passengers and NGO’s. According to the stakeholder approach, the
port management should be used as a vehicle for coordinating stakeholder interests, instead of merely maximizing
port authority’s short-term profit. Recognizing its importance, a growing number of financial institutions currently
incorporate the PPP approach in their businesses (Slaper, 2011).
Looking at each individual indicator, “people” corresponds to fair and beneficial business practices towards labour
and the community of the port region. However, the category people is very broad and can include different groups,
such as the people who live directly within the port area, the residents of the greater port area, the passengers of
the ships and the different organizations of residents and NGO’s. A port authority dedicated to the PPP principle
seeks to provide benefit to as many stakeholder groups as possible and not to exploit or endanger any of them.
Secondly, “planet” refers to sustainable environmental practices. A responsible port authority aims at benefiting the
natural order or at least to do no harm and to minimize the environmental impact. This starts with the selection of
the location of a port (in order to avoid the disturbance of natural processes (water and sedimentation flows) and
the destruction of nature value hotpots (e.g. fragile, scarce and/or with high biodiversity). After location selection,
the port design (e.g. minimize habitat destruction) and maintenance (e.g. dredging management) define the effect
a port has on the ‘planet’ aspect. In addition, the ecological footprint should be reduced by, among other things,
carefully managing its consumption of energy and non-renewables and reducing manufacturing waste as well as
rendering waste less toxic before disposing of it in a safe and legal manner.
Finally, “profit” is the (long term) economic value created by the port after deducting the cost of all inputs, or the
real economic benefit for the port authorities in the form of income. Therefore, it is a measure of the real economic
impact of the organization in its economic environment (Slaper, 2011).
Source: Author (2018).
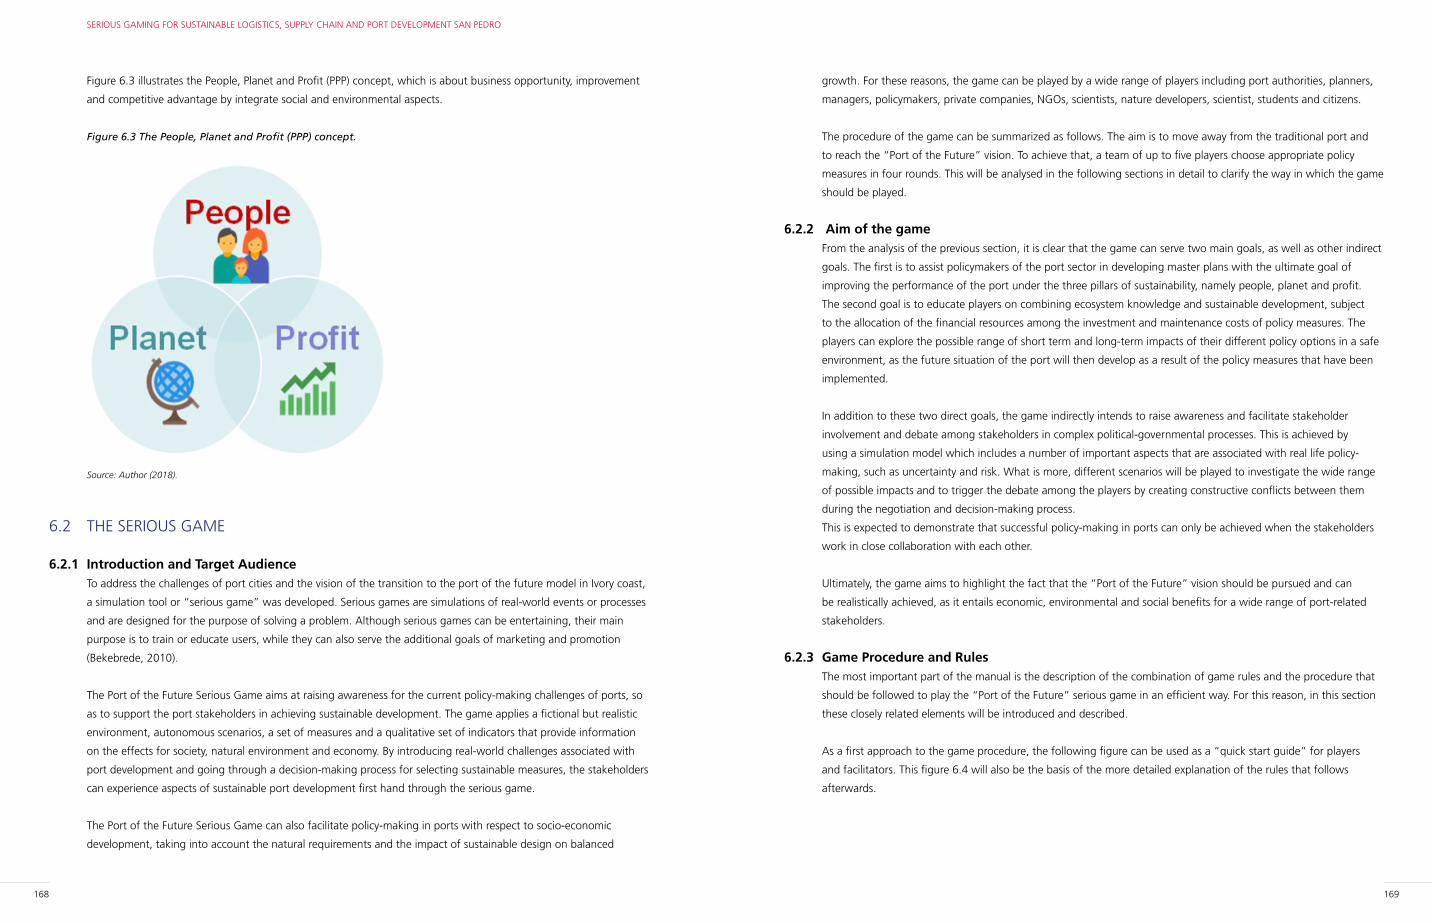
168 169
SERIOUS GAMING FOR SUSTAINABLE LOGISTICS, SUPPLY CHAIN AND PORT DEVELOPMENT SAN PEDRO
growth. For these reasons, the game can be played by a wide range of players including port authorities, planners,
managers, policymakers, private companies, NGOs, scientists, nature developers, scientist, students and citizens.
The procedure of the game can be summarized as follows. The aim is to move away from the traditional port and
to reach the “Port of the Future” vision. To achieve that, a team of up to five players choose appropriate policy
measures in four rounds. This will be analysed in the following sections in detail to clarify the way in which the game
should be played.
6.2.2 Aim of the gameFrom the analysis of the previous section, it is clear that the game can serve two main goals, as well as other indirect
goals. The first is to assist policymakers of the port sector in developing master plans with the ultimate goal of
improving the performance of the port under the three pillars of sustainability, namely people, planet and profit.
The second goal is to educate players on combining ecosystem knowledge and sustainable development, subject
to the allocation of the financial resources among the investment and maintenance costs of policy measures. The
players can explore the possible range of short term and long-term impacts of their different policy options in a safe
environment, as the future situation of the port will then develop as a result of the policy measures that have been
implemented.
In addition to these two direct goals, the game indirectly intends to raise awareness and facilitate stakeholder
involvement and debate among stakeholders in complex political-governmental processes. This is achieved by
using a simulation model which includes a number of important aspects that are associated with real life policy-
making, such as uncertainty and risk. What is more, different scenarios will be played to investigate the wide range
of possible impacts and to trigger the debate among the players by creating constructive conflicts between them
during the negotiation and decision-making process.
This is expected to demonstrate that successful policy-making in ports can only be achieved when the stakeholders
work in close collaboration with each other.
Ultimately, the game aims to highlight the fact that the “Port of the Future” vision should be pursued and can
be realistically achieved, as it entails economic, environmental and social benefits for a wide range of port-related
stakeholders.
6.2.3 Game Procedure and Rules The most important part of the manual is the description of the combination of game rules and the procedure that
should be followed to play the “Port of the Future” serious game in an efficient way. For this reason, in this section
these closely related elements will be introduced and described.
As a first approach to the game procedure, the following figure can be used as a “quick start guide” for players
and facilitators. This figure 6.4 will also be the basis of the more detailed explanation of the rules that follows
afterwards.
Figure 6.3 illustrates the People, Planet and Profit (PPP) concept, which is about business opportunity, improvement
and competitive advantage by integrate social and environmental aspects.
Figure 6.3 The People, Planet and Profit (PPP) concept.
Source: Author (2018).
6.2 THE SERIOUS GAME
6.2.1 Introduction and Target AudienceTo address the challenges of port cities and the vision of the transition to the port of the future model in Ivory coast,
a simulation tool or “serious game” was developed. Serious games are simulations of real-world events or processes
and are designed for the purpose of solving a problem. Although serious games can be entertaining, their main
purpose is to train or educate users, while they can also serve the additional goals of marketing and promotion
(Bekebrede, 2010).
The Port of the Future Serious Game aims at raising awareness for the current policy-making challenges of ports, so
as to support the port stakeholders in achieving sustainable development. The game applies a fictional but realistic
environment, autonomous scenarios, a set of measures and a qualitative set of indicators that provide information
on the effects for society, natural environment and economy. By introducing real-world challenges associated with
port development and going through a decision-making process for selecting sustainable measures, the stakeholders
can experience aspects of sustainable port development first hand through the serious game.
The Port of the Future Serious Game can also facilitate policy-making in ports with respect to socio-economic
development, taking into account the natural requirements and the impact of sustainable design on balanced
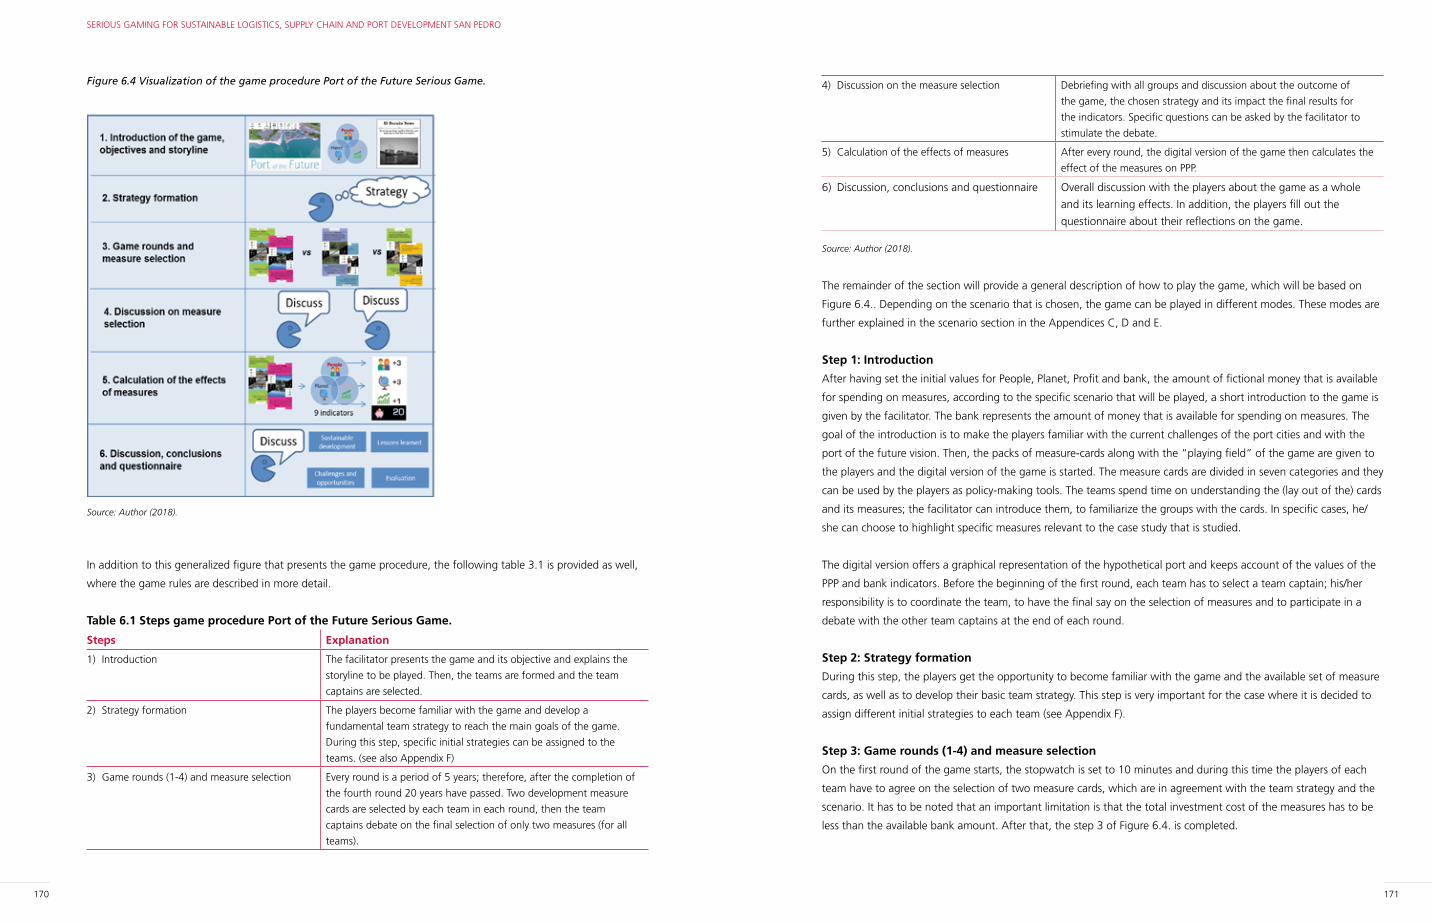
170 171
SERIOUS GAMING FOR SUSTAINABLE LOGISTICS, SUPPLY CHAIN AND PORT DEVELOPMENT SAN PEDRO
4) Discussion on the measure selection Debriefing with all groups and discussion about the outcome of
the game, the chosen strategy and its impact the final results for
the indicators. Specific questions can be asked by the facilitator to
stimulate the debate.
5) Calculation of the effects of measures After every round, the digital version of the game then calculates the
effect of the measures on PPP.
6) Discussion, conclusions and questionnaire Overall discussion with the players about the game as a whole
and its learning effects. In addition, the players fill out the
questionnaire about their reflections on the game.
Source: Author (2018).
The remainder of the section will provide a general description of how to play the game, which will be based on
Figure 6.4.. Depending on the scenario that is chosen, the game can be played in different modes. These modes are
further explained in the scenario section in the Appendices C, D and E.
Step 1: Introduction
After having set the initial values for People, Planet, Profit and bank, the amount of fictional money that is available
for spending on measures, according to the specific scenario that will be played, a short introduction to the game is
given by the facilitator. The bank represents the amount of money that is available for spending on measures. The
goal of the introduction is to make the players familiar with the current challenges of the port cities and with the
port of the future vision. Then, the packs of measure-cards along with the “playing field” of the game are given to
the players and the digital version of the game is started. The measure cards are divided in seven categories and they
can be used by the players as policy-making tools. The teams spend time on understanding the (lay out of the) cards
and its measures; the facilitator can introduce them, to familiarize the groups with the cards. In specific cases, he/
she can choose to highlight specific measures relevant to the case study that is studied.
The digital version offers a graphical representation of the hypothetical port and keeps account of the values of the
PPP and bank indicators. Before the beginning of the first round, each team has to select a team captain; his/her
responsibility is to coordinate the team, to have the final say on the selection of measures and to participate in a
debate with the other team captains at the end of each round.
Step 2: Strategy formation
During this step, the players get the opportunity to become familiar with the game and the available set of measure
cards, as well as to develop their basic team strategy. This step is very important for the case where it is decided to
assign different initial strategies to each team (see Appendix F).
Step 3: Game rounds (1-4) and measure selection
On the first round of the game starts, the stopwatch is set to 10 minutes and during this time the players of each
team have to agree on the selection of two measure cards, which are in agreement with the team strategy and the
scenario. It has to be noted that an important limitation is that the total investment cost of the measures has to be
less than the available bank amount. After that, the step 3 of Figure 6.4. is completed.
Figure 6.4 Visualization of the game procedure Port of the Future Serious Game.
Source: Author (2018).
In addition to this generalized figure that presents the game procedure, the following table 3.1 is provided as well,
where the game rules are described in more detail.
Table 6.1 Steps game procedure Port of the Future Serious Game.
Steps Explanation
1) Introduction The facilitator presents the game and its objective and explains the
storyline to be played. Then, the teams are formed and the team
captains are selected.
2) Strategy formation The players become familiar with the game and develop a
fundamental team strategy to reach the main goals of the game.
During this step, specific initial strategies can be assigned to the
teams. (see also Appendix F)
3) Game rounds (1-4) and measure selection Every round is a period of 5 years; therefore, after the completion of
the fourth round 20 years have passed. Two development measure
cards are selected by each team in each round, then the team
captains debate on the final selection of only two measures (for all
teams).
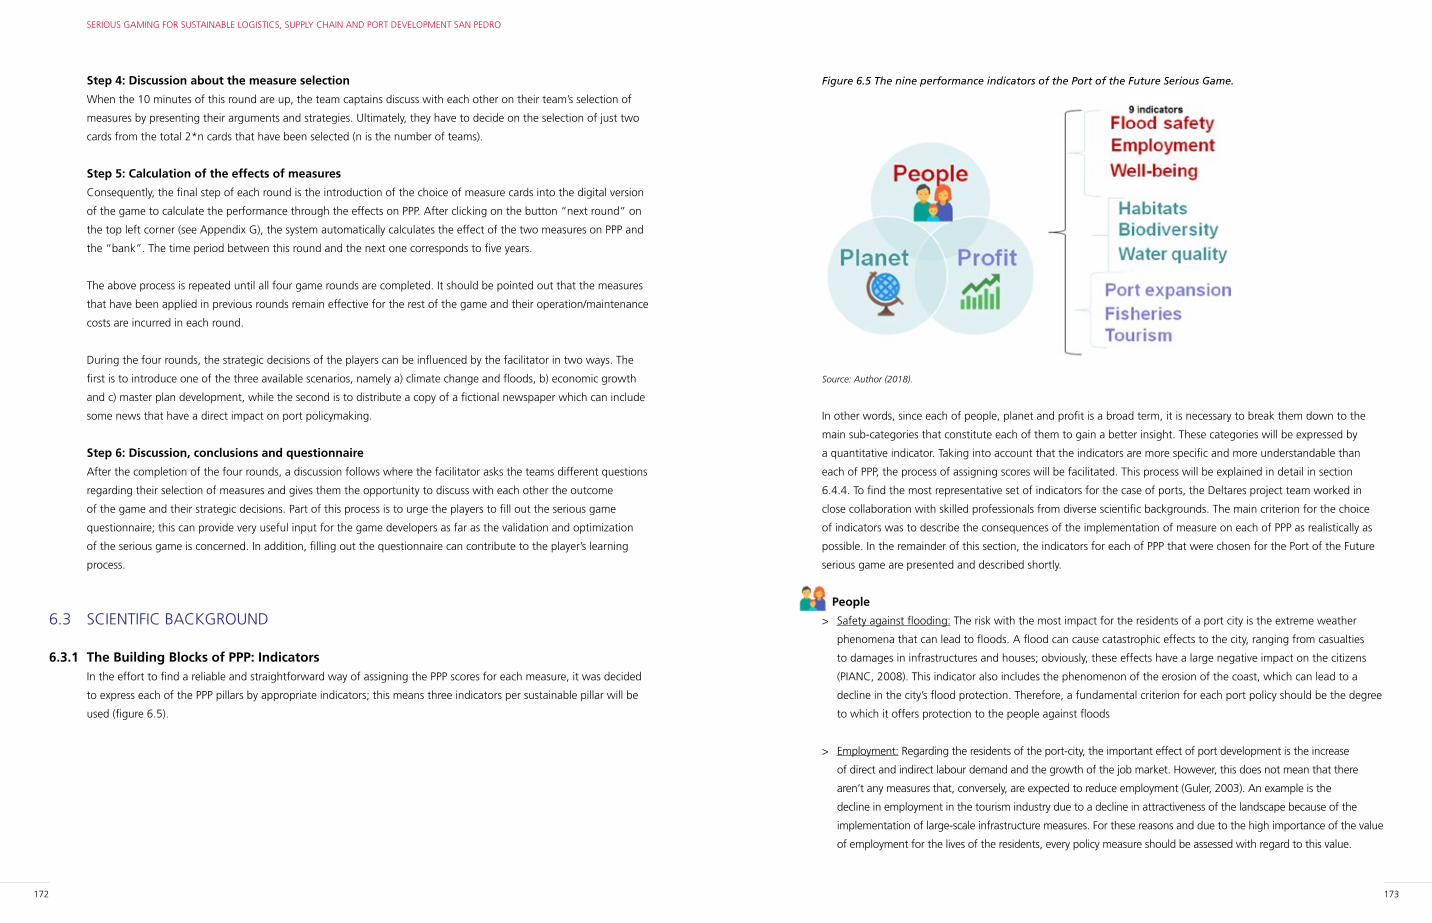
172 173
SERIOUS GAMING FOR SUSTAINABLE LOGISTICS, SUPPLY CHAIN AND PORT DEVELOPMENT SAN PEDRO
Figure 6.5 The nine performance indicators of the Port of the Future Serious Game.
Source: Author (2018).
In other words, since each of people, planet and profit is a broad term, it is necessary to break them down to the
main sub-categories that constitute each of them to gain a better insight. These categories will be expressed by
a quantitative indicator. Taking into account that the indicators are more specific and more understandable than
each of PPP, the process of assigning scores will be facilitated. This process will be explained in detail in section
6.4.4. To find the most representative set of indicators for the case of ports, the Deltares project team worked in
close collaboration with skilled professionals from diverse scientific backgrounds. The main criterion for the choice
of indicators was to describe the consequences of the implementation of measure on each of PPP as realistically as
possible. In the remainder of this section, the indicators for each of PPP that were chosen for the Port of the Future
serious game are presented and described shortly.
People
> Safety against flooding: The risk with the most impact for the residents of a port city is the extreme weather
phenomena that can lead to floods. A flood can cause catastrophic effects to the city, ranging from casualties
to damages in infrastructures and houses; obviously, these effects have a large negative impact on the citizens
(PIANC, 2008). This indicator also includes the phenomenon of the erosion of the coast, which can lead to a
decline in the city’s flood protection. Therefore, a fundamental criterion for each port policy should be the degree
to which it offers protection to the people against floods
> Employment: Regarding the residents of the port-city, the important effect of port development is the increase
of direct and indirect labour demand and the growth of the job market. However, this does not mean that there
aren’t any measures that, conversely, are expected to reduce employment (Guler, 2003). An example is the
decline in employment in the tourism industry due to a decline in attractiveness of the landscape because of the
implementation of large-scale infrastructure measures. For these reasons and due to the high importance of the value
of employment for the lives of the residents, every policy measure should be assessed with regard to this value.
Step 4: Discussion about the measure selection
When the 10 minutes of this round are up, the team captains discuss with each other on their team’s selection of
measures by presenting their arguments and strategies. Ultimately, they have to decide on the selection of just two
cards from the total 2*n cards that have been selected (n is the number of teams).
Step 5: Calculation of the effects of measures
Consequently, the final step of each round is the introduction of the choice of measure cards into the digital version
of the game to calculate the performance through the effects on PPP. After clicking on the button “next round” on
the top left corner (see Appendix G), the system automatically calculates the effect of the two measures on PPP and
the “bank”. The time period between this round and the next one corresponds to five years.
The above process is repeated until all four game rounds are completed. It should be pointed out that the measures
that have been applied in previous rounds remain effective for the rest of the game and their operation/maintenance
costs are incurred in each round.
During the four rounds, the strategic decisions of the players can be influenced by the facilitator in two ways. The
first is to introduce one of the three available scenarios, namely a) climate change and floods, b) economic growth
and c) master plan development, while the second is to distribute a copy of a fictional newspaper which can include
some news that have a direct impact on port policymaking.
Step 6: Discussion, conclusions and questionnaire
After the completion of the four rounds, a discussion follows where the facilitator asks the teams different questions
regarding their selection of measures and gives them the opportunity to discuss with each other the outcome
of the game and their strategic decisions. Part of this process is to urge the players to fill out the serious game
questionnaire; this can provide very useful input for the game developers as far as the validation and optimization
of the serious game is concerned. In addition, filling out the questionnaire can contribute to the player’s learning
process.
6.3 SCIENTIFIC BACKGROUND
6.3.1 The Building Blocks of PPP: IndicatorsIn the effort to find a reliable and straightforward way of assigning the PPP scores for each measure, it was decided
to express each of the PPP pillars by appropriate indicators; this means three indicators per sustainable pillar will be
used (figure 6.5).
174 175
SERIOUS GAMING FOR SUSTAINABLE LOGISTICS, SUPPLY CHAIN AND PORT DEVELOPMENT SAN PEDRO
fishing industry, as they can influence the function of the marine, estuarine and coastal ecosystem and therefore
also the quality and output of fisheries (Lipcius et al., 2008).
> Tourism: There are a considerable number of port cities that are associated with the tourism industry, while some
of them are also hubs for cruises. Despite the seasonal trend of tourism, it can greatly contribute to the income
of the port and the surrounding area, as it is a large-scale and very profitable industry. Hence, it is obvious that
any discussion that is associated with the profit of a measure should take into account the impact it has on
tourism (UNEP, 2010).
> A final remark of this section is that the process of breaking down each of PPP into indicators is by no means
deterministic. A different group of experts may conclude that a different set of indicators can represent each of
PPP in a more realistic way. However, the aim of indicator selection in this game was to represent as effective as
possible the policy-making process in a fictional port. However, some ideas of alternative indicators that could be
used in another analysis are:
> People: Health, safety (not only against flooding)
> Planet: Air quality, amount of green spaces, coastal impact
> Profit: Cargo capacity, productivity, agriculture
6.3.2 Ecosystem ServicesRegarding the effort to improve the performance of the port as far as the three sustainability indicators are
concerned (PPP), one of the main goals of the game is to introduce “ecosystem-based management” into port-
related policy-making. The aim of this concept is to restore and protect the health and function of the entire
ecosystem for the benefit of all living organisms, recognizing the strong interactions between them. Closely related
to ecosystem-based management is the term called “ecosystem services”.
Coastal ecosystems can provide many different functions that intertwine and reinforce each other; proper
functioning of the coastal ecosystem can in turn deliver a wide range of services, such as shoreline stabilization,
water quality, food production, biodiversity and climate regulation that are important for people either directly
(e.g. food) or indirectly (e.g. climate regulation), see figure 6.6. The availability of these ecosystem services depends
on the proper functioning of coastal ecosystems (Schipper et al., 2015). Looking at the previous section where
the indicators are described, it can be seen that there is a close relationship between the ecosystem services and
the indicators. More specifically, The Port of the Future serious game focuses on these ecosystem services that are
affected by set of port development measures that are available in the game.
By contributing to the development of the “Port of the Future”, a port where the impact on the environment is
minimized, a major goal of the game is to protect and increase the availability of ecosystem services for the benefit
of humanity and of the ecosystem itself.
> Well-being: Well-being is a rather broad term which can contain a wide range of parameters that are
important for the everyday life of citizens, such as health, happiness, satisfaction and their social, economic
and psychological state. A high level of well-being means in some sense that the citizen’s overall experience
is positive, while low well-being is associated with negative impacts (Dasgupta, 1993). Well-being is a rather
important indicator due to the fact that it refers to many different categories and is not too specific; this way,
it gives the policymaker the freedom to quantify it according to different aspects of each measure and not
according to a single characteristic of it. To sum up, due to its importance and versatility, it was decided that well-
being is one of the main indicators to express the category “people” of PPP.
§ Planet
> Habitats: The large-scale nature of the majority of the measures means that there will be an inevitable effect
on the habitats of marine, estuarine, coastal and terrestrial living species; this in turn shows that there will be
direct consequences on the ecosystem (Sheaves, 2009). Therefore, a criterion for assessing the environmental
performance of each measure should be the degree to which it interferes with the natural habitats.
> Biodiversity: Biodiversity is another natural aspect that can be greatly affected by the port-related human
intervention, while it can be a major factor for the stability of the ecosystem. Pollution (noise, water, air), food
web alterations (e.g. due to exotic species, temperature changes, nutrient availability etc.), disturbances and
changes in the hydro-morphology (e.g. waves and shelter, sediment flows) might affect the living species and
this, in turn, can have negative consequences for the functioning of the ecosystem and for economic activities,
such as the fishing industry (see the indicators of profit) (Thrush & Dayton, 2002).
> Water quality: Port activities usually have an impact on water quality through the discharge of liquid as well as
solid pollutants. Taking into account the numerous negative effects of low-quality water on humans, a wide
range of living species and the ecosystem itself, it is obvious that the effect that each measure has on water
quality should be a criterion regarding the indicator “planet” (UNEP, 2010). However, it should be noted that
apart from negative effects, a slightly declining water quality can be beneficial for marine species as it increases
the availability of nutrients.
§ Profit
> Port Economic Growth: Clearly, the trade activities (storage, handling, transportation) are the main source of
economic growth for the port area. Since many other businesses in this area are associated directly or indirectly
with the port activities and since a large number of employees work in these businesses, it can be concluded that
the economic performance of the port is of great importance for the income of a very wide range of stakeholders
(Lam & Notteboom, 2012). For these reasons, the performance of each measure should be evaluated primarily by
the direct economic impact it has on the port.
> Fisheries: Depending on the geographical and hydrological characteristics of the region, fishing can have from a
minor to a major role in the economic activity of a port and its surrounding area. The human intervention on the
ecosystem might cause a decline in the output of the fishing industry, having a negative impact on the income of
the port city. Hence, the proposed measures should be assessed with regard to the impacts on the income of the
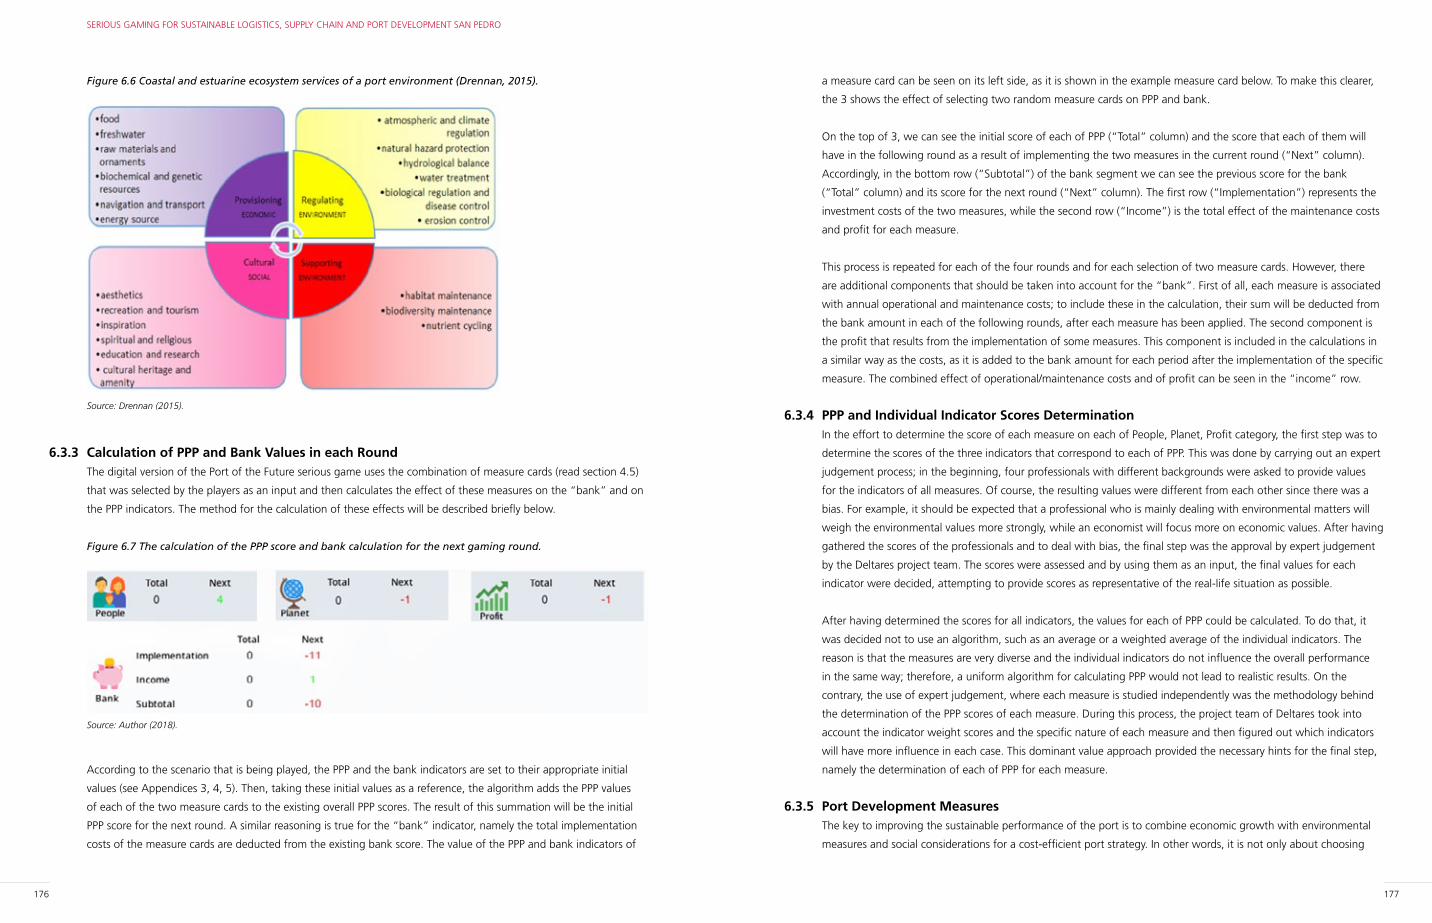
176 177
SERIOUS GAMING FOR SUSTAINABLE LOGISTICS, SUPPLY CHAIN AND PORT DEVELOPMENT SAN PEDRO
a measure card can be seen on its left side, as it is shown in the example measure card below. To make this clearer,
the 3 shows the effect of selecting two random measure cards on PPP and bank.
On the top of 3, we can see the initial score of each of PPP (“Total” column) and the score that each of them will
have in the following round as a result of implementing the two measures in the current round (“Next” column).
Accordingly, in the bottom row (“Subtotal”) of the bank segment we can see the previous score for the bank
(“Total” column) and its score for the next round (“Next” column). The first row (“Implementation”) represents the
investment costs of the two measures, while the second row (“Income”) is the total effect of the maintenance costs
and profit for each measure.
This process is repeated for each of the four rounds and for each selection of two measure cards. However, there
are additional components that should be taken into account for the “bank”. First of all, each measure is associated
with annual operational and maintenance costs; to include these in the calculation, their sum will be deducted from
the bank amount in each of the following rounds, after each measure has been applied. The second component is
the profit that results from the implementation of some measures. This component is included in the calculations in
a similar way as the costs, as it is added to the bank amount for each period after the implementation of the specific
measure. The combined effect of operational/maintenance costs and of profit can be seen in the “income” row.
6.3.4 PPP and Individual Indicator Scores DeterminationIn the effort to determine the score of each measure on each of People, Planet, Profit category, the first step was to
determine the scores of the three indicators that correspond to each of PPP. This was done by carrying out an expert
judgement process; in the beginning, four professionals with different backgrounds were asked to provide values
for the indicators of all measures. Of course, the resulting values were different from each other since there was a
bias. For example, it should be expected that a professional who is mainly dealing with environmental matters will
weigh the environmental values more strongly, while an economist will focus more on economic values. After having
gathered the scores of the professionals and to deal with bias, the final step was the approval by expert judgement
by the Deltares project team. The scores were assessed and by using them as an input, the final values for each
indicator were decided, attempting to provide scores as representative of the real-life situation as possible.
After having determined the scores for all indicators, the values for each of PPP could be calculated. To do that, it
was decided not to use an algorithm, such as an average or a weighted average of the individual indicators. The
reason is that the measures are very diverse and the individual indicators do not influence the overall performance
in the same way; therefore, a uniform algorithm for calculating PPP would not lead to realistic results. On the
contrary, the use of expert judgement, where each measure is studied independently was the methodology behind
the determination of the PPP scores of each measure. During this process, the project team of Deltares took into
account the indicator weight scores and the specific nature of each measure and then figured out which indicators
will have more influence in each case. This dominant value approach provided the necessary hints for the final step,
namely the determination of each of PPP for each measure.
6.3.5 Port Development MeasuresThe key to improving the sustainable performance of the port is to combine economic growth with environmental
measures and social considerations for a cost-efficient port strategy. In other words, it is not only about choosing
Figure 6.6 Coastal and estuarine ecosystem services of a port environment (Drennan, 2015).
Source: Drennan (2015).
6.3.3 Calculation of PPP and Bank Values in each Round The digital version of the Port of the Future serious game uses the combination of measure cards (read section 4.5)
that was selected by the players as an input and then calculates the effect of these measures on the “bank” and on
the PPP indicators. The method for the calculation of these effects will be described briefly below.
Figure 6.7 The calculation of the PPP score and bank calculation for the next gaming round.
Source: Author (2018).
According to the scenario that is being played, the PPP and the bank indicators are set to their appropriate initial
values (see Appendices 3, 4, 5). Then, taking these initial values as a reference, the algorithm adds the PPP values
of each of the two measure cards to the existing overall PPP scores. The result of this summation will be the initial
PPP score for the next round. A similar reasoning is true for the “bank” indicator, namely the total implementation
costs of the measure cards are deducted from the existing bank score. The value of the PPP and bank indicators of
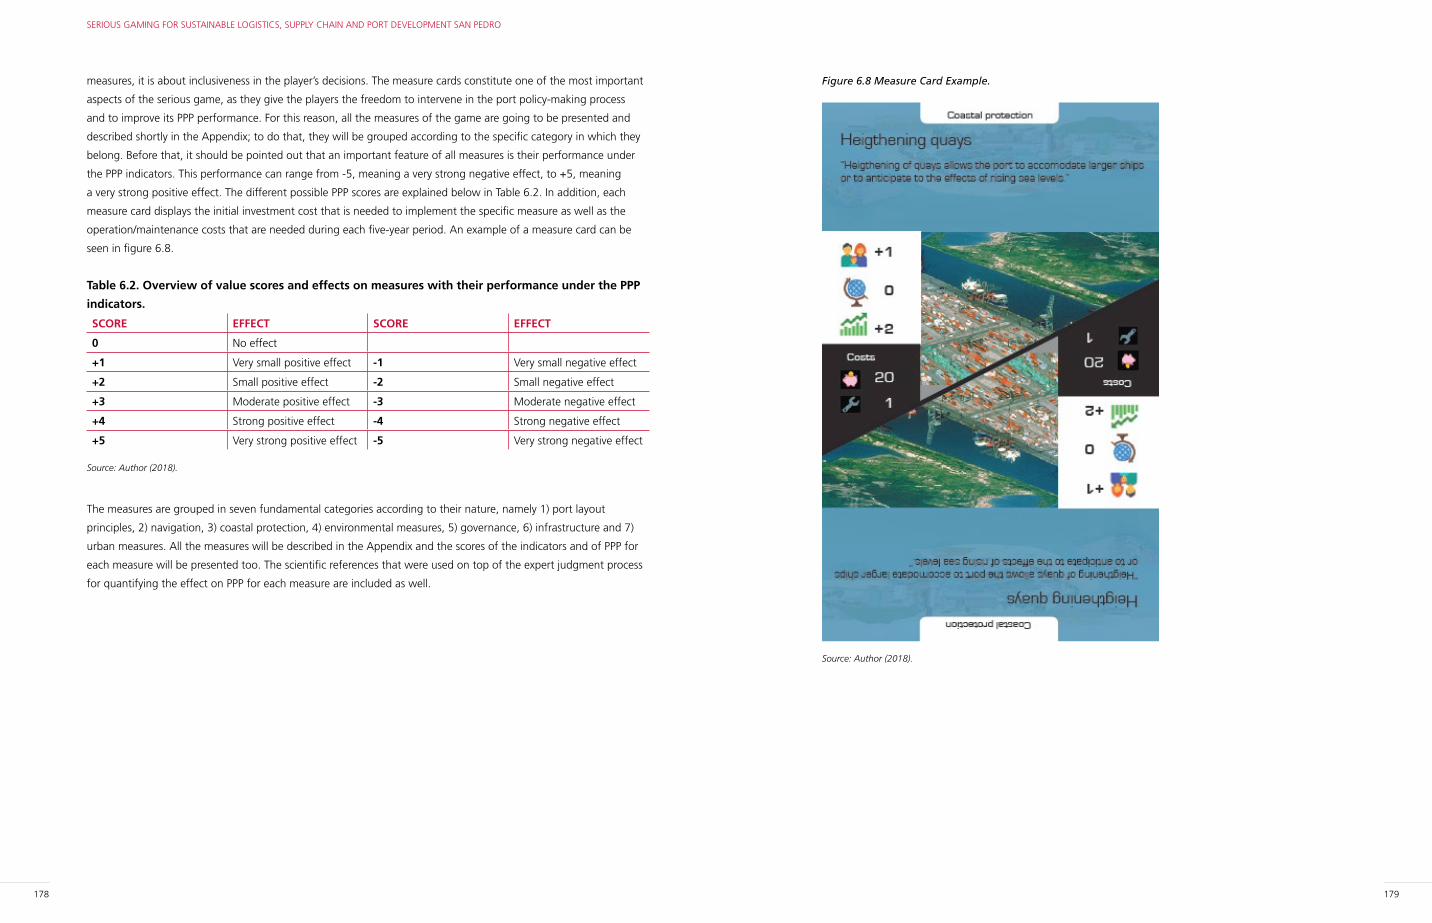
178 179
SERIOUS GAMING FOR SUSTAINABLE LOGISTICS, SUPPLY CHAIN AND PORT DEVELOPMENT SAN PEDRO
Figure 6.8 Measure Card Example.
Source: Author (2018).
measures, it is about inclusiveness in the player’s decisions. The measure cards constitute one of the most important
aspects of the serious game, as they give the players the freedom to intervene in the port policy-making process
and to improve its PPP performance. For this reason, all the measures of the game are going to be presented and
described shortly in the Appendix; to do that, they will be grouped according to the specific category in which they
belong. Before that, it should be pointed out that an important feature of all measures is their performance under
the PPP indicators. This performance can range from -5, meaning a very strong negative effect, to +5, meaning
a very strong positive effect. The different possible PPP scores are explained below in Table 6.2. In addition, each
measure card displays the initial investment cost that is needed to implement the specific measure as well as the
operation/maintenance costs that are needed during each five-year period. An example of a measure card can be
seen in figure 6.8.
Table 6.2. Overview of value scores and effects on measures with their performance under the PPP
indicators.
SCORE EFFECT SCORE EFFECT
0 No effect
+1 Very small positive effect -1 Very small negative effect
+2 Small positive effect -2 Small negative effect
+3 Moderate positive effect -3 Moderate negative effect
+4 Strong positive effect -4 Strong negative effect
+5 Very strong positive effect -5 Very strong negative effect
Source: Author (2018).
The measures are grouped in seven fundamental categories according to their nature, namely 1) port layout
principles, 2) navigation, 3) coastal protection, 4) environmental measures, 5) governance, 6) infrastructure and 7)
urban measures. All the measures will be described in the Appendix and the scores of the indicators and of PPP for
each measure will be presented too. The scientific references that were used on top of the expert judgment process
for quantifying the effect on PPP for each measure are included as well.
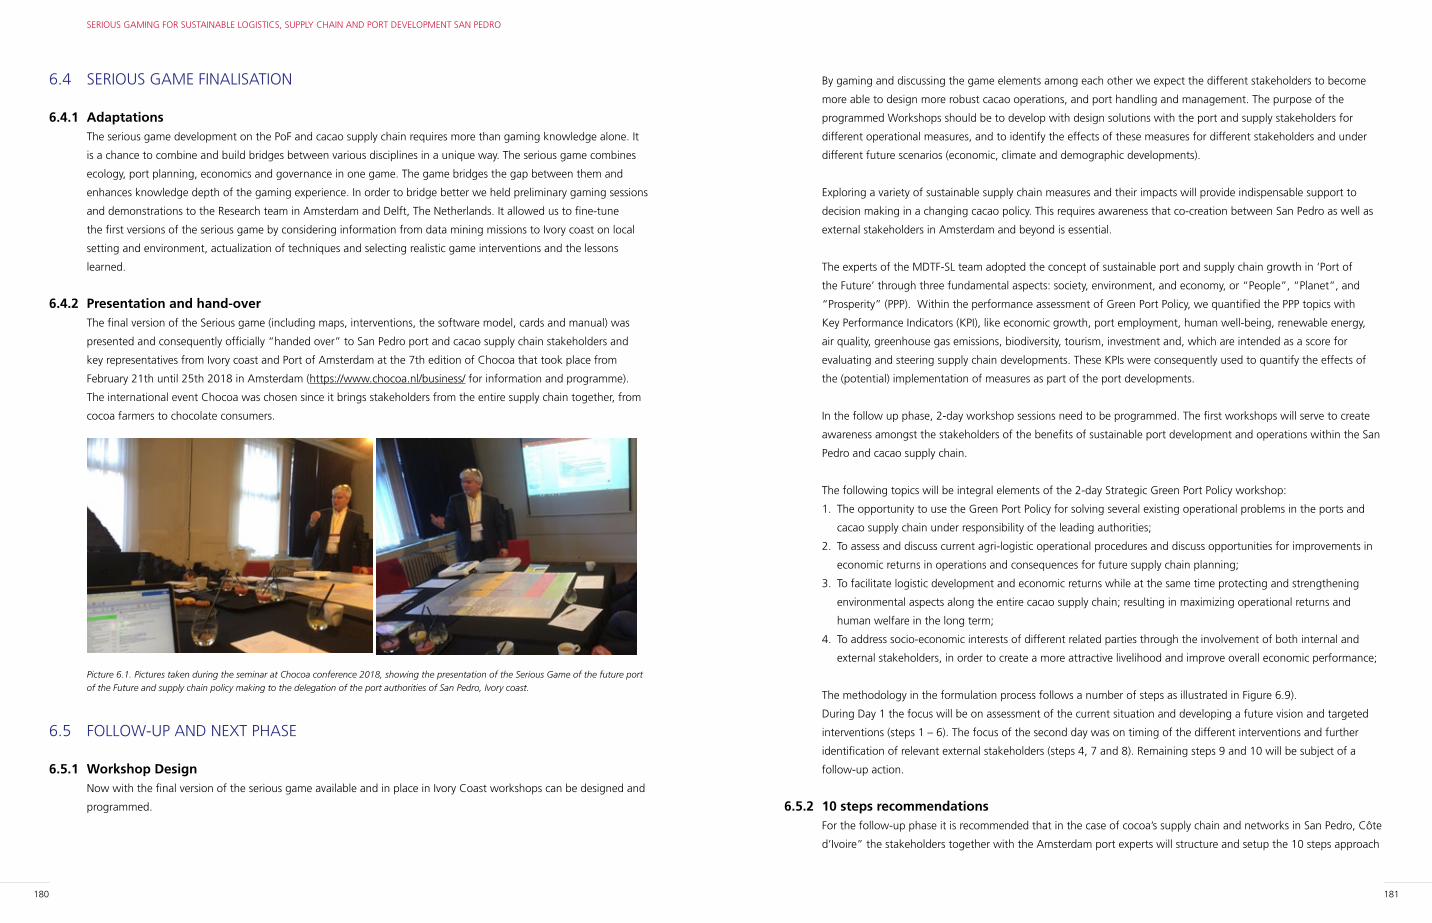
180 181
SERIOUS GAMING FOR SUSTAINABLE LOGISTICS, SUPPLY CHAIN AND PORT DEVELOPMENT SAN PEDRO
By gaming and discussing the game elements among each other we expect the different stakeholders to become
more able to design more robust cacao operations, and port handling and management. The purpose of the
programmed Workshops should be to develop with design solutions with the port and supply stakeholders for
different operational measures, and to identify the effects of these measures for different stakeholders and under
different future scenarios (economic, climate and demographic developments).
Exploring a variety of sustainable supply chain measures and their impacts will provide indispensable support to
decision making in a changing cacao policy. This requires awareness that co-creation between San Pedro as well as
external stakeholders in Amsterdam and beyond is essential.
The experts of the MDTF-SL team adopted the concept of sustainable port and supply chain growth in ‘Port of
the Future’ through three fundamental aspects: society, environment, and economy, or “People”, “Planet”, and
“Prosperity” (PPP). Within the performance assessment of Green Port Policy, we quantified the PPP topics with
Key Performance Indicators (KPI), like economic growth, port employment, human well-being, renewable energy,
air quality, greenhouse gas emissions, biodiversity, tourism, investment and, which are intended as a score for
evaluating and steering supply chain developments. These KPIs were consequently used to quantify the effects of
the (potential) implementation of measures as part of the port developments.
In the follow up phase, 2-day workshop sessions need to be programmed. The first workshops will serve to create
awareness amongst the stakeholders of the benefits of sustainable port development and operations within the San
Pedro and cacao supply chain.
The following topics will be integral elements of the 2-day Strategic Green Port Policy workshop:
1. The opportunity to use the Green Port Policy for solving several existing operational problems in the ports and
cacao supply chain under responsibility of the leading authorities;
2. To assess and discuss current agri-logistic operational procedures and discuss opportunities for improvements in
economic returns in operations and consequences for future supply chain planning;
3. To facilitate logistic development and economic returns while at the same time protecting and strengthening
environmental aspects along the entire cacao supply chain; resulting in maximizing operational returns and
human welfare in the long term;
4. To address socio-economic interests of different related parties through the involvement of both internal and
external stakeholders, in order to create a more attractive livelihood and improve overall economic performance;
The methodology in the formulation process follows a number of steps as illustrated in Figure 6.9).
During Day 1 the focus will be on assessment of the current situation and developing a future vision and targeted
interventions (steps 1 – 6). The focus of the second day was on timing of the different interventions and further
identification of relevant external stakeholders (steps 4, 7 and 8). Remaining steps 9 and 10 will be subject of a
follow-up action.
6.5.2 10 steps recommendationsFor the follow-up phase it is recommended that in the case of cocoa’s supply chain and networks in San Pedro, Côte
d’Ivoire” the stakeholders together with the Amsterdam port experts will structure and setup the 10 steps approach
6.4 SERIOUS GAME FINALISATION
6.4.1 AdaptationsThe serious game development on the PoF and cacao supply chain requires more than gaming knowledge alone. It
is a chance to combine and build bridges between various disciplines in a unique way. The serious game combines
ecology, port planning, economics and governance in one game. The game bridges the gap between them and
enhances knowledge depth of the gaming experience. In order to bridge better we held preliminary gaming sessions
and demonstrations to the Research team in Amsterdam and Delft, The Netherlands. It allowed us to fine-tune
the first versions of the serious game by considering information from data mining missions to Ivory coast on local
setting and environment, actualization of techniques and selecting realistic game interventions and the lessons
learned.
6.4.2 Presentation and hand-overThe final version of the Serious game (including maps, interventions, the software model, cards and manual) was
presented and consequently officially “handed over” to San Pedro port and cacao supply chain stakeholders and
key representatives from Ivory coast and Port of Amsterdam at the 7th edition of Chocoa that took place from
February 21th until 25th 2018 in Amsterdam (https://www.chocoa.nl/business/ for information and programme).
The international event Chocoa was chosen since it brings stakeholders from the entire supply chain together, from
cocoa farmers to chocolate consumers.
Picture 6.1. Pictures taken during the seminar at Chocoa conference 2018, showing the presentation of the Serious Game of the future port
of the Future and supply chain policy making to the delegation of the port authorities of San Pedro, Ivory coast.
6.5 FOLLOW-UP AND NEXT PHASE
6.5.1 Workshop DesignNow with the final version of the serious game available and in place in Ivory Coast workshops can be designed and
programmed.
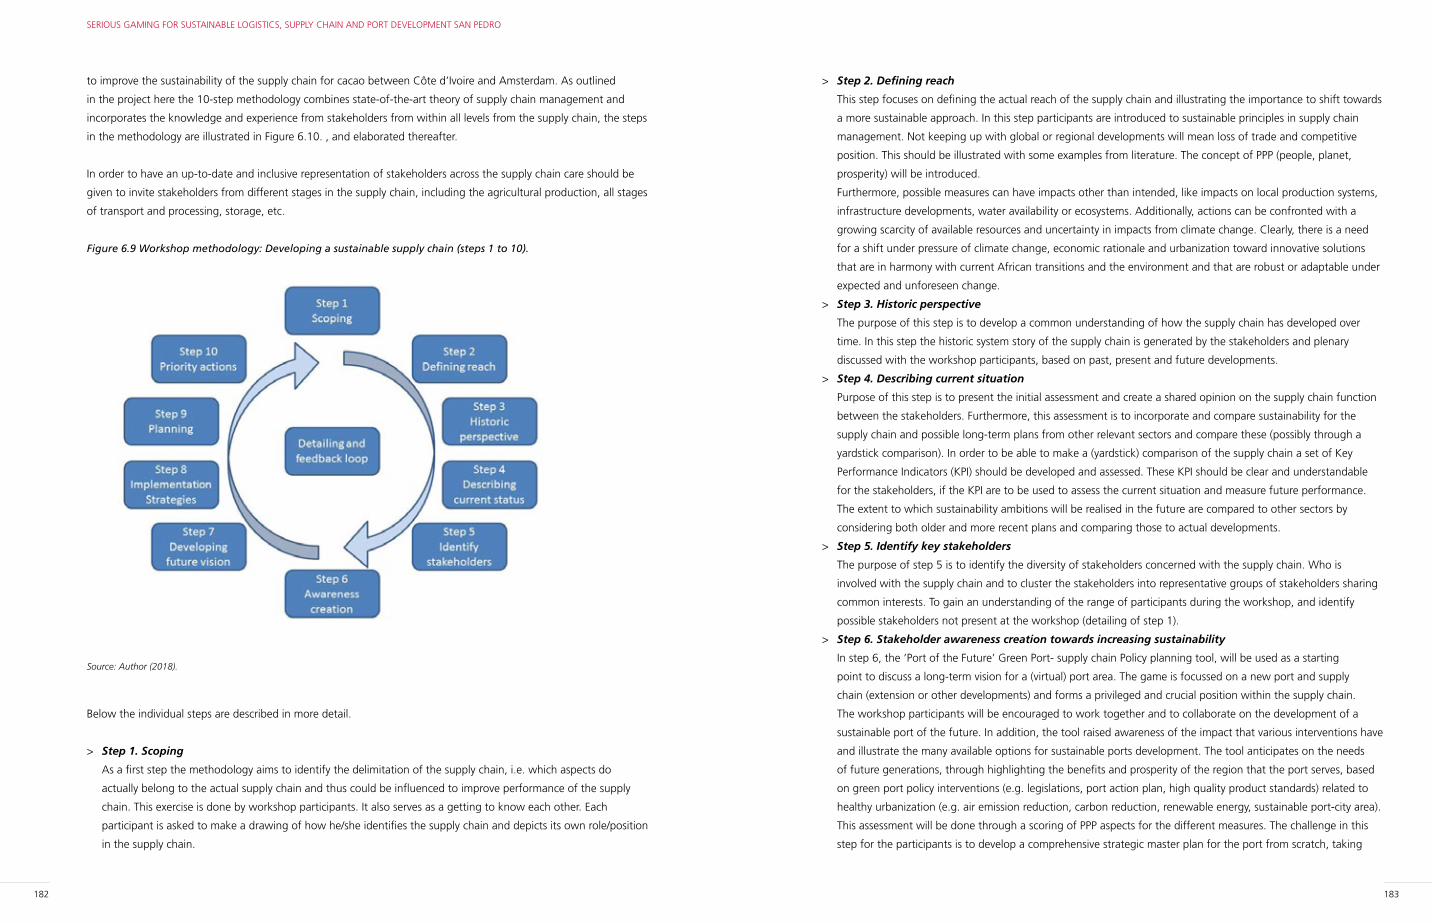
182 183
SERIOUS GAMING FOR SUSTAINABLE LOGISTICS, SUPPLY CHAIN AND PORT DEVELOPMENT SAN PEDRO
> Step 2. Defining reach
This step focuses on defining the actual reach of the supply chain and illustrating the importance to shift towards
a more sustainable approach. In this step participants are introduced to sustainable principles in supply chain
management. Not keeping up with global or regional developments will mean loss of trade and competitive
position. This should be illustrated with some examples from literature. The concept of PPP (people, planet,
prosperity) will be introduced.
Furthermore, possible measures can have impacts other than intended, like impacts on local production systems,
infrastructure developments, water availability or ecosystems. Additionally, actions can be confronted with a
growing scarcity of available resources and uncertainty in impacts from climate change. Clearly, there is a need
for a shift under pressure of climate change, economic rationale and urbanization toward innovative solutions
that are in harmony with current African transitions and the environment and that are robust or adaptable under
expected and unforeseen change.
> Step 3. Historic perspective
The purpose of this step is to develop a common understanding of how the supply chain has developed over
time. In this step the historic system story of the supply chain is generated by the stakeholders and plenary
discussed with the workshop participants, based on past, present and future developments.
> Step 4. Describing current situation
Purpose of this step is to present the initial assessment and create a shared opinion on the supply chain function
between the stakeholders. Furthermore, this assessment is to incorporate and compare sustainability for the
supply chain and possible long-term plans from other relevant sectors and compare these (possibly through a
yardstick comparison). In order to be able to make a (yardstick) comparison of the supply chain a set of Key
Performance Indicators (KPI) should be developed and assessed. These KPI should be clear and understandable
for the stakeholders, if the KPI are to be used to assess the current situation and measure future performance.
The extent to which sustainability ambitions will be realised in the future are compared to other sectors by
considering both older and more recent plans and comparing those to actual developments.
> Step 5. Identify key stakeholders
The purpose of step 5 is to identify the diversity of stakeholders concerned with the supply chain. Who is
involved with the supply chain and to cluster the stakeholders into representative groups of stakeholders sharing
common interests. To gain an understanding of the range of participants during the workshop, and identify
possible stakeholders not present at the workshop (detailing of step 1).
> Step 6. Stakeholder awareness creation towards increasing sustainability
In step 6, the ‘Port of the Future’ Green Port- supply chain Policy planning tool, will be used as a starting
point to discuss a long-term vision for a (virtual) port area. The game is focussed on a new port and supply
chain (extension or other developments) and forms a privileged and crucial position within the supply chain.
The workshop participants will be encouraged to work together and to collaborate on the development of a
sustainable port of the future. In addition, the tool raised awareness of the impact that various interventions have
and illustrate the many available options for sustainable ports development. The tool anticipates on the needs
of future generations, through highlighting the benefits and prosperity of the region that the port serves, based
on green port policy interventions (e.g. legislations, port action plan, high quality product standards) related to
healthy urbanization (e.g. air emission reduction, carbon reduction, renewable energy, sustainable port-city area).
This assessment will be done through a scoring of PPP aspects for the different measures. The challenge in this
step for the participants is to develop a comprehensive strategic master plan for the port from scratch, taking
to improve the sustainability of the supply chain for cacao between Côte d’Ivoire and Amsterdam. As outlined
in the project here the 10-step methodology combines state-of-the-art theory of supply chain management and
incorporates the knowledge and experience from stakeholders from within all levels from the supply chain, the steps
in the methodology are illustrated in Figure 6.10. , and elaborated thereafter.
In order to have an up-to-date and inclusive representation of stakeholders across the supply chain care should be
given to invite stakeholders from different stages in the supply chain, including the agricultural production, all stages
of transport and processing, storage, etc.
Figure 6.9 Workshop methodology: Developing a sustainable supply chain (steps 1 to 10).
Source: Author (2018).
Below the individual steps are described in more detail.
> Step 1. Scoping
As a first step the methodology aims to identify the delimitation of the supply chain, i.e. which aspects do
actually belong to the actual supply chain and thus could be influenced to improve performance of the supply
chain. This exercise is done by workshop participants. It also serves as a getting to know each other. Each
participant is asked to make a drawing of how he/she identifies the supply chain and depicts its own role/position
in the supply chain.
184 185
SERIOUS GAMING FOR SUSTAINABLE LOGISTICS, SUPPLY CHAIN AND PORT DEVELOPMENT SAN PEDRO
all the Green Port Policy criteria into account. AS explained before in the serious game setup chapters, the tool
applies fictional but realistic autonomous scenarios of pre-masterplan development. The scenario used in the
Green Port Policy tool is that the current port needs to keep up with economic growth,
> Step 7. Developing a future vision
The purpose of step 7 is to determine and describe potential outcomes or visions for the supply chain. The
participants are asked to develop possible visions. This will be done through a collaborative modelling session
in which participants will describe in detail the supply chain and quantify as much as possible the relations
between the different steps in the supply chain. Participants then have to identify the potential for sustainable
development for each of the steps in the supply chain. Furthermore, the participants are asked to prioritize
opportunities for development measures. These will be worked out in more detail in the next step.
> Step 8. Implementation strategies for priority issues
In step 8 the potential for implementation of sustainable development measures will be identified; in this step
we need to come up with a plan for measures based on inputs of the workshop participants during the previous
steps. A number of potentially interesting measures should be proposed, together with relevant processes,
possible stakeholders and outcome priority goals. The impact of the services on sustainable development has
been analysed based on the vision strategy in achieving sustainable social, environmental or economic dimension
(PPP) by using participants’ reflection on relevant processes in the supply chain.
> Step 9. Time line on how to implement a sustainable supply chain
In step 9, a timeline is made for the implementation of the measures between the present and the future, e.g.
the year 2050. Timing will be adopted on the participants’ assessment of both the need and the possibility
to implement the measures. The timing is also determined by the impact of the different People, Planet and
Prosperity measures for the supply chain based on the social, environmental and economic KPIs.
> Step 10. Priority actions on Green Port policy as future vision
The participants will need to prioritize the sustainable measures on the timeline of urgency (and possibly budget
availability).
6.5.3 The feedback loopAfter the serious gaming session of the workshops a feedback loop is needed that will address the question
on “how we plan to take the acquired knowledge on sustainable development into account in supply chain
development?”.
Important is to capture:
> What are the messages that the workshop participants take home?
> How do they plan to take the acquired knowledge on sustainable development into account within their own
dealings within the supply chain?
To make it more concrete, the workshop participants will be asked to set action points for themselves. For this,
open questions will be prepared so that stakeholders are open to give varying answers. The responses will need to
translate into preparation, implementation and monitoring of improvements in the supply chain.
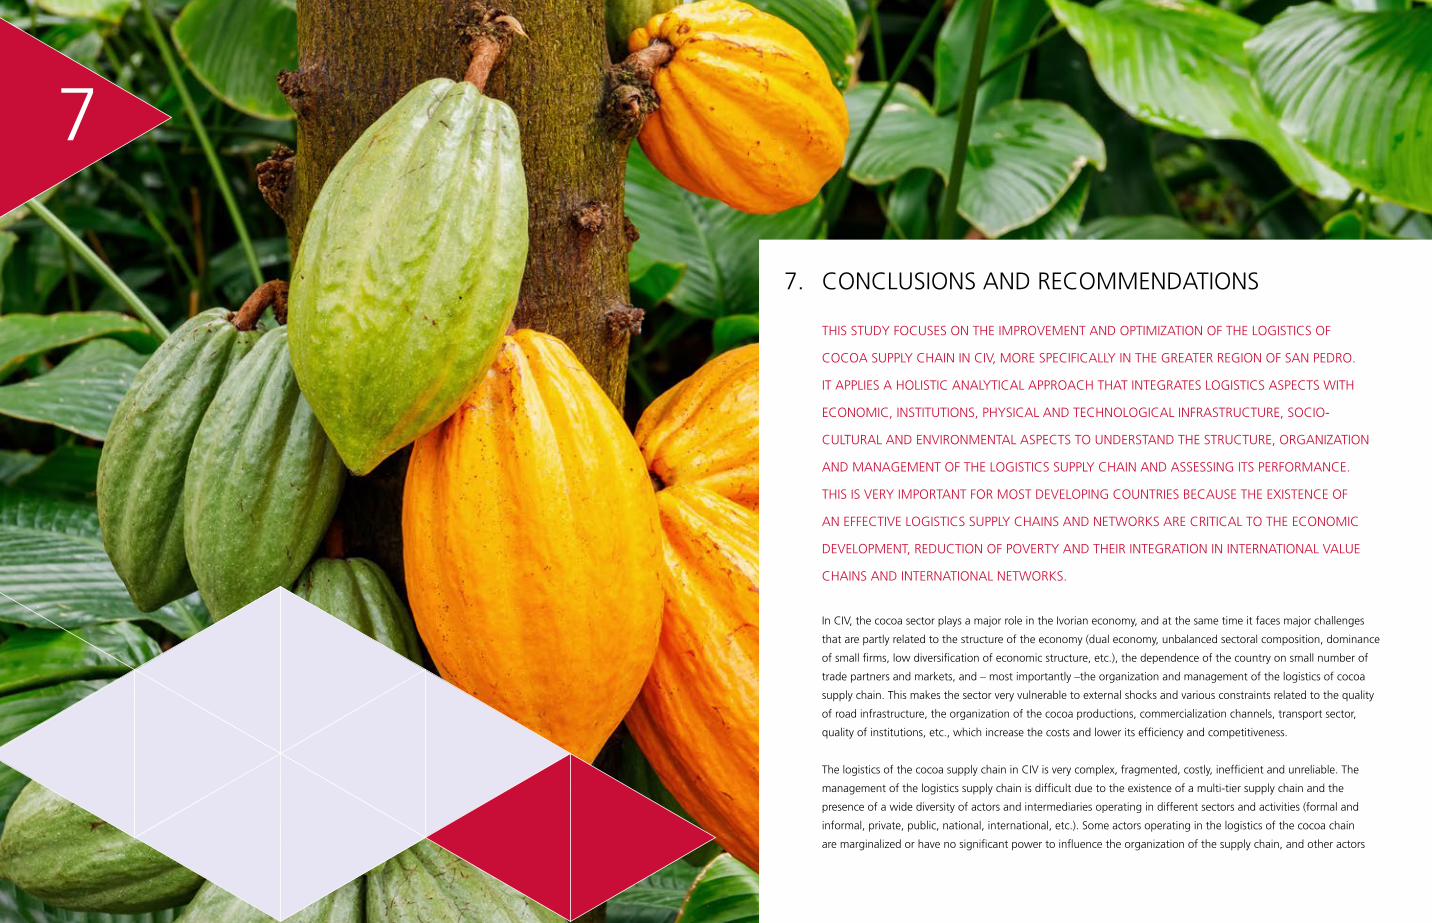
186 187
CONCLUSIONS AND RECOMMENDATIONS
7. CONCLUSIONS AND RECOMMENDATIONS
THIS STUDY FOCUSES ON THE IMPROVEMENT AND OPTIMIZATION OF THE LOGISTICS OF
COCOA SUPPLY CHAIN IN CIV, MORE SPECIFICALLY IN THE GREATER REGION OF SAN PEDRO.
IT APPLIES A HOLISTIC ANALYTICAL APPROACH THAT INTEGRATES LOGISTICS ASPECTS WITH
ECONOMIC, INSTITUTIONS, PHYSICAL AND TECHNOLOGICAL INFRASTRUCTURE, SOCIO-
CULTURAL AND ENVIRONMENTAL ASPECTS TO UNDERSTAND THE STRUCTURE, ORGANIZATION
AND MANAGEMENT OF THE LOGISTICS SUPPLY CHAIN AND ASSESSING ITS PERFORMANCE.
THIS IS VERY IMPORTANT FOR MOST DEVELOPING COUNTRIES BECAUSE THE EXISTENCE OF
AN EFFECTIVE LOGISTICS SUPPLY CHAINS AND NETWORKS ARE CRITICAL TO THE ECONOMIC
DEVELOPMENT, REDUCTION OF POVERTY AND THEIR INTEGRATION IN INTERNATIONAL VALUE
CHAINS AND INTERNATIONAL NETWORKS.
In CIV, the cocoa sector plays a major role in the Ivorian economy, and at the same time it faces major challenges
that are partly related to the structure of the economy (dual economy, unbalanced sectoral composition, dominance
of small firms, low diversification of economic structure, etc.), the dependence of the country on small number of
trade partners and markets, and – most importantly –the organization and management of the logistics of cocoa
supply chain. This makes the sector very vulnerable to external shocks and various constraints related to the quality
of road infrastructure, the organization of the cocoa productions, commercialization channels, transport sector,
quality of institutions, etc., which increase the costs and lower its efficiency and competitiveness.
The logistics of the cocoa supply chain in CIV is very complex, fragmented, costly, inefficient and unreliable. The
management of the logistics supply chain is difficult due to the existence of a multi-tier supply chain and the
presence of a wide diversity of actors and intermediaries operating in different sectors and activities (formal and
informal, private, public, national, international, etc.). Some actors operating in the logistics of the cocoa chain
are marginalized or have no significant power to influence the organization of the supply chain, and other actors
7
188 189
CONCLUSIONS AND RECOMMENDATIONS
Investments in ICT applications and using new technology at the upstream level of the supply chain can significantly
improve the quality of cocoa and transparency of the logistics chain, through digitalization of logistics processes
and traceability of the cocoa from the farmers to the storage facilities and the port. Unfortunately, the level of
digitalization and traceability is lacking or very low in the cocoa sector.
Second, cooperatives act as intermediaries between farmers and exporters and international companies. The
cooperatives are organizationally and financially very weak to defend the rights of the farmers. A large number of
cooperatives in the cocoa sector do not really offer any advantage to the farmers because they lack the financial
means to build adequate and modern facilities (storage facilities), as well as equipment (truck fleet) and support the
farmers. The proliferation of fictional cooperatives is driven more by rent-seeking than defending the interests of the
farmers and strengthening their position.
In short, like the farmers whom they are supposed to represent, a large part of the cooperatives are inefficient,
mismanaged, a lack of professionalism and management skills, as well as having a weak position in the upstream
supply chain. Their weak position is further deteriorated by fierce competition between cooperatives, a lack of
coordination and internet control, traditional management style and a lack of transparency.
Third, concerning the freight transport sector, the major handicap that face the logistics of the cocoa supply chain is
the poor quality of road infrastructure and the resulting increase in transport and logistics costs, low accessibility to
production locations, limited speed of trucks, the increased use of fuel and the corresponding increase in emissions,
as well as the increased in costs of maintenance costs and security. Accordingly, significant delays and time loss
occur along different legs of the logistics supply chain.
Besides the state of the road infrastructure, the organization and structure of the transport sector also contribute to
increasing transport and logistics costs. The trucking industry is dominated by a majority of individual transporters
operating in the informal sector, using old and second-hand trucks and working under sub-contracting informal
contracts. Most of the transport operators in the cocoa sector operate with empty returns, due to lack of freight
shipments from San Pedro to the hinterlands. Their financial position is weak and the majority cut operational costs,
saving on the maintenance of vehicles, fuels usage, travel allowances, tires and labor costs. Another way to
compensate for transport costs is to increase trucks overloading and negotiate better tariffs with clients.
The quality and service level of transport operators is low due to the unreliability in delivery times and
uncertainties with delays, loss of time and damage. The most important source of delays is the high number
of checkpoints along the principal and secondary roads from/to San Pedro, which increases logistics costs and
constitutes an important source of inefficiencies in the cocoa supply chain.
Other bottlenecks that have been identified are high congestion and a lack of parking spaces, whereby trucks
park along the streets waiting to unload their shipments by the exporters, strong competition between transport
operators, dependence on the seasonality of the cocoa sector, high additional costs of briberies and incentives to
overload trucks, low incentives to invest and a lack of transparency and openness in business practices.
perform tasks and activities that do not add any value to the cocoa sector, nor to improve the performance of the
logistics supply chain.
The analysis of the logistics of cocoa supply chain reveals various challenges and constraints that the sector is
facing at the upstream and the downstream channels. The downstream of the supply chain is controlled by capital-
intensive companies and sophisticated (logistics) services firms, while the upstream channels of the supply chain are
dominated by labor-intensive activities, low quality of logistics services and competing players. Furthermore, many
parties involved in the supply chain operate in an environment dominated by the informal activities.
First, at the upstream channels of the logistics chain, the position of the farmers is very weak due to the
predominance and fragmentation of smallholders cultivating cocoa for subsistence (not a business) on small plots
of land, the difficulties that they face accessing the market information, finance, inputs and technology, as well as
their poor understanding of the quality requirements of the market. This translates into low productivity, low use of
inputs, diseases, low revenues/income, low investment, low innovation in production processes, decreasing yield and
high poverty among the cocoa farmers.
In other words, the weak position and the lack of integration of farmers into the logistics of the cocoa supply
chain is one of the main constraints of the cocoa supply chain. This is due to the top-down governance structure
of the cocoa sector itself, but also the weak power position of the farmers’ organizations, i.e. cooperatives, their
fragmentation and a lack of coordination between these organizations. Another reason is the strong control
(lobby) of this part of the supply chain by the private buyers and traders. Indeed, private buyers and traders have
a powerful position in the upstream channels of the supply chain. They control the processes of collection and
commercialization of the cocoa as vital intermediaries between farmers and exporters.
As a result, the distance between upstream and the downstream of the logistics supply chain is too long, thus
increasing the costs and loss of time as well as the leakage of money outside the supply chain.
In order to connect the farmers directly to the market/exporters, reforms are needed to restructure, i.e. limit
and/or strength the position of stakeholders at the upstream level of the supply chain, for example by limiting
the monopoly position of private buyers and traders and increasing the power position of farmers and their
organizations. This will break the vicious circle of poverty of the farmers and stimulate them to adopt more
sustainable production practices to improve productivity, quality and increase revenues. The entire cocoa supply
chain can benefit, instead of benefiting a few parties at the cost of the majority of actors in the sector as in the
current situation.
Another important weakness affecting the cocoa supply chain is the degradation of the quality of cocoa and the
widespread practices of sheeting on weight and mixing cocoa, which is due to the weak governance structure
(corruption and favoritism) in the sector and the non-transparent procedures of quality control. The degradation
of quality often takes place at the level of the storage facilities of the cooperatives, which do not always comply
with international standards of storage and maintenance of cocoa. Due to limited financial resources, most of the
cooperatives are unable to construct modern and sophisticated storage facilities/warehouses that meet the demand
of the international exporters.
190 191
CONCLUSIONS AND RECOMMENDATIONS
and tertiary roads that link production location to San Pedro. This study shows that without a sound government
policy aiming at improving the quality of infrastructure – including transport, energy, telecommunication,
etc. – the development of effective logistics of the cocoa supply chain could not be reached. Finally, based
on the results of the simulations performed with the supply chain model, the following recommendations are
formulated: (i) the policy that most strongly influences the productivity of the supply chain is the one that reduces
the checkpoint frequency, whereby the value of the products at the port increased by 200,000 USD in three
months or 800,000 USD in one year; (ii) the improvement in the main road that to the port has a major impact,
whereby any decision that improves this link is strongly suggested; and (iii) In order to reduce the pollution, it is
suggested to make investments in improving the secondary and tertiary roads mostly in the hinterland.
> Strengthen the position of the farmers and improve their living conditions: a concerted sector-wide strategy
must be developed to fully integrate all farmers – including those who are not organized in cooperatives – within
the supply chain by creating mechanisms to facilitate direct relations between farmers and other actors in the
downstream channels of the logistics chain (exporters, grinders, etc.).
> Moreover, increasing productivity is not sufficient to improve the revenues of farmers and offset the lower
farmgate price, whereby farmers can be helped by increasing transparency of the cocoa supply chain regarding
the determination of the farmgate price, the determination of the costs, taxes and the spending revenues
from cocoa. Farmers need to be informed timely and with up-to-date information about prices, markets, costs,
marketing channels and taxes. Furthermore, improving access to land by pursuing land reforms and developing
land registration system and access to financial credits can stimulate the farmers to invest in increasing
productivity, better manage their farms and diversification of production.
> Develop and implement information systems for a sustainable supply system that ensures market transparency
and dissemination of information through the value chain, in particular to farmers and cooperatives. As the
use of mobile phones and other ICTs becomes more affordable and widespread, there is a great opportunity to
improve access to market information, mobile banking/payments and improve the traceability and better control
of the quality of cocoa beans.
> Stimulate the creation of strong, credible and transparent professional organizations representing the farmers at
the regional and national level. The proliferation of cooperatives can be controlled and reduced to a minimum
optimum level, where a limited number of strong cooperatives representing all farmers in the cocoa sector work
together and coordinate their actions to defend the interests of the farmers and effectively help them to improve
their living conditions. This can keep the cocoa chain as short and efficient as possible, with all participants
receiving a fair and equitable economic return, in particular smallholder farmers.
> Facilitate access to finance and stimulate the cooperatives to invest in setting up and/or improve high-quality
storage facilities close to production locations to reduce post-harvest losses, reduce transport costs and delays
and improve the upstream legs of the logistics supply chain. Strong farmers organizations that are professional,
well managed, transparent and financially healthy can play a key role in facilitating the development of ample
storage facilities, warehousing and transfer facilities in the cocoa supply chain.
> Strengthen and reform transport sector: regulations and enforcement of the transport sector are needed to
improve the quality of transport services and reduce transport and logistics costs in the cocoa supply chain.
Structural reforms are needed to modernize the fragmented sector, especially the integration of informal
transport operators in the formal sector, the replacement of the old second-hand fleets of trucks and
implementing new measures to reduce vehicle operating costs and environmental effects of the transport
operators. Furthermore, the elimination of distortions and bottlenecks along the supply chain – such as overload
Fourth, the downstream channels of the logistics of the cocoa supply chain are controlled by the international
traders, exporters and processors. The key actors in these channels are able to influence the entire logistics chain
because they maintain direct relationships with farmers, traders, transporters and cooperatives. The logistics
bottlenecks facing the actors in this part of the logistics supply chain are the poor condition of the road networks,
high congestion in the city – more specifically around and within the port – and the delays and waiting times by
loading and unloading at the port, as well as the loss of time due to long administrative and customs procedures. In
another words, the logistics costs are driven up by congestion and waiting time/delays occurring in the last mile of
the supply chain, i.e. within and around the port.
The relative long waiting time at the port of San Pedro can be explained by the limited capacity of the port (small
port with limited operational capacity and port infrastructures) and the delays in the arrival and departure of ships
and the turnaround schedules of ships. Moreover, low levels of digitalization – i.e. manual handling and transmission
of information – and poor sharing of information by international exporters, freight intermediaries, port authorities,
customs and government agencies lead to delays and associated costs even though internal information flows
between each party are efficient. Therefore, digitalization, data sharing and cooperation between these key parties
in the supply chain are crucial to improving the efficiency of the logistics supply chain.
Further analysis of the performance of the port of San Pedro reveals that the relatively long waiting times and
delays at the port coincide largely with the seasonality of the cocoa production and export. More specifically, the
average waiting times and the quay duration of the vessels is relatively higher during the high season. This can be
explained by the poor quality of handling services (loading and unloading of shipments), limitations imposed by port
equipment and infrastructure, operational factors such as long processing and administrative procedures and poor
performance (delays) of control and customs.
Another issue regarding the port efficiency is the high congestion caused by the increase in traffic to/from the port
and the resulting long queues of vehicles along the streets waiting to unload their shipments. This situation is due to
lack of parking space in the city and the lack of an organized truck admittance system at the gate of the port.
More generally, the development of an efficient and sustainable logistics of cocoa supply chain needs coherent and
integrated reforms and policy measures based on a bottom-up approach with the main targets of strengthening
the position of the weakest legs – i.e. farmers and their organizations – reducing and/or eliminating non-useful
additional logistics legs along the logistics chain and limiting the powerful position of the international companies
and exporters for the benefit of those who contribute most to the sector, i.e. farmers. However, such reforms aiming
at improving the efficacity of the logistics of cocoa supply chain in terms of the reliability, security and speed of
the flows of goods, information and money should be accompanied by structural reforms of existing institutions,
especially combating the institutionalized corruption and setting up legal mechanisms that favor transparency,
openness, equality and accountability.
7.1 RECOMMENDATIONSBased on the results of empirical research, we formulate the following recommendations:
> Improve the quality of the road networks: most of the road networks are currently very degraded and in poor
physical condition. Besides the urgent need to improve the primary road linking San Pedro to other cities like
Sassandra and Soubé, Divo and Daloa and Abidjan, special attention should be oriented toward the secondary
192 193
CONCLUSIONS AND RECOMMENDATIONS
the field. Moreover, with the model at hand, it is relatively easy to identify which links in the chain need more
attention and what particular information is necessary for making the model more accurate.
Finally, the authors strongly recommend including simulations in the study of agri-food industries, since – as been
illustrated in this study – such models are able to provide more informed decisions and reduce the risk of wrong
investments, which is especially important with the management of public money.
of trucks, empty backhaul, loss of time at the checkpoints, waiting time and delays on road and at the port,
congestion, etc. – must be considered as a high priority among the constraints that must be solved in the short
term by the government to sustain the improvements of the logistics of cocoa supply chain. Other suggested
actions to regulate the trucking industry and reduce transport and logistics costs are to stimulate consolidation
of the transport sector by promoting access to more affordable financial credits for transporters to modernize
their fleets, develop strong emissions control standards and explore the possibilities of developing multi-modal
transport modes and logistics parks in San Pedro and/or in the port – with special transport routes to ports and
streamlined customs processes – which can help to reduce time and costs.
> Improve the efficiency and efficacity of logistics processes in the last mile – i.e. at the port of San Pedro –
by adopt sophisticated and advanced information technologies, such as electronic customs clearance and
documentation flows, as well as enhancing the digitalization of transport and logistics processes that reduce time
and costs and increase speed of flows of goods and information between actors along the supply chain.
> Stimulate the development of strong local processing capacity and value addition at the origin and develop
modern storage facilities of cocoa derivatives that meet international standards in San Pedro. The government
ambition to increase the processing capacity to 50% is a good example that opens up the doors for the private
sector to invest in the processing industry. However, this must be accompanied by policy measures that stimulate
private investments, lower the entry barriers the powerful position of the international firms in this industry.
Private-public investments could help to build a national industry in this sector.
> The results obtained from the simulation model show that the investment in increasing the processing capacity
(i.e. production of butter as an example) needs further investigation. The simulations suggest that it is difficult to
surpass the value of just improving the transport of cocoa beans to the port. Furthermore, it is necessary to break
down the value chain to identify where the value is created and increased so that specific societal targets are
aimed and these investments positively influence the well-being of the population.
> Limit the institutional constraints that dominate in the cocoa sector such as the centralized decision-making
process and control in the hands of small and powerful executive government bodies, and involve representatives
of the private stakeholders – especially farmers – in the decision process and policy-making. Moreover, develop
and apply policy and legal mechanisms that can eradicate all forms of corruption, patronage and clan networks,
illegal payments of briberies and improve the transparency and effectivity of the juridical system, e.g. resolution
of contractual disputes, and more globally the transparency and accountability in the sector.
> Make data publicly available and stimulate the exchange of data between actors in the logistics of the cocoa
supply chain: there is a need for reliable open data of the entire cocoa supply chain, e.g. farmers, cooperatives,
transporters, flows of goods, information, transactions, etc. It is striking that much of the available public
information has been collected and paid by donors and international development organizations, while many
government agencies, boards, ministries and major companies collect comprehensive sets of data without
making them accessible to the researchers and the public. Without access data, public efforts and policy
implementation cannot be evaluated on their effectiveness without a clear analysis of the size and nature of
the problems. The government should stimulate data sharing between stakeholders in the logistics of the
cocoa supply chain, by defining a framework for data collection including strict rules for data protection. All
stakeholders need to collaborate to improve or create an up-to-date databank that can be managed by an
independent government agency; for example, the national statistical office.
Finally, the results of the simulations performed with the supply chain model clearly show that in order to have
more accurate results, it is necessary to include more accurate and specific data on the cocoa supply chain from
194 195
REFERENCES
REFERENCES
AFD, 2016. Cocoa farmers’ agricultural practices and livelihoods in Côte d’Ivoire Insights from cocoa farmers and
community baseline surveys conducted by Barry Callebaut between 2013 and 2015. Technical Reports, December
2016., No. 24. Paris.
African Development Bank, 2018. African Economic Outlook 2018
AfDB/OECD, 2006. African Economic Outlook 2005-2006: Côte d’Ivoire. www.oecd.org/dev/publications/
africanoutlook
Agrici.net, 2017. La Banque mondiale décortique la crise cacao dans son rapport Côte d’Ivoire, 27 Juillet 2017.
www.agrici.net.
AGS – West Africa Industry-Specific Market Study in Ivory Coast (confidential report). Dutch Ministry Of Foreign
Affairs
Alami, T. M, 2008. Etude du Racket sur les routes en Côte d’Ivoire. Bureau d’études Arc Ingénierie, Abidjan, Côte
d’Ivoire .
Allsop, N. W. H. (2001). Breakwaters, coastal structures and coastlines. Proceedings of International Conference
Organized by the Institution of Côte d’Ivoireil Engineers, London. Retrieved from https://books.google.fr/
books?id=0XtfQ_iW0_YC&pg=PA198&dq=%22rock+manual%22&sig=Md2PBRHD8-15d5phk0lD_4z69fY#v=onepa
ge&q=%22rock manual%22&f=false
Anti-Slavery International, 2004. The Cocoa Industry in West Africa: A History of Exploitation. Retrieved October
20th 2017, from http://www.antislavery.org/wp-content/uploads/2017/01/1_cocoa_report_2004.pdf
Arenaza, F, Malgras, E, and Ordieres, S. F, 2017. Côte d’Ivoire; The China shift; from loans to business. Haddock
Media International.
Banks, J., Carson, J.S., Nelson, B., Nicol, D.M., 2010. Discrete-even System Simulation,
fifth ed. Pearson.
Banque Mondiale, 2015. La Force de l’Élephant: Pour que sa croissance genere plus d’emplois de qualité. rapport
de la Banque mondiale sur la situation économique en Côte d’Ivoire. Groupe de la Banque Mondiale, Decembre
2015.
Berenbeim, R.E and Shakya,M (2011). Integration of Developing Countries in the Global Supply Chain: A Global
196 197
REFERENCES
Cambridge City Council. (2015). Retention and in fi ltration basins. Retrieved from https://www.cambridge.gov.uk/
sites/default/files/docs/SUDS-6-Retention and Infiltration basins.pdf
CIAT, 2011. Predicting the Impact of Climate Change on the Cocoa- Growing Regions in Ghana and Cote
d’Ivoire. Final report. September, 2011
Comité de pilotage du système de suivi du travail des enfants, 2008. La certification du processus de production
du cacao. Enquête Initiale de Diagnostic Nationale (dans 18 departments representatives de toutes la zone de
production cacao). Secretariat executif. Rapport definitif. Juin 2008
Comite de Pilotage. Secretariat Executif, 2009. Systeme de Suivi du Travail des Enfants (SSTE/ED). Le: étude
complémentaire sur l’Enquête Nationale de Diagnostic, [Août 2009]
Coastal Wiki. (2015). Impact of tourism in coastal areas: Need of sustainable tourism strategy.Retrievedfrom http://
www.coastalwiki.org/wiki/Impact_of_tourism_in_coastal_areas:_Need_of_sustainable_tourism_strategy
Dago, L.F, 2008. Fonctionnement et dynamisme du port de San Pedro. Mémoire, Université de Cocody Abidjan
(Institut de Géographie Tropicale) - Maitrise Géographie 2008 Dans la categorie: Géographie . http://www.
memoireonline.com/12/09/2972/m_Fonctionnement-et-dynamisme-du-port-de-San-Pedro.html
Dasgupta, P. (1993). An Inquiry into Well-Being and Destitution. Journal of Economic Literature.
De Urbanisten. (2010). Water squares. Retrieved from http://www.urbanisten.nl/wp/?portfolio=waterpleinen
Deelen, C. (2015). Road transport. Port of Rotterdam Authority. Retrieved from https://www.portofrotterdam.com/
en/connections-logistics/intermodal-transportation/road-transport
Deloitte, 2017. Invest in Côte d’Ivoire A business guide for Africa’s fastest-growing economy. March 2017
Deltares. (2015). Deltares Eco-Engineering guide. Retrieved from http://www.innoverenmetwater.nl/upload/
documents/Eco engineering (brochure).pdf
Dolah, R. F. Van, Calder, D. R., & Knott, D. M. (1984). Effects of dredging and open-water disposal on benthic macro
invertebrates in a South Carolina estuary. Coastal and Estuarine Research
Dorosh, P, Wang, H-G, You, L and Schmidt, E, 2009. Crop Production and Road Connectivity in Sub-Saharan Africa:
A Spatial Analysis. The International Bank for Reconstruction and Development / The World Bank. AICD, WORKING
PAPER 19. Washington, DC. FEBRUARY 2009
Drennan, L. A. (2015). People, Planet, Ports: Linking Ecosystem Services to the Triple Bottom Line for a Sustainable
Port Future.
Buyers’ and Producers’ Perspective. Working paper, The Conference Board. www.conferenceboard.org. 845 Third
Avenue, New York, NY.
Blancas, L. C., Isbell, J., Isbell, M., Tan, H. J., Tao, W (2014). Efficient Logistics: A Key to Vietnam’s Competitiveness.
World Bank, Directions in development, Countries and regions. Washington, D.C.
Bloomsbury House, 2010. The World Cocoa Economy; Past and Present. Executive Committee. One hundred and
forty-second meeting. Bloomsbury House, 2-3 Bloomsbury Square, London WC1A 2RL. 14 – 17 September 2010.
Bogetic, Z., Espina, C, and Noer, J (2007). Cote d’Ivoire: Competitiveness, Cocoa, and The Real Exchange Rate.
Policy Research Working paper Nr. 4416 (WPS4416). The World Bank, November 2007. Washington DC.
Bogetic, Z, Espina, C, and Noer, J, 2007. Côte d’Ivoire; Volatility, Shocks and Growth. The World Bank, Policy
Research Working Paper 4415. Washington, DC.
Beachapedia. (2015). Shoreline Structures: Why We Should Care. Retrieved from http://www.beachapedia.org/
Shoreline_Structures
Bekebrede, G. (2010). Experiencing Complexity: A gaming approach for understanding infrastructure systems.
Beumer, V., Hulsman, H., & Koning, E. (2012). Exploring Opportunities for Green Adaptation in Rotterdam.
Knowledge for Climate. Retrieved from http://docplayer.net/2532670-Exploring-opportunities-for-green-adaptation-
in-rotterdam.html
Biodiversity Indicators Partnership. (2015). Connectivity/Fragmentation of Ecosystems. Retrieved from http://www.
bipindicators.net/indicators/ecosystemintegrityservices/connectivityfragmentationofecosystems/2010
Bishop, M., & Peterson, C. (2005). Assessing the Environmental Impacts of Beach Nourishment. Oxford Journals:
Science and Mathematics. Retrieved from http://bioscience.oxfordjournals.org/content/55/10/887.full
Bom, D. van der. (2013). New ways to deal with wastewater. Rotterdam Port Authority. Retrieved from https://www.
portofrotterdam.com/en/news-and-press-releases/new-ways-to-deal-with-wastewater
Borsodi, L. (2015). Rail transport. Port of Rotterdam Authority. Retrieved from https://www.portofrotterdam.com/en/
connections-logistics/intermodal-transportation/rail-transport
Bracke, S., Bucx, T., Frost, N., Jaspers, H., J. de Groot, G. Quemeneur, F., & Sahin, P. (2007). Creation and restoration
of coastal and estuarine habitats: A review of practical examples and a description of sequential guidelines for
habitat creation and restoration in port areas. Retrieved from http://ec.europa.eu/ourcoast/download.cfm?fileID=864
Camargo and Nhantumbo, 2016. Towards sustainable chocolate: Greening the cocoa supply chain. IIED, the
International Institute for Environment and Development (IIED)/ the Tropical Resources Institute (VITRI), University of
Helsinki. http://pubs.iied.org/16613IIED
198 199
REFERENCES
Goreau, T. (2014). Biorock Benefits. Retrieved from http://www.globalcoral.org/wp-content/uploads/2013/11/
BIOROCK_TECHNOLOGY_july1114.pdf
GRHC. (2015). Green Roof Benefits. Retrieved from http://www.greenroofs.org/index.php/about/greenroofbenefits
Guler, N. (2003). Economic evaluation of port investments. Pomorski Zbornik, 40, 205–221.
Hausman, W. H., Lee, H. L., Subramanian, U (2005). Global Logistics Indicators, Supply Chain Metrics, and Bilateral
Trade Patterns. World Bank Policy Research Working Paper 3773, November 2005
Higonnet, E, Bellantonio, M and Hurowitz, G, 2017. CHOCOLATE’S DARK SECRET: How the Cocoa Industry Destroys
National Parks. Mighty Earth.
Hricko, A. (2012). Progress and Pollution: Port Cities Prepare for the Panama Canal
Expansion. Environmental Health Perspectives. Retrieved from http://ehp.niehs.nih.gov/120-a470/
IMF, 2017. Regional Economic Outlook. Sub-Saharan Africa: Restarting the Growth Engine. Apr17
Instutite National de la Statistique (INS), 2018 <http:www.ins.ci>
IMO, (2005). MARPOL Annex VI.
Ingram, V, 2015. The true price of chocolate?. Chocolate. Agro FOOD Industry Hi Tech - vol 26(1) - January/February
2015. Den Haag, The Netherlands.
Ingram, V, Waarts, Y, Ge, L, van Vugt, S, Wegner, L, Puister-Jansen, L, Ruf, F, Tanoh, R., 2014. Impact of UTZ
certification of cocoa in Ivory Coast: Assessment framework and baseline. REPORT LEI 2014-010. LEI Wageningen
UR Wageningen, June 2014
IOS Partners, 2014. Etude sur la compétitivité des entreprises ivoiriennes. Rapport Provisoire, Mars 2014. Agence de
promotion des exportations de Côte d’Ivoire (APEX-CI). Projet Réf.
SFQC/03/PARE-PME/2002.
Institut des journées nationales du Cacao et du Chocolat (JNCC), 2016. Evolution de la filière Café-Cacao, de 2012-
2016. 3e édition des journées nationaux et chocolat, Abidjan, 2016.
Jedwab, R., 2010. Urbanization, A Magic Bullet for African Growth? On Cocoa and Cities in Ivory Coast and Ghana.
Draft Version: October 1st 2010. Paris School of Economics. Retrieved April 2017 from: http://www.pse.ens.fr/junior/
jedwab/.
Kenney, K. B. E. M., Fowler C., Ratte M., Sanford P., Pringle P., Sequeira F. A. A. C.,
and Didyk N.. Aviation Emissions and Air Quality Handbook Version 3. 2014.
Environmental Protection Agency (EPA 2018), https://www.epa.gov/sites/production/files/2018-03/documents/
emissionfactors_mar_2018_0.pdf
Essoh, N.P.S. (2014) Cote d’Ivoire’s Commodities Export and Shipping: Challenges for Port Traffic and Regional
Market Size. American Journal of Industrial and Business Management, 4, 234-245. http://dx.doi.org/10.4236/
ajibm.2014.45031
EST. (2014). Solar water heating. Retrieved from http://www.energysavingtrust.org.uk/domestic/solar-water-heating
European Commission. (2015). Coastal and maritime tourism. Retrieved from http://ec.europa.eu/maritimeaffairs/
policy/coastal_tourism/index_en.htm
FAO, 2009. Programme pilote de reduction de la pauvrete dans la region du Bas- Sassandra. Partenariat PASP/SNU/
BRS CI/FER/FIRCA. Mars 2009
Federation, 7(1), 28–37. Retrieved from http://www.jstor.org/stable/1351954?seq=1#page_scan_tab_contents
Fountain, A and Huetz-Adams, F, 2018. Cocoa barometer 2018. Retrieved march 2018, from https://www.scribd.
com/document/377923345/2018-Cocoa-Barometer-180420-pdf
Foster, V and Pushak, N, 2011. Côte d’Ivoire’s Infrastructure: A Continental Perspective. Policy Research Working
Paper 5594, World Bank, Washington, DC.
Foster, V and Briceño-Garmendia, C, 2010. Africa’s Infrastructure: A Time for Transformation. The International Bank
for Reconstruction and Development / The World Bank, Washington, DC.
Fisk P. (2010). People, planet, profit: How to embrace sustainability for innovation and business growth. ISNB
9780749454111, MPG Books Ltd.
Fries, G., Weiss, E., and White, K. (2013). Agri-Logistics for Nutmeg & Cocoa Exports from Grenada; A Logistics
Chain Approach. The International Bank for Reconstruction and Development/ The World Bank, report number
82610.
Gaede, S. (2015). An economically and legally viable mechanism for taxing shipping fuel emissions. Retrieved from
http://climatecolab.org/plans/-/plans/contestId/1301418/phaseId/1306794/planId/1320164
Gelb, A, Meyer, C. J, Ramachandran, V and Wadhwa, D, 2017. Can Africa Be a Manufacturing Destination? Labor
Costs in Comparative Perspective. Centre for Global Development. Working paper 466, October 2017. www.cgdev.
org.
Global Witness, 2007. Hot chocolate: How cocoa fueled the Conflict in Côte d’Ivoire. Global Witness report, June
2007.
200 201
REFERENCES
Naré, H and Kamakaté, F, 2017. Developing a roadmap for the adoption of clean fuel and vehicle standards in
Southern and Western Africa. International Council of Clean Transport (ICCT). Washington, DC
Nathan Association Inc. 2013. Logistics Cost Study of Transport Corridors in Central and West Africa. Report
Nathan Association Inc. Arlington, Virginia, USA, September, 2013. Contract No. 7161353
Nazy, D. (2015). Aquifer Storage and Recovery (ASR) and Shallow Aquifer Recharge (SAR): tools to supplement
water supply. Retrieved from http://www.ecy.wa.gov/programs/wr/asr/asr-home.html
Nichol, M. &. (2004). Study of Additional Combinations of Lock Water Saving Basins for Proposed Post-Panamax
Locks at the Panama Canal. Autoridad de Canal de Panama. Retrieved from http://www.pancanal.com/esp/plan/
estudios/0128-exec.pdf
Noble, M. (2015). Reducing the Risk of Transporting Invasive Species. Ocean Portal. Retrieved from http://ocean.
si.edu/ocean-news/reducing-risk-transporting-invasive-species
Nomel P. Stéphane Essoh, 2014. Cote d’Ivoire’s Commodities Export and Shipping: Challenges for Port Traffic and
Regional Market Size. American Journal of Industrial and Business Management, 2014, 4, 234-245
OECD (2017). African Economic Outlook 2017; special theme: entrepreneurship and industrialization. OECD, AfDB,
UNDP, Paris, 2017.
OpenStreets.org 2017 <www.openstreetmap.org>
OSH. (2004). Code of Practice for Health and Safety in Port Operations. Occupational Safety and Health Service
Department of Labour. Retrieved from http://www.maritimenz.govt.nz/Publications-and-forms/Commercial-
operations/Shipping-safety/Health-and-safety/Code-of-Practice-for-Health-and-Safety-in-Port-Operations.pdf
Pascal YEMBILINE, Idrissa DIAGNE, El Allassane BAGUIA, 2017. Côte d’Ivoire; African Economic Outlook 2017.
Perspectives économiques en Afrique © BAfD, OCDE, PNUD 2017 www.africaneconomicoutlook.org.
PIANC. (2008). Climate change and navigation. Waterborne transport, ports and waterways: A review of climate
change drivers, impacts, responses and mitigation. EnviCom Task.
Port of Amsterdam (2017). Business Opportunities in d’Ivoire: Analysis of the Cocoa Sector. PoA International,
Amsterdam
Port Finance International. (2015). MSC Home Terminal has quay cranes heightened. Retrieved from http://
portfinanceinternational.com/categories/technology-design/item/870-msc-home-terminal-has-quay-cranes-
heightened
Ruf, F, N’Dao, Y, Lemeilleur, S., 2013. Certification du cacao : stratégie à hauts risques . Interréseaux. Retrieved
Kolavalli, S and Vigneri, M., 2017. The Board-Managed Cocoa Sector in Ghana. The International Food Policy
Research Institute (IFPRI). Washington, DC
Kosciolek, A. (2014). Big Ships vs. Small Ships: the Pros and Cons of Cruise Ship Size. Cruise Critic. Retrieved from
http://www.cruisecritic.com/v-7/articles.cfm?ID=1646
KPMG, 2012. Cocoa Certification: Study on the costs, advantages and disadvantages of cocoa certification
commissioned by The International Cocoa Organization (ICCO).
Krause, P. (2000). The Beneficial Reuse of Dredged Material for Upland Disposal. Harding Lawson Associates.
Retrieved from http://www.coastal.ca.gov/sediment/reusepaper.pdf
Lam, J. S. L., & Notteboom, T. (2012). The green port toolbox: A comparison of port management tools used by
leading ports in Asia and Europe. International Association of
Laven, A., Buunk, E and Ammerlaan, T (2016). Market Concentration and Price Formation in the Global Cocoa Value
Chain. SEO-report nr. 2016-79A. SEO Amsterdam Economics, Amsterdam.
Law A, Kelton W (1991). Simulation Modelling and Analysis, McGraw-Hill, 2nd Ed.
Lee, B., Trcka, M., & Hensen, J. L. M. (2013). Rooftop photovoltaic (PV) systems: a cost–benefit analysis study of
industrial halls. Oxford Journals. Retrieved from http://ijlct.oxfordjournals.org/content/early/2013/03/19/ijlct.ctt008.
full
Lemeilleur, S, N’Dao, Y, Ruf, F., 2015. The productivist rationality behind a sustainablecertification process: evidence
from the Rainforest Alliance in the Ivorian cocoa sector. International Journal of Sustainable Development, Vol. x, No.
x, xxxx. January 2015
Linham, M. M. (2014). Storm surge barriers and closure dams. Climate Tech Wiki. Retrieved from http://www.
climatetechwiki.org/content/storm-surge-barriers-and-closure-dams
Lipcius, R. N., Eggleston, D. B., Schreiber, S. J., Seitz, R. D., Shen, J., Sisson, M., … Wang, H. V. (2008). Importance
of metapopulation connectivity to restocking and restoration of marine species. Reviews in Fisheries Science.
Maehlum, M. A. (2015). Wind Energy Pros and Cons. Retrieved from http://energyinformative.org/wind-energy-pros-
and-cons/
Maritime Economists (IAME) Conference, Taipei, Taiwan.
Ministerie van Verkeer en Waterstaat. (2010). Hinterland congestion and the role of water transport. Retrieved from
http://kimnet.nl/sites/kimnet.nl/files/summary-hinterland-congestion-and-the-role-of-waterway-transport-for-seaport-
rotterdam.pdf
Monnet, J-M and Le Net, E (2011). Assessment of logistics concept to sustainability: Development of a common
approach to transport issues. European Forest Institute (EFI) Technical Report 75, 2011. Finland.
202 203
REFERENCES
for marine biodiversity. Annual Review of Ecology and Systematics.
Toure, M. A, 2008. Etude sur les Rackets sur les routes en Côte d’Ivoire. Rapport pour le compte de la Banque
Mondiale. Bureau d’études Arc Ingénierie, Abidjan, Côte d’Ivoire.
TPWD. (2015). What is Nature Tourism? Retrieved from https://tpwd.texas.gov/landwater/land/programs/tourism/what_is/
Tsolakis, N. K. et al (2013). Agrifood supply chain management: A comprehensive hierarchical decision-making
framework and critical taxonomy, biobusiness Engineering (2013), Retrieved may 10th 2017 from; http://dx.doi.
org/10.1016/j.biosystemseng.2013.10.014
UNCTAD, 2017. Beyond Austerity; Towards Global New Deal. Trade and Development Report 2017; New York and
Geneva, 2017
UNCTAD, 2015. Commodities and Development Report 2015; Smallholder farmers and sustainable commodity
development. New York and Geneva, 2017
Union Européenne, 1998. San Pedro et son arrière-pays; dynamique et synergies d’une ville portuaire. ENSEA,
IRD-Ex Ostrom et ICEF, Volume 1, Union Européenne, OCDE-PDM et Ministère de l’Intérieur et de l’Intégration
Nationale. Côte d’Ivoire.
UNEP. (2010). Clearing the waters, a focus on water quality solutions. Retrieved from http://www.unep.org/PDF/
Clearing_the_Waters.pdf
UN Trade Facilitation Network, 2005. Transport Intermediaries; Types and Selected Drivers of Efficiency, World Bank
Report, June 2005.
UN, 2015. Opportunities for developing countries. Trade and Development Board. United Nations Conference on
Trade and Development Sustainable freight transport systems. Fourth session Geneva, 14–16 October 2015 Item 3
of the provisional agenda. Note by the UNCTAD secretariat.
UNICTAD, 2017. Review of MAritime Transport, Chapter 4 ‘Ports’. Retrieved 22th of march 2018, from http://
unctad.org/en/PublicationChapters/rmt2017ch4_en.pdf.
USAID, 2012. Impact of Road Transport Industry Liberalization in West Africa. Nathan Associates Inc Arlington,
Virginia. USAID EGAT/EG Office
USAID. (2014). U.S. Overseas Loans and Grants. Retrieved from https://eads.usaid.gov/gbk/
Vilakazi1, T and Paelo, A, 2017. Towards the Integration of Markets; Competition in road transportation of
perishable goods between Malawi, South Africa, Zambia, and Zimbabwe. United Nation University UNU-WIDE,
Working Paper 2017/49
February 2017, from: http://www.interreseaux.org/IMG/pdf/Certification_du_cacao_Ruf_juin2013.pdf
Ruf, F and Jean-Luc Agkpo, J.L,. 2008. Etude sur le revenu et les investissements des producteurs de café et de
cacao en Côte d’Ivoire. Rapport final Mai 2008. Retrieved 27 June 2017 from: http://agritrop.cirad.fr/548837/1/
document_548837.pdf
Schipper, C., Vergouwen, S., de Jong, M., Vreugdenhil, H., de Bel, M., Schasfoort, F., & Minderhoud, S. (2015). Port
of the Future Exploratory Study. Deltares.
SEO, 2016. Market Concentration and Price Formation in the Global Cocoa Value Chain. SEO Amsterdam
Economics, University of Amsterdam. Amsterdam, 15 November 2016
Schwartz, J. et al., 2009. Logistics, Transport and Food Prices in LAC: Policy Guidance for Improving Efficiency and
Reducing Costs. World Bank, Policy Discussion paper No. 87933. August 2009, Number 2
Scyphers, S. et al. (2011). Oyster Reefs as Natural Breakwaters Mitigate Shoreline Loss and Facilitate Fisheries. Plos.
Retrieved from http://journals.plos.org/plosone/article?id=10.1371/journal.pone.0022396
Sheaves, M. (2009). Consequences of ecological connectivity: the coastal ecosystem mosaic. Marine Ecology
Progress Series, 391, 107–115.
Sudmant, A., et al., 2017. Private opportunities, public benefits? The scope for private finance to deliver low carbon
transport systems in Kigali, Rwanda. Urban Climate (2017), http://dx.doi.org/10.1016/j.uclim.2017.02.011
SIMIO 2018: webpage <www.simio.com>
Slaper, T. (2011). The Triple Bottom Line: What Is It and How Does It Work? Indiana Business Review.
Sugawara, T. (2014). China’s Yangshan Port to get $1.79B expansion. Nikkei: Asian Review. Retrieved from http://
asia.nikkei.com/Business/Companies/China-s-Yangshan-Port-to-get-1.79B-expansion
Sullivan, F. O. (2014). Copenhagen Plans to Expand By Building Artificial Islands. The Atlantic CityLab. Retrieved
from http://www.citylab.com/design/2014/12/how-could-copenhagen-increase-city-housing-build-it-on-artificial-
islands/383535/
Tamasin, F, 2017. Cocoa price decrease/collapse 2017: Ivory Coast’s cocoa farmers face financial crisis. BBC News,
Abidjan, 24 February 2017
Teravaninthorn, S, Raballand, G. 2009. Transport Prices and Costs in Africa: A Review of the International
Corridors. Directions in Development; Infrastructure. Washington, DC: World Bank.
Thrush, S. F., & Dayton, P. . (2002). Disturbance to marine benthic habitats by trawling and dredging: implications
204 205
REFERENCES
Van Der Vorst, J.G.A.J. (2006). Performance measurement in agri-food supply chain networks: An overview, in
C.J.M. Ondersteijn, J.H.M. Wijnands, R.B.M. Huirne and O. van Kooten (eds.),Quantifying the agri-food supply
chain, pp.13-24. Springer. the Netherlands.
Weisfeld, M., (2009). The Object-Oriented Thought Process, 3rd ed., USA: Pearson
Education.
World Bank, 1994. Republic of Cote d’lvoire; Private Sector Assessment. Report No. 12885-IVC
World Bank, 2016. Country Policy and Institutional Assessment (CIPIA) Africa (2015); Assessing Africa’s Policies and
Institutions, June 2016. Washington, DC
World bank, 2015. Country partnership framework for the republic of Côte d’Ivoire for the period fy16-fy19, august
17, 2015. The world bank group (for official use only), report no. 96515-ci
World Bank, 2012. Road Freight in Central America; Five Explanations for High Costs of Service Provision. Economics
Unit, Sustainable Development Department, Central America Country Management Unit Latin America and
the Caribbean Region. The World Bank-LAC. Background Paper No. 75100. Multi-donor Trust Fund for Trade
Facilitation (MDTF).
World Bank, 2017. Data for Development: An Evaluation of World Bank Support for Data and Statistical Capacity.
International Bank for Reconstruction and Development / The World Bank, Washington, DC
World Bank (2018). Étude du Racket sur les Routes en Côte d’Ivoire, Technical report,
May, 2018
World Bank. (2012). Inclusive Green Growth: The Pathway to Sustainable Development.
WPCI. (2015a). Environmental Ship Index ESI. Retrieved from http://esi.wpci.nl/Public/Home
WPCI. (2015b). Onshore Power Supply: Power Generation. Retrieved from http://wpci.iaphworldports.org/onshore-
power-supply/what-is-ops/power-generation.html
WPS. (2015). Port of Olympia: Review and History. World Port Source. Retrieved from http://www.worldportsource.
com/ports/review/USA_WA_Port_of_Olympia_197.php
Ying, X., Ding, P., Wang, Z. B., & Van Maren, D. S. (2011). Morphological Impact of the Construction of an Offshore
Yangshan Deepwater Harbour in the Port of Shanghai, China. Retrieved from https://www.deltares.nl/publication/
morphological-impact-construction-offshore-yangshan-deepwater-harbor-port-shanghai-china/
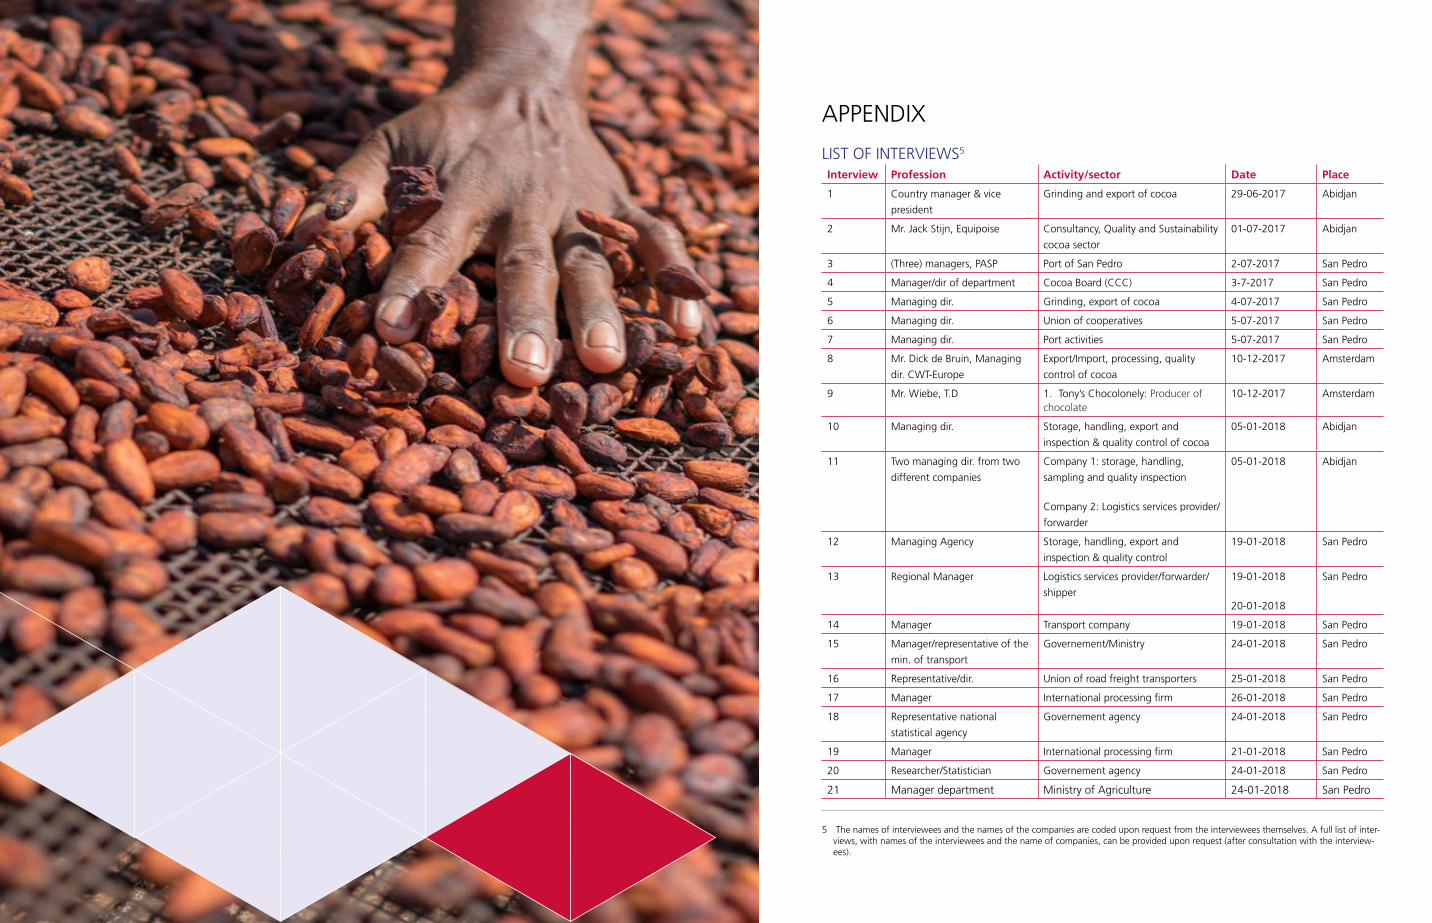
206 207
APPENDIX
APPENDIX
LIST OF INTERVIEWS5 Interview Profession Activity/sector Date Place
1 Country manager & vice
president
Grinding and export of cocoa 29-06-2017 Abidjan
2 Mr. Jack Stijn, Equipoise Consultancy, Quality and Sustainability
cocoa sector
01-07-2017 Abidjan
3 (Three) managers, PASP Port of San Pedro 2-07-2017 San Pedro
4 Manager/dir of department Cocoa Board (CCC) 3-7-2017 San Pedro
5 Managing dir. Grinding, export of cocoa 4-07-2017 San Pedro
6 Managing dir. Union of cooperatives 5-07-2017 San Pedro
7 Managing dir. Port activities 5-07-2017 San Pedro
8 Mr. Dick de Bruin, Managing
dir. CWT-Europe
Export/Import, processing, quality
control of cocoa
10-12-2017 Amsterdam
9 Mr. Wiebe, T.D 1. Tony’s Chocolonely: Producer of chocolate
10-12-2017 Amsterdam
10 Managing dir. Storage, handling, export and
inspection & quality control of cocoa
05-01-2018 Abidjan
11 Two managing dir. from two
different companies
Company 1: storage, handling,
sampling and quality inspection
Company 2: Logistics services provider/
forwarder
05-01-2018 Abidjan
12 Managing Agency Storage, handling, export and
inspection & quality control
19-01-2018 San Pedro
13 Regional Manager Logistics services provider/forwarder/
shipper
19-01-2018
20-01-2018
San Pedro
14 Manager Transport company 19-01-2018 San Pedro
15 Manager/representative of the
min. of transport
Governement/Ministry 24-01-2018 San Pedro
16 Representative/dir. Union of road freight transporters 25-01-2018 San Pedro
17 Manager International processing firm 26-01-2018 San Pedro
18 Representative national
statistical agency
Governement agency 24-01-2018 San Pedro
19 Manager International processing firm 21-01-2018 San Pedro
20 Researcher/Statistician Governement agency 24-01-2018 San Pedro
21 Manager department Ministry of Agriculture 24-01-2018 San Pedro
5 The names of interviewees and the names of the companies are coded upon request from the interviewees themselves. A full list of inter-views, with names of the interviewees and the name of companies, can be provided upon request (after consultation with the interview-ees).
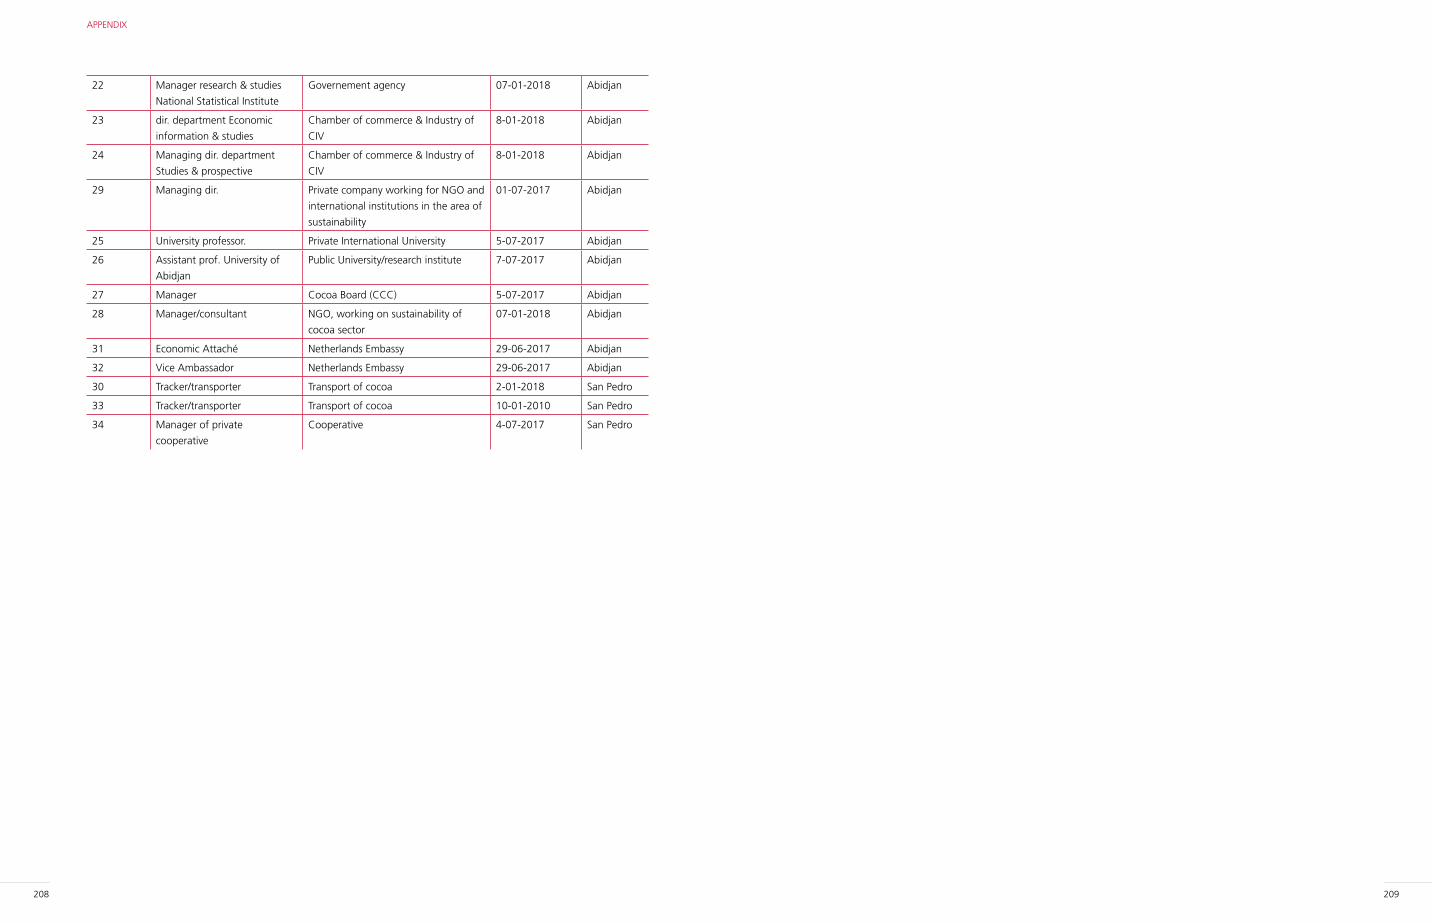
208 209
APPENDIX
22 Manager research & studies
National Statistical Institute
Governement agency 07-01-2018 Abidjan
23 dir. department Economic
information & studies
Chamber of commerce & Industry of
CIV
8-01-2018 Abidjan
24 Managing dir. department
Studies & prospective
Chamber of commerce & Industry of
CIV
8-01-2018 Abidjan
29 Managing dir. Private company working for NGO and
international institutions in the area of
sustainability
01-07-2017 Abidjan
25 University professor. Private International University 5-07-2017 Abidjan
26 Assistant prof. University of
Abidjan
Public University/research institute 7-07-2017 Abidjan
27 Manager Cocoa Board (CCC) 5-07-2017 Abidjan
28 Manager/consultant NGO, working on sustainability of
cocoa sector
07-01-2018 Abidjan
31 Economic Attaché Netherlands Embassy 29-06-2017 Abidjan
32 Vice Ambassador Netherlands Embassy 29-06-2017 Abidjan
30 Tracker/transporter Transport of cocoa 2-01-2018 San Pedro
33 Tracker/transporter Transport of cocoa 10-01-2010 San Pedro
34 Manager of private
cooperative
Cooperative 4-07-2017 San Pedro

210
APPENDIX
Related Documents