SBICAP Research on Bloomberg SBICAP <GO>, www.emis.com Please refer to our disclaimer given at the last page. KEI Industries Ltd Initiating Coverage | Consumer Durables| KEII IN Inst'l Equity Research | India September 14, 2017 Towards a stronger franchise Abhineet Anand +91 22 4227 3310 [email protected] Aakash Fadia +91 22 4227 3460 [email protected] SBICAP Securities Limited Marathon Futurex, A & B Wing, 12 th Floor, N. M. Joshi Marg, Lower Parel, Mumbai -400013. Ph.: 91-22-42273300/01 Email: [email protected]

Welcome message from author
This document is posted to help you gain knowledge. Please leave a comment to let me know what you think about it! Share it to your friends and learn new things together.
Transcript
SBICAP Research on Bloomberg SBICAP <GO>, www.emis.com Please refer to our disclaimer given at the last page.
KEI Industries Ltd Initiating Coverage | Consumer Durables| KEII IN
Inst'l Equity Research | India September 14, 2017
Towards a stronger franchise
Abhineet Anand+91 22 4227 3310
Aakash Fadia+91 22 4227 3460
SBICAP Securities Limited Marathon Futurex, A & B Wing, 12th Floor, N. M. Joshi Marg, Lower Parel, Mumbai -400013. Ph.: 91-22-42273300/01 Email: [email protected]
KEI Industries Ltd SBICAP Securities Ltd
[email protected] I [email protected] September 14, 2017 | 2
Towards a stronger franchise
The management’s strategic choice to strengthen brand visibility and increase penetration will create a strong retail franchise and lay the foundation for long term growth fuelled by multi-year demand drivers like increasing urbanization, nuclearisation, housing, electrification and low penetration of many consumer durables. With presence across the complete range of cables up to 400kV and the forward integration into EPC, KEII is poised to grab opportunities across the retail, institutional and EPC segments. We initiate coverage on KEI Industries (KEII) with a BUY rating and TP of Rs381, as we believe higher proportion of retail business, strong balance sheet and RoE of ~23% demand better valuation.
Positioned to exploit long B2C growth runway: Over the years, KEII has emerged as a strong brand in the retail segment, courtesy the management’s strategic focus on improving visibility through significant network expansion (the number of dealer/distributors has increased nine-fold since 2011), targeted brand awareness (leading actor as brand ambassador and IPL sponsorship), and performance-linked schemes (dealer trips, electricians factory visits, dealer-electrician meets, gold coin schemes and others). KEII is on track to attain ~40-50% of its sales through retail in the next few years vis-à-vis ~30% at present. ‘Housing for All’, urbanization and penetration of consumer durables will help the company achieve ~15% growth in the segment in the medium term.
Forward integration through EPC: With strong Institutional capability across the cable segments, KEII has steadily grown its EPC segment through orders from IPDS, DDUJY, substation projects and underground cabling package for various towns. The EPC order book of ~Rs20bn gives strong sales visibility. Further, with its increased capability (will be able to supply up to 400kV cables from FY18) and capacity (900km from 500km few years back), revenue from the EHV segment is expected to rise to ~Rs4bn by FY20 from ~Rs1bn in FY17.
Strong balance sheet to propel further growth: Utilisation levels at ~70% (HH- 50%, Cables-77%, SS-84%) and strong demand imply expansion is a must. With estimated net debt to equity at ~1x for FY18, we believe KEII is well placed for capacity addition without much increase in leverage.
Valuation and Risks: KEII should re-rate further to capture higher retail presence. We have assigned 18x PE (20x to Retail and 18x to Institutional and 15x for EPC) on FY19e EPS of Rs21.1 and arrive at TP of Rs381. Key risks include high commodity price, competition from unorganized players, delay in government schemes like IPDS and DDUJY etc.
Financial SummaryY/E Dec (Rs mn) FY15 FY16 FY17 FY18e FY19eNet sales 20,310 23,256 26,691 31,881 37,330EBITDA margin (%) 9.5 10.4 10.3 10.4 10.6Adjusted net profit 326 622 986 1,290 1,645Vs. consensus (%) 9.3 11.3Free Cash flow 1,812 876 (579) 1,757 135EPS (Rs) 4.2 8.1 12.7 16.6 21.1growth (%) 180.7 91.0 58.6 30.8 27.5P/E (x) 72.3 37.9 24.1 18.4 14.4P/B (x) 7.8 6.4 5.0 4.0 3.2EV/EBITDA (x) 14.1 11.5 10.9 8.9 7.8D/E 1.2 1.2 1.4 1.1 1.0RoE (%) 11.3 18.6 23.5 24.1 24.4RoCE (%) 15.3 18.7 18.7 17.7 18.5Dividend yield (%) 0.0 0.2 0.2 0.2 0.3Source: Company, SSLe
Rating Target Price (Rs) Upside/Downside (%)
BUY 381 25Market dataCurrent price Rs 306 Mkt capitalisation USDm 371.4Average daily value 3M USDm 2.0
Free float % 48.4Promoter holding % 51.6
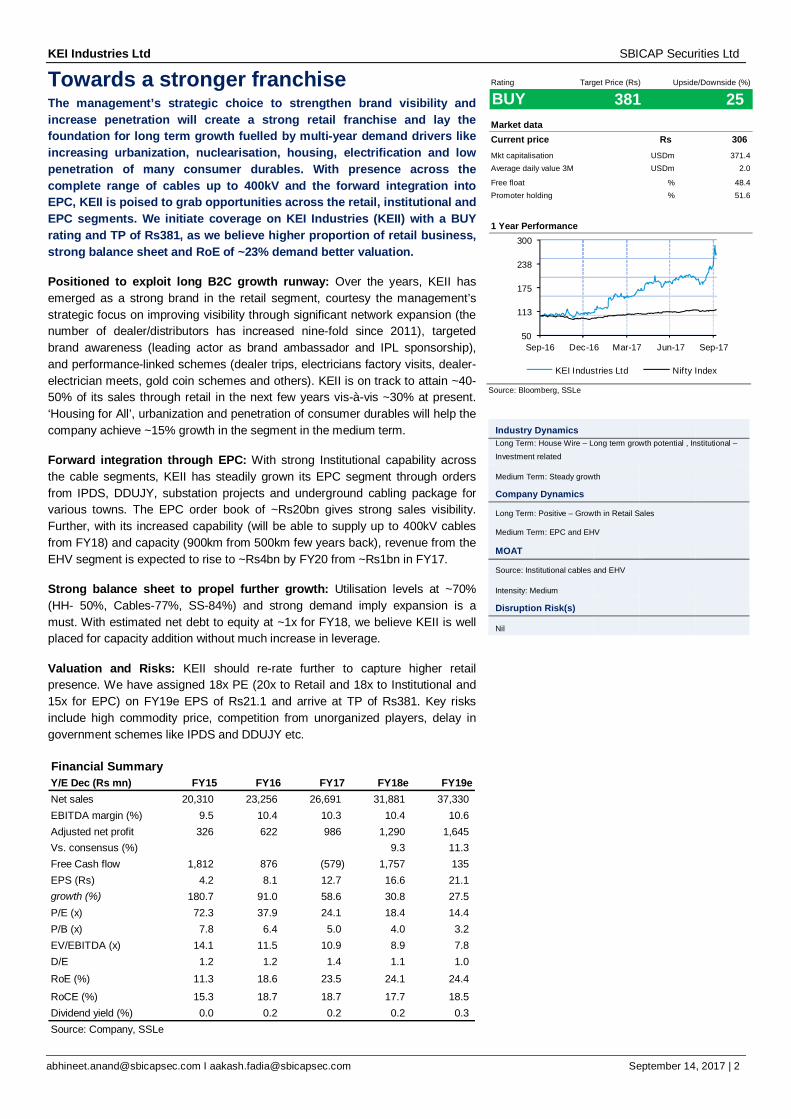
1 Year Performance
Source: Bloomberg, SSLe
Industry Dynamics Long Term: House Wire – Long term growth potential , Institutional – Investment related
Medium Term: Steady growth
Company Dynamics
Long Term: Positive – Growth in Retail Sales Medium Term: EPC and EHV
MOAT
Source: Institutional cables and EHV
Intensity: Medium
Disruption Risk(s)
Nil
50
113
175
238
300
Sep-16 Dec-16 Mar-17 Jun-17 Sep-17
KEI Industries Ltd Nifty Index
KEI Industries Ltd SBICAP Securities Ltd
[email protected] I [email protected] September 14, 2017 | 3
TABLE OF CONTENTS
Focus charts ............................................................................................................ 4
Positioned to exploit long B2C growth runway .......................................................... 5
Institutional sales - Forward integration through EPC.............................................. 12
Strong balance sheet ensures expansion for growth not an issue ........................... 17
Business structure and Manufacturing facilities ...................................................... 20
Milestones ............................................................................................................. 21
Valuation and Risks ............................................................................................... 22
Key Management Profile ........................................................................................ 23
Financials .............................................................................................................. 24

KEI Industries Ltd SBICAP Securities Ltd
[email protected] I [email protected] September 14, 2017 | 4
Focus charts Exhibit 1: Wires and cables market size and key players Exhibit 2: CAGR Sales- HAVL(8%), FNXC(1%),KEI(12%)
0
7,500
15,000
22,500
30,000
Havells Finolex KEI
(Rs
mn)
FY14 FY15 FY16 FY17 Source: Industry, SSL
Exhibit 3: Retail sales have mirrored expansion in dealers Exhibit 4: House hold wire sales on consistent rise
200
450
700
950
1,200
4,000
5,250
6,500
7,750
9,000
FY13 FY14 FY15 FY16 FY17
(Num
ber)
(Rs
mn)
Retail Sales (LHS) No. of dealers (RHS) Source: Company, SSL
Exhibit 5: FY17-19e Sales CAGR of ~18% Exhibit 6: FY17-19e PAT CAGR of ~29%
20,31023,256
26,691
31,881
37,330
8.4
9.1
9.8
10.5
11.2
0
10,000
20,000
30,000
40,000
FY15 FY16 FY17 FY18e FY19e
(%)
(Rs
mn)
Sales-LHS EBITDA margin-RHS
326
622
986
1,290
1,645
0.0
7.5
15.0
22.5
30.0
0
450
900
1,350
1,800
FY15 FY16 FY17 FY18e FY19e
(%)
(Rs
mn)
PAT-LHS RoE-RHS Source: Company, SSL
Polycab25%
Havells13%
Finolex11%
KEI11%
RR Kabel9%
Unorganised + Other
smaller ones31%
1,573
2,114
2,665 2,941
3,366
4,058 4,511
0
10
20
30
40
0
1,200
2,400
3,600
4,800
FY11 FY12 FY13 FY14 FY15 FY16 FY17
(%)
(Rs
mn)
House Wire Sales (LHS) HH wire sales growth (RHS)
KEI Industries Ltd SBICAP Securities Ltd
[email protected] I [email protected] September 14, 2017 | 5
Positioned to exploit long B2C growth runway Over the years, KEII has emerged as a strong brand in the retail segment, courtesy the management’s strategic focus on improving visibility through significant network expansion (the number of dealer/distributors has increased nine-fold since 2011), targeted brand awareness (leading actor as brand ambassador and IPL sponsorship), and performance-linked schemes (dealer trips, electricians’ factory visits, dealer-electrician meets, gold coin schemes and others). KEII is on track to attain ~40-50% of its sales through retail in the next few years vis-à-vis ~30% at present. ‘Housing for All’, urbanization and penetration of consumer durables will help the company achieve ~15% growth in the segment in the medium term.
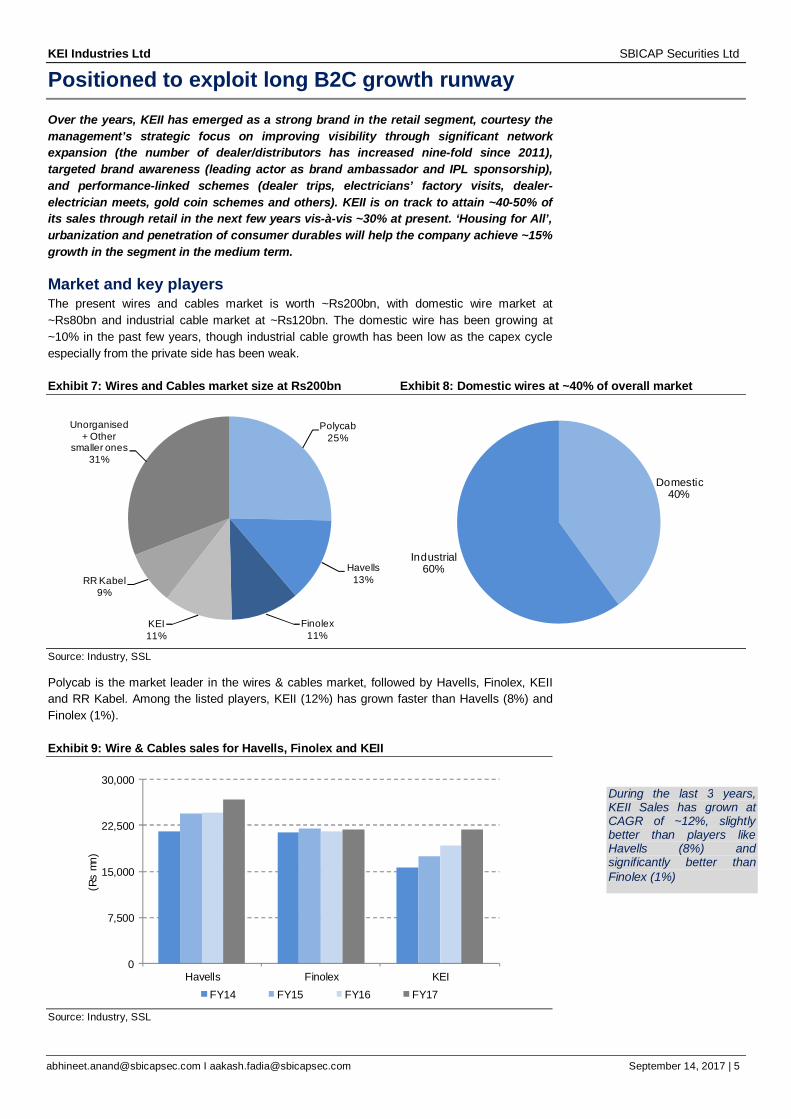
Market and key players The present wires and cables market is worth ~Rs200bn, with domestic wire market at ~Rs80bn and industrial cable market at ~Rs120bn. The domestic wire has been growing at ~10% in the past few years, though industrial cable growth has been low as the capex cycle especially from the private side has been weak.
Exhibit 7: Wires and Cables market size at Rs200bn Exhibit 8: Domestic wires at ~40% of overall market
Source: Industry, SSL
Polycab is the market leader in the wires & cables market, followed by Havells, Finolex, KEII and RR Kabel. Among the listed players, KEII (12%) has grown faster than Havells (8%) and Finolex (1%).
Exhibit 9: Wire & Cables sales for Havells, Finolex and KEII
Source: Industry, SSL
Polycab25%
Havells13%
Finolex11%
KEI11%
RR Kabel9%
Unorganised + Other
smaller ones31%
Domestic40%
Industrial60%
0
7,500
15,000
22,500
30,000
Havells Finolex KEI
(Rs
mn)
FY14 FY15 FY16 FY17
During the last 3 years, KEII Sales has grown at CAGR of ~12%, slightly better than players like Havells (8%) and significantly better than Finolex (1%)
KEI Industries Ltd SBICAP Securities Ltd
[email protected] I [email protected] September 14, 2017 | 6
Growth drivers – huge opportunity awaits The overall consumer durables market along with house wires is expected to grow in the 11-12% range over the medium term as per various projections. Urbanisation, electrification, nuclearisation, low penetration levels of various products and impetus to housing (including government schemes) are key drivers of demand for the house wires.
Urbanisation levels in India on rise
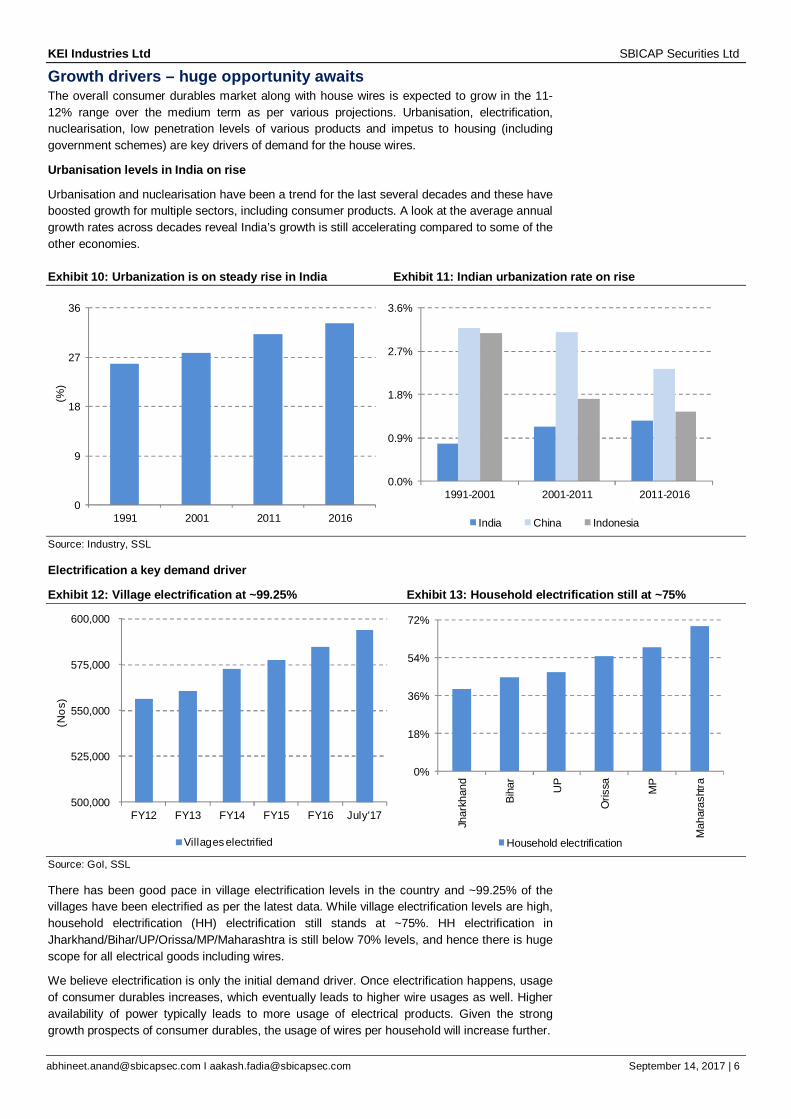
Urbanisation and nuclearisation have been a trend for the last several decades and these have boosted growth for multiple sectors, including consumer products. A look at the average annual growth rates across decades reveal India’s growth is still accelerating compared to some of the other economies.
Exhibit 10: Urbanization is on steady rise in India Exhibit 11: Indian urbanization rate on rise
Source: Industry, SSL
Electrification a key demand driver
Exhibit 12: Village electrification at ~99.25% Exhibit 13: Household electrification still at ~75%
500,000
525,000
550,000
575,000
600,000
FY12 FY13 FY14 FY15 FY16 July'17
(Nos
)
Villages electrified Source: GoI, SSL
There has been good pace in village electrification levels in the country and ~99.25% of the villages have been electrified as per the latest data. While village electrification levels are high, household electrification (HH) electrification still stands at ~75%. HH electrification in Jharkhand/Bihar/UP/Orissa/MP/Maharashtra is still below 70% levels, and hence there is huge scope for all electrical goods including wires.
We believe electrification is only the initial demand driver. Once electrification happens, usage of consumer durables increases, which eventually leads to higher wire usages as well. Higher availability of power typically leads to more usage of electrical products. Given the strong growth prospects of consumer durables, the usage of wires per household will increase further.
0
9
18
27
36
1991 2001 2011 2016
(%)
0.0%
0.9%
1.8%
2.7%
3.6%
1991-2001 2001-2011 2011-2016
India China Indonesia
0%
18%
36%
54%
72%
Jhar
khan
d
Biha
r
UP
Oris
sa MP
Mah
aras
htra
Household electrification
KEI Industries Ltd SBICAP Securities Ltd
[email protected] I [email protected] September 14, 2017 | 7
Exhibit 14: Rise in electrification and TV usage Exhibit 15: Abysmally low penetration of several appliances
0
20
40
60
80
2001 2011 2017
(%)
Household using electricity Household using Television0
3
6
9
12
AC Washing Machine Geyser Air cooler
(%)
Source: Industry, SSL
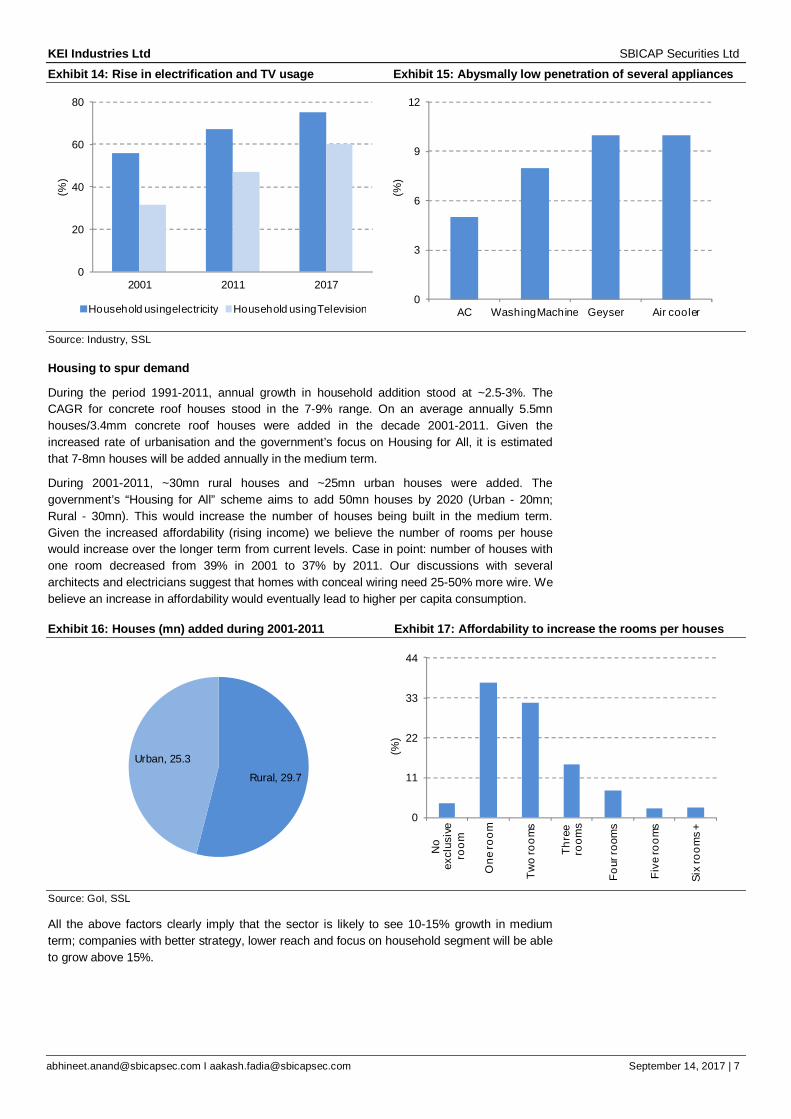
Housing to spur demand
During the period 1991-2011, annual growth in household addition stood at ~2.5-3%. The CAGR for concrete roof houses stood in the 7-9% range. On an average annually 5.5mn houses/3.4mm concrete roof houses were added in the decade 2001-2011. Given the increased rate of urbanisation and the government’s focus on Housing for All, it is estimated that 7-8mn houses will be added annually in the medium term.
During 2001-2011, ~30mn rural houses and ~25mn urban houses were added. The government’s “Housing for All” scheme aims to add 50mn houses by 2020 (Urban - 20mn; Rural - 30mn). This would increase the number of houses being built in the medium term. Given the increased affordability (rising income) we believe the number of rooms per house would increase over the longer term from current levels. Case in point: number of houses with one room decreased from 39% in 2001 to 37% by 2011. Our discussions with several architects and electricians suggest that homes with conceal wiring need 25-50% more wire. We believe an increase in affordability would eventually lead to higher per capita consumption.
Exhibit 16: Houses (mn) added during 2001-2011 Exhibit 17: Affordability to increase the rooms per houses
0
11
22
33
44
No
excl
usiv
e ro
om
One
room
Two
room
s
Thre
e ro
oms
Four
room
s
Five
room
s
Six
room
s +
(%)
Source: GoI, SSL
All the above factors clearly imply that the sector is likely to see 10-15% growth in medium term; companies with better strategy, lower reach and focus on household segment will be able to grow above 15%.
Rural, 29.7
Urban, 25.3
KEI Industries Ltd SBICAP Securities Ltd
[email protected] I [email protected] September 14, 2017 | 8
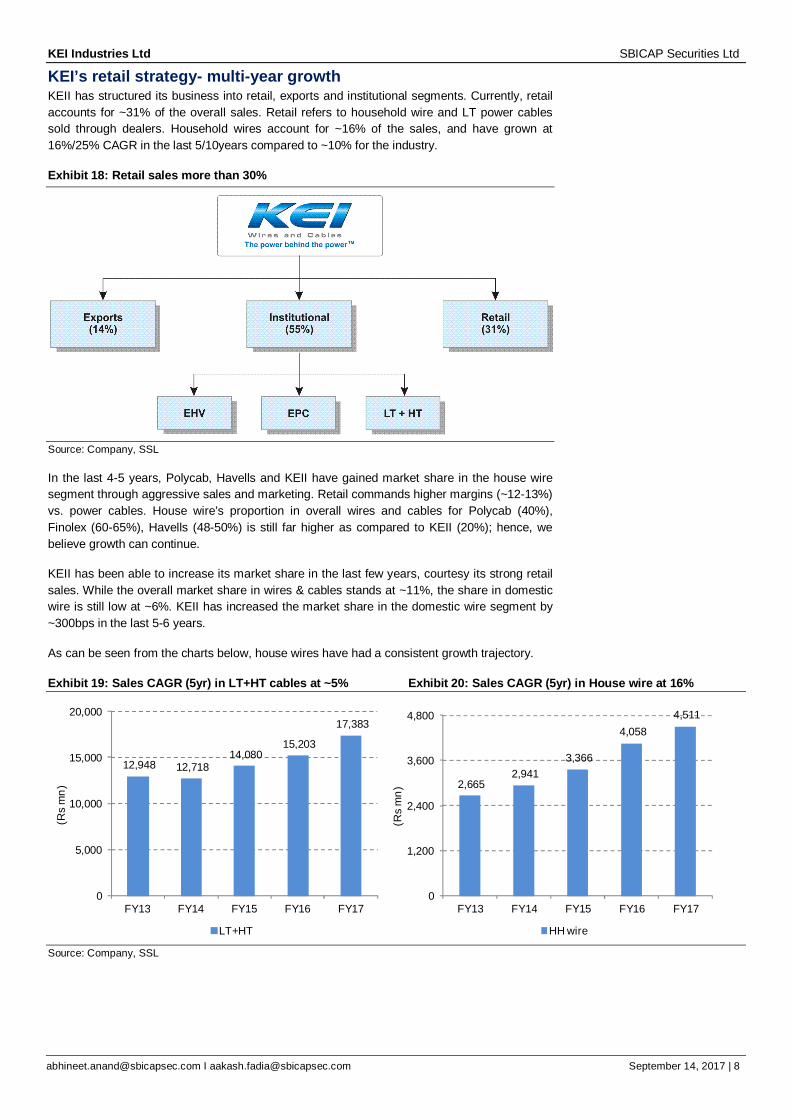
KEI’s retail strategy- multi-year growth KEII has structured its business into retail, exports and institutional segments. Currently, retail accounts for ~31% of the overall sales. Retail refers to household wire and LT power cables sold through dealers. Household wires account for ~16% of the sales, and have grown at 16%/25% CAGR in the last 5/10years compared to ~10% for the industry.
Exhibit 18: Retail sales more than 30%
Source: Company, SSL
In the last 4-5 years, Polycab, Havells and KEII have gained market share in the house wire segment through aggressive sales and marketing. Retail commands higher margins (~12-13%) vs. power cables. House wire’s proportion in overall wires and cables for Polycab (40%), Finolex (60-65%), Havells (48-50%) is still far higher as compared to KEII (20%); hence, we believe growth can continue.
KEII has been able to increase its market share in the last few years, courtesy its strong retail sales. While the overall market share in wires & cables stands at ~11%, the share in domestic wire is still low at ~6%. KEII has increased the market share in the domestic wire segment by ~300bps in the last 5-6 years.
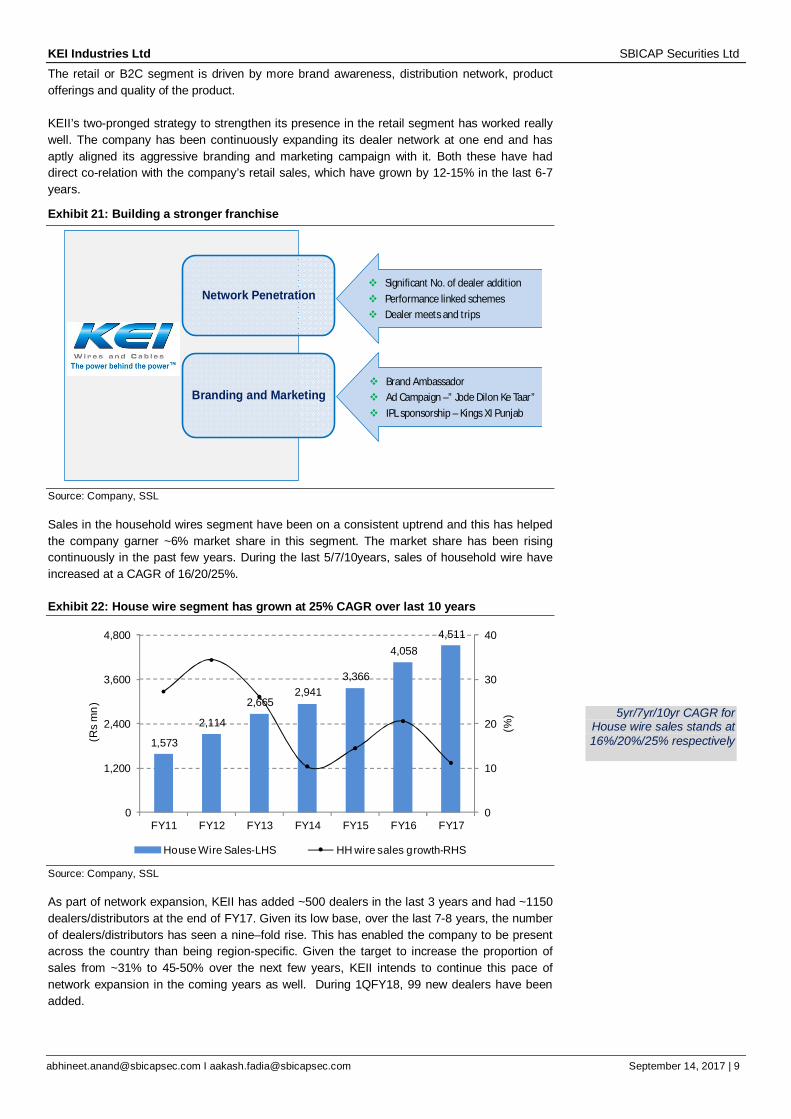
As can be seen from the charts below, house wires have had a consistent growth trajectory.
Exhibit 19: Sales CAGR (5yr) in LT+HT cables at ~5% Exhibit 20: Sales CAGR (5yr) in House wire at 16%
Source: Company, SSL
12,948 12,718 14,080
15,203
17,383
0
5,000
10,000
15,000
20,000
FY13 FY14 FY15 FY16 FY17
(Rs
mn)
LT+HT
2,665 2,941
3,366
4,058 4,511
0
1,200
2,400
3,600
4,800
FY13 FY14 FY15 FY16 FY17
(Rs
mn)
HH wire
KEI Industries Ltd SBICAP Securities Ltd
[email protected] I [email protected] September 14, 2017 | 9
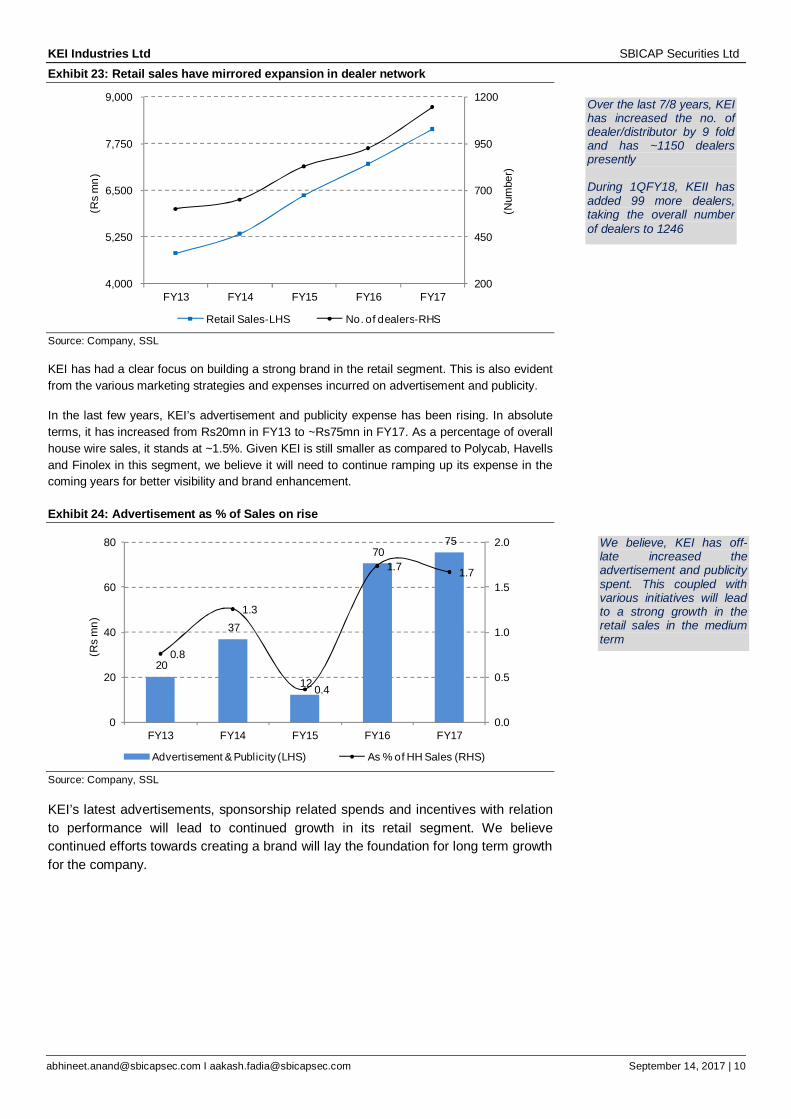
The retail or B2C segment is driven by more brand awareness, distribution network, product offerings and quality of the product. KEII’s two-pronged strategy to strengthen its presence in the retail segment has worked really well. The company has been continuously expanding its dealer network at one end and has aptly aligned its aggressive branding and marketing campaign with it. Both these have had direct co-relation with the company’s retail sales, which have grown by 12-15% in the last 6-7 years.
Exhibit 21: Building a stronger franchise
Source: Company, SSL
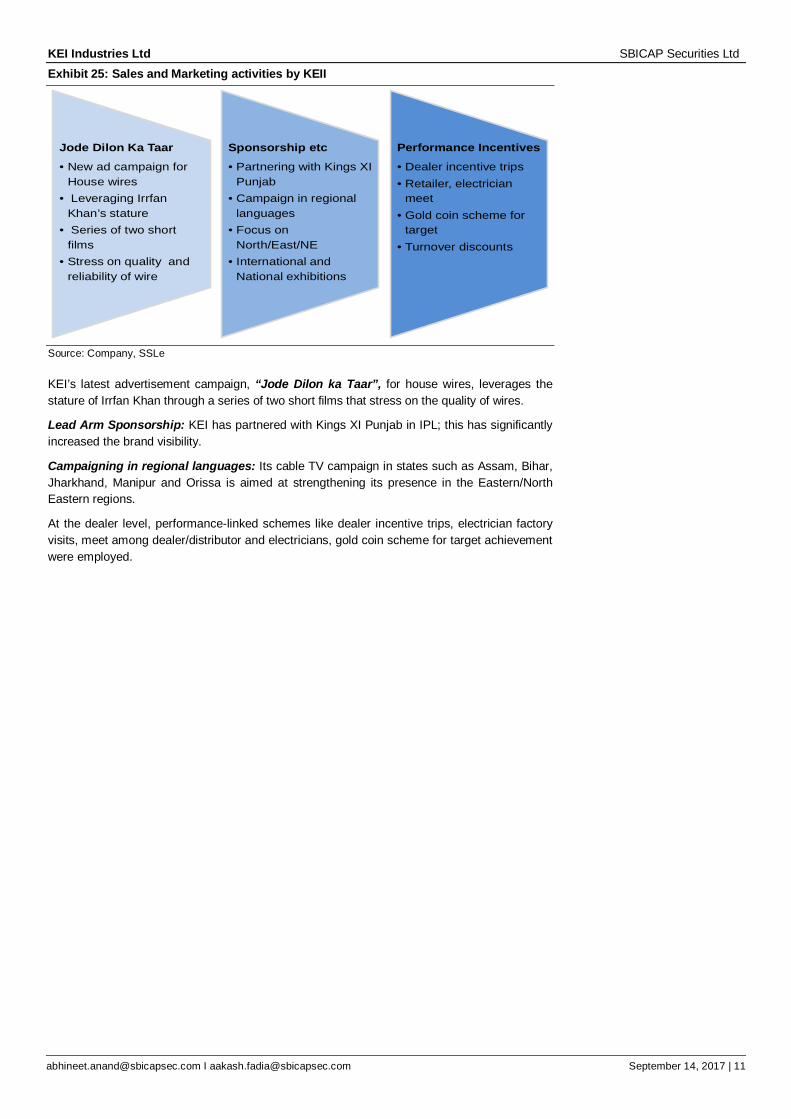
Sales in the household wires segment have been on a consistent uptrend and this has helped the company garner ~6% market share in this segment. The market share has been rising continuously in the past few years. During the last 5/7/10years, sales of household wire have increased at a CAGR of 16/20/25%.
Exhibit 22: House wire segment has grown at 25% CAGR over last 10 years
Source: Company, SSL
As part of network expansion, KEII has added ~500 dealers in the last 3 years and had ~1150 dealers/distributors at the end of FY17. Given its low base, over the last 7-8 years, the number of dealers/distributors has seen a nine–fold rise. This has enabled the company to be present across the country than being region-specific. Given the target to increase the proportion of sales from ~31% to 45-50% over the next few years, KEII intends to continue this pace of network expansion in the coming years as well. During 1QFY18, 99 new dealers have been added.
Network Penetration
Branding and Marketing
Significant No. of dealer addition Performance linked schemes Dealer meets and trips
Brand Ambassador Ad Campaign –” Jode Dilon Ke Taar” IPL sponsorship – Kings XI Punjab
1,573
2,114
2,665 2,941
3,366
4,058 4,511
0
10
20
30
40
0
1,200
2,400
3,600
4,800
FY11 FY12 FY13 FY14 FY15 FY16 FY17
(%)
(Rs
mn)
House Wire Sales-LHS HH wire sales growth-RHS
5yr/7yr/10yr CAGR for House wire sales stands at 16%/20%/25% respectively
KEI Industries Ltd SBICAP Securities Ltd
[email protected] I [email protected] September 14, 2017 | 10
Exhibit 23: Retail sales have mirrored expansion in dealer network
Source: Company, SSL
KEI has had a clear focus on building a strong brand in the retail segment. This is also evident from the various marketing strategies and expenses incurred on advertisement and publicity.
In the last few years, KEI’s advertisement and publicity expense has been rising. In absolute terms, it has increased from Rs20mn in FY13 to ~Rs75mn in FY17. As a percentage of overall house wire sales, it stands at ~1.5%. Given KEI is still smaller as compared to Polycab, Havells and Finolex in this segment, we believe it will need to continue ramping up its expense in the coming years for better visibility and brand enhancement.
Exhibit 24: Advertisement as % of Sales on rise
20
37
12
70 75
0.8
1.3
0.4
1.7 1.7
0.0
0.5
1.0
1.5
2.0
0
20
40
60
80
FY13 FY14 FY15 FY16 FY17
(Rs
mn)
Advertisement & Publicity (LHS) As % of HH Sales (RHS) Source: Company, SSL
KEI’s latest advertisements, sponsorship related spends and incentives with relation to performance will lead to continued growth in its retail segment. We believe continued efforts towards creating a brand will lay the foundation for long term growth for the company.
200
450
700
950
1200
4,000
5,250
6,500
7,750
9,000
FY13 FY14 FY15 FY16 FY17
(Num
ber)
(Rs
mn)
Retail Sales-LHS No. of dealers-RHS
Over the last 7/8 years, KEI has increased the no. of dealer/distributor by 9 fold and has ~1150 dealers presently During 1QFY18, KEII has added 99 more dealers, taking the overall number of dealers to 1246
We believe, KEI has off-late increased the advertisement and publicity spent. This coupled with various initiatives will lead to a strong growth in the retail sales in the medium term
KEI Industries Ltd SBICAP Securities Ltd
[email protected] I [email protected] September 14, 2017 | 11
Exhibit 25: Sales and Marketing activities by KEII
Source: Company, SSLe
KEI’s latest advertisement campaign, “Jode Dilon ka Taar”, for house wires, leverages the stature of Irrfan Khan through a series of two short films that stress on the quality of wires.
Lead Arm Sponsorship: KEI has partnered with Kings XI Punjab in IPL; this has significantly increased the brand visibility.
Campaigning in regional languages: Its cable TV campaign in states such as Assam, Bihar, Jharkhand, Manipur and Orissa is aimed at strengthening its presence in the Eastern/North Eastern regions.
At the dealer level, performance-linked schemes like dealer incentive trips, electrician factory visits, meet among dealer/distributor and electricians, gold coin scheme for target achievement were employed.
Jode Dilon Ka Taar• New ad campaign for
House wires• Leveraging Irrfan
Khan’s stature• Series of two short
films• Stress on quality and
reliability of wire
Sponsorship etc• Partnering with Kings XI
Punjab• Campaign in regional
languages• Focus on
North/East/NE• International and
National exhibitions
Performance Incentives• Dealer incentive trips• Retailer, electrician
meet• Gold coin scheme for
target• Turnover discounts
KEI Industries Ltd SBICAP Securities Ltd
[email protected] I [email protected] September 14, 2017 | 12
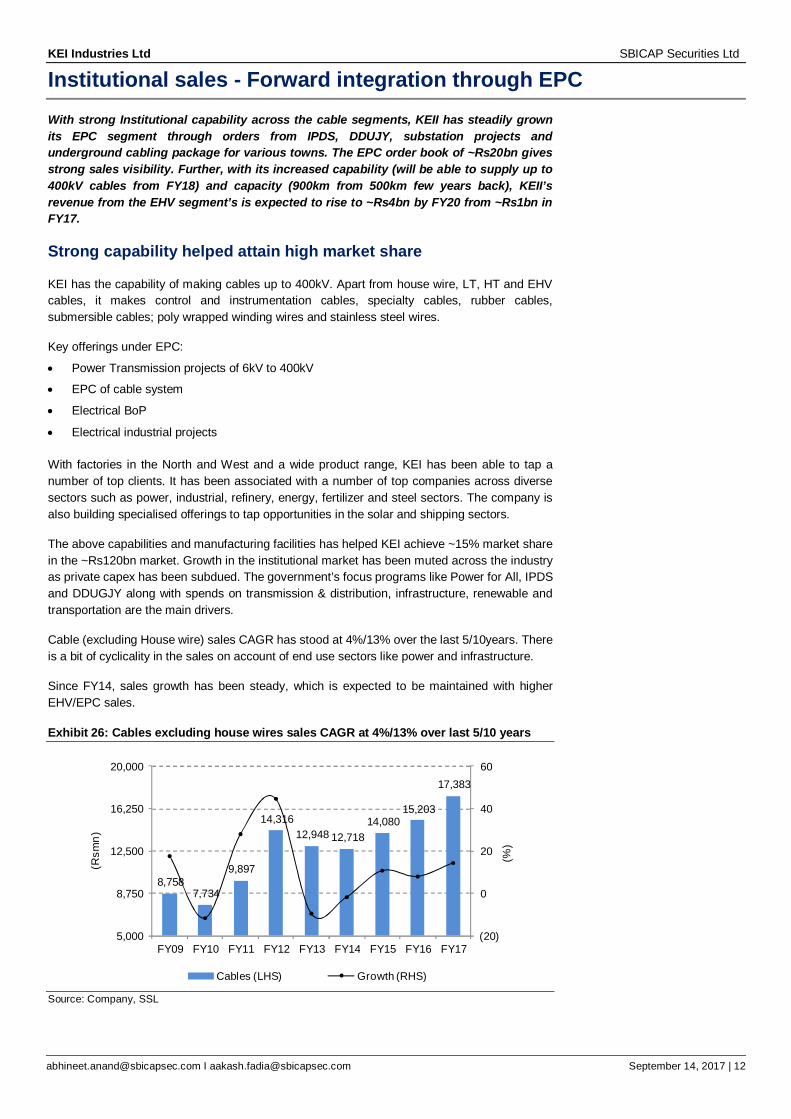
Institutional sales - Forward integration through EPC With strong Institutional capability across the cable segments, KEII has steadily grown its EPC segment through orders from IPDS, DDUJY, substation projects and underground cabling package for various towns. The EPC order book of ~Rs20bn gives strong sales visibility. Further, with its increased capability (will be able to supply up to 400kV cables from FY18) and capacity (900km from 500km few years back), KEII’s revenue from the EHV segment’s is expected to rise to ~Rs4bn by FY20 from ~Rs1bn in FY17.
Strong capability helped attain high market share
KEI has the capability of making cables up to 400kV. Apart from house wire, LT, HT and EHV cables, it makes control and instrumentation cables, specialty cables, rubber cables, submersible cables; poly wrapped winding wires and stainless steel wires.
Key offerings under EPC:
Power Transmission projects of 6kV to 400kV
EPC of cable system
Electrical BoP
Electrical industrial projects
With factories in the North and West and a wide product range, KEI has been able to tap a number of top clients. It has been associated with a number of top companies across diverse sectors such as power, industrial, refinery, energy, fertilizer and steel sectors. The company is also building specialised offerings to tap opportunities in the solar and shipping sectors.
The above capabilities and manufacturing facilities has helped KEI achieve ~15% market share in the ~Rs120bn market. Growth in the institutional market has been muted across the industry as private capex has been subdued. The government’s focus programs like Power for All, IPDS and DDUGJY along with spends on transmission & distribution, infrastructure, renewable and transportation are the main drivers.
Cable (excluding House wire) sales CAGR has stood at 4%/13% over the last 5/10years. There is a bit of cyclicality in the sales on account of end use sectors like power and infrastructure.
Since FY14, sales growth has been steady, which is expected to be maintained with higher EHV/EPC sales.
Exhibit 26: Cables excluding house wires sales CAGR at 4%/13% over last 5/10 years
Source: Company, SSL
8,758 7,734
9,897
14,316 12,948 12,718
14,080 15,203
17,383
(20)
0
20
40
60
5,000
8,750
12,500
16,250
20,000
FY09 FY10 FY11 FY12 FY13 FY14 FY15 FY16 FY17
(%)
(Rsm
n)
Cables (LHS) Growth (RHS)

KEI Industries Ltd SBICAP Securities Ltd
[email protected] I [email protected] September 14, 2017 | 13
EPC- strong order book to fuel medium term growth
KEII’s strategy to enter EPC (started in FY10) as a forward integration would help it grow faster (as new revenue stream) with effective use of present cable capacity (cable accounts for ~30% in EPC done by KEII).
Exhibit 27: EPC to add to overall growth in medium term
Source: Company, SSL
Sales in the EPC segment have increased steadily over the years through orders from IPDS, DDUGJY, substation projects and underground cabling package for various towns, and are expected to reach ~Rs10bn in FY19. Importantly, cables account for ~25-30% of EPC contracts, which is in house. As the company has attained a certain level of revenue in the EPC segment (since FY15), PBIT margin has been in the ~10-12% range.
The EPC order book of ~Rs20bn gives strong sales visibility. Further, with its increased capability (will be able to supply up to 400KV cables from FY18) and capacity (900km from 500km few years back) in the EHV segment, it is expected to clock ~Rs4bn revenue by FY19 in this segment vis-à-vis ~Rs1bn currently.
Exhibit 28: 3 year CAGR in order book at 32% Exhibit 29: EPC book (Rs mn) to ensure strong growth
Source: Company, SSL
One of the key aspects in any EPC business is the management of working capital, as typically, the payment cycle for states is not very predictable. We have studied how the New Working Capital (NWC) has moved for the company in the last 5 years.
FY12-FY15: During this period, NWC remained in the Rs3.5-4.5bn range, and accounted for ~21% of sales.
808 1,469
947
3,567
5,893 6,566
(5)
0
5
10
15
0
2,000
4,000
6,000
8,000
FY12 FY13 FY14 FY15 FY16 FY17
(%)
(Rs
mn)
EPC revenue (LHS) PBIT margin (RHS)
4,600
12,000
17,000 17,600
27,830
0
7,500
15,000
22,500
30,000
FY13 FY14 FY15 FY16 FY17
(Rs
mn)
Order book
EPC, 19,940
Cables, 4,320
EHV, 2,290
Exports, 1,280
Of the Rs6.5bn EPC revenue, ~Rs1.8bn was on account of cables. We expect EPC sales to reach ~Rs10bn by FY19.
KEI Industries Ltd SBICAP Securities Ltd
[email protected] I [email protected] September 14, 2017 | 14
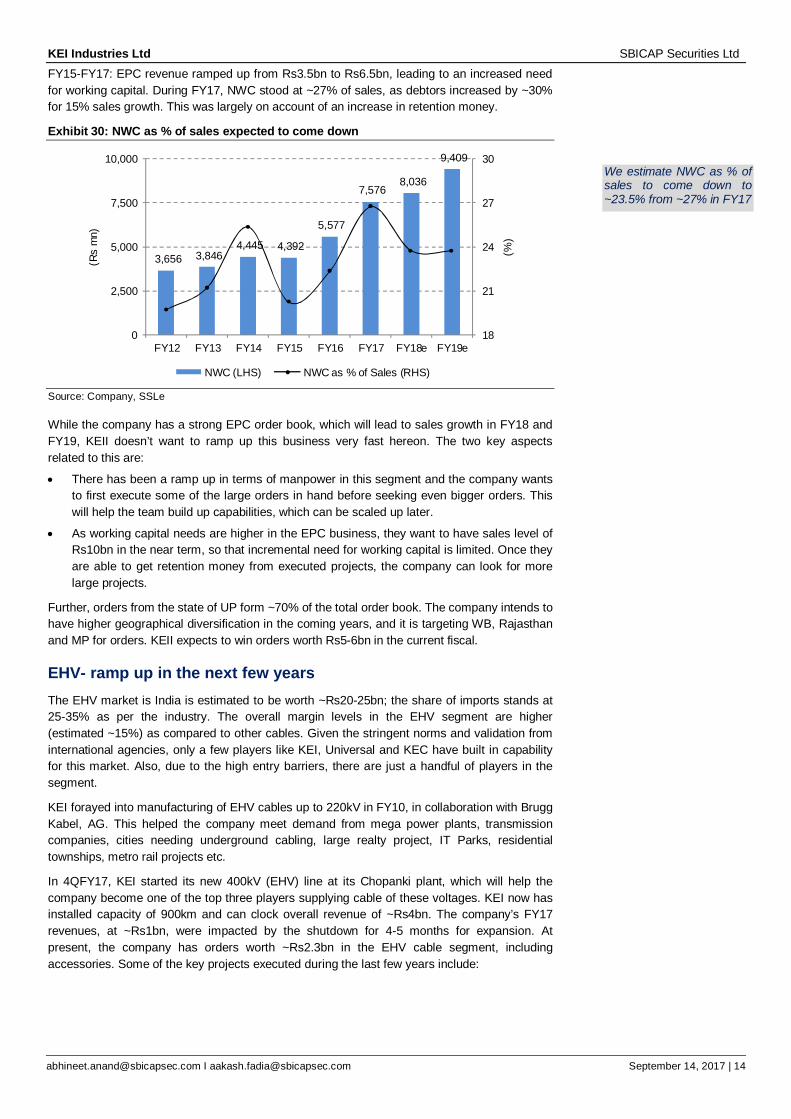
FY15-FY17: EPC revenue ramped up from Rs3.5bn to Rs6.5bn, leading to an increased need for working capital. During FY17, NWC stood at ~27% of sales, as debtors increased by ~30% for 15% sales growth. This was largely on account of an increase in retention money.
Exhibit 30: NWC as % of sales expected to come down
Source: Company, SSLe
While the company has a strong EPC order book, which will lead to sales growth in FY18 and FY19, KEII doesn’t want to ramp up this business very fast hereon. The two key aspects related to this are:
There has been a ramp up in terms of manpower in this segment and the company wants to first execute some of the large orders in hand before seeking even bigger orders. This will help the team build up capabilities, which can be scaled up later.
As working capital needs are higher in the EPC business, they want to have sales level of Rs10bn in the near term, so that incremental need for working capital is limited. Once they are able to get retention money from executed projects, the company can look for more large projects.
Further, orders from the state of UP form ~70% of the total order book. The company intends to have higher geographical diversification in the coming years, and it is targeting WB, Rajasthan and MP for orders. KEII expects to win orders worth Rs5-6bn in the current fiscal.
EHV- ramp up in the next few years The EHV market is India is estimated to be worth ~Rs20-25bn; the share of imports stands at 25-35% as per the industry. The overall margin levels in the EHV segment are higher (estimated ~15%) as compared to other cables. Given the stringent norms and validation from international agencies, only a few players like KEI, Universal and KEC have built in capability for this market. Also, due to the high entry barriers, there are just a handful of players in the segment.
KEI forayed into manufacturing of EHV cables up to 220kV in FY10, in collaboration with Brugg Kabel, AG. This helped the company meet demand from mega power plants, transmission companies, cities needing underground cabling, large realty project, IT Parks, residential townships, metro rail projects etc.
In 4QFY17, KEI started its new 400kV (EHV) line at its Chopanki plant, which will help the company become one of the top three players supplying cable of these voltages. KEI now has installed capacity of 900km and can clock overall revenue of ~Rs4bn. The company’s FY17 revenues, at ~Rs1bn, were impacted by the shutdown for 4-5 months for expansion. At present, the company has orders worth ~Rs2.3bn in the EHV cable segment, including accessories. Some of the key projects executed during the last few years include:
3,656 3,846 4,445 4,392
5,577
7,576 8,036
9,409
18
21
24
27
30
0
2,500
5,000
7,500
10,000
FY12 FY13 FY14 FY15 FY16 FY17 FY18e FY19e
(%)
(Rs
mn)
NWC (LHS) NWC as % of Sales (RHS)
We estimate NWC as % of sales to come down to ~23.5% from ~27% in FY17
KEI Industries Ltd SBICAP Securities Ltd
[email protected] I [email protected] September 14, 2017 | 15
Exhibit 31: Key orders in EPC and EHV
Source: Company, SSL
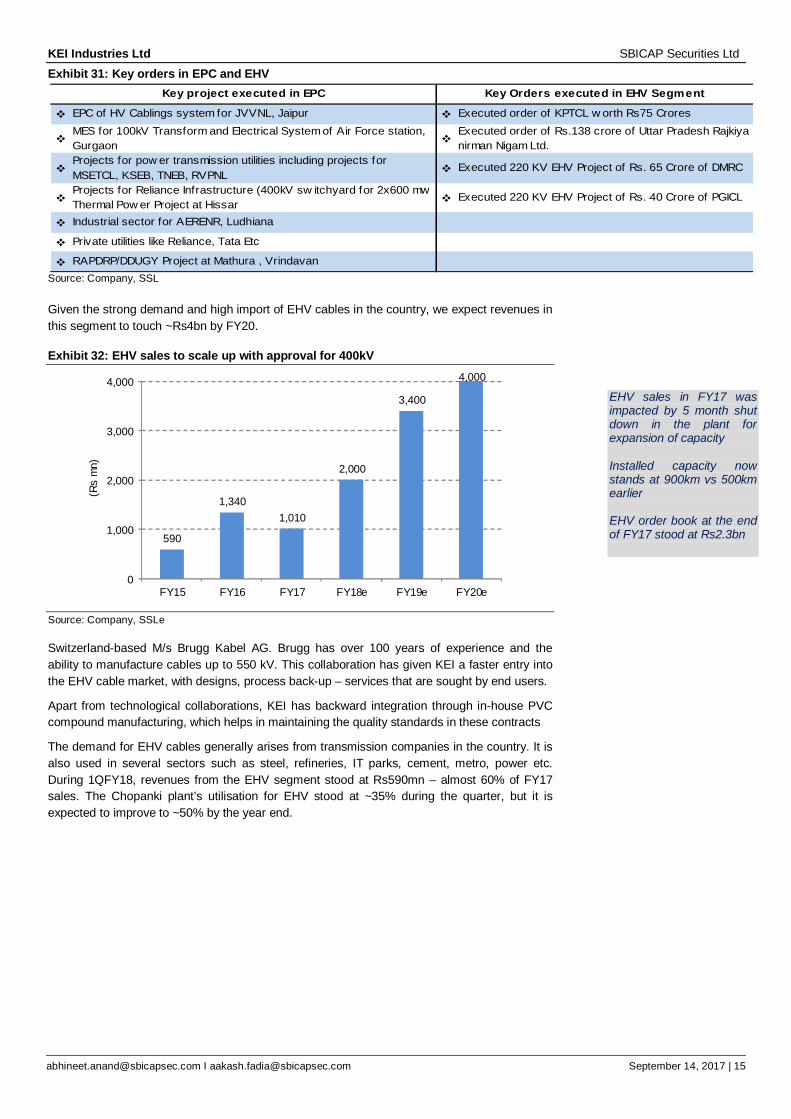
Given the strong demand and high import of EHV cables in the country, we expect revenues in this segment to touch ~Rs4bn by FY20.
Exhibit 32: EHV sales to scale up with approval for 400kV
590
1,3401,010
2,000
3,400
4,000
0
1,000
2,000
3,000
4,000
FY15 FY16 FY17 FY18e FY19e FY20e
(Rs
mn)
Source: Company, SSLe
Switzerland-based M/s Brugg Kabel AG. Brugg has over 100 years of experience and the ability to manufacture cables up to 550 kV. This collaboration has given KEI a faster entry into the EHV cable market, with designs, process back-up – services that are sought by end users.
Apart from technological collaborations, KEI has backward integration through in-house PVC compound manufacturing, which helps in maintaining the quality standards in these contracts
The demand for EHV cables generally arises from transmission companies in the country. It is also used in several sectors such as steel, refineries, IT parks, cement, metro, power etc. During 1QFY18, revenues from the EHV segment stood at Rs590mn – almost 60% of FY17 sales. The Chopanki plant’s utilisation for EHV stood at ~35% during the quarter, but it is expected to improve to ~50% by the year end.
EPC of HV Cablings system for JVVNL, Jaipur Executed order of KPTCL w orth Rs75 Crores
MES for 100kV Transform and Electrical System of Air Force station, Gurgaon
Executed order of Rs.138 crore of Uttar Pradesh Rajkiya nirman Nigam Ltd.
Projects for pow er transmission utilities including projects for MSETCL, KSEB, TNEB, RVPNL Executed 220 KV EHV Project of Rs. 65 Crore of DMRC
Projects for Reliance Infrastructure (400kV sw itchyard for 2x600 mw Thermal Pow er Project at Hissar Executed 220 KV EHV Project of Rs. 40 Crore of PGICL
Industrial sector for AERENR, Ludhiana
Private utilities like Reliance, Tata Etc
RAPDRP/DDUGY Project at Mathura , Vrindavan
Key project executed in EPC Key Orders executed in EHV Segment
EHV sales in FY17 was impacted by 5 month shut down in the plant for expansion of capacity Installed capacity now stands at 900km vs 500km earlier EHV order book at the end of FY17 stood at Rs2.3bn
KEI Industries Ltd SBICAP Securities Ltd
[email protected] I [email protected] September 14, 2017 | 16
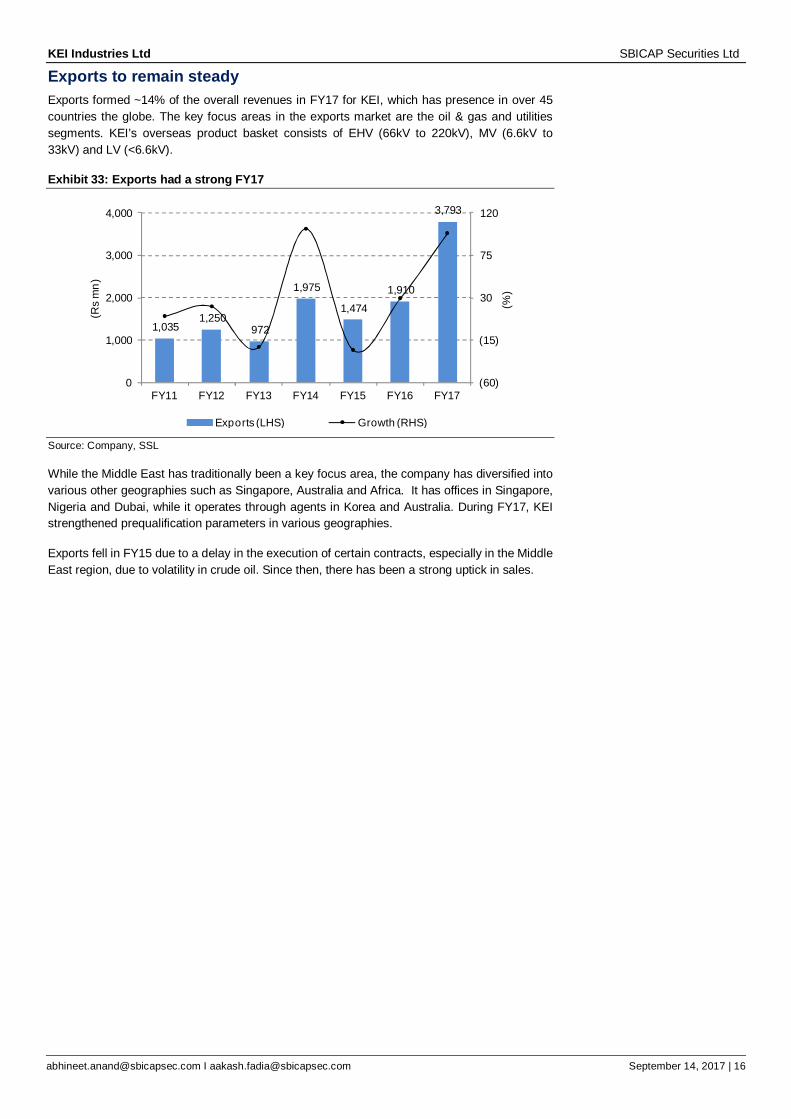
Exports to remain steady Exports formed ~14% of the overall revenues in FY17 for KEI, which has presence in over 45 countries the globe. The key focus areas in the exports market are the oil & gas and utilities segments. KEI’s overseas product basket consists of EHV (66kV to 220kV), MV (6.6kV to 33kV) and LV (<6.6kV).
Exhibit 33: Exports had a strong FY17
1,035 1,250
972
1,975
1,474 1,910
3,793
(60)
(15)
30
75
120
0
1,000
2,000
3,000
4,000
FY11 FY12 FY13 FY14 FY15 FY16 FY17
(%)
(Rs
mn)
Exports (LHS) Growth (RHS) Source: Company, SSL
While the Middle East has traditionally been a key focus area, the company has diversified into various other geographies such as Singapore, Australia and Africa. It has offices in Singapore, Nigeria and Dubai, while it operates through agents in Korea and Australia. During FY17, KEI strengthened prequalification parameters in various geographies.
Exports fell in FY15 due to a delay in the execution of certain contracts, especially in the Middle East region, due to volatility in crude oil. Since then, there has been a strong uptick in sales.
KEI Industries Ltd SBICAP Securities Ltd
[email protected] I [email protected] September 14, 2017 | 17
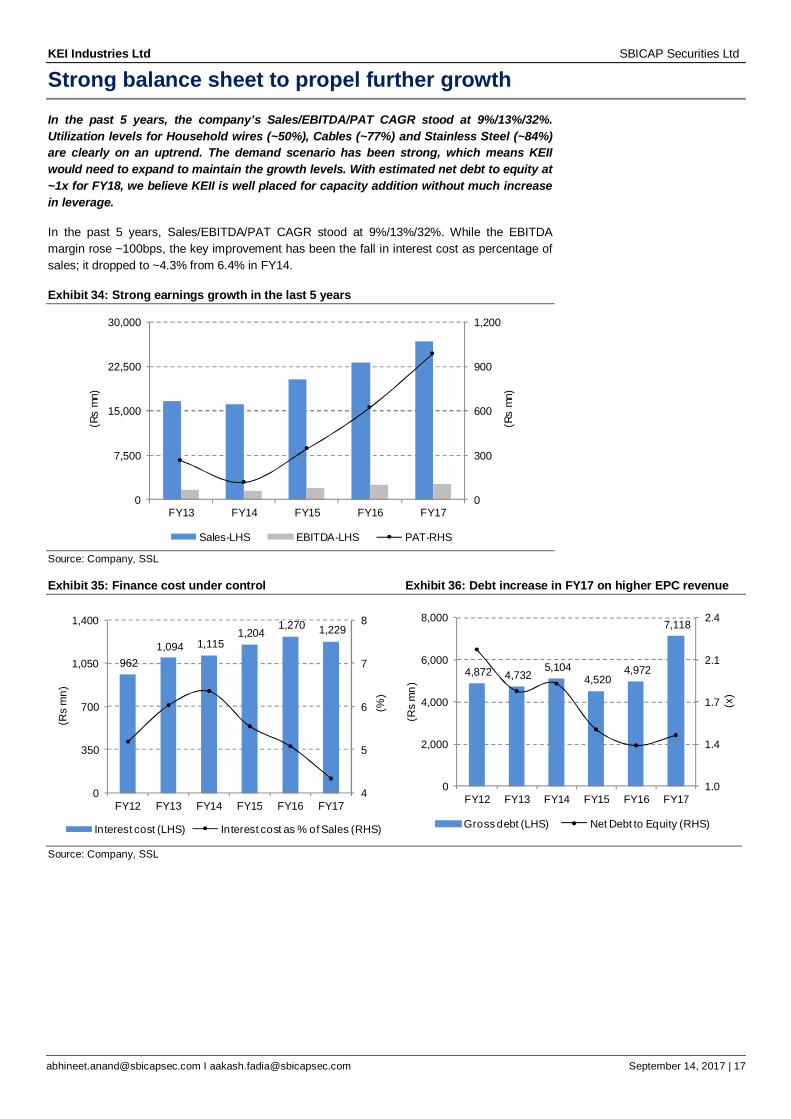
Strong balance sheet to propel further growth In the past 5 years, the company’s Sales/EBITDA/PAT CAGR stood at 9%/13%/32%. Utilization levels for Household wires (~50%), Cables (~77%) and Stainless Steel (~84%) are clearly on an uptrend. The demand scenario has been strong, which means KEII would need to expand to maintain the growth levels. With estimated net debt to equity at ~1x for FY18, we believe KEII is well placed for capacity addition without much increase in leverage.
In the past 5 years, Sales/EBITDA/PAT CAGR stood at 9%/13%/32%. While the EBITDA margin rose ~100bps, the key improvement has been the fall in interest cost as percentage of sales; it dropped to ~4.3% from 6.4% in FY14.
Exhibit 34: Strong earnings growth in the last 5 years
0
300
600
900
1,200
0
7,500
15,000
22,500
30,000
FY13 FY14 FY15 FY16 FY17(R
s m
n)
(Rs
mn)
Sales-LHS EBITDA-LHS PAT-RHS Source: Company, SSL Exhibit 35: Finance cost under control Exhibit 36: Debt increase in FY17 on higher EPC revenue
Source: Company, SSL
962 1,094 1,115
1,204 1,270 1,229
4
5
6
7
8
0
350
700
1,050
1,400
FY12 FY13 FY14 FY15 FY16 FY17
(%)
(Rs
mn)
Interest cost (LHS) Interest cost as % of Sales (RHS)
4,872 4,732 5,104
4,520 4,972
7,118
1.0
1.4
1.7
2.1
2.4
0
2,000
4,000
6,000
8,000
FY12 FY13 FY14 FY15 FY16 FY17
(x)
(Rs
mn)
Gross debt (LHS) Net Debt to Equity (RHS)
KEI Industries Ltd SBICAP Securities Ltd
[email protected] I [email protected] September 14, 2017 | 18
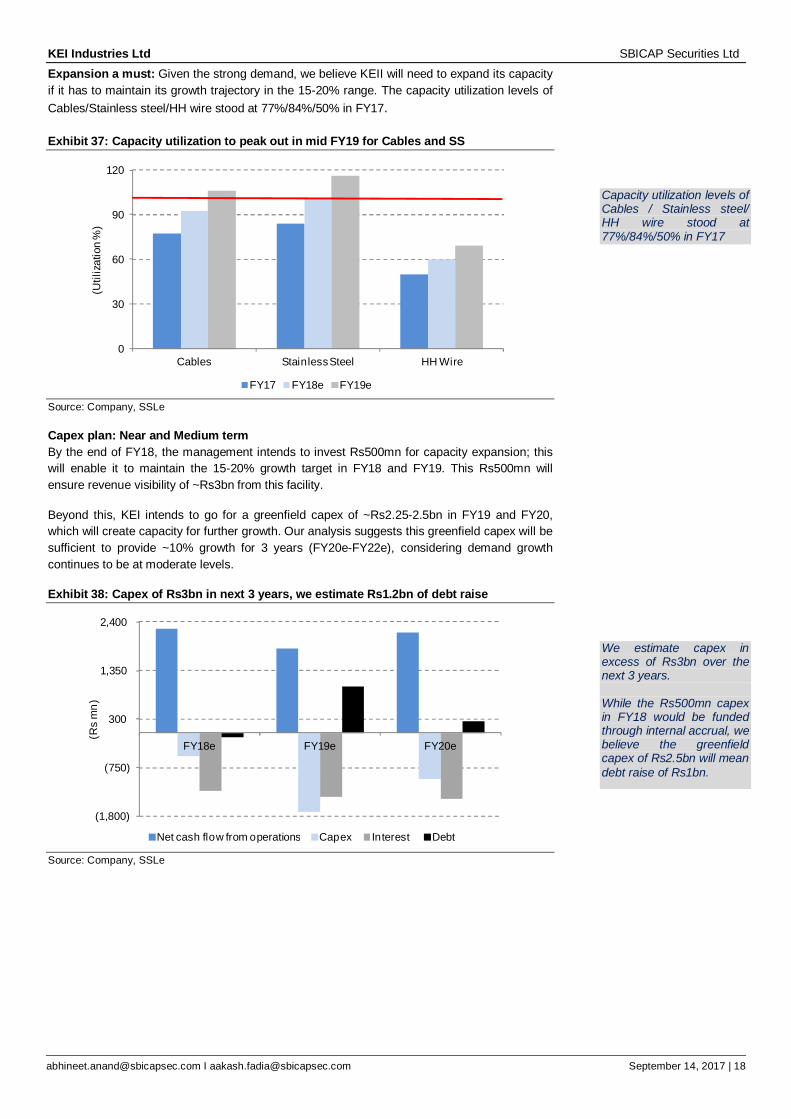
Expansion a must: Given the strong demand, we believe KEII will need to expand its capacity if it has to maintain its growth trajectory in the 15-20% range. The capacity utilization levels of Cables/Stainless steel/HH wire stood at 77%/84%/50% in FY17.
Exhibit 37: Capacity utilization to peak out in mid FY19 for Cables and SS
Source: Company, SSLe
Capex plan: Near and Medium term By the end of FY18, the management intends to invest Rs500mn for capacity expansion; this will enable it to maintain the 15-20% growth target in FY18 and FY19. This Rs500mn will ensure revenue visibility of ~Rs3bn from this facility.
Beyond this, KEI intends to go for a greenfield capex of ~Rs2.25-2.5bn in FY19 and FY20, which will create capacity for further growth. Our analysis suggests this greenfield capex will be sufficient to provide ~10% growth for 3 years (FY20e-FY22e), considering demand growth continues to be at moderate levels.
Exhibit 38: Capex of Rs3bn in next 3 years, we estimate Rs1.2bn of debt raise
(1,800)
(750)
300
1,350
2,400
FY18e FY19e FY20e
(Rs
mn)
Net cash flow from operations Capex Interest Debt Source: Company, SSLe
0
30
60
90
120
Cables Stainless Steel HH Wire
(Util
izat
ion
%)
FY17 FY18e FY19e
Capacity utilization levels of Cables / Stainless steel/ HH wire stood at 77%/84%/50% in FY17
We estimate capex in excess of Rs3bn over the next 3 years. While the Rs500mn capex in FY18 would be funded through internal accrual, we believe the greenfield capex of Rs2.5bn will mean debt raise of Rs1bn.
KEI Industries Ltd SBICAP Securities Ltd
[email protected] I [email protected] September 14, 2017 | 19
Exhibit 39: Key assumptions for sales from various segments and other P&L elements Revenue (Rs mn) FY17 FY18e FY19e FY20e Remarks
HT Power cables 3,800 4,200 4,620 5,082 Moderate growth
Growth (%) 10.5 10.0 10.0
LT Power Cables 12,320 13,552 15,246 17,152 Growth to pick up
Growth (%) 10.0 12.5 12.5
EHV 1,010 2,000 3,400 4,000 Ramp up on account of capacity increase
Growth (%) 98.0 70.0 17.6
HW /W W 4,280 4,922 5,660 6,509 Strong growth to continue
Growth (%) 15.0 15.0 15.0
SS W ire 1,040 1,040 1,040 1,040 Not much capacity left
Growth (%) 0.0 0.0 0.0
EPC 4,240 6,167 7,363 8,500 EPC increase based on Order book
Growth (%) 45.4 19.4 15.4
Total 26,690 31,881 37,329 42,283 16.5% CAGR over FY17-FY20e
Growth (%) 19.4 17 .1 13.3
EBITDA 2,743 3,318 3,945 4,619 Capex of ~Rs3bn over next 2 years
EBITDA margin 10.3 10.4 10.6 10.9
Depreciation 280 292 309 372 Increase due to new units
Interest 1,229 1,263 1,387 1,430 Higher debt, though interest cost still under control
Tax rate (%) 26.3 30.0 30.0 30.0
PAT (Rs mn) 986 1,290 1,645 2,042
EPS (Rs) 12.7 16.6 21.1 26.2 27% CAGR over FY17-FY20e
Growth (%) 30.8 27.5 24.2 Source: Company, SSLe
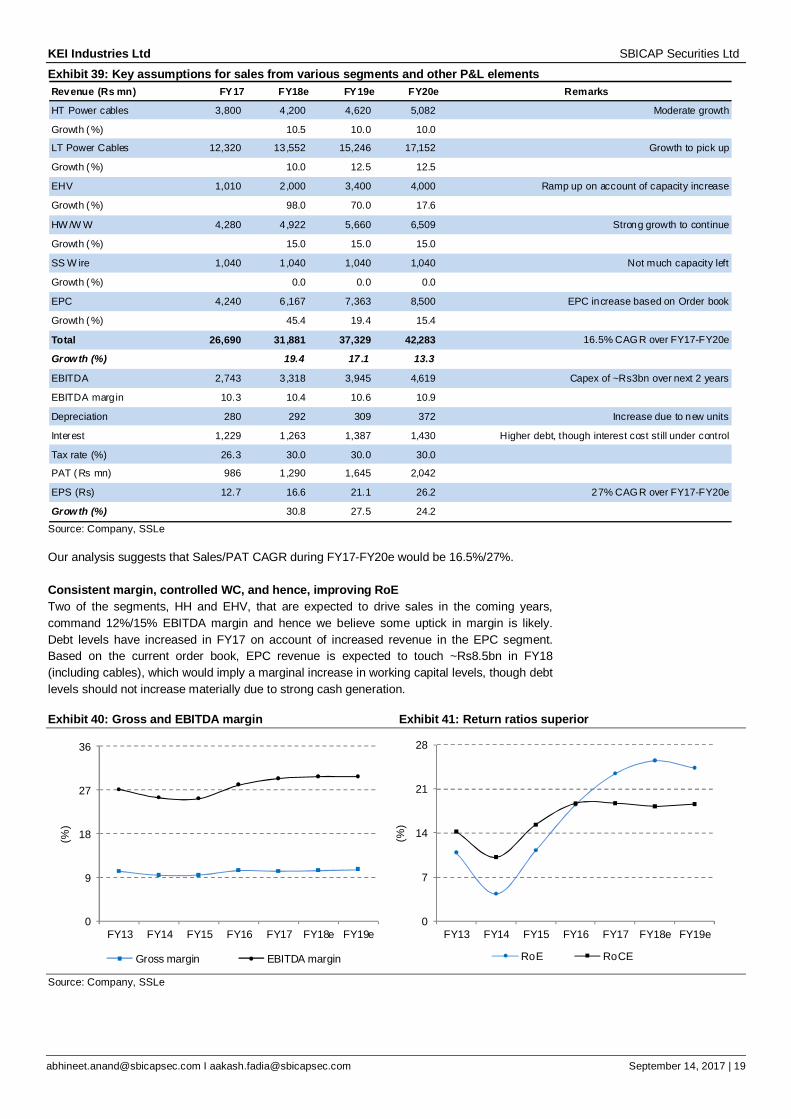
Our analysis suggests that Sales/PAT CAGR during FY17-FY20e would be 16.5%/27%. Consistent margin, controlled WC, and hence, improving RoE Two of the segments, HH and EHV, that are expected to drive sales in the coming years, command 12%/15% EBITDA margin and hence we believe some uptick in margin is likely. Debt levels have increased in FY17 on account of increased revenue in the EPC segment. Based on the current order book, EPC revenue is expected to touch ~Rs8.5bn in FY18 (including cables), which would imply a marginal increase in working capital levels, though debt levels should not increase materially due to strong cash generation.
Exhibit 40: Gross and EBITDA margin Exhibit 41: Return ratios superior
0
7
14
21
28
FY13 FY14 FY15 FY16 FY17 FY18e FY19e
(%)
RoE RoCE
Source: Company, SSLe
0
9
18
27
36
FY13 FY14 FY15 FY16 FY17 FY18e FY19e
(%)
Gross margin EBITDA margin
KEI Industries Ltd SBICAP Securities Ltd
[email protected] I [email protected] September 14, 2017 | 20
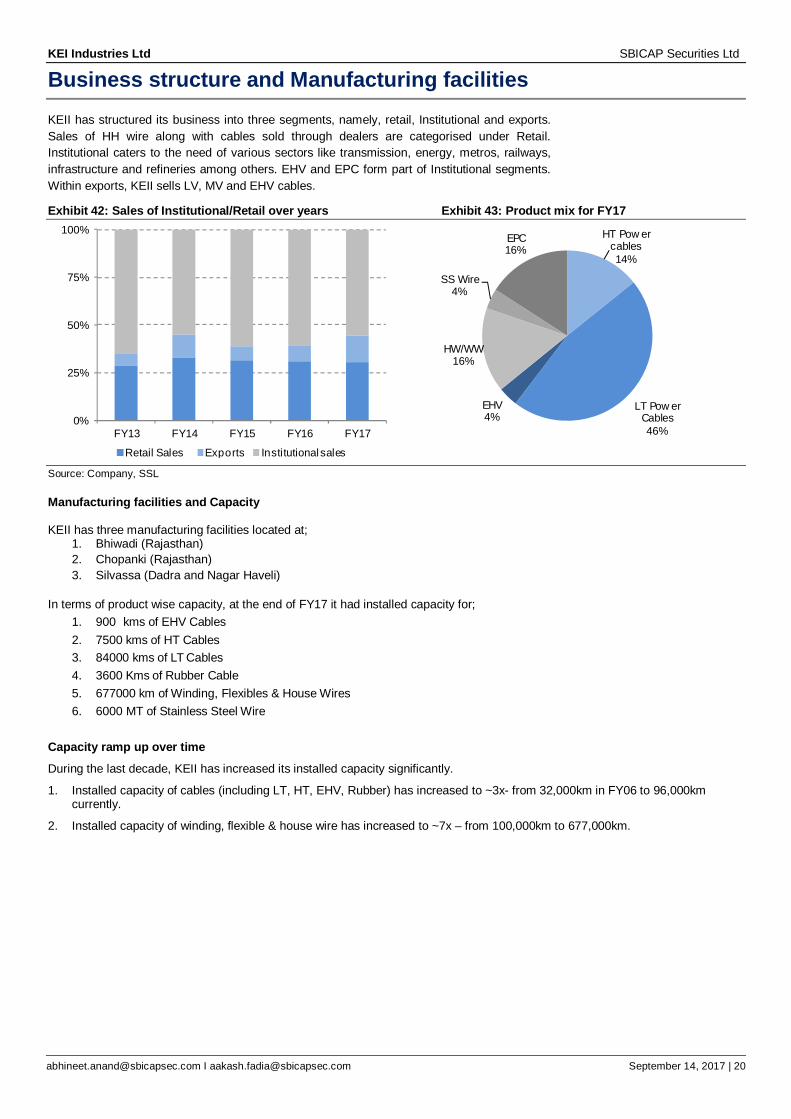
Business structure and Manufacturing facilities KEII has structured its business into three segments, namely, retail, Institutional and exports. Sales of HH wire along with cables sold through dealers are categorised under Retail. Institutional caters to the need of various sectors like transmission, energy, metros, railways, infrastructure and refineries among others. EHV and EPC form part of Institutional segments. Within exports, KEII sells LV, MV and EHV cables.
Exhibit 42: Sales of Institutional/Retail over years Exhibit 43: Product mix for FY17
Source: Company, SSL
Manufacturing facilities and Capacity KEII has three manufacturing facilities located at;
1. Bhiwadi (Rajasthan) 2. Chopanki (Rajasthan) 3. Silvassa (Dadra and Nagar Haveli)
In terms of product wise capacity, at the end of FY17 it had installed capacity for; 1. 900 kms of EHV Cables 2. 7500 kms of HT Cables 3. 84000 kms of LT Cables 4. 3600 Kms of Rubber Cable 5. 677000 km of Winding, Flexibles & House Wires 6. 6000 MT of Stainless Steel Wire
Capacity ramp up over time During the last decade, KEII has increased its installed capacity significantly.
1. Installed capacity of cables (including LT, HT, EHV, Rubber) has increased to ~3x- from 32,000km in FY06 to 96,000km currently.
2. Installed capacity of winding, flexible & house wire has increased to ~7x – from 100,000km to 677,000km.
0%
25%
50%
75%
100%
FY13 FY14 FY15 FY16 FY17
Retail Sales Exports Institutional sales
HT Pow er cables14%
LT Pow er Cables46%
EHV4%
HW/WW16%
SS Wire4%
EPC16%

KEI Industries Ltd SBICAP Securities Ltd
[email protected] I [email protected] September 14, 2017 | 21
Milestones Exhibit 44: Key milestones
Source: Company, SSL

KEI Industries Ltd SBICAP Securities Ltd
[email protected] I [email protected] September 14, 2017 | 22
Valuation and Risks
Valuation KEI currently trades at 18.4x FY18e and 14.4x FY18e and FY19e EPS. We have assigned a PE multiple of 18x for the stock, based on the weighted average PE of various segments. With PAT CAGR of ~29% over FY17-FY19e and RoE of ~24-25%, we believe the stock will further re-rate. Our TP stands at Rs381 and provides ~25% upside from current levels.
To arrive at the exit PE multiple, we have used the weighted average multiple, as we believe the company’s focus on the retail business should command a higher valuation. Over the medium term, we expect the proportion of the retail, institutional and EPC segments to be in the 40%/40%/20% range. We have assigned a PE of 20x to KEI’s retail business, as we envisage medium-term growth of ~15% with good margins in this segment. Peers like Finolex cables is trading at ~21x FY19e EPS. The institutional (cable) and EPC segments have been assigned a PE of 18x/15x respectively.
Exhibit 45: Valuation Summary Valuation Proportion PE (x)
Cable - Retail 40% 20 8
Cable - Institutional 40% 18 7
EPC 20% 15 3 Implied PE (X) 18 Source: SSLe
Risks Commodity risk: Copper and Aluminium are key raw materials in the cable business. Any large swings in the price of these commodities can pose risk to earnings.
Unorganised market risk: The domestic wires segment has a large portion of unorganised players, who are able to offer products at low prices mainly because they use poor quality material. If prices of raw material remain high, the pricing differential between good and poor quality wires would widen, thereby impacting sales.
Working capital risk: KEII has entered the EPC business in the last few years. Any elongation in the working capital cycle in these contracts can increase the need for working capital, and hence debt levels.
Right of Way: Underground cabling has right of way issues, which can delay the projects, thereby affecting earnings.
KEII is dependent on government schemes like IPDS, DDUJY among others, and hence, any delay in ordering activity can impact the company’s business.
KEI Industries Ltd SBICAP Securities Ltd
[email protected] I [email protected] September 14, 2017 | 23
Key Management Profile
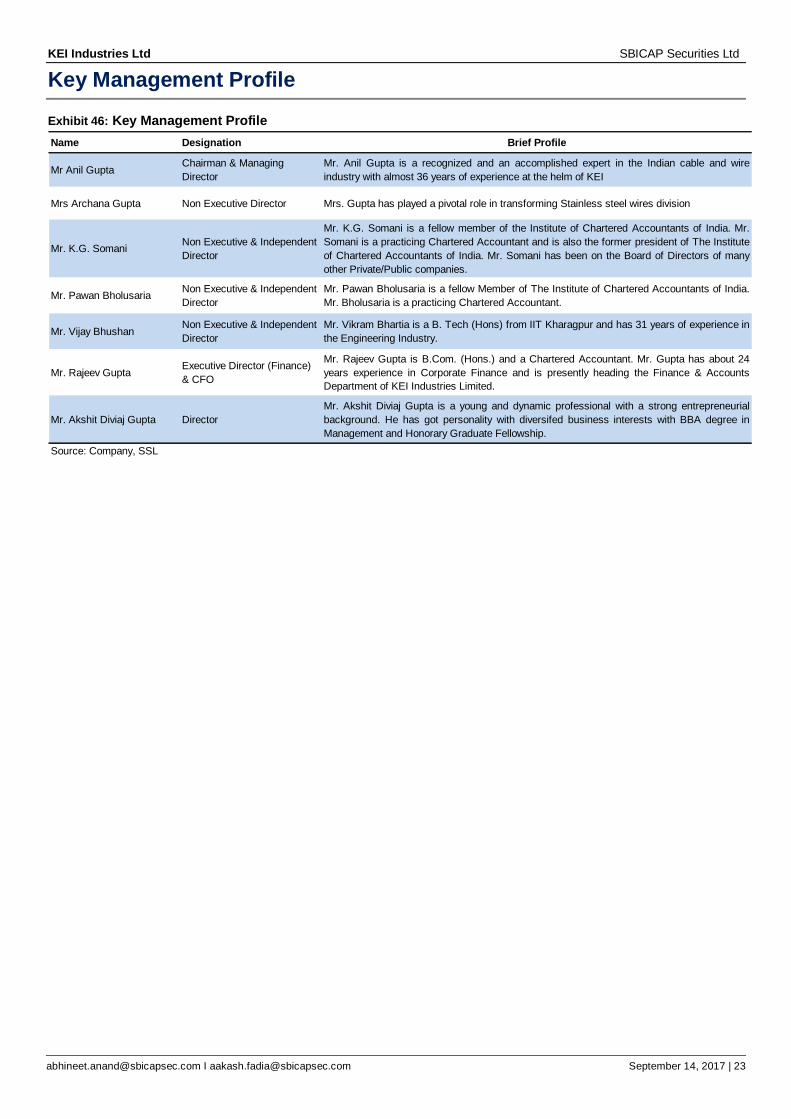
Exhibit 46: Key Management Profile Name Designation Brief Profile
Mr Anil Gupta Chairman & Managing Director
Mr. Anil Gupta is a recognized and an accomplished expert in the Indian cable and wireindustry with almost 36 years of experience at the helm of KEI
Mrs Archana Gupta Non Executive Director Mrs. Gupta has played a pivotal role in transforming Stainless steel wires division
Mr. K.G. Somani Non Executive & Independent Director
Mr. K.G. Somani is a fellow member of the Institute of Chartered Accountants of India. Mr.Somani is a practicing Chartered Accountant and is also the former president of The Instituteof Chartered Accountants of India. Mr. Somani has been on the Board of Directors of manyother Private/Public companies.
Mr. Pawan Bholusaria Non Executive & Independent Director
Mr. Pawan Bholusaria is a fellow Member of The Institute of Chartered Accountants of India.Mr. Bholusaria is a practicing Chartered Accountant.
Mr. Vijay Bhushan Non Executive & Independent Director
Mr. Vikram Bhartia is a B. Tech (Hons) from IIT Kharagpur and has 31 years of experience inthe Engineering Industry.
Mr. Rajeev Gupta Executive Director (Finance) & CFO
Mr. Rajeev Gupta is B.Com. (Hons.) and a Chartered Accountant. Mr. Gupta has about 24years experience in Corporate Finance and is presently heading the Finance & AccountsDepartment of KEI Industries Limited.
Mr. Akshit Diviaj Gupta DirectorMr. Akshit Diviaj Gupta is a young and dynamic professional with a strong entrepreneurialbackground. He has got personality with diversifed business interests with BBA degree inManagement and Honorary Graduate Fellowship.
Source: Company, SSL
KEI Industries Ltd SBICAP Securities Ltd
[email protected] I [email protected] September 14, 2017 | 24
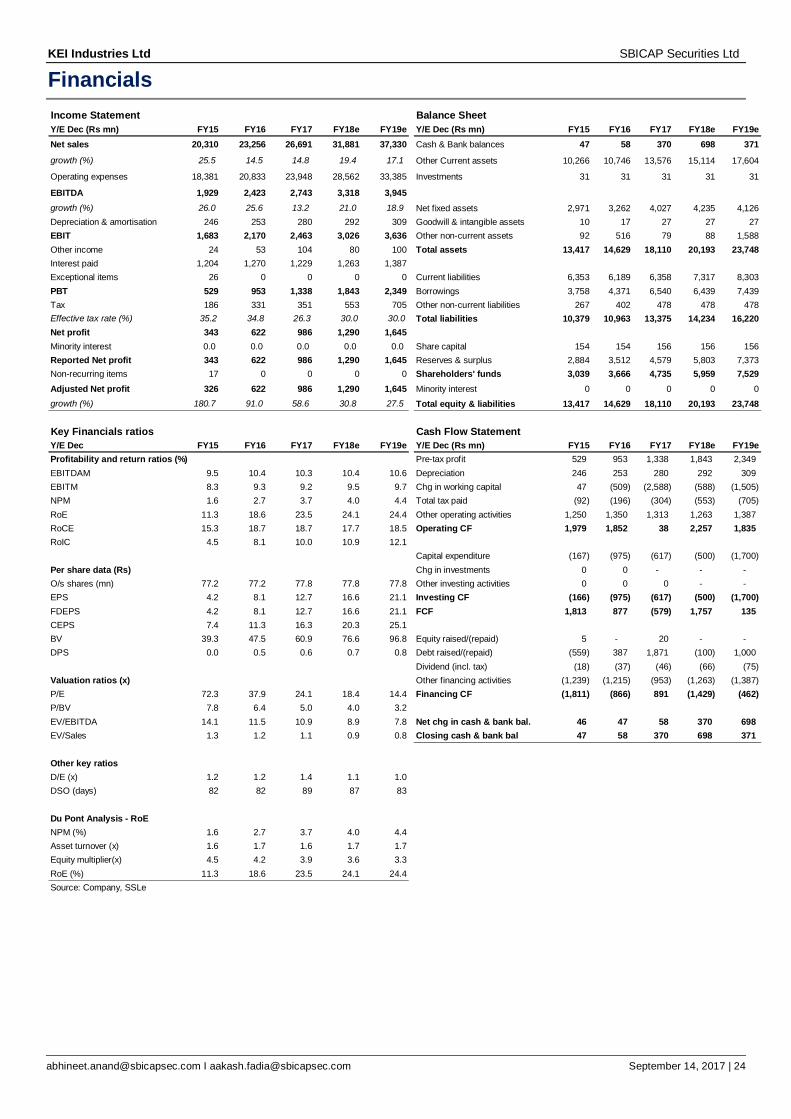
Financials Income Statement Balance SheetY/E Dec (Rs mn) FY15 FY16 FY17 FY18e FY19e Y/E Dec (Rs mn) FY15 FY16 FY17 FY18e FY19eNet sales 20,310 23,256 26,691 31,881 37,330 Cash & Bank balances 47 58 370 698 371growth (%) 25.5 14.5 14.8 19.4 17.1 Other Current assets 10,266 10,746 13,576 15,114 17,604
Operating expenses 18,381 20,833 23,948 28,562 33,385 Investments 31 31 31 31 31
EBITDA 1,929 2,423 2,743 3,318 3,945growth (%) 26.0 25.6 13.2 21.0 18.9 Net fixed assets 2,971 3,262 4,027 4,235 4,126Depreciation & amortisation 246 253 280 292 309 Goodwill & intangible assets 10 17 27 27 27EBIT 1,683 2,170 2,463 3,026 3,636 Other non-current assets 92 516 79 88 1,588Other income 24 53 104 80 100 Total assets 13,417 14,629 18,110 20,193 23,748Interest paid 1,204 1,270 1,229 1,263 1,387Exceptional items 26 0 0 0 0 Current liabilities 6,353 6,189 6,358 7,317 8,303PBT 529 953 1,338 1,843 2,349 Borrowings 3,758 4,371 6,540 6,439 7,439Tax 186 331 351 553 705 Other non-current liabilities 267 402 478 478 478Effective tax rate (%) 35.2 34.8 26.3 30.0 30.0 Total liabilities 10,379 10,963 13,375 14,234 16,220Net profit 343 622 986 1,290 1,645Minority interest 0.0 0.0 0.0 0.0 0.0 Share capital 154 154 156 156 156Reported Net profit 343 622 986 1,290 1,645 Reserves & surplus 2,884 3,512 4,579 5,803 7,373Non-recurring items 17 0 0 0 0 Shareholders' funds 3,039 3,666 4,735 5,959 7,529Adjusted Net profit 326 622 986 1,290 1,645 Minority interest 0 0 0 0 0growth (%) 180.7 91.0 58.6 30.8 27.5 Total equity & liabilities 13,417 14,629 18,110 20,193 23,748
42 81 127 166 211Key Financials ratios Cash Flow StatementY/E Dec FY15 FY16 FY17 FY18e FY19e Y/E Dec (Rs mn) FY15 FY16 FY17 FY18e FY19eProfitability and return ratios (%) Pre-tax profit 529 953 1,338 1,843 2,349 EBITDAM 9.5 10.4 10.3 10.4 10.6 Depreciation 246 253 280 292 309 EBITM 8.3 9.3 9.2 9.5 9.7 Chg in working capital 47 (509) (2,588) (588) (1,505) NPM 1.6 2.7 3.7 4.0 4.4 Total tax paid (92) (196) (304) (553) (705) RoE 11.3 18.6 23.5 24.1 24.4 Other operating activities 1,250 1,350 1,313 1,263 1,387 RoCE 15.3 18.7 18.7 17.7 18.5 Operating CF 1,979 1,852 38 2,257 1,835 RoIC 4.5 8.1 10.0 10.9 12.1
Capital expenditure (167) (975) (617) (500) (1,700) Per share data (Rs) Chg in investments 0 0 - - - O/s shares (mn) 77.2 77.2 77.8 77.8 77.8 Other investing activities 0 0 0 - - EPS 4.2 8.1 12.7 16.6 21.1 Investing CF (166) (975) (617) (500) (1,700) FDEPS 4.2 8.1 12.7 16.6 21.1 FCF 1,813 877 (579) 1,757 135 CEPS 7.4 11.3 16.3 20.3 25.1BV 39.3 47.5 60.9 76.6 96.8 Equity raised/(repaid) 5 - 20 - - DPS 0.0 0.5 0.6 0.7 0.8 Debt raised/(repaid) (559) 387 1,871 (100) 1,000
Dividend (incl. tax) (18) (37) (46) (66) (75) Valuation ratios (x) Other financing activities (1,239) (1,215) (953) (1,263) (1,387) P/E 72.3 37.9 24.1 18.4 14.4 Financing CF (1,811) (866) 891 (1,429) (462) P/BV 7.8 6.4 5.0 4.0 3.2EV/EBITDA 14.1 11.5 10.9 8.9 7.8 Net chg in cash & bank bal. 46 47 58 370 698 EV/Sales 1.3 1.2 1.1 0.9 0.8 Closing cash & bank bal 47 58 370 698 371
Other key ratiosD/E (x) 1.2 1.2 1.4 1.1 1.0DSO (days) 82 82 89 87 83
Du Pont Analysis - RoENPM (%) 1.6 2.7 3.7 4.0 4.4Asset turnover (x) 1.6 1.7 1.6 1.7 1.7Equity multiplier(x) 4.5 4.2 3.9 3.6 3.3RoE (%) 11.3 18.6 23.5 24.1 24.4Source: Company, SSLe
KEI Industries Ltd SBICAP Securities Ltd
[email protected] I [email protected] September 14, 2017 | 25
SBICAP Securities Limited
(CIN): U65999MH2005PLC155485 | Research Analyst Registration No INH000000602 SEBI Registration No.: NSE Capital Market: INB 231052938 | NSE Derivatives: INF 231052938 |BSE Capital Market: INB 011053031
Currency Derivatives: INE 231052938 | CDSL: IN-DP-CDSL-370-2006 | IRDA/IR2/2014/241
Corporate Office: Marathon Futurex, A & B Wing, 12th Floor, N. M. Joshi Marg, Lower Parel, Mumbai -400013.
Tel.: 91-22-42273300/01 | Fax: 91-22-42273335 | Email: [email protected] | www.sbismart.com
KEY TO INVESTMENT RATINGS Guide to the expected return over the next 12 months. 1=BUY (expected to give absolute returns of 15 or more percentage points); 2=HOLD (expected to give absolute returns between -10 and 15 percentage points); 3=SELL (expected to give absolute returns less then -10 percentage points)
DISCLOSURES &DISCLAIMERS
Analyst Certification The views expressed in this research report (“Report”) accurately reflect the personal views of the research analysts (“Analysts”) employed by SBICAP Securities Limited (SSL) about any and all of the subject issuer(s) or company (ies) or securities. This report has been prepared based upon information available to the public and sources, believed to be reliable. I/We also certify that no part of my/our compensation was, is, or will be directly or indirectly related to the specific recommendation(s) or view(s) in this report.
The Analysts engaged in preparation of this Report or his/her relative:- (a) do not have any financial interests in the subject company mentioned in this Report; (b) do not own 1% or more of the equity securities of the subject company mentioned in the report as of the last day of the month preceding the publication of the research report; and (c) do not have any material conflict of interest at the time of publication of the Report.
The Analysts engaged in preparation of this Report:- (a) have not received any compensation from the subject company in the past twelve months; (b) have not managed or co-managed public offering of securities for the subject company in the past twelve months; (c) have not received any compensation for investment banking or merchant banking or brokerage services from the subject company in the past twelve months; (d) have not received any compensation for products or services other than investment banking or merchant banking or brokerage services from the subject company in the past twelve months; (e) have not received any compensation or other benefits from the subject company or third party in connection with the Report; (f) have not served as an officer, director or employee of the subject company; and (g) are not engaged in market-making activity for the subject company. Name Qualification Designation Sector
Abhineet Anand B.E (Mechanical), P.G.D.M. (Finance) Analyst Capital Goods/Power
Aakash Fadia B.M.S., M.M.S. (Finance) Associate Capital Goods/Power

KEI Industries Ltd SBICAP Securities Ltd
[email protected] I [email protected] September 14, 2017 | 26
Other Disclosures SBICAP Securities Limited (“SSL”), a full service Stock Broking company, is engaged in diversified financial services business including equity broking, DP services, distribution of Mutual Funds, insurance products and other financial products. SSL is a member of the National Stock Exchange of India (NSE) Limited and BSE Limited. SSL is also a Depository Participant registered with the NSDL and CDSL. SSL is a large broking house catering to retail, HNI and institutional clients. It operates through its branches and authorised persons spread across the country and the clients are provided online trading through internet and offline trading through branches, and call and trade facility. SSL is a wholly owned subsidiary of SBI Capital Markets Limited (“SBICAP”), which is engaged in investment banking, project advisory and financial services activities and is registered with the Securities and Exchange Board of India as a “Category I” Merchant Banker. SBICAP is a wholly owned subsidiary of State Bank of India. Hence, State Bank of India and all its subsidiaries, including, SBICAP and banking subsidiaries, are treated and referred to as Associates of SSL.
We hereby declare that our activities were neither suspended nor have we materially defaulted with any stock exchange authority with whom we are registered in the last five years. However SEBI, Exchanges and Depositories have conducted routine inspections, and based on their observations have issued advice letters or levied minor penalty for certain procedural lapses. We have not been debarred from doing business by any Stock Exchange/SEBI or any other authorities, nor has our certificate of registration been cancelled by SEBI at any point of time. SSL or its Associates, may: (a) from time to time, have long or short positions in, and buy or sell the securities of the company mentioned in the Report or (b) be engaged in any other in any other transaction involving such securities and earn brokerage or other compensation or act as a market maker in the financial instruments of the company discussed herein or act as an advisor or lender/borrower to such company or may have any other potential conflict of interests with respect to any recommendation and other related information and opinions. SSL does not have actual/beneficial ownership of one per cent or more securities of the subject company at the end of the month immediately preceding the date of publication of the Report. However, since Associates of SSL are engaged in the financial services business, they might have in their normal course of business financial interests or actual/beneficial ownership of one per cent or more in various companies including the subject company mentioned herein this Report. SSL or its Associates might have managed or co-managed public offering of securities for the subject company in the past twelve months and might have received compensation from the companies mentioned in the Report during the period preceding twelve months from the date of this Report for services in respect of managing or co-managing public offerings/corporate finance, investment banking or merchant banking, brokerage services or other advisory services in a merger or specific transaction. Compensation paid to Analysts of SSL is not based on any specific merchant banking, investment banking or brokerage service transaction. SSL or its Associate did not receive any compensation or any benefit from the subject company or third party in connection with preparation of this Report. This Report is for the personal information of the authorised recipient(s) and is not for public distribution and should not be reproduced, transmitted or redistributed to any other person or in any form without SSL’s prior permission. The information provided in the Report is from publicly available data, which we believe, are reliable. While reasonable endeavors have been made to present reliable data in the Report so far as it relates to current and historical information, but SSL does not guarantee the accuracy or completeness of the data in the Report. Accordingly, SSL or any of its Associates including directors and employees thereof shall not be in any way responsible or liable for any loss or damage that may arise to any person from any inadvertent error in the information contained, views and opinions expressed in this Report or in connection with the use of this Report. Please ensure that you have read “Risk Disclosure Document for Capital Market and Derivatives Segments” as prescribed by Securities and Exchange Board of India before investing in Indian securities market. The projections and forecasts described in this Report should be carefully evaluated as these : 1. Are based upon a number of estimates and assumptions and are inherently subject to significant uncertainties and contingencies. 2. Can be expected that some of the estimates on which these were based, will not materialise or will vary significantly from actual results, and such variances may
increase over time. 3. Are not prepared with a view towards compliance with published guidelines or generally accepted accounting principles. No independent accountants have
expressed an opinion or any other form of assurance on these. 4. Should not be regarded, by mere inclusion in this report, as a representation or warranty by or on behalf of SSL the authors of this report, or any other person, that
these or their underlying assumptions will be achieved. This Report is for information purposes only and SSL or its Associates accept no liabilities for any loss or damage of any kind arising out of the use of this report. Though disseminated to recipients simultaneously, not all recipients may receive this report at the same time. SSL will not treat recipients as clients by virtue of their receiving this report. It should not be construed as an offer to sell or solicitation of an offer to buy, purchase or subscribe to any securities this report shall not form the basis of or be relied upon in connection with any contract or commitment, whatsoever. This report does not solicit any action based on the material contained herein. It does not constitute a personal recommendation and does not take into account the specific investment objectives, financial situation/circumstances and the particular needs of any specific person who may receive this document. The securities discussed in this Report may not be suitable for all the investors. SSL does not provide legal, accounting or tax advice to its clients and you should independently evaluate the suitability of this Report and all investors are strongly advised to seek professional consultation regarding any potential investment. Certain transactions including those involving futures, options, and other derivatives as well as non-investment grade securities give rise to substantial risk and are not suitable for all investors. Foreign currency denominated securities are subject to fluctuations in exchange rates that could have an adverse effect on the value or price of or income derived from the investment. The price, value and income of the investments referred to in this Report may fluctuate and investors may realise losses on any investments. Past performance is not a guide for future performance. Actual results may differ materially from those set forth in projections. SSL has reviewed the Report and, the current or historical information included here is believed to be reliable, the accuracy and completeness of which is not guaranteed. SSL does not have any obligation to update the information discussed in this Report. The opinions expressed in this report are subject to change without notice and SSL or its Associates have no obligation to tell the clients when opinions or information in this report change. This Report has not been approved and will not or may not be reviewed or approved by any statutory or regulatory authority in India, United Kingdom or Singapore or by any Stock Exchange in India, United Kingdom or Singapore. This report may not be all inclusive and may not contain all the information that the recipient may consider material. The securities described herein may not be eligible for sale in all jurisdictions or to all categories of investors. The countries in which the companies mentioned in this Report are organised may have restrictions on investments, voting rights or dealings in securities by nationals of other countries. Distributing /taking/sending/dispatching/transmitting this document in certain foreign jurisdictions may be restricted by law, and persons into whose possession this document comes should inform themselves about, and observe, any such restrictions. Failure to comply with this restriction may constitute a violation of laws in that jurisdiction.
Legal Entity Disclosure Singapore: This Report is distributed in Singapore by SBICAP (Singapore) Limited (Registration No. 201026168R), an Associate of SSL incorporated in Singapore. SBICAP (Singapore) Limited is regulated by the Monetary Authority of Singapore as a holder of a Capital Markets Services License and an Exempt Financial Adviser in Singapore. SBICAP (Singapore) Limited’s services are available solely to persons who qualify as Institutional Investors or Accredited Investors (other than individuals) as defined in section 4A(1) of the Securities and Futures Act, Chapter 289 of Singapore (the “SFA”) and this Report is not intended to be distributed directly or indirectly to any other class of persons. Persons in Singapore should contact SBICAP (Singapore) Limited in respect of any matters arising from, or in connection with this report via email at [email protected] or by call at +65 6709 8651.
United Kingdom: SBICAP (UK) Limited, a fellow subsidiary of SSL, incorporated in United Kingdom is authorised and regulated by the Financial Conduct Authority. This marketing communication is being solely issued to and directed at persons (i) fall within one of the categories of “Investment Professionals” as defined in Article 19(5) of the Financial Services and Markets Act 2000 (Financial Promotion) Order 2005, as amended (the “Financial Promotion Order”), (ii) fall within any of the categories of persons described in Article 49 of the Financial Promotion Order (“High net worth companies, unincorporated associations etc.”) or (iii) any other person to whom it may otherwise lawfully be made available (together “Relevant Persons”) by SSL. The materials are exempt from the general restriction on the communication of invitations or inducements to enter into investment activity on the basis that they are only being made to Relevant Persons and have therefore not been approved by an authorised person as would otherwise be required by section 21 of the Financial Services and Markets Act 2000 (“FSMA”).
Related Documents