Towards a Low Carbon Future: China’s Green Development Policy and Practice Ye QI Climate and Carbon Policy Institute (CPI) Tsinghua University & China Sustainable Energy Program The Energy Foundation

Towards a Low Carbon Future: China’s Green Development Policy and Practice Ye QI Climate and Carbon Policy Institute (CPI) Tsinghua University & China.
Dec 17, 2015
Welcome message from author
This document is posted to help you gain knowledge. Please leave a comment to let me know what you think about it! Share it to your friends and learn new things together.
Transcript
Towards a Low Carbon Future: China’s Green Development Policy and Practice
Ye QI
Climate and Carbon Policy Institute (CPI)Tsinghua University
&China Sustainable Energy Program
The Energy Foundation
22
Presentation Overview
• Historical background• Recent trends in China• China’s policies for low carbon
development• Conclusions
33
Economic, Energy, and GHG Emissions Trends
China has experienced extraordinary China has experienced extraordinary growth of its economy and energy growth of its economy and energy
consumption in recent yearsconsumption in recent years

44
Economic Development in China
GDP growth rate higher than 9% over past 30 yearsGDP growth rate higher than 9% over past 30 years
10,745 11,721
12,896 14,196
15,678
17,496
19,578
21,340
8.39.1
10.0 10.1 10.411.6
13.0
9.0
0
5
10
15
20
25
-
5,000
10,000
15,000
20,000
25,000
2001 2002 2003 2004 2005 2006 2007 2008
China's GDP and Growth Rate2001-2008
Billion Constant 2000 Yuan Real Growth Rate (%)
GrowthRate (%)
55
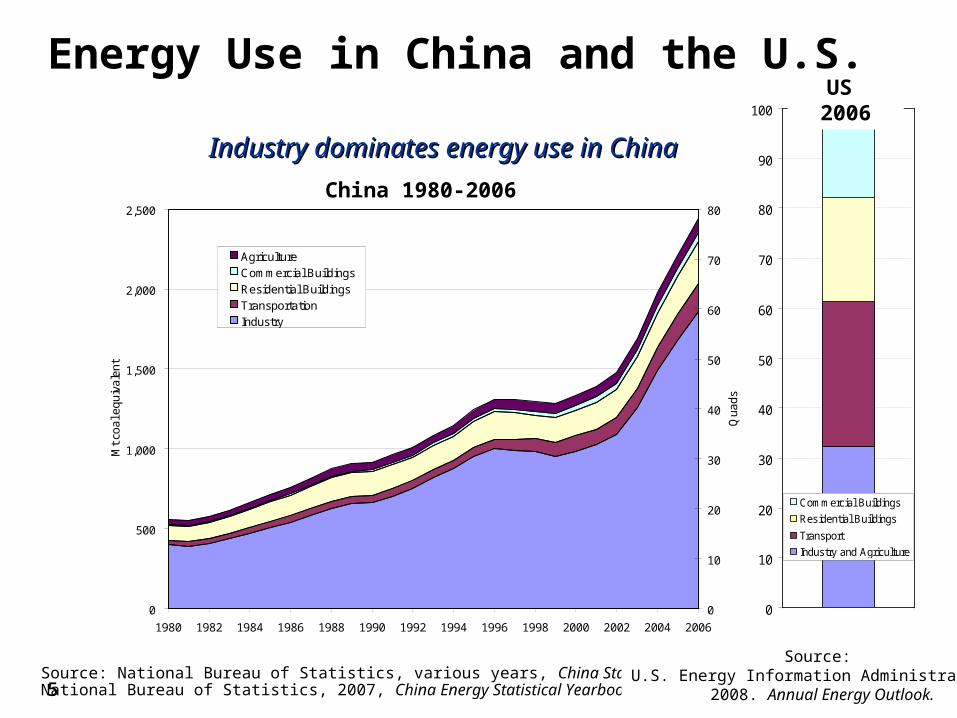
Energy Use in China and the U.S.
Source: National Bureau of Statistics, various years, China Statistical Abstract. National Bureau of Statistics, 2007, China Energy Statistical Yearbook.
China 1980-2006
Source: U.S. Energy Information Administration,
2008. Annual Energy Outlook.
0
500
1,000
1,500
2,000
2,500
1980 1982 1984 1986 1988 1990 1992 1994 1996 1998 2000 2002 2004 2006
Mt
coa
l eq
uiv
ale
nt
0
10
20
30
40
50
60
70
80
Qu
ad
s
AgricultureCommercial BuildingsResidential BuildingsTransportationIndustry
0
10
20
30
40
50
60
70
80
90
100
Commercial Buildings
Residential Buildings
Transport
Industry and Agriculture
US 2006
Industry dominates energy use in ChinaIndustry dominates energy use in China
66
China’s economy is heavily dependent on China’s economy is heavily dependent on its coal resourcesits coal resources
Economic, Energy, and GHG Emissions Trends
77
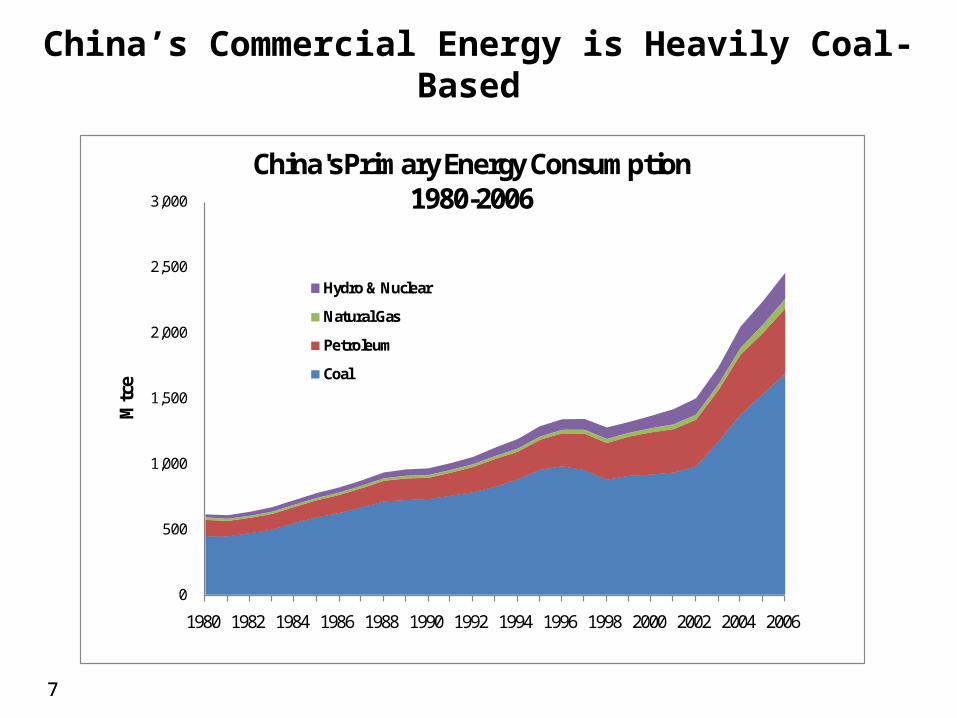
China’s Commercial Energy is Heavily Coal-Based
0
500
1,000
1,500
2,000
2,500
3,000
1980 1982 1984 1986 1988 1990 1992 1994 1996 1998 2000 2002 2004 2006
Mtc
e
China's Primary Energy Consumption1980-2006
Hydro & Nuclear
Natural Gas
Petroleum
Coal

88
Relatively High Share of Coal Use in China
Source: BP Statistical Review of World Energy 2008.
0%
10%
20%
30%
40%
50%
60%
70%
80%
China India USA Indonesia Japan European Union
Russian Federation
Brazil World Average
Coal-based Primary Energy Consumption in Major Countries, 2007
99
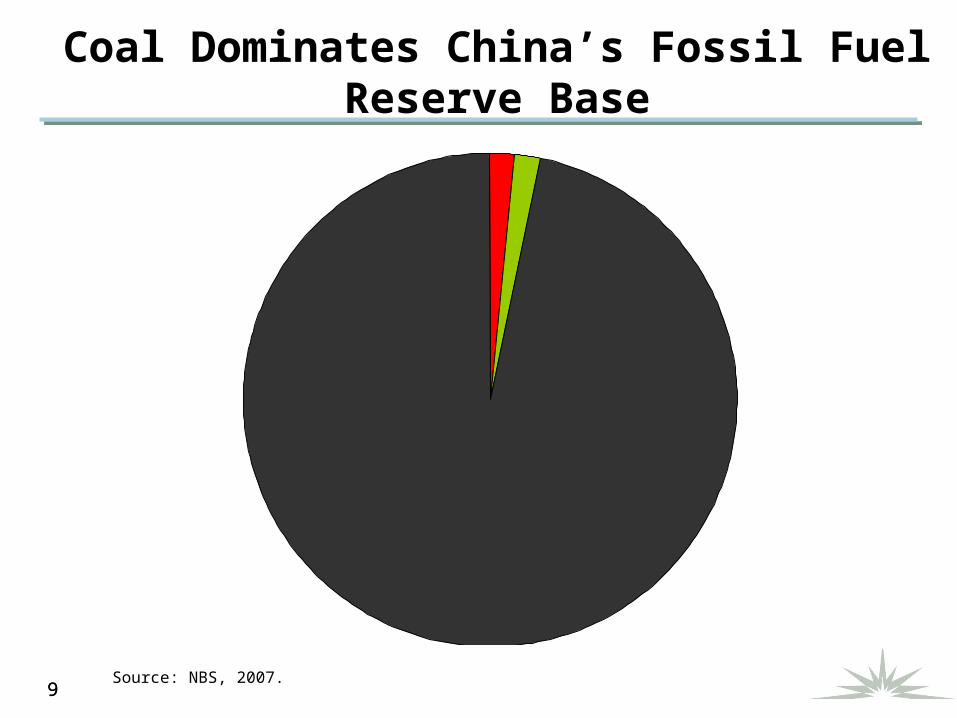
Coal Dominates China’s Fossil Fuel Reserve Base
Coal238 billion tons coal equivalent
97% total fossil fuel reserve base
Oil Natural Gas
Source: NBS, 2007.
1010
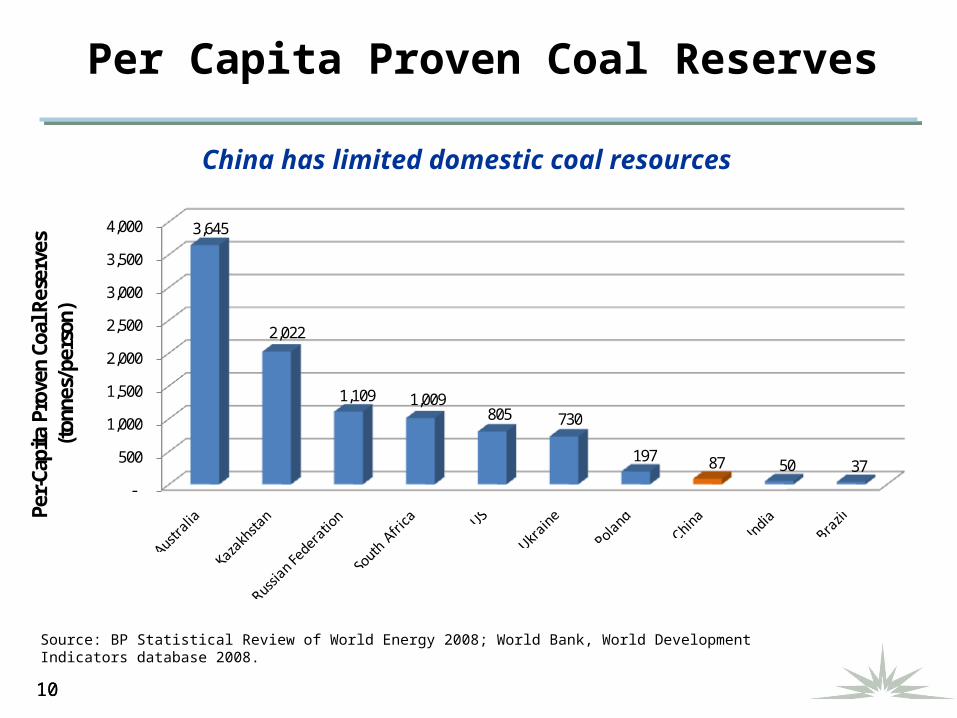
Per Capita Proven Coal Reserves
China has limited domestic coal resources
-
500
1,000
1,500
2,000
2,500
3,000
3,500
4,000 3,645
2,022
1,109 1,009 805 730
197 87 50 37
Per-
Capi
ta P
rove
n Co
al R
eser
ves
(ton
nes/
pers
on)
Source: BP Statistical Review of World Energy 2008; World Bank, World Development Indicators database 2008.

1111
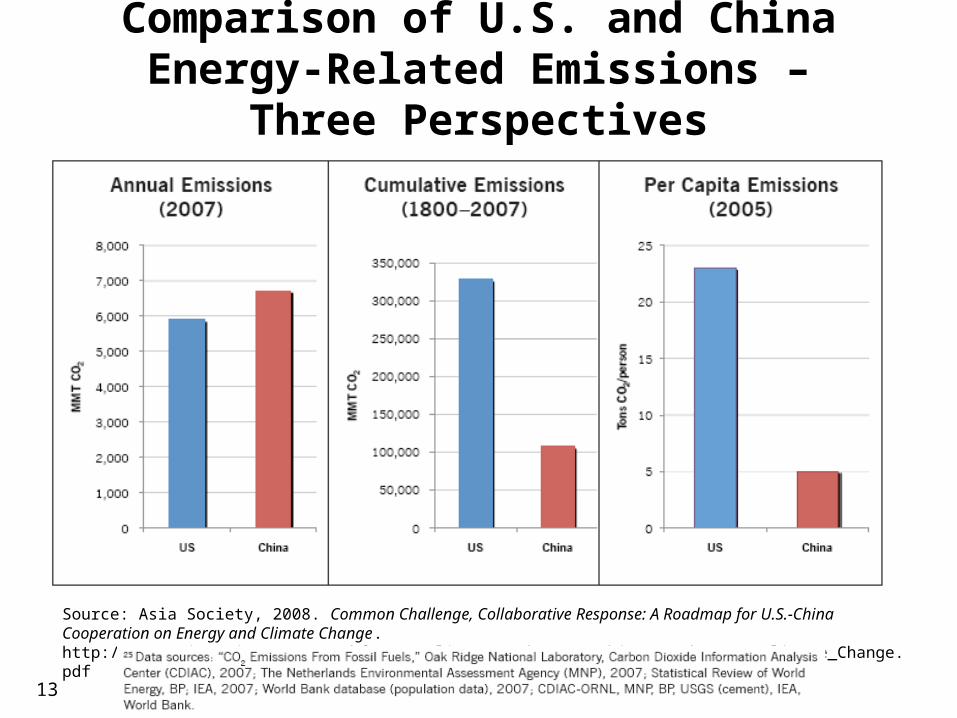
China now emits more energy-related China now emits more energy-related carbon dioxide (COcarbon dioxide (CO22) than the U.S. in ) than the U.S. in
absolute terms, but not if measured on a absolute terms, but not if measured on a per capita or cumulative basisper capita or cumulative basis
Economic, Energy, and GHG Emissions Trends
1212
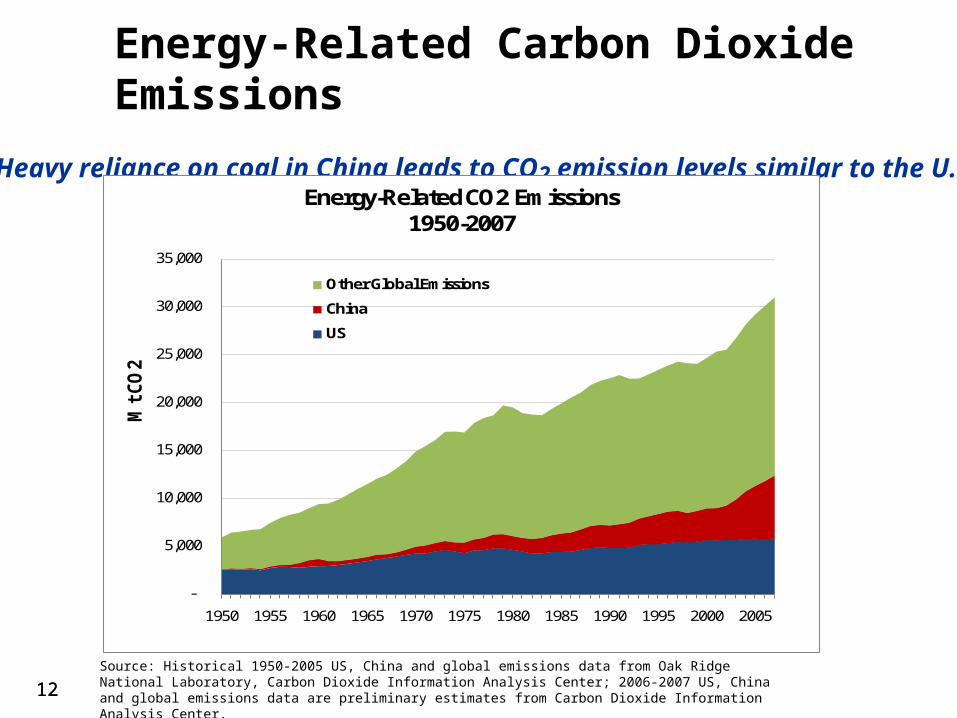
Energy-Related Carbon Dioxide Emissions
Source: Historical 1950-2005 US, China and global emissions data from Oak Ridge National Laboratory, Carbon Dioxide Information Analysis Center; 2006-2007 US, China and global emissions data are preliminary estimates from Carbon Dioxide Information Analysis Center.
Heavy reliance on coal in China leads to CO2 emission levels similar to the U.S.
-
5,000
10,000
15,000
20,000
25,000
30,000
35,000
1950 1955 1960 1965 1970 1975 1980 1985 1990 1995 2000 2005
Mt
CO
2
Energy-Related CO2 Emissions1950-2007
Other Global Emissions
China
US
13
Comparison of U.S. and China Energy-Related Emissions – Three Perspectives
Source: Asia Society, 2008. Common Challenge, Collaborative Response: A Roadmap for U.S.-China Cooperation on Energy and Climate Change. http://www.asiasociety.org/taskforces/climateroadmap/US_China_Roadmap_on_Climate_Change.pdf
1414
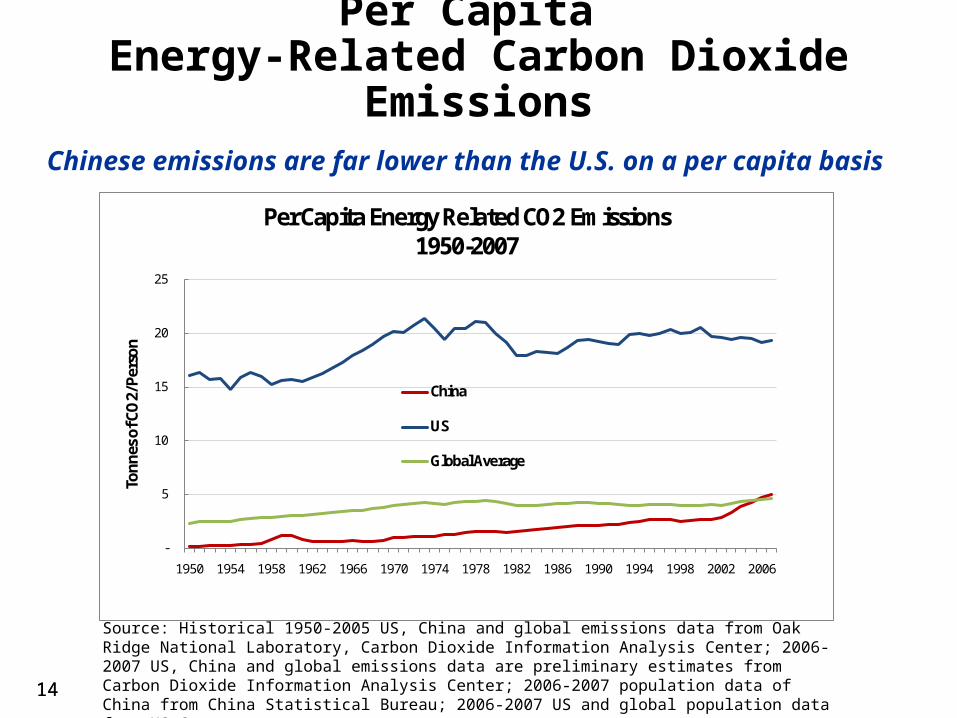
Per Capita Energy-Related Carbon Dioxide Emissions
Source: Historical 1950-2005 US, China and global emissions data from Oak Ridge National Laboratory, Carbon Dioxide Information Analysis Center; 2006-2007 US, China and global emissions data are preliminary estimates from Carbon Dioxide Information Analysis Center; 2006-2007 population data of China from China Statistical Bureau; 2006-2007 US and global population data from US Census.
Chinese emissions are far lower than the U.S. on a per capita basis
-
5
10
15
20
25
1950 1954 1958 1962 1966 1970 1974 1978 1982 1986 1990 1994 1998 2002 2006
Tonn
es o
f CO
2/Pe
rson
Per Capita Energy Related CO2 Emissions1950-2007
China
US
Global Average
1515
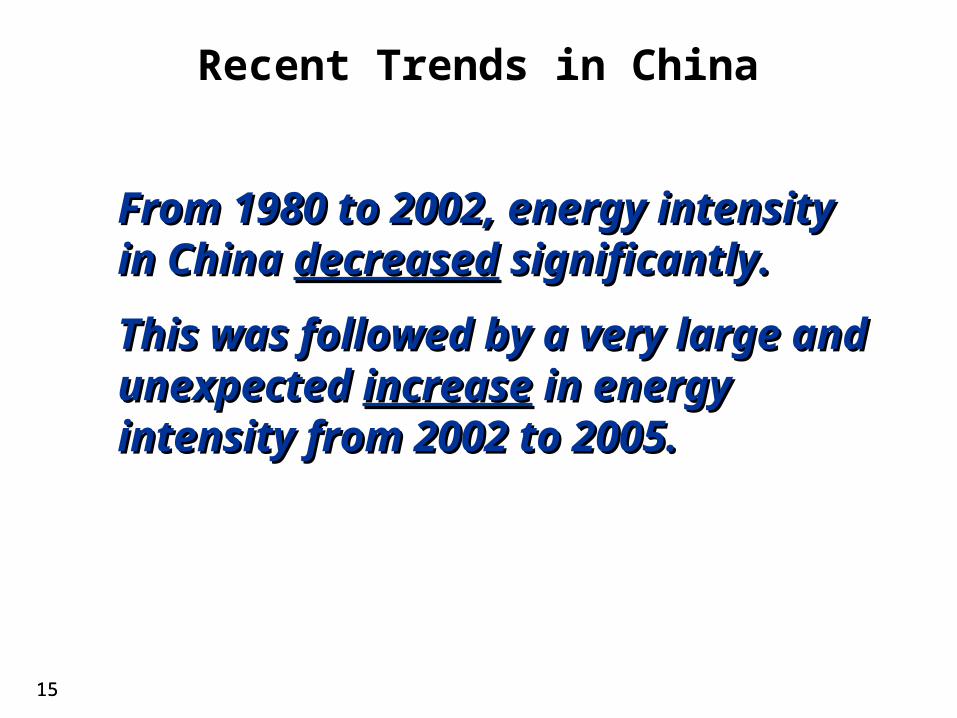
From 1980 to 2002, energy intensity in From 1980 to 2002, energy intensity in China China decreaseddecreased significantly. significantly.
This was followed by a very large and This was followed by a very large and unexpected unexpected increaseincrease in energy intensity in energy intensity from 2002 to 2005.from 2002 to 2005.
Recent Trends in China

1616
0
500
1,000
1,500
2,000
2,500
3,000
3,500
4,000
4,500
1980 1982 1984 1986 1988 1990 1992 1994 1996 1998 2000 2002
kg c
oal e
quiv
alen
t/10
,000
(200
0) R
MB
Source: National Bureau of Statistics, China Statistical Abstract, various years.
Average Annual Decline of5% per year
Energy Intensity (E/GDP) Declined Steadily From 1980 to 2002
Remarkably, China reduced energy use per unit of GDP while industrializing
1717 Source: National Bureau of Statistics, China Statistical Abstract, various years.
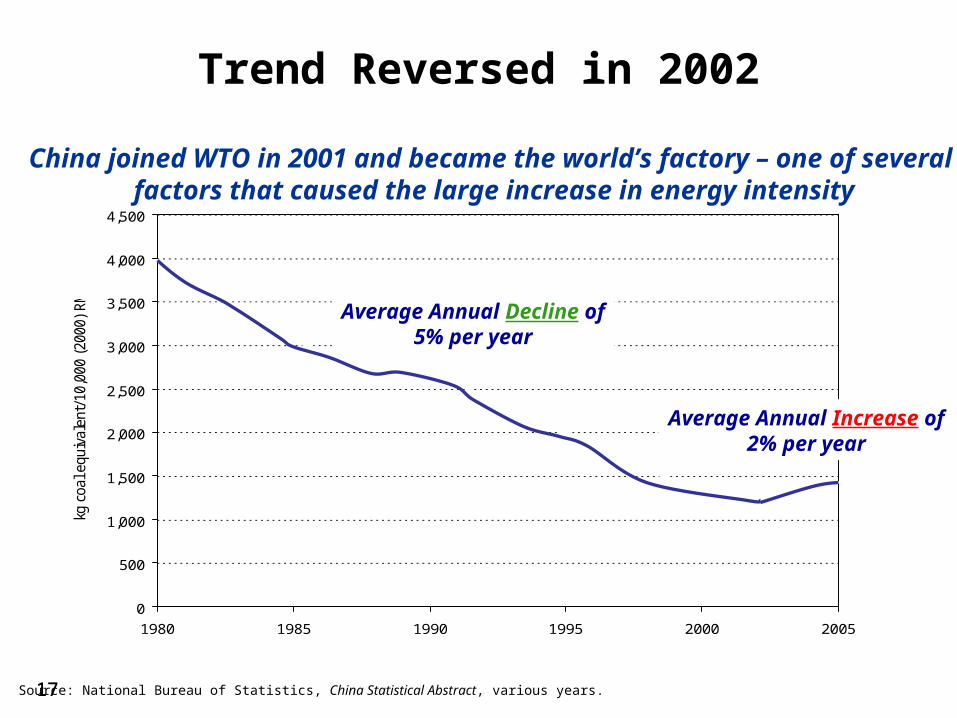
Trend Reversed in 2002
China joined WTO in 2001 and became the world’s factory – one of several factors that caused the large increase in energy intensity
0
500
1,000
1,500
2,000
2,500
3,000
3,500
4,000
4,500
1980 1985 1990 1995 2000 2005
kg c
oal e
quiv
alen
t/10
,000
(20
00)
RM
B
Average Annual Decline of5% per year
Average Annual Increase of2% per year

18
China’s Energy Intensity Compared to the U.S.
Source: Asia Society, 2008. Common Challenge, Collaborative Response: A Roadmap for U.S.-China Cooperation on Energy and Climate Change. http://www.asiasociety.org/taskforces/climateroadmap/US_China_Roadmap_on_Climate_Change.pdf
Comparison is based on current exchange rates and thus not reflective of physical energy intensities
1919
China’s Policies to Reduce Energy Use and Greenhouse Gas Emissions
Major policy initiatives were introduced Major policy initiatives were introduced in 2005 to reverse the trends in energy in 2005 to reverse the trends in energy
demand growth experienced from demand growth experienced from 2002 to 20052002 to 2005

2020
In 2005, China Adopted an In 2005, China Adopted an Energy Intensity Reduction TargetEnergy Intensity Reduction Target
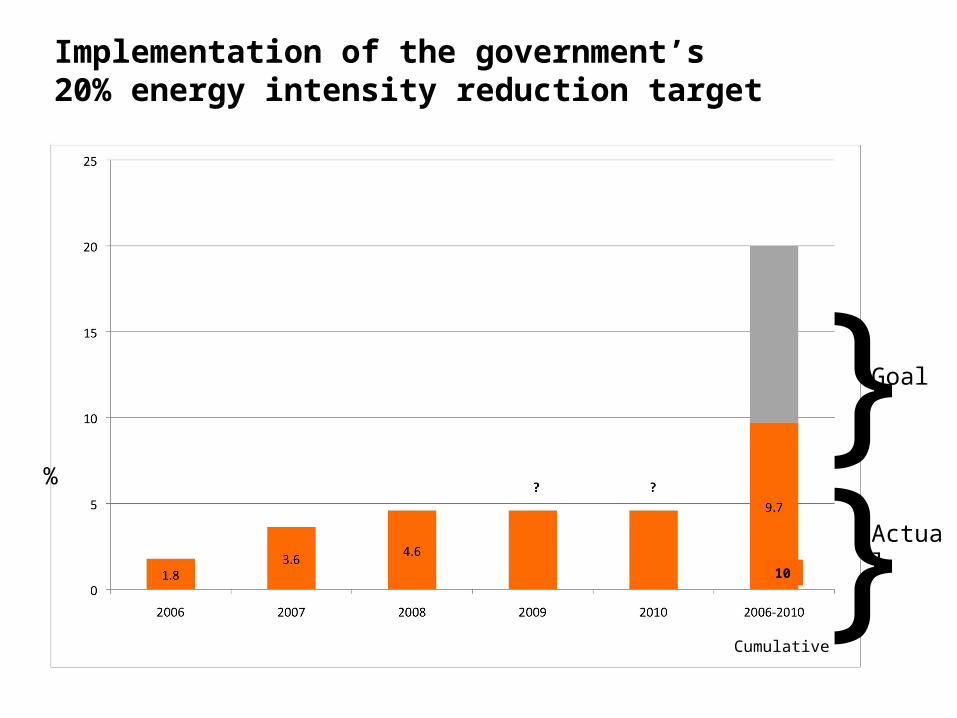
• November 2005: Premier Wen Jiabao at the Plenary of the Communist Party: “Energy use per unit of GDP must be reduced by 20% from 2006 to 2010”
• China’s 11th Five Year Plan (2006-2010): outlined goal of reducing energy consumption per unit of GDP by 20% between 2006 and 2010
• Depending upon the GDP growth rate - 2010 energy− 5-year savings of about 700 Mtce (19.5 Quads)
2121
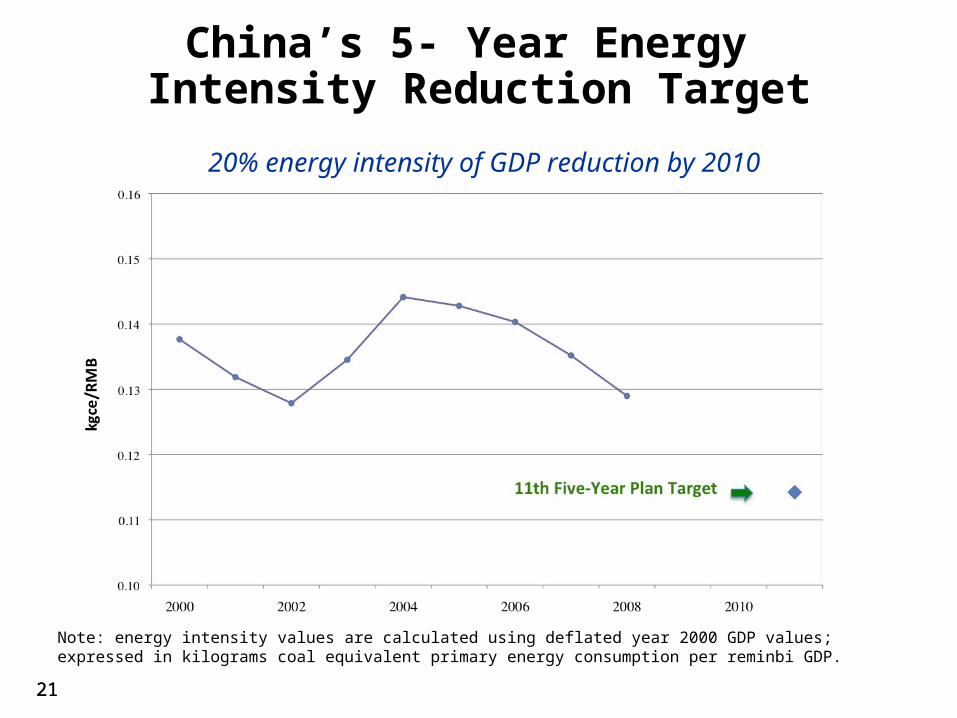
China’s 5- Year Energy Intensity Reduction Target
Note: energy intensity values are calculated using deflated year 2000 GDP values; expressed in kilograms coal equivalent primary energy consumption per reminbi GDP.
20% energy intensity of GDP reduction by 2010
%
}} Actual
Goal
Cumulative
Implementation of the government’s 20% energy intensity reduction target
10
2323
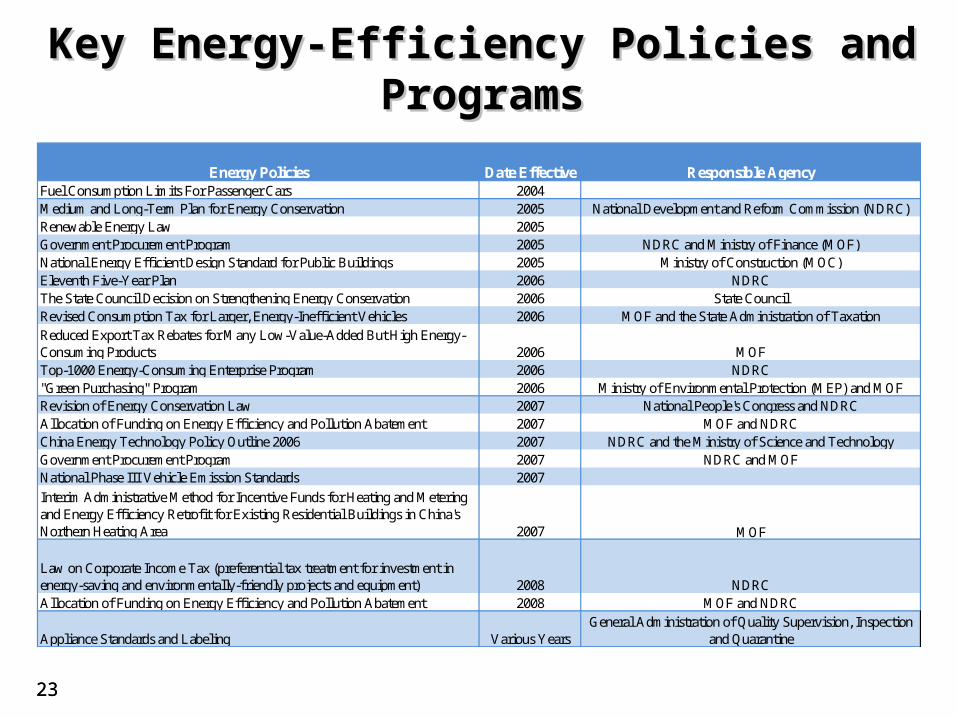
Key Energy-Efficiency Policies and ProgramsKey Energy-Efficiency Policies and Programs
Energy Policies Date Effective Responsible AgencyFuel Consumption Limits For Passenger Cars 2004Medium and Long-Term Plan for Energy Conservation 2005 National Development and Reform Commission (NDRC)Renewable Energy Law 2005Government Procurement Program 2005 NDRC and Ministry of Finance (MOF)National Energy Efficient Design Standard for Public Buildings 2005 Ministry of Construction (MOC)Eleventh Five-Year Plan 2006 NDRCThe State Council Decision on Strengthening Energy Conservation 2006 State CouncilRevised Consumption Tax for Larger, Energy-Inefficient Vehicles 2006 MOF and the State Administration of TaxationReduced Export Tax Rebates for Many Low-Value-Added But High Energy-Consuming Products 2006 MOFTop-1000 Energy-Consuming Enterprise Program 2006 NDRC"Green Purchasing" Program 2006 Ministry of Environmental Protection (MEP) and MOFRevision of Energy Conservation Law 2007 National People's Congress and NDRCAllocation of Funding on Energy Efficiency and Pollution Abatement 2007 MOF and NDRCChina Energy Technology Policy Outline 2006 2007 NDRC and the Ministry of Science and TechnologyGovernment Procurement Program 2007 NDRC and MOFNational Phase III Vehicle Emission Standards 2007
Interim Administrative Method for Incentive Funds for Heating and Metering and Energy Efficiency Retrofit for Existing Residential Buildings in China's Northern Heating Area 2007 MOF
Law on Corporate Income Tax (preferential tax treatment for investment in energy-saving and environmentally-friendly projects and equipment) 2008 NDRCAllocation of Funding on Energy Efficiency and Pollution Abatement 2008 MOF and NDRC
Appliance Standards and Labeling Various YearsGeneral Administration of Quality Supervision, Inspection
and Quarantine

2424
Initial Results of Top-1000 ProgramInitial Results of Top-1000 Program
• Top-1000 Enterprises Energy Use Report - 2007– 954 enterprises submitted statistics– 942 enterprises submitted energy audit reports
• Top-1000 Enterprises saved 20 Mtce (0.6 EJ, 0.56 Quads) in 2006• Recently reported 2007 annual savings – 38 Mtce (1 Quad)
• Two scenarios:– 2010 Target Achieved
• 100 Mtce (2.8 Quads) = ~240 MtCO2
– Current Trends• 175 Mtce (4.9 Quads) = ~420 MtCO2
Top-1000 Program on track to deliver ~20% of the energy savings needed to meet the 2010 20% E/GDP goal

Industry - Top-1000 Industry Program
49
142
245
174
0
50
100
150
200
250
2006 2007 2010 Goal AB 32 2020Goal
Annual CO2 reductions (million tons)

Renewable Energy Renewable Energy
• Installed wind capacity doubled in 2008 Installed wind capacity doubled in 2008 reaching 12.8 GW and exceeding reaching 12.8 GW and exceeding original targetsoriginal targets
32G
W
Installed Wind

Recent Achievements in ChinaRecent Achievements in China
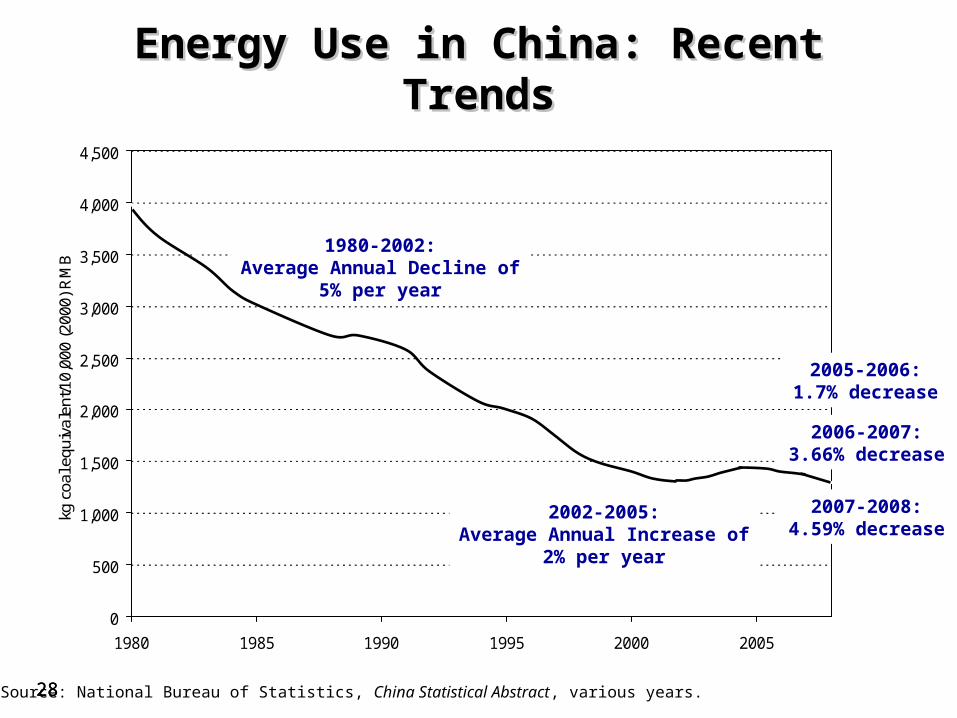
With these strong policies and With these strong policies and programs, China has been able to programs, China has been able to
reverse the increase of energy use per reverse the increase of energy use per unit of GDP and has made remarkable unit of GDP and has made remarkable
progress in improving the country’s progress in improving the country’s energy efficiencyenergy efficiency and and reducing energy- reducing energy-
related GHG emissionsrelated GHG emissions..
2828
0
500
1,000
1,500
2,000
2,500
3,000
3,500
4,000
4,500
1980 1985 1990 1995 2000 2005
kg c
oal e
quiv
alen
t/10,
000
(200
0) R
MB
Source: National Bureau of Statistics, China Statistical Abstract, various years.
1980-2002:Average Annual Decline of
5% per year
Energy Use in China: Recent TrendsEnergy Use in China: Recent Trends
2002-2005:Average Annual Increase of
2% per year
2005-2006:1.7% decrease
2006-2007:3.66% decrease
2007-2008:4.59% decrease

CHINA’S GREEN STIMULUS
•Economic Stimulus Dollars Devoted to Green Projects (Billion USD)
•Green Stimulus Dollars as a ratio of 2008 GDP
Stimulus data from HSBC Global Research March 31, 2009 updates to the report “A Climate for Recovery: The Color of Stimulus Goes Green”.
GDP data from IMF world economic outlook data, retrieved April 2009.
US CHINA
$94
$201
CHINAUS
0.7%
4.6%

CONCLUSIONS
• High carbon intensity;• Leading in rate of decarbonization;• Long way to go towards low carbon
economy
Related Documents