Toward full economic valuation of forest fuels-reduction treatments Ching-Hsun Huang * , Alex Finkral 1 , Christopher Sorensen, Thomas Kolb School of Forestry, Northern Arizona University, 200 East Pine Knoll Drive, Flagstaff, AZ 86011-5018, USA article info Article history: Received 15 February 2012 Received in revised form 12 May 2013 Accepted 27 August 2013 Available online Keywords: Arizona Carbon credit Carbon sequestration Forest economics Pinus ponderosa Restoration abstract Our goal was to move toward full economic valuation of fuels-reduction treatments applied to ponderosa pine (Pinus ponderosa) forests. For each of five fuels-reduction projects in northern Arizona, we calcu- lated the economic value of carbon storage and carbon releases over one century produced by two fuels- reduction treatments of thinning following by prescribed burning every one (Rx10) or two (Rx20) de- cades and for no treatment followed by intense wildfire once in the first 50 years (HF50) or once in the first 100 years (HF100). Our estimates include two uses of harvested wood, the current use as pallets, and multiproduct use as paper, pallets, and construction materials. Additionally, we included the economic value of damage and loss from wildfire. Results indicate that treatments increase carbon stock in live trees over time; however, the inclusion of carbon emissions from treatments reduces net carbon storage and thereby carbon credits and revenue. The economic valuation shows that the highest net benefit of $5029.74 ha 1 occurs for the Rx20 treatment with the HF50 baseline and the high estimated treatment benefits of avoided losses, regional economic benefits, and community value of fire risk reduction. The lowest net benefit of $3458.02 ha 1 occurs for the Rx10 treatment with the HF100 baseline and the low estimated treatment benefits. We conclude that current nonmarket values such as avoided wildfire damage should be included with values of traditional wood products and emerging values of carbon storage to more appropriately estimate long-term benefits and costs of forest fuels-reduction treatments. Ó 2013 Elsevier Ltd. All rights reserved. 1. Introduction Historically, low-severity fires burned frequently in south- western ponderosa pine (Pinus ponderosa Dougl. Ex Laws) forests and maintained open, fire-resilient stands (Covington and Moore, 1994; Swetnam and Baisan, 1996). However, fire exclusion over the last century has resulted in an overstocking of pole-sized trees, creating forests that now contain on average 2.3 times more live tree carbon than pre-fire exclusion forests (Covington and Moore, 1994; Hurteau et al., 2011). Current dense forests are at high risk of intense burning that releases large pulses of CO 2 into the at- mosphere (Fulé et al., 2004; Wiedinmyer and Neff, 2007) and often causes biome shifts from forest to low-biomass non-forest for de- cades or longer (Roccaforte et al., 2012; Ross et al., 2012; Bowman et al., 2013). Fuels-reduction treatments such as mechanical thin- ning and low-intensity prescribed burning extract small-diameter trees and reduce fuel mass, fuel continuity, and subsequent fire intensity and tree mortality (Agee and Skinner, 2005; Finney et al., 2005; Fulé et al., 2012). Whether the decrease in fire intensity and reduction of deforestation caused by fuels-reduction treatments helps offset long-term anthropogenic carbon emissions is contro- versial because the offset is weakened or perhaps reversed when carbon emissions from harvesting, wood production and use, and prescribed burning are considered (Sorensen et al., 2011; Campbell et al., 2012). The potential for carbon storage and release resulting from fuels-reduction treatments extends beyond the biological carbon cycle of forest ecosystems. Harvested wood products store carbon until discarded, after which the carbon is emitted rapidly through combustion or slowly through decay (Skog et al., 2004). The amount of carbon sequestered in wood products depends on the amount of timber harvested, its use in primary wood products, and the longevity of wood in end-use products (Row and Phelps, 1996; Skog et al., 2004). While wood products can constitute a carbon sink, associated emissions produced during harvesting, trans- portation of logs, manufacturing, and product distribution affect net carbon sequestration (Pingoud and Lehtilä, 2002). Therefore, full accounting of the impacts of fuels-reduction treatments on long-term carbon storage should include carbon stock in forest, carbon emissions from treatments, wildfires and production of wood products, and carbon storage in wood products. * Corresponding author. Tel.: þ1 928 523 7502; fax: þ1 928 523 1080. E-mail addresses: [email protected] (C.-H. Huang), alex@ forestlandgroup.com (A. Finkral), [email protected] (C. Sorensen), [email protected] (T. Kolb). 1 Present address: The Forestland Group, 1512 East Franklin Street, Chapel Hill, NC 27514, USA. Tel.: þ1 919 913 1174. Contents lists available at ScienceDirect Journal of Environmental Management journal homepage: www.elsevier.com/locate/jenvman 0301-4797/$ e see front matter Ó 2013 Elsevier Ltd. All rights reserved. http://dx.doi.org/10.1016/j.jenvman.2013.08.052 Journal of Environmental Management 130 (2013) 221e231

Welcome message from author
This document is posted to help you gain knowledge. Please leave a comment to let me know what you think about it! Share it to your friends and learn new things together.
Transcript
lable at ScienceDirect
Journal of Environmental Management 130 (2013) 221e231
Contents lists avai
Journal of Environmental Management
journal homepage: www.elsevier .com/locate/ jenvman
Toward full economic valuation of forest fuels-reduction treatments
Ching-Hsun Huang*, Alex Finkral 1, Christopher Sorensen, Thomas KolbSchool of Forestry, Northern Arizona University, 200 East Pine Knoll Drive, Flagstaff, AZ 86011-5018, USA
a r t i c l e i n f o
Article history:Received 15 February 2012Received in revised form12 May 2013Accepted 27 August 2013Available online
Keywords:ArizonaCarbon creditCarbon sequestrationForest economicsPinus ponderosaRestoration
* Corresponding author. Tel.: þ1 928 523 7502; faxE-mail addresses: [email protected]
forestlandgroup.com (A. Finkral), [email protected] (T. Kolb).
1 Present address: The Forestland Group, 1512 EasNC 27514, USA. Tel.: þ1 919 913 1174.
0301-4797/$ e see front matter � 2013 Elsevier Ltd.http://dx.doi.org/10.1016/j.jenvman.2013.08.052
a b s t r a c t
Our goal was to move toward full economic valuation of fuels-reduction treatments applied to ponderosapine (Pinus ponderosa) forests. For each of five fuels-reduction projects in northern Arizona, we calcu-lated the economic value of carbon storage and carbon releases over one century produced by two fuels-reduction treatments of thinning following by prescribed burning every one (Rx10) or two (Rx20) de-cades and for no treatment followed by intense wildfire once in the first 50 years (HF50) or once in thefirst 100 years (HF100). Our estimates include two uses of harvested wood, the current use as pallets, andmultiproduct use as paper, pallets, and construction materials. Additionally, we included the economicvalue of damage and loss from wildfire. Results indicate that treatments increase carbon stock in livetrees over time; however, the inclusion of carbon emissions from treatments reduces net carbon storageand thereby carbon credits and revenue. The economic valuation shows that the highest net benefit of$5029.74 ha�1 occurs for the Rx20 treatment with the HF50 baseline and the high estimated treatmentbenefits of avoided losses, regional economic benefits, and community value of fire risk reduction. Thelowest net benefit of �$3458.02 ha�1 occurs for the Rx10 treatment with the HF100 baseline and the lowestimated treatment benefits. We conclude that current nonmarket values such as avoided wildfiredamage should be included with values of traditional wood products and emerging values of carbonstorage to more appropriately estimate long-term benefits and costs of forest fuels-reduction treatments.
� 2013 Elsevier Ltd. All rights reserved.
1. Introduction
Historically, low-severity fires burned frequently in south-western ponderosa pine (Pinus ponderosa Dougl. Ex Laws) forestsand maintained open, fire-resilient stands (Covington and Moore,1994; Swetnam and Baisan, 1996). However, fire exclusion overthe last century has resulted in an overstocking of pole-sized trees,creating forests that now contain on average 2.3 times more livetree carbon than pre-fire exclusion forests (Covington and Moore,1994; Hurteau et al., 2011). Current dense forests are at high riskof intense burning that releases large pulses of CO2 into the at-mosphere (Fulé et al., 2004; Wiedinmyer and Neff, 2007) and oftencauses biome shifts from forest to low-biomass non-forest for de-cades or longer (Roccaforte et al., 2012; Ross et al., 2012; Bowmanet al., 2013). Fuels-reduction treatments such as mechanical thin-ning and low-intensity prescribed burning extract small-diametertrees and reduce fuel mass, fuel continuity, and subsequent fire
: þ1 928 523 1080.(C.-H. Huang), alex@
[email protected] (C. Sorensen),
t Franklin Street, Chapel Hill,
All rights reserved.
intensity and tree mortality (Agee and Skinner, 2005; Finney et al.,2005; Fulé et al., 2012). Whether the decrease in fire intensity andreduction of deforestation caused by fuels-reduction treatmentshelps offset long-term anthropogenic carbon emissions is contro-versial because the offset is weakened or perhaps reversed whencarbon emissions from harvesting, wood production and use, andprescribed burning are considered (Sorensen et al., 2011; Campbellet al., 2012).
The potential for carbon storage and release resulting fromfuels-reduction treatments extends beyond the biological carboncycle of forest ecosystems. Harvested wood products store carbonuntil discarded, after which the carbon is emitted rapidly throughcombustion or slowly through decay (Skog et al., 2004). Theamount of carbon sequestered in wood products depends on theamount of timber harvested, its use in primary wood products, andthe longevity of wood in end-use products (Row and Phelps, 1996;Skog et al., 2004). While wood products can constitute a carbonsink, associated emissions produced during harvesting, trans-portation of logs, manufacturing, and product distribution affectnet carbon sequestration (Pingoud and Lehtilä, 2002). Therefore,full accounting of the impacts of fuels-reduction treatments onlong-term carbon storage should include carbon stock in forest,carbon emissions from treatments, wildfires and production ofwood products, and carbon storage in wood products.
C.-H. Huang et al. / Journal of Environmental Management 130 (2013) 221e231222
The costs of wildfires to society include direct costs (i.e., sup-pression costs, property losses, timber losses, aid to evacuatedresidents, damages to utility lines and recreation facilities), reha-bilitation costs, indirect costs (i.e., tax and business revenue losses),and special value losses (i.e., human life losses, ecosystem servicelosses) (Lynch, 2004; Dale, 2009; Impact DataSource, 2013). Pre-vious studies that have estimated wildfire impacts on societal andecological services such as wildlife habitat, vegetation resilience,carbon sequestration, watersheds, tourism, public health andtransportation suggest undervaluation of fuels-reduction treat-ments by failure to include broader wildfire impacts (Morton et al.,2003; Mason et al., 2006; Mercer et al., 2007; Richardson et al.,2012; Vegh et al., 2013; Impact DataSource, 2013). Few studieshave combined economic valuation of treatment costs, forest car-bon sequestration, wildfire and prescribed fire carbon releases, anddamages/losses avoided via wildfire reduction to evaluate theeconomic benefits of fuels-reduction treatments. In this study, weused well-documented operational fuels-reduction treatmentsapplied to five ponderosa pine forests in northern Arizona(Sorensen et al., 2011) to broaden economic valuation of treatmentsto include numerous current market and nonmarket benefits andcosts. Our goal is to advance forest economics and policy toward fulleconomic valuation of fuels-reduction treatments. Specifically, theobjectives are to compare 1) forest net carbon storage between twowildfire scenarios and two management scenarios, 2) carboncredits and carbon revenue between scenarios with two carbonaccounting approaches and two baseline approaches, and 3) netpresent value (NPV) among scenarios using a variety of treatmentbenefits including avoided loss.
2. Methods
2.1. Study sites
Our studywas basedondata fromfive stands on federal and statelands in northern Arizona that were thinned to reduce fire risk: a)Government Hill (GH, 35�190N and 111�580W) located on the KaibabNational Forest; b) Horse-Pine (HP, 35�130N and 111�590W) locatedon the Kaibab National Forest; c) Mountainaire (MT, 35�070N and111�390W) located on the Coconino National Forest; d) Rogers North(RN, 35�090N and 111�560W); and e) a restoration thinning site (RT,35�090N and 111�430W), both located on Northern Arizona Uni-versity’s Centennial Forest. All sites were located near Flagstaff,Arizona, where the mean annual temperature from 2003 to 2009was 8.3 �C, with a mean July temperature of 20.0 �C and a meanDecember temperature of �1.9 �C (WRCC, 2010). Annual precipita-tion ranges between 271 and 882 mm with an annual mean of452 mm (WRCC, 2010). The driest months in this region typicallyoccur in the late-spring/early-summer followed by monsoonalrainfall in the later summer months and snowfall in the winter(Sheppard et al., 2002). All sites were dominated by ponderosa pinewith small amounts of the following species: quaking aspen (Pop-ulus tremuloides (Michx.)), Douglas-fir (PseudotsugamenziesiiMirb.),white fir (Abies concolor (Gord. & Glend.)), southwesternwhite pine(Pinus strobiformis Engelm.), Gambel oak (Quercus gambelii Nutt.),alligator juniper (Juniperus deppeana Steud.), Arizona cypress(Cupressus arizonica Greene), and piñon pine (Pinus edulis Engelm.).
The silvicultural prescriptions for all five sites had the primaryobjective of reducing the risk of high-intensity fire. The treatmentsare best described as low and crown thinnings of varying in-tensities, which are commonly used in this region to reduce standdensity, canopy continuity, and ladder fuels (Covington et al., 1997;Fulé et al., 1997; Finkral and Evans, 2008). Mostly smaller diameterponderosa pine trees (<40 cm diameter at breast height (DBH))were harvested alongwith some larger trees to open up the canopy.
In general, older trees (approximately 135 years old), standing deadtrees, and all non-pine tree species were retained unless theypresented safety hazards. Sorensen et al. (2011) presents detailedinformation on the effect of thinning on vegetation at each site.
2.2. Wildfire and management scenarios
Fuels-reduction treatments in ponderosa pine stands reducestanding carbon stocks while releasing carbon through the com-bustion of fuel in logging machinery, burning slash, and the decayof logging slash and wood products. Any activity that removesbiomass from a forest carbon project site, including a thinningtreatment or prescribed burning, removes carbon that wouldotherwise be sequestered until it is released by decay or burning.Therefore, these reductions and releases of stored carbon must beexamined in detail to more fully understand the total carbon stockand net carbon storage. We used pre-treatment and one-year post-treatment empirical field measurements of overstory conditionsand surface fuels to project future site growth and carbon stocksand releases under different wildfire and management scenariosfor each site. The projections were made using the Central Rockiesvariant of the Forest Vegetation Simulator (Dixon, 2008) with theFire and Fuels Extension (Reinhardt and Crookston, 2003;Reinhardt et al., 2008) parameterized for the study sites(Sorensen et al., 2011). The Fire and Fuels Extension uses weather,fuels, and stand characteristics to predict fire behavior, which inturn allows predictions of tree growth and mortality, fuel con-sumption, and carbon emissions (Reinhardt and Holsinger, 2010).
We chose a 100-year timeframe for this project as this repre-sents the crediting period for which baseline onsite carbon stocksmust be maintained under the Forest Project Protocol of theClimate Action Reserve (Version 3.2). We included two wildfirescenarios (HF50 and HF100) and two management scenarios (Rx10and Rx20) in the projections at each site. Both HF (high-intensityfire) scenarios are based on the occurrence of a high-intensity firein untreated stands under hazardous fire conditions (wind speed22 m s�1, air temperature 29 �C, very dry fuels) that consequentlykills all trees, followed by ponderosa pine regeneration 20 yearsafter burning. The HF50 (high fire risk) scenario assumes that onehigh-intensity fire occurs within the next 50 years and no fire oc-curs the following 50 years. For the HF50 scenario, six 100-yearsimulations were run on the pre-treatment stands based on theoccurrence of one high-intensity fire in each of years 2010, 2020,2030, 2040, 2050, and 2060. Average century-scale carbon stocks(above- and below-ground live and dead trees and surface fuels)and releases over these six simulations were used for the HF50scenario. Likewise, the HF100 (moderate fire risk) scenario assumesthat one high-intensity fire occurs within the next 100 years; 11simulations were run for high-intensity fire occurring each decadebetween 2010 and 2110 and averaged per century. Both Rx (pre-scribed fire) scenarios, occurring after thinning, were based onprescribed surface fires applied to post-treatment stand conditionsunder low hazard fire conditions (wind speed 2.4 m s�1, air tem-perature 10.0 �C, moist fuel conditions). The Rx10 scenario assumesthe application of prescribed fire every decade between 2010 and2110, and the Rx20 scenario assumes the application of prescribedfire every two decades. Both Rx scenarios included impacts ofprescribed fire on mortality of mature trees and seedlings (seeSorensen et al., 2011). As for the HF scenarios, carbon stocks andreleases for the Rx scenarios were calculated per century.
2.3. Total carbon stock and net carbon storage
We estimated carbon biomass in the stands, carbon releasesassociated with the management and wildfire scenarios, and long-
C.-H. Huang et al. / Journal of Environmental Management 130 (2013) 221e231 223
term carbon storage in wood products. We calculated total carbonstock as the sum of aboveground (AG) and below-ground (BG)standing live and dead trees and surface fuels (woody debris, litterand duff). The net carbon storage was total carbon stock minuscarbon releases from wildfire (HF100 or HF50) or from treatments(thinning and Rx10 or Rx20). Data for carbon stored in AG and BGstanding live and dead trees and in surface fuels, and carbon re-leases from wildfires and prescribed fires over the next century(2010e2110) for each of the study sites were obtained fromSorensen et al. (2011). We calculated carbon releases from thinningas the total carbon emissions from logging, hauling logs to pro-cessing facilities, manufacturing, end product distribution andslash burning. We worked with logging contractors to track dieseland gasoline consumption of all logging machinery used duringharvesting, such as chainsaws, skidders, feller-bunchers, pro-cessors, and forwarders. In addition, we tracked diesel fuel andgasoline used to transport loggingmachinery and employees to andfrom the study sites each day. We also tracked the number of logloads and average load weights. We assumed that each truck wouldcomplete one round trip from the harvest site to the processingfacility and back. We multiplied the number of loads from each siteby the number of kilometers in one round trip and then divided bya fuel consumption rate of 2.6 km L�1 to calculate the liters of dieselfuel consumed during hauling. Finkral and Evans (2008) reported afuel consumption rate of 2.6 km L�1 based on trucking contractorreports, which matches well with national averages (about2.3 km L�1) reported by the US Department of Energy for class 8trucks (Ward et al., 2009). We used the same method to estimatethe number of liters of diesel fuel used to distribute the endproducts to retail outlets based on a 600 km distribution radius,which would encompass feasible distribution endpoints (e.g. LosAngeles, CA and Albuquerque, NM). As a conservative measure, weassumed that the number of loads distributed as end productswould be equal to the number of loads of green logs hauled to theprocessing facility. We converted fuel to carbon assuming 99% of allcarbon in fuel is oxidized, and the carbon content of diesel fuel to be733.9 g C L�1 (Environmental Protection Agency, 2005a,b). We alsocalculated the amount of carbon emitted during the milling andprocessing of wood products. For every Mg C ha�1 of sawn woodproduct or paper produced, we estimated 0.07 Mg C ha�1 or0.06 Mg C ha�1 was released to the atmosphere, respectively(Pingoud and Lehtilä, 2002).
Timber harvested from GH, HP and MT was used for pallets, andtimber harvested from RN and RT was used solely for firewood.Historically, northern Arizona supported a more diverse timber-processing infrastructure and wood products industry than existstoday, producing a variety of products that included dimensionlumber and wood pulp. To understand potential carbon storageopportunities that could once again be realized from producing agreater diversity of wood products in this region, we investigated amultiproduct scenario that produced three types of end-use woodproducts: paper, pallets and construction materials (e.g. dimensionlumber, plywood, oriented strandboard). We calculated carbonstored in wood products derived from timber removed from thesites under both current use as pallets and the assumed multi-product scenario. RN and RT were included under both scenariosfor the comparison of the treatments among sites. We examinedhow different end-use wood products generated from fire riskreduction thinnings impact the long-term carbon storage.Wemadewood utilization assumptions based on DBH thresholds of 13, 18and 30 cm for paper, pallets and construction materials, respec-tively (Finkral and Evans, 2008).
1.DBH < 13 cm; cut trees would be left on the site due to lack ofmerchantability.
2.13 cm � DBH < 18 cm; timber would be made into paperproducts.3.18 cm � DBH < 30 cm; timber would be made into pallets.
4. DBH � 30 cm; timber would be made into constructionmaterials.
We used a locally developed allometric equation of ponderosapine biomass (Kaye et al., 2005) to calculate dry biomass of stemwood (not including branches, bark and foliage) removed from thesites. We converted dry biomass to carbon by multiplying by 48%,the carbon percentage factor for ponderosa pine wood (Birdsey,1992; Kaye et al., 2005). We then multiplied the total carbonweight by the mill efficiency of 70.4% for Rocky Mountain (South)region for softwood to determine the total carbon transferred intowood products (Climate Action Reserve, 2010a) and assumed thatthe reminder of the harvested carbon was emitted to the atmo-sphere immediately. We used the 100-year average storage factorsof 0.058, 0.176 and 0.582 for paper, pallets and construction ma-terials, respectively, to determine the average carbon storageremaining inwood products over a 100-year period (Climate ActionReserve, 2010b).
2.4. Carbon credit and carbon revenue
We calculated carbon revenues using two accounting ap-proaches: 1) reduced buffer pool of carbon in AG and BG live treescalculated based on wildfire risk associated with the level of fuels-reduction treatments under the Climate Action Reserve (CAR) for-est project protocol, and 2) calculated difference in net carbonstocks betweenwith andwithout treatments. Under the first carbonaccounting approach, we determined a forest project’s reversal riskrating, which affects yearly contributions to the buffer pool, aholding account for forest project climate reserve tonnes (CRT)under the CAR protocol. A percentage of CRTs, issued for verifiedgreenhouse gas reduction and removals, is required to contribute tothe buffer pool, and the required size of the contribution iscontingent upon the forest project’s risk rating for reversals. Thereversal risk rating is calculated based on financial (financial failureleading to bankruptcy), management (illegal harvesting, conver-sion to non-forest uses and over-harvesting), social (changinggovernment policies, regulations, and general economic condi-tions) and natural disturbance (wildfire, disease/insects, and otherepisodic catastrophic events) risks. We used the default ratings forpublic ownership provided in the CAR protocol for the risks offinancial failure, social, disease or insect outbreak, and other cata-strophic events, with corresponding ratings of 1, 2, 3, and 3%,respectively. The long-term fire risk potential of a forest projectdepends on the level of fuel treatment; the wildfire risk rating wasmultiplied by 50, 66.3, and 100% for high level and medium level offuel treatment and no fuels-reduction treatments, respectively(Climate Action Reserve, 2010b). We assumed that the Rx10 man-agement scenario was a high-level fuel treatment and the Rx20scenario was a medium-level fuel treatment. We determined thatthe total reversal risk ratings of the project were 43.40, 54.71, and78.09% for high and medium levels of fuels-reduction treatments,and no fuels-reduction treatments, respectively. In comparisonwith no fuels-reduction treatments, the percentages of wildfire riskreduction were 34.69% (¼78.09 � 43.40%) and 23.38%(¼78.09 � 54.71%), respectively, when high and medium levels offuels-reduction treatments were conducted. Currently, the CARprotocol does not require deductions of carbon emissions producedby treatments. Under the second carbon accounting approach, awith-and-without analysis (Huang and Kronrad, 2001, 2006) wasconducted to compare net carbon storage with and without man-agement scenarios of Rx10 or Rx20. Under both carbon accounting

C.-H. Huang et al. / Journal of Environmental Management 130 (2013) 221e231224
approaches, we used two sets of baseline data: 1) no treatmentswith HF100 and 2) no treatments with HF50 to reflect the impact ofbaseline selection on the calculation of carbon credit.
According to a U.S. Environmental Protection Agency (EPA)modeling analysis (2009), the allowance price, the marginal costof greenhouse gas abatement, was projected to range from $13 to$15 Mg�1 CO2 equivalents (Mg�1 CO2 Eq.) across all modeled sce-narios in 2015 without constraints on international offsets, andfrom $13 to $24 Mg�1 CO2 Eq. with various constraints on inter-national offsets. Therefore, we investigated three carbon pricescenarios of $13, $15 and $24Mg�1 CO2 Eq. One mass unit of carbonequates to 3.67 units of CO2. Thus, the carbon prices equivalent tothe CO2 prices were $47.71, $55.05 and $88.08 Mg�1 C Eq.,respectively.
2.5. Treatment benefits
The net present value of a treatment represents the presentvalue of a treatment’s benefits minus the present value of its costsin monetary terms. We assumed that all areas of forests if left un-treated would burn sometime in the next 50 or 100 years underHF50 or HF100, respectively, and the probability that each areawould burn in any year would be equal. We used a simplifiedaverage time of 25 and 50 years, one-half of the time intervals, forall areas to burn under HF50 and HF100, respectively. This approachis similar to the parametric present value estimations of fire riskcosts conducted by Mason et al. (2006). Additionally, under eachwildfire scenario, we calculated values of treatment benefits withlow and high estimates based on our literature review and calcu-lations. The treatment benefits we investigated included a) firesuppression costs avoided, b) fatalities avoided, c) facility lossesavoided, d) timber losses avoided, e) regeneration and rehabilita-tion costs avoided, f) regional economic benefits, g) communityvalue of fire risk reduction, forest health and water supply pro-tection, and h) carbon revenue. To perform discounted cash flowanalyses and calculate NPVs of treatment net benefits, all the his-torical costs or losses were adjusted to 2012 values using theConsumer Price Index (CPI) inflation calculator by U.S. Bureau ofLabor Statistics (BLS). All the future costs or benefits which mightincur after 2012 were projected using an average real annualemployment cost index of 0.62% for civilian workers based on the30-year (1982e2012) historical costs of employee compensationincluding wages/salaries, and benefits and expressed in constantdollars (excluding inflation) (BLS, 2006, 2013a). We calculated anaverage annual inflation rate of 2.93% using the 30-year (1982e2012) CPIs for all urban consumers and all items (BLS, 2013b). Weused an annual 4% discount rate, representing the federal govern-ment’s long-term investment on national forests (Huang andSorensen, 2011; Vegh et al., 2013).
a. Fire suppression costs avoided
We researched the suppression costs of wildfire over the lastdecade and present them here as per-hectare values, in 2012 dol-lars. Between 2000 and 2003, the suppression costs of several largewildfires in the western U.S. were $317.01 ha�1 (RodeoeChediski),$715.59 ha�1 (Canyon Ferry Complex), $967.89 ha�1 (Hayman),$1512.97 ha�1 (Old, Grand Prix, Padua), $1699.14 ha�1 (MissionaryRidge), and $2574.36 ha�1 (Cerro Grande) (Dale, 2009). We alsoinvestigated fire suppression costs (including aircraft, crews,equipment and direct personal) that exceeded $10 million fromFY2006e2009 presented in Large Fire Cost Review (Secretary ofAgriculture, 2007e2010). The fire suppression costs ranged from$283.50 ha�1 (Derby) to $5740.54 ha�1 (Happy Camp) in 2006, from$44.39 ha�1 (Murphy Complex) to $10,949.02 ha�1 (Angora) in
2007, from $434.53 ha�1 (Gunbarrel) to $10,306.03 ha�1 (GnarlRidge) in 2008, and from $1030.82 ha�1 (La Brea) to $7064.84 ha�1
(Backbone) in 2009. We calculated that the average per-hectare firesuppression costs were $2076.72, $1563.61, $2865.67 and $4233.80for FY2006, 2007, 2008 and 2009, respectively. Additionally, Gebertand Black (2012) presented averaged direct suppression expendi-tures of $4772.46 ha�1 for 823 federally managed large fires (121þha) between FY2006 and 2008. Therefore, in this study, we chosefire suppression costs of $1563.61 and $4772.46 ha�1 to be our lowand high estimates, respectively.
b. Fatalities avoided
The fatalities associated with wildfires were 25, 15, 8, 11 and 11human lives for FY2008 through 2012 (National Interagency FireCenter-Risk Management Committee, 2008e2012). The corre-sponding reported wildland fire burned areas for the same timeperiod were 2.1, 2.4, 1.4, 3.5 and 3.7 million hectares (NationalInteragency Coordination Center, 2008e2012). Using the dataabove, we calculated the wildland fire fatalities were 11.7, 6.3, 5.8,3.1 and 3.0 people per million burned hectares from FY2008 to2012. Consequently, we used the value of statistical life (VSL) toplace an economic value of the loss of human life related to wild-fires. The VSL is commonly used to quantify the economic valuesthat society as a whole is willing to pay to reduce the statisticalincidence of premature mortality in the population by one full“statistical life”, as opposed to a specific person’s life (Wang and He,2010; EPA, 2011). As presented in Viscusi (1992), 26 studies whichemployed labor market or contingent valuation techniques pro-vided a range of mortality valuation estimates per statistical inci-dence of premature mortality. It was assessed that a central value of$7.4 million (in 2006 dollars) for VSL provided the best fit to thedistribution of mortality risk valuations estimates for the studies(EPA, 2011). Using the Consumer Price Indices from 2006 to 2012,we adjusted this central value to $8.4 million per VSL in 2012dollars. Using the data above, we calculated the economic loss ofhuman life due to wildfires was $98.47, $52.80, $48.72, $26.32 and$24.89 ha�1 for FY2008 through 2012. The $24.89 and $98.47 ha�1
figureswere selected to be the lowand high estimates, respectively.
c. Facility losses avoided
Based on claims of insured property damage, the estimatedwildfires facility insured losses (in 2012 dollars) were $674.1,$198.0, $220.5, $872.1, and $595.0 million dollars annually forFY2008 through 2012 (Munich Re NatCatSERVICE, 2009e2013). Thecorresponding reported annual wildland fire burned areas for thesame time period were 2.1, 2.4, 1.4, 3.5 and 3.7 million hectares(National Interagency Coordination Center, 2008e2012). Wecalculated the per-hectare facility insured losses due to wildfireswere $314.74, $82.60, $159.19, $247.38 and $159.62 for FY2008through 2012. The $82.60 and $314.74 ha�1
figures were selected tobe the low and high estimates, respectively.
d. Timber losses avoided
Under the White Mountain Stewardship Project, a 10-yr stew-ardship contract designed to restore forest health and reducewildfire risks by thinning 60,703 ha of small-diameter ponderosapine trees in the White Mountains of Arizona, approximately135,921 m3 of timber were removed annually from 2023 to 4047treated hectares (Selig et al., 2010). This is equivalent to the removalof 67.2e33.6 m3 ha�1. The 2012 averaged ponderosa pine timberprice on Coconino and Kaibab National Forests was $1.77 per m3

C.-H. Huang et al. / Journal of Environmental Management 130 (2013) 221e231 225
(US Forest Service, 2012). Therefore, we estimated that timberlosses due to wildfires were in the range of $60 and $119 ha�1.
e. Regeneration and rehabilitation costs avoided
To estimate regeneration and rehabilitation costs, we used theForest Service Burned Area Emergency Response (BAER) programcosts (including BAER evaluation, land treatments and channeltreatments, road and trails, and structures) and a range of five al-ternatives for additional watershed treatments and reforestation,restoration and rehabilitation efforts associatedwith the Rodeo andChediski fires of 2002. Additionally, we included estimated resto-ration costs that might have been incurred by the Fort ApacheReservation and the White Mountain Apache Tribe. The totalregeneration and rehabilitation costs (in 2012 dollars) include $13.3million BAER assessment and emergency rehabilitation projects,$15.3 to $25.4 million additional reforestation, restoration andrehabilitation, and $12.6 million restoration cost to the Tribe(Morton et al., 2003). The Rodeo and Chediski fires burned71,807 ha in the ApacheeSitgreaves and Tonto National Forests and111,901 ha in the Fort Apache Reservation (Morton et al., 2003). Wecalculated that the regeneration and rehabilitation costs were be-tween $224 and $279 ha�1.
f. Regional economic benefits
We evaluated the regional economic benefits of fuels-reductiontreatments by applying the outcomes of the social and economicanalysis generated to support the first Environmental ImpactStatement (EIS) for the Four Forest Restoration Initiative (4FRI)including the Apache-Sitgreaves, Coconino, Kaibab and Tonto Na-tional Forests in northern Arizona. We selected the socioeconomicdata of alternative C, a preferred management scenario under the4FRI proposed action, to evaluate regional economic impact.Alternative C incorporates the key components of the large treeretention strategy and focuses on ecological desired conditionswith the goal of conducting mechanical thinning on 175,649 ha andprescribed fire on 240,064 ha over a period of 10 years or until thegoal is met. According to the 4FRI Draft Socioeconomic ResourceReport, the average annual labor income would be $108 million,$2.15 million and $45.0 million under recreation, grazing and forestproducts, respectively, throughout the 10-yr project period(Jaworski, 2012). Based on the planned treated areas and projectedregional economic impact, we calculated that the regional eco-nomic benefits were $373.21 ha�1.
g. Community value of fire risk reduction, forest health and watersupply protection
After witnessing the devastating damage caused by the 2010Shultz Fire, in 2012, the voters of the City of Flagstaff, Arizona,supported a $10 million municipal bond to fund planning andimplementation of a forest health and water supply protectionproject which aims to treat approximately 4452 ha of highlyvulnerable forest in order to protect the City’s water supply andprevent high-intensity wildfires and resulting post-fire floods.Therefore, we determined that the local community value of firerisk reduction, forest health and water supply protection to be$2246 ha�1.
h. Carbon revenue
Assuming a carbon price of $47.71 Mg�1, we calculated po-tential carbon revenue under management scenarios of Rx10 andRx20 using two carbon accounting approaches and baselines of
HF100 and HF50. We analyzed four sets of carbon revenues (h1through h4 in Table 4): h1) 1st accounting approach and Rx10,h2) 1st accounting approach and Rx20, h3) 2nd accountingapproach and Rx10, and h4) 2nd accounting approach and Rx20.Using the baselines of HF100 and HF50, we selected the lowestand highest carbon revenue among the five study sites to be thelow and high estimate of carbon revenue, respectively. If potentialcarbon credit was negative, carbon credit was considered tobe $0.
2.6. Treatments costs
The costs of fuels-reduction treatments on federal land includea) planning, preparation and administration, b) mechanical thin-ning, and c) prescribed burning costs under management scenariosof Rx10 and Rx20. We calculated low and high estimates of treat-ment costs based on our literature review. The average adminis-trative costs for forest restoration projects implemented in Region 3of the U.S. Forest Service which includes our study sites wereestimated to be $951.85 ha�1 (in 2012 dollars) including projectpreparation ($528.80), task order and contract administration($198.30), monitoring ($52.88), project planning and managementrequired under the National Environmental Policy Act (NEPA) andNational Forest Management Act (NFMA) ($171.86) based on thepreliminary analysis performed by the Southwestern RegionRestoration Task Group (Selig et al., 2010). This Task Group alsopresented the scenario of increased full optimization by treatingmore areas for each dollar resulting in reduced administrative costsof $466.56 ha�1 including project preparation ($194.44), task order/contract administration andmonitoring ($125.04), project planningand management required under NEPA and NFMA ($147.09). Theoperational costs for thinning include mobilization (moving ofequipment and operators), roads maintenance, overhead, andmechanized cutting, skidding, delimbing, loading and slash piling.Under the assumption that 42e85 m3 ha�1 of timber would beremoved during a mechanical thinning, the average operationalcosts of timber harvest were estimated to be between $1472.72 and$2210.40 ha�1 based on the data compiled by Arizona ForestRestoration Products, Inc. (Selig et al., 2010). The operational costsfor prescribed burning can include writing burn plans, visiting thesite to plan the burn, installing fire lines, conducting the actualburn, and post-burn monitoring (Selig et al., 2010). The averageoperational costs of prescribed burning were estimated to be$494 ha�1 within the wildlandeurban interface (WUI) and $247e$371 ha�1 outside the WUI (Selig et al., 2010).
2.7. Net benefits
We performed sensitivity analysis to determine how sensitivenet benefits of fuels-reduction treatments were to changes intreatment benefits and costs. We calculated a range of net benefitsusing the following four benefitecost combinations: 1) low esti-mated treatment benefits and low estimated costs, 2) high esti-mated treatment benefits and high estimated costs, 3) highestimated treatment benefits and low estimated costs, and 4) lowestimated treatment benefits and high estimated costs.
3. Results
3.1. Total carbon stock, carbon emissions and net carbon storage
Total carbon stock and net carbon storagewere higher under thewildfire scenario HF100 than those under HF50, and higher undermanagement scenario Rx20 than those under Rx10 (Table 1). Whenwildfire was assumed, GH had the highest net carbon storage of

Table 1Mean carbon stored per century (Mg C ha�1) in above- and below-ground standing live and dead trees and in surface fuels, carbon releases fromwildfire and prescribed fires,total carbon stock and net carbon storage for wildfire scenarios of no wildfires, HF100 and HF50 and management scenarios of Rx10 and Rx20 at five fuel-reduction projects(GH, HP, MT, RN, RT).
Carbon per hectare (Mg C ha�1)
GH HP MT RN RT
No treatments with HF100a
a. AG and BG standing live trees 46.51 41.09 39.18 34.52 36.61b. AG and BG standing dead trees 18.50 18.00 16.71 14.33 15.78c. Surface fuels (woody debris, litter, duff) 33.08 28.65 23.49 27.16 20.93d. Releases from wildfire 24.38 22.19 16.96 20.35 17.17Total C stock (¼a þ b þ c) 98.09 87.74 79.38 76.01 73.32Net C storage (¼a þ b þ c � d) 73.71 65.55 62.42 55.66 56.15
No treatments with HF50a. AG and BG standing live trees 22.63 19.26 18.28 16.19 15.66b. AG and BG standing dead trees 17.36 15.35 14.75 12.73 13.06c. Surface fuels (woody debris, litter, duff) 36.05 29.82 25.47 28.56 24.26d. Releases from wildfire 21.53 18.73 14.00 18.57 13.85Total C stock (¼a þ b þ c) 76.04 64.43 58.50 57.48 52.98Net C storage (¼a þ b þ c � d) 54.51 45.70 44.50 38.91 39.13
Management scenario: Rx10a. AG and BG standing live trees 46.67 54.07 45.05 58.97 57.61b. AG and BG standing dead trees 1.95 3.04 2.20 4.94 3.57c. Surface fuels (woody debris, litter, duff) 6.54 7.10 5.31 7.37 5.21d. Releases from prescribed fires 34.01 37.88 27.62 40.04 32.09e. Releases from thinning 16.15 9.79 9.47 2.25 5.45f1. Wood products (palletsb) 2.25 1.01 1.42 0.41 0.53f2. Wood products (multiproductc) 6.28 2.50 4.25 1.07 1.32Total C stock (pallets) (¼a þ b þ c þ f1) 57.41 65.22 53.98 71.69 66.92Total C stock (multiproduct) (¼a þ b þ c þ f2) 61.44 66.71 56.81 72.35 67.71Net C storage (pallets) (¼a þ b þ c þ f1 � d � e) 7.26 17.55 16.89 29.39 29.38Net C storage (multiproduct) (¼a þ b þ c þ f2 � d � e) 11.29 19.04 19.72 30.06 30.17
Management scenario: Rx20a. AG and BG standing live trees 49.73 58.91 49.82 64.93 62.84b. AG and BG standing dead trees 1.81 2.69 2.04 3.85 2.79c. Surface fuels (woody debris, litter, duff) 9.74 10.34 7.88 9.97 7.16d. Release from prescribed fires 25.38 27.35 20.44 26.72 21.78e. Releases from thinning 16.15 9.79 9.47 2.25 5.45f1. Wood products (pallets) 2.25 1.01 1.42 0.41 0.53f2. Wood products (multiproduct) 6.28 2.50 4.25 1.07 1.32Total C stock (pallets) (¼a þ b þ c þ f1) 63.53 72.95 61.16 79.16 73.32Total C stock (multiproduct) (¼a þ b þ c þ f2) 67.56 74.44 63.99 79.82 74.11Net C storage (pallets) (¼a þ b þ c þ f1 � d � e) 22.01 35.81 31.25 50.18 46.09Net C storage (multiproduct) (¼a þ b þ c þ f2 � d � e) 26.04 37.30 34.08 50.85 46.88
a Data for carbon stored in above- and below-ground standing live and dead trees and in surface fuels, carbon releases from wildfire and prescribed fires for HF100, HF50,Rx10 and Rx20 were obtained from Sorensen et al. (2011).
b Harvested wood’s current end use as pallets in the region.c A multiproduct scenario that would produce a combination of paper, pallets and construction materials.
C.-H. Huang et al. / Journal of Environmental Management 130 (2013) 221e231226
73.71 and 54.51 Mg C ha�1 under HF100 and HF50, respectively.When treatments and multiproducts were assumed, RT had thehighest net carbon storage of 30.17 Mg C ha�1 under Rx10, and RNhad the highest net carbon storage of 50.85 Mg C ha�1 under Rx20(Table 1). Carbon storage in wood products was higher under themultiproduct scenario (1.07e6.28 Mg C ha�1) than under the cur-rent use as pallets (0.41e2.25 Mg C ha�1). Using GH and RN as anexample, Fig. 1 shows total carbon stock under the HF100, HF50,Rx10 and Rx20 scenarios.
Net carbon storage was lower with treatments than withouttreatments. Although carbon was projected to be released fromwildfires (16.96e24.38 Mg C ha�1 under HF100; 13.85e21.53 Mg C ha�1 under HF50), these wildfire emissions were lowerthan the sum of the emissions from thinning (2.25e16.15 Mg C ha�1) and prescribed fires under Rx10 (27.62e40.04 Mg C ha�1) or Rx20 (20.44e27.35 Mg C ha�1) (Table 1).Carbon emissions from wildfire, thinning and prescribed fires forGH and RN are illustrated in Fig. 2. Carbon storage in AG and BGstanding live trees, on the other hand, was higher with Rx10
(45.05e58.97 Mg C ha�1) or Rx20 (49.73e64.93 Mg C ha�1) for allfive sites compared to no treatments with HF100 (34.52e46.51 Mg C ha�1) or HF50 (15.66e22.63 Mg C ha�1).
3.2. Carbon credits
The selection of baseline, HF100 or HF50, affected the magni-tude of carbon credits. Compared with HF100, HF50 had lowercarbon storage in live trees, total carbon stock and net carbonstorage (Table 1); therefore, the difference in carbon credits be-tween treatments and baseline data was greater when HF50 servedas the baseline leading to higher carbon credits (Table 2). When thecarbon sink of live trees was investigated, positive carbon creditswould be realized for all five sites under both HF100 and HF50scenarios. However, when total carbon stock and net carbon stor-age were investigated, negative carbon credits would occur forseveral sites. Regardless of the selected baseline, Rx20 generatedgreater carbon credits than those under Rx10 in terms of live trees,total carbon stock, and net carbon storage.
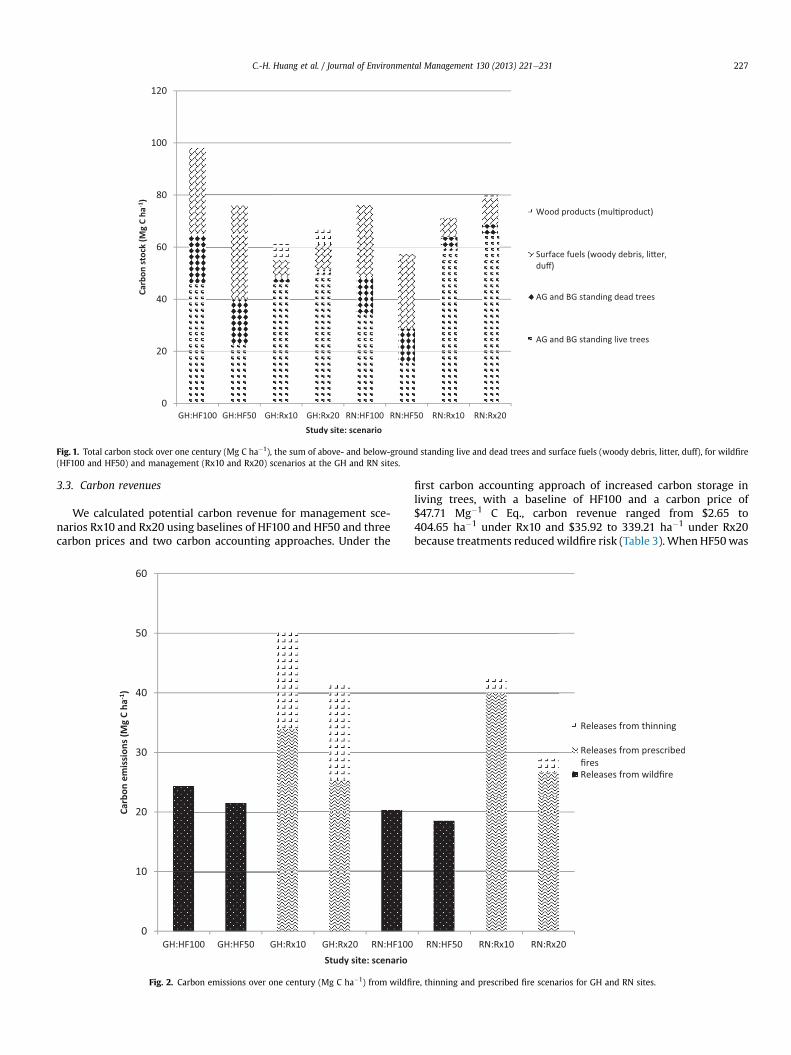
Fig. 1. Total carbon stock over one century (Mg C ha�1), the sum of above- and below-ground standing live and dead trees and surface fuels (woody debris, litter, duff), for wildfire(HF100 and HF50) and management (Rx10 and Rx20) scenarios at the GH and RN sites.
C.-H. Huang et al. / Journal of Environmental Management 130 (2013) 221e231 227
3.3. Carbon revenues
We calculated potential carbon revenue for management sce-narios Rx10 and Rx20 using baselines of HF100 and HF50 and threecarbon prices and two carbon accounting approaches. Under the
Fig. 2. Carbon emissions over one century (Mg C ha�1) from wildfi
first carbon accounting approach of increased carbon storage inliving trees, with a baseline of HF100 and a carbon price of$47.71 Mg�1 C Eq., carbon revenue ranged from $2.65 to404.65 ha�1 under Rx10 and $35.92 to 339.21 ha�1 under Rx20because treatments reduced wildfire risk (Table 3). When HF50was
re, thinning and prescribed fire scenarios for GH and RN sites.
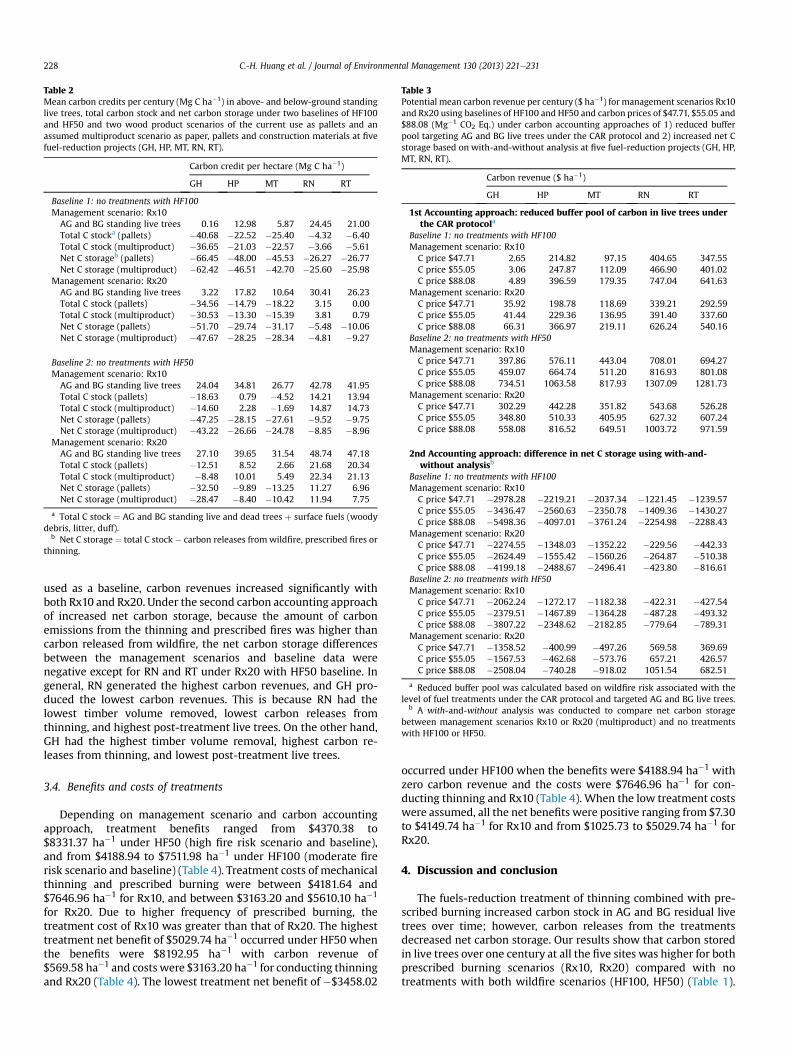
Table 2Mean carbon credits per century (Mg C ha�1) in above- and below-ground standinglive trees, total carbon stock and net carbon storage under two baselines of HF100and HF50 and two wood product scenarios of the current use as pallets and anassumed multiproduct scenario as paper, pallets and construction materials at fivefuel-reduction projects (GH, HP, MT, RN, RT).
Carbon credit per hectare (Mg C ha�1)
GH HP MT RN RT
Baseline 1: no treatments with HF100Management scenario: Rx10AG and BG standing live trees 0.16 12.98 5.87 24.45 21.00Total C stocka (pallets) �40.68 �22.52 �25.40 �4.32 �6.40Total C stock (multiproduct) �36.65 �21.03 �22.57 �3.66 �5.61Net C storageb (pallets) �66.45 �48.00 �45.53 �26.27 �26.77Net C storage (multiproduct) �62.42 �46.51 �42.70 �25.60 �25.98
Management scenario: Rx20AG and BG standing live trees 3.22 17.82 10.64 30.41 26.23Total C stock (pallets) �34.56 �14.79 �18.22 3.15 0.00Total C stock (multiproduct) �30.53 �13.30 �15.39 3.81 0.79Net C storage (pallets) �51.70 �29.74 �31.17 �5.48 �10.06Net C storage (multiproduct) �47.67 �28.25 �28.34 �4.81 �9.27
Baseline 2: no treatments with HF50Management scenario: Rx10AG and BG standing live trees 24.04 34.81 26.77 42.78 41.95Total C stock (pallets) �18.63 0.79 �4.52 14.21 13.94Total C stock (multiproduct) �14.60 2.28 �1.69 14.87 14.73Net C storage (pallets) �47.25 �28.15 �27.61 �9.52 �9.75Net C storage (multiproduct) �43.22 �26.66 �24.78 �8.85 �8.96
Management scenario: Rx20AG and BG standing live trees 27.10 39.65 31.54 48.74 47.18Total C stock (pallets) �12.51 8.52 2.66 21.68 20.34Total C stock (multiproduct) �8.48 10.01 5.49 22.34 21.13Net C storage (pallets) �32.50 �9.89 �13.25 11.27 6.96Net C storage (multiproduct) �28.47 �8.40 �10.42 11.94 7.75
a Total C stock ¼ AG and BG standing live and dead trees þ surface fuels (woodydebris, litter, duff).
b Net C storage ¼ total C stock � carbon releases from wildfire, prescribed fires orthinning.
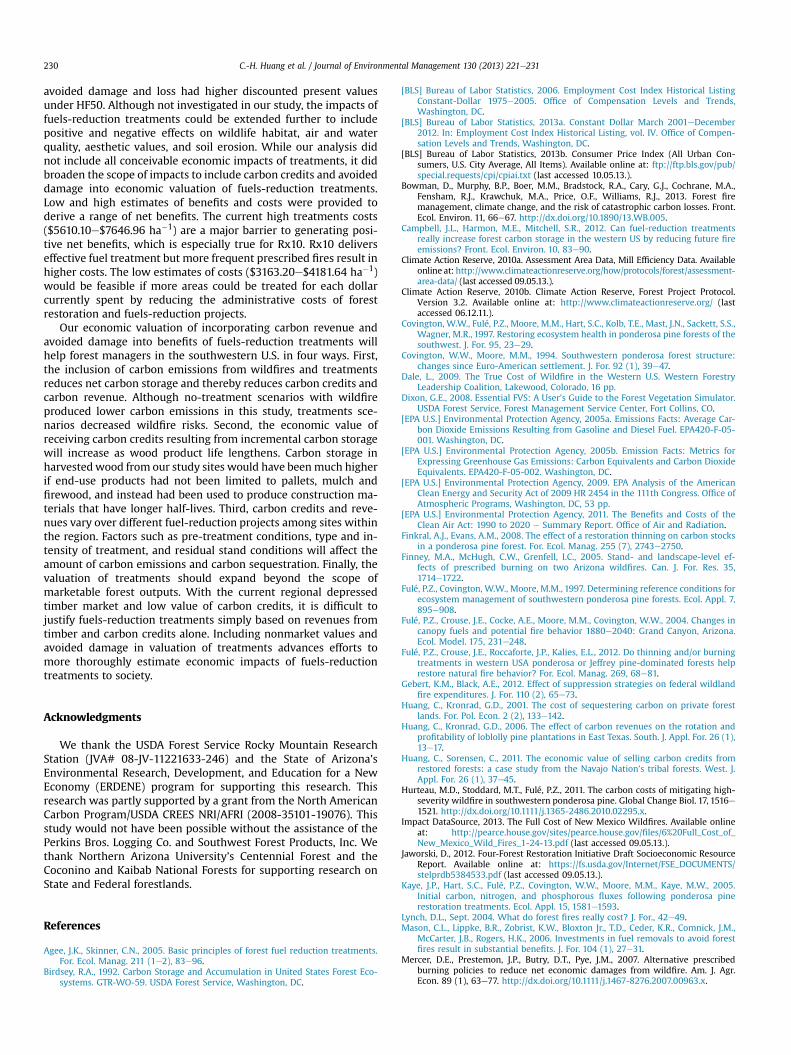
Table 3Potential mean carbon revenue per century ($ ha�1) for management scenarios Rx10and Rx20 using baselines of HF100 and HF50 and carbon prices of $47.71, $55.05 and$88.08 (Mg�1 CO2 Eq.) under carbon accounting approaches of 1) reduced bufferpool targeting AG and BG live trees under the CAR protocol and 2) increased net Cstorage based on with-and-without analysis at five fuel-reduction projects (GH, HP,MT, RN, RT).
Carbon revenue ($ ha�1)
GH HP MT RN RT
1st Accounting approach: reduced buffer pool of carbon in live trees underthe CAR protocola
Baseline 1: no treatments with HF100Management scenario: Rx10C price $47.71 2.65 214.82 97.15 404.65 347.55C price $55.05 3.06 247.87 112.09 466.90 401.02C price $88.08 4.89 396.59 179.35 747.04 641.63
Management scenario: Rx20C price $47.71 35.92 198.78 118.69 339.21 292.59C price $55.05 41.44 229.36 136.95 391.40 337.60C price $88.08 66.31 366.97 219.11 626.24 540.16
Baseline 2: no treatments with HF50Management scenario: Rx10C price $47.71 397.86 576.11 443.04 708.01 694.27C price $55.05 459.07 664.74 511.20 816.93 801.08C price $88.08 734.51 1063.58 817.93 1307.09 1281.73
Management scenario: Rx20C price $47.71 302.29 442.28 351.82 543.68 526.28C price $55.05 348.80 510.33 405.95 627.32 607.24C price $88.08 558.08 816.52 649.51 1003.72 971.59
2nd Accounting approach: difference in net C storage using with-and-without analysisb
Baseline 1: no treatments with HF100Management scenario: Rx10C price $47.71 �2978.28 �2219.21 �2037.34 �1221.45 �1239.57C price $55.05 �3436.47 �2560.63 �2350.78 �1409.36 �1430.27C price $88.08 �5498.36 �4097.01 �3761.24 �2254.98 �2288.43
Management scenario: Rx20C price $47.71 �2274.55 �1348.03 �1352.22 �229.56 �442.33C price $55.05 �2624.49 �1555.42 �1560.26 �264.87 �510.38C price $88.08 �4199.18 �2488.67 �2496.41 �423.80 �816.61
Baseline 2: no treatments with HF50Management scenario: Rx10C price $47.71 �2062.24 �1272.17 �1182.38 �422.31 �427.54C price $55.05 �2379.51 �1467.89 �1364.28 �487.28 �493.32C price $88.08 �3807.22 �2348.62 �2182.85 �779.64 �789.31
Management scenario: Rx20C price $47.71 �1358.52 �400.99 �497.26 569.58 369.69C price $55.05 �1567.53 �462.68 �573.76 657.21 426.57C price $88.08 �2508.04 �740.28 �918.02 1051.54 682.51
a Reduced buffer pool was calculated based on wildfire risk associated with thelevel of fuel treatments under the CAR protocol and targeted AG and BG live trees.
b A with-and-without analysis was conducted to compare net carbon storagebetween management scenarios Rx10 or Rx20 (multiproduct) and no treatmentswith HF100 or HF50.
C.-H. Huang et al. / Journal of Environmental Management 130 (2013) 221e231228
used as a baseline, carbon revenues increased significantly withboth Rx10 and Rx20. Under the second carbon accounting approachof increased net carbon storage, because the amount of carbonemissions from the thinning and prescribed fires was higher thancarbon released from wildfire, the net carbon storage differencesbetween the management scenarios and baseline data werenegative except for RN and RT under Rx20 with HF50 baseline. Ingeneral, RN generated the highest carbon revenues, and GH pro-duced the lowest carbon revenues. This is because RN had thelowest timber volume removed, lowest carbon releases fromthinning, and highest post-treatment live trees. On the other hand,GH had the highest timber volume removal, highest carbon re-leases from thinning, and lowest post-treatment live trees.
3.4. Benefits and costs of treatments
Depending on management scenario and carbon accountingapproach, treatment benefits ranged from $4370.38 to$8331.37 ha�1 under HF50 (high fire risk scenario and baseline),and from $4188.94 to $7511.98 ha�1 under HF100 (moderate firerisk scenario and baseline) (Table 4). Treatment costs of mechanicalthinning and prescribed burning were between $4181.64 and$7646.96 ha�1 for Rx10, and between $3163.20 and $5610.10 ha�1
for Rx20. Due to higher frequency of prescribed burning, thetreatment cost of Rx10 was greater than that of Rx20. The highesttreatment net benefit of $5029.74 ha�1 occurred under HF50 whenthe benefits were $8192.95 ha�1 with carbon revenue of$569.58 ha�1 and costs were $3163.20 ha�1 for conducting thinningand Rx20 (Table 4). The lowest treatment net benefit of �$3458.02
occurred under HF100 when the benefits were $4188.94 ha�1 withzero carbon revenue and the costs were $7646.96 ha�1 for con-ducting thinning and Rx10 (Table 4). When the low treatment costswere assumed, all the net benefits were positive ranging from $7.30to $4149.74 ha�1 for Rx10 and from $1025.73 to $5029.74 ha�1 forRx20.
4. Discussion and conclusion
The fuels-reduction treatment of thinning combined with pre-scribed burning increased carbon stock in AG and BG residual livetrees over time; however, carbon releases from the treatmentsdecreased net carbon storage. Our results show that carbon storedin live trees over one century at all the five sites was higher for bothprescribed burning scenarios (Rx10, Rx20) compared with notreatments with both wildfire scenarios (HF100, HF50) (Table 1).
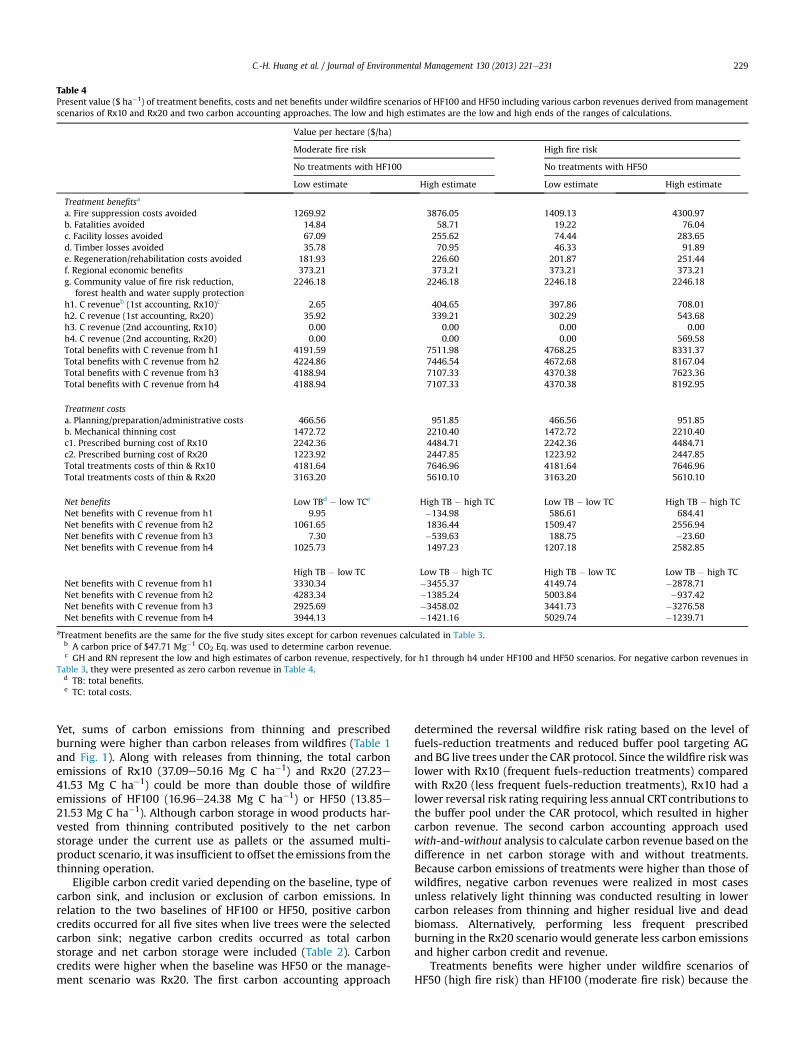
Table 4Present value ($ ha�1) of treatment benefits, costs and net benefits under wildfire scenarios of HF100 and HF50 including various carbon revenues derived frommanagementscenarios of Rx10 and Rx20 and two carbon accounting approaches. The low and high estimates are the low and high ends of the ranges of calculations.
Value per hectare ($/ha)
Moderate fire risk High fire risk
No treatments with HF100 No treatments with HF50
Low estimate High estimate Low estimate High estimate
Treatment benefitsa
a. Fire suppression costs avoided 1269.92 3876.05 1409.13 4300.97b. Fatalities avoided 14.84 58.71 19.22 76.04c. Facility losses avoided 67.09 255.62 74.44 283.65d. Timber losses avoided 35.78 70.95 46.33 91.89e. Regeneration/rehabilitation costs avoided 181.93 226.60 201.87 251.44f. Regional economic benefits 373.21 373.21 373.21 373.21g. Community value of fire risk reduction,
forest health and water supply protection2246.18 2246.18 2246.18 2246.18
h1. C revenueb (1st accounting, Rx10)c 2.65 404.65 397.86 708.01h2. C revenue (1st accounting, Rx20) 35.92 339.21 302.29 543.68h3. C revenue (2nd accounting, Rx10) 0.00 0.00 0.00 0.00h4. C revenue (2nd accounting, Rx20) 0.00 0.00 0.00 569.58Total benefits with C revenue from h1 4191.59 7511.98 4768.25 8331.37Total benefits with C revenue from h2 4224.86 7446.54 4672.68 8167.04Total benefits with C revenue from h3 4188.94 7107.33 4370.38 7623.36Total benefits with C revenue from h4 4188.94 7107.33 4370.38 8192.95
Treatment costsa. Planning/preparation/administrative costs 466.56 951.85 466.56 951.85b. Mechanical thinning cost 1472.72 2210.40 1472.72 2210.40c1. Prescribed burning cost of Rx10 2242.36 4484.71 2242.36 4484.71c2. Prescribed burning cost of Rx20 1223.92 2447.85 1223.92 2447.85Total treatments costs of thin & Rx10 4181.64 7646.96 4181.64 7646.96Total treatments costs of thin & Rx20 3163.20 5610.10 3163.20 5610.10
Net benefits Low TBd � low TCe High TB � high TC Low TB � low TC High TB � high TCNet benefits with C revenue from h1 9.95 �134.98 586.61 684.41Net benefits with C revenue from h2 1061.65 1836.44 1509.47 2556.94Net benefits with C revenue from h3 7.30 �539.63 188.75 �23.60Net benefits with C revenue from h4 1025.73 1497.23 1207.18 2582.85
High TB � low TC Low TB � high TC High TB � low TC Low TB � high TCNet benefits with C revenue from h1 3330.34 �3455.37 4149.74 �2878.71Net benefits with C revenue from h2 4283.34 �1385.24 5003.84 �937.42Net benefits with C revenue from h3 2925.69 �3458.02 3441.73 �3276.58Net benefits with C revenue from h4 3944.13 �1421.16 5029.74 �1239.71
aTreatment benefits are the same for the five study sites except for carbon revenues calculated in Table 3.b A carbon price of $47.71 Mg�1 CO2 Eq. was used to determine carbon revenue.c GH and RN represent the low and high estimates of carbon revenue, respectively, for h1 through h4 under HF100 and HF50 scenarios. For negative carbon revenues in
Table 3, they were presented as zero carbon revenue in Table 4.d TB: total benefits.e TC: total costs.
C.-H. Huang et al. / Journal of Environmental Management 130 (2013) 221e231 229
Yet, sums of carbon emissions from thinning and prescribedburning were higher than carbon releases from wildfires (Table 1and Fig. 1). Along with releases from thinning, the total carbonemissions of Rx10 (37.09e50.16 Mg C ha�1) and Rx20 (27.23e41.53 Mg C ha�1) could be more than double those of wildfireemissions of HF100 (16.96e24.38 Mg C ha�1) or HF50 (13.85e21.53 Mg C ha�1). Although carbon storage in wood products har-vested from thinning contributed positively to the net carbonstorage under the current use as pallets or the assumed multi-product scenario, it was insufficient to offset the emissions from thethinning operation.
Eligible carbon credit varied depending on the baseline, type ofcarbon sink, and inclusion or exclusion of carbon emissions. Inrelation to the two baselines of HF100 or HF50, positive carboncredits occurred for all five sites when live trees were the selectedcarbon sink; negative carbon credits occurred as total carbonstorage and net carbon storage were included (Table 2). Carboncredits were higher when the baseline was HF50 or the manage-ment scenario was Rx20. The first carbon accounting approach
determined the reversal wildfire risk rating based on the level offuels-reduction treatments and reduced buffer pool targeting AGand BG live trees under the CAR protocol. Since thewildfire risk waslower with Rx10 (frequent fuels-reduction treatments) comparedwith Rx20 (less frequent fuels-reduction treatments), Rx10 had alower reversal risk rating requiring less annual CRTcontributions tothe buffer pool under the CAR protocol, which resulted in highercarbon revenue. The second carbon accounting approach usedwith-and-without analysis to calculate carbon revenue based on thedifference in net carbon storage with and without treatments.Because carbon emissions of treatments were higher than those ofwildfires, negative carbon revenues were realized in most casesunless relatively light thinning was conducted resulting in lowercarbon releases from thinning and higher residual live and deadbiomass. Alternatively, performing less frequent prescribedburning in the Rx20 scenario would generate less carbon emissionsand higher carbon credit and revenue.
Treatments benefits were higher under wildfire scenarios ofHF50 (high fire risk) than HF100 (moderate fire risk) because the
C.-H. Huang et al. / Journal of Environmental Management 130 (2013) 221e231230
avoided damage and loss had higher discounted present valuesunder HF50. Although not investigated in our study, the impacts offuels-reduction treatments could be extended further to includepositive and negative effects on wildlife habitat, air and waterquality, aesthetic values, and soil erosion. While our analysis didnot include all conceivable economic impacts of treatments, it didbroaden the scope of impacts to include carbon credits and avoideddamage into economic valuation of fuels-reduction treatments.Low and high estimates of benefits and costs were provided toderive a range of net benefits. The current high treatments costs($5610.10e$7646.96 ha�1) are a major barrier to generating posi-tive net benefits, which is especially true for Rx10. Rx10 deliverseffective fuel treatment but more frequent prescribed fires result inhigher costs. The low estimates of costs ($3163.20e$4181.64 ha�1)would be feasible if more areas could be treated for each dollarcurrently spent by reducing the administrative costs of forestrestoration and fuels-reduction projects.
Our economic valuation of incorporating carbon revenue andavoided damage into benefits of fuels-reduction treatments willhelp forest managers in the southwestern U.S. in four ways. First,the inclusion of carbon emissions from wildfires and treatmentsreduces net carbon storage and thereby reduces carbon credits andcarbon revenue. Although no-treatment scenarios with wildfireproduced lower carbon emissions in this study, treatments sce-narios decreased wildfire risks. Second, the economic value ofreceiving carbon credits resulting from incremental carbon storagewill increase as wood product life lengthens. Carbon storage inharvestedwood from our study sites would have beenmuch higherif end-use products had not been limited to pallets, mulch andfirewood, and instead had been used to produce construction ma-terials that have longer half-lives. Third, carbon credits and reve-nues vary over different fuel-reduction projects among sites withinthe region. Factors such as pre-treatment conditions, type and in-tensity of treatment, and residual stand conditions will affect theamount of carbon emissions and carbon sequestration. Finally, thevaluation of treatments should expand beyond the scope ofmarketable forest outputs. With the current regional depressedtimber market and low value of carbon credits, it is difficult tojustify fuels-reduction treatments simply based on revenues fromtimber and carbon credits alone. Including nonmarket values andavoided damage in valuation of treatments advances efforts tomore thoroughly estimate economic impacts of fuels-reductiontreatments to society.
Acknowledgments
We thank the USDA Forest Service Rocky Mountain ResearchStation (JVA# 08-JV-11221633-246) and the State of Arizona’sEnvironmental Research, Development, and Education for a NewEconomy (ERDENE) program for supporting this research. Thisresearch was partly supported by a grant from the North AmericanCarbon Program/USDA CREES NRI/AFRI (2008-35101-19076). Thisstudy would not have been possible without the assistance of thePerkins Bros. Logging Co. and Southwest Forest Products, Inc. Wethank Northern Arizona University’s Centennial Forest and theCoconino and Kaibab National Forests for supporting research onState and Federal forestlands.
References
Agee, J.K., Skinner, C.N., 2005. Basic principles of forest fuel reduction treatments.For. Ecol. Manag. 211 (1e2), 83e96.
Birdsey, R.A., 1992. Carbon Storage and Accumulation in United States Forest Eco-systems. GTR-WO-59. USDA Forest Service, Washington, DC.
[BLS] Bureau of Labor Statistics, 2006. Employment Cost Index Historical ListingConstant-Dollar 1975e2005. Office of Compensation Levels and Trends,Washington, DC.
[BLS] Bureau of Labor Statistics, 2013a. Constant Dollar March 2001eDecember2012. In: Employment Cost Index Historical Listing, vol. IV. Office of Compen-sation Levels and Trends, Washington, DC.
[BLS] Bureau of Labor Statistics, 2013b. Consumer Price Index (All Urban Con-sumers, U.S. City Average, All Items). Available online at: ftp://ftp.bls.gov/pub/special.requests/cpi/cpiai.txt (last accessed 10.05.13.).
Bowman, D., Murphy, B.P., Boer, M.M., Bradstock, R.A., Cary, G.J., Cochrane, M.A.,Fensham, R.J., Krawchuk, M.A., Price, O.F., Williams, R.J., 2013. Forest firemanagement, climate change, and the risk of catastrophic carbon losses. Front.Ecol. Environ. 11, 66e67. http://dx.doi.org/10.1890/13.WB.005.
Campbell, J.L., Harmon, M.E., Mitchell, S.R., 2012. Can fuel-reduction treatmentsreally increase forest carbon storage in the western US by reducing future fireemissions? Front. Ecol. Environ. 10, 83e90.
Climate Action Reserve, 2010a. Assessment Area Data, Mill Efficiency Data. Availableonline at: http://www.climateactionreserve.org/how/protocols/forest/assessment-area-data/ (last accessed 09.05.13.).
Climate Action Reserve, 2010b. Climate Action Reserve, Forest Project Protocol.Version 3.2. Available online at: http://www.climateactionreserve.org/ (lastaccessed 06.12.11.).
Covington, W.W., Fulé, P.Z., Moore, M.M., Hart, S.C., Kolb, T.E., Mast, J.N., Sackett, S.S.,Wagner, M.R., 1997. Restoring ecosystem health in ponderosa pine forests of thesouthwest. J. For. 95, 23e29.
Covington, W.W., Moore, M.M., 1994. Southwestern ponderosa forest structure:changes since Euro-American settlement. J. For. 92 (1), 39e47.
Dale, L., 2009. The True Cost of Wildfire in the Western U.S. Western ForestryLeadership Coalition, Lakewood, Colorado, 16 pp.
Dixon, G.E., 2008. Essential FVS: A User’s Guide to the Forest Vegetation Simulator.USDA Forest Service, Forest Management Service Center, Fort Collins, CO.
[EPA U.S.] Environmental Protection Agency, 2005a. Emissions Facts: Average Car-bon Dioxide Emissions Resulting from Gasoline and Diesel Fuel. EPA420-F-05-001. Washington, DC.
[EPA U.S.] Environmental Protection Agency, 2005b. Emission Facts: Metrics forExpressing Greenhouse Gas Emissions: Carbon Equivalents and Carbon DioxideEquivalents. EPA420-F-05-002. Washington, DC.
[EPA U.S.] Environmental Protection Agency, 2009. EPA Analysis of the AmericanClean Energy and Security Act of 2009 HR 2454 in the 111th Congress. Office ofAtmospheric Programs, Washington, DC, 53 pp.
[EPA U.S.] Environmental Protection Agency, 2011. The Benefits and Costs of theClean Air Act: 1990 to 2020 e Summary Report. Office of Air and Radiation.
Finkral, A.J., Evans, A.M., 2008. The effect of a restoration thinning on carbon stocksin a ponderosa pine forest. For. Ecol. Manag. 255 (7), 2743e2750.
Finney, M.A., McHugh, C.W., Grenfell, I.C., 2005. Stand- and landscape-level ef-fects of prescribed burning on two Arizona wildfires. Can. J. For. Res. 35,1714e1722.
Fulé, P.Z., Covington, W.W., Moore, M.M., 1997. Determining reference conditions forecosystem management of southwestern ponderosa pine forests. Ecol. Appl. 7,895e908.
Fulé, P.Z., Crouse, J.E., Cocke, A.E., Moore, M.M., Covington, W.W., 2004. Changes incanopy fuels and potential fire behavior 1880e2040: Grand Canyon, Arizona.Ecol. Model. 175, 231e248.
Fulé, P.Z., Crouse, J.E., Roccaforte, J.P., Kalies, E.L., 2012. Do thinning and/or burningtreatments in western USA ponderosa or Jeffrey pine-dominated forests helprestore natural fire behavior? For. Ecol. Manag. 269, 68e81.
Gebert, K.M., Black, A.E., 2012. Effect of suppression strategies on federal wildlandfire expenditures. J. For. 110 (2), 65e73.
Huang, C., Kronrad, G.D., 2001. The cost of sequestering carbon on private forestlands. For. Pol. Econ. 2 (2), 133e142.
Huang, C., Kronrad, G.D., 2006. The effect of carbon revenues on the rotation andprofitability of loblolly pine plantations in East Texas. South. J. Appl. For. 26 (1),13e17.
Huang, C., Sorensen, C., 2011. The economic value of selling carbon credits fromrestored forests: a case study from the Navajo Nation’s tribal forests. West. J.Appl. For. 26 (1), 37e45.
Hurteau, M.D., Stoddard, M.T., Fulé, P.Z., 2011. The carbon costs of mitigating high-severity wildfire in southwestern ponderosa pine. Global Change Biol. 17, 1516e1521. http://dx.doi.org/10.1111/j.1365-2486.2010.02295.x.
Impact DataSource, 2013. The Full Cost of New Mexico Wildfires. Available onlineat: http://pearce.house.gov/sites/pearce.house.gov/files/6%20Full_Cost_of_New_Mexico_Wild_Fires_1-24-13.pdf (last accessed 09.05.13.).
Jaworski, D., 2012. Four-Forest Restoration Initiative Draft Socioeconomic ResourceReport. Available online at: https://fs.usda.gov/Internet/FSE_DOCUMENTS/stelprdb5384533.pdf (last accessed 09.05.13.).
Kaye, J.P., Hart, S.C., Fulé, P.Z., Covington, W.W., Moore, M.M., Kaye, M.W., 2005.Initial carbon, nitrogen, and phosphorous fluxes following ponderosa pinerestoration treatments. Ecol. Appl. 15, 1581e1593.
Lynch, D.L., Sept. 2004. What do forest fires really cost? J. For., 42e49.Mason, C.L., Lippke, B.R., Zobrist, K.W., Bloxton Jr., T.D., Ceder, K.R., Comnick, J.M.,
McCarter, J.B., Rogers, H.K., 2006. Investments in fuel removals to avoid forestfires result in substantial benefits. J. For. 104 (1), 27e31.
Mercer, D.E., Prestemon, J.P., Butry, D.T., Pye, J.M., 2007. Alternative prescribedburning policies to reduce net economic damages from wildfire. Am. J. Agr.Econ. 89 (1), 63e77. http://dx.doi.org/10.1111/j.1467-8276.2007.00963.x.
C.-H. Huang et al. / Journal of Environmental Management 130 (2013) 221e231 231
Morton, D.C., Roessing, M.E., Camp, A.E., Tyrrell, M.L., 2003. Assessing the Envi-ronmental, Social, and Economic Impacts of Wildfire. Yale School of Forestryand Environmental Studies. GISF research paper 001.
Munich Re NatCatSERVICE, 2009. 2008 Natural Catastrophe Review. Available onlineat: http://www.pciaa.net/web/sitehome.nsf/lcpublic/439/$file/munichre2009.pdf (last accessed 10.05.13.).
Munich Re NatCatSERVICE, 2010. 2009 Natural Catastrophe Year in Review. Avail-able online at: http://www.munichreamerica.com/webinars/2010_01_natcatreview/2009_MR_III_Nat_Cat_Webinar_01212010.pdf (last accessed10.05.13.).
Munich Re Natcatservice, 2011. 2010 Natural Catastrophe Year in Review. Availableonline at: http://www.munichreamerica.com/webinars/2011_01_natcatreview/munich_re_2010_natcat_review.pdf (last accessed 10.05.13.).
Munich Re Natcatservice, 2012. 2011 Natural Catastrophe Year in Review. Availableonline at: http://www.ctnow.com/media/acrobat/2012-01/67158951.pdf (lastaccessed 10.05.13.).
Munich Re Natcatservice, 2013. 2012 Natural Catastrophe Year in Review. Availableonline at: http://www.munichreamerica.com/webinars/2013_01_natcatreview/MunichRe_III_NatCat01032013.pdf (last accessed 10.05.13.).
National Interagency Coordination Center, 2008. National Interagency CoordinationCenter Wildland Fire Summary and Statistics Annual Report 2008.
National Interagency Coordination Center, 2009. National Interagency CoordinationCenter Wildland Fire Summary and Statistics Annual Report 2009.
National Interagency Coordination Center, 2010. National Interagency CoordinationCenter Wildland Fire Summary and Statistics Annual Report 2010.
National Interagency Coordination Center, 2011. National Interagency CoordinationCenter Wildland Fire Summary and Statistics Annual Report 2011.
National Interagency Coordination Center, 2012. National Interagency CoordinationCenter Wildland Fire Summary and Statistics Annual Report 2012.
National Interagency Fire Center-Risk Management Committee, 2008. 2008 SafetyGram: Fatalities, Entrapments and Serious Accident Summary for 2008.
National Interagency Fire Center-Risk Management Committee, 2009. 2009 SafetyGram: Fatalities, Entrapments and Serious Accident Summary for 2009.
National Interagency Fire Center-Risk Management Committee, 2010. 2010 SafetyGram: Fatalities, Entrapments and Serious Accident Summary for 2010.
National Interagency Fire Center-Risk Management Committee, 2011. 2011 SafetyGram: Fatalities, Entrapments and Serious Accident Summary for 2011.
National Interagency Fire Center-Risk Management Committee, 2012. 2012 SafetyGram: Fatalities, Entrapments and Serious Accident Summary for 2012.
Pingoud, K., Lehtilä, A., 2002. Fossil carbon emissions associated with carbon flowsof wood products. Mitigation Adapt. Strategies Global Change 7, 63e83.
Reinhardt, E., Crookston, N.L., 2003. The Fire and Fuels Extension to the ForestVegetation Simulator. GTR-RMRS-116. USDA Forest Service, Rocky MountainResearch Station, Ogden, UT.
Reinhardt, E., Crookston, N.L., Rebain, S.A., 2008. The Fire and Fuels Extension to theForest Vegetation Simulator. Addendum to RMRS-GTR-116. USDA Forest Ser-vice, Rocky Mountain Research Station, Ogden, UT.
Reinhardt, E., Holsinger, L., 2010. Effects of fuel treatments on carbon-disturbancerelationships in forests of the northern Rocky Mountains. For. Ecol. Manag.259, 1427e1435.
Richardson, L.A., Champ, P.A., Loomis, J.B., 2012. The hidden cost of wildfires: eco-nomic valuation of health effects of wildfire smoke exposure in Southern Cal-ifornia. J. For. Econ. 18, 14e35.
Roccaforte, J.P., Fulé, P.Z., Chancellor, W.W., Laughlin, D.C., 2012. Woody debris andtree regeneration dynamics following severe wildfires in Arizona ponderosa
pine forests. Can. J. For. Res. 42 (3), 593e604. http://dx.doi.org/10.1139/x2012-010.
Ross, C., Kaye, J., Kaye, M., Kurth, V., Brimmer, R., Hart, S., Fulé, P., 2012. Ecosystemcarbon remains low for three decades following fire and constrains soil CO2:responses to precipitation in southwestern ponderosa pine forests. Ecosystems15, 725e740.
Row, C., Phelps, R.B., 1996. Wood carbon flows and storage after timber harvest. In:Sampson, N., Hair, D. (Eds.), Forest Management Opportunities for MitigatingCarbon Emissions, Forests and Global Change, vol. 2. American Forests, Wash-ington, DC, pp. 27e58.
Secretary of Agriculture, 2007. Towards a Collaborative Cost Management Strategy2006 U. S. Forest Service Large Wildfire Cost Review Recommendations.
Secretary of Agriculture, 2008. 2007 U. S. Forest Service & Department of InteriorLarge Wildfire Cost Review.
Secretary of Agriculture, 2009. Fiscal Year 2008 Large-Cost Fire IndependentReview.
Secretary of Agriculture, 2010. Large Fire Cost Review for FY2009.Selig, M., Vosick, D., Seidenberg, J., 2010. Four Forest Restoration Initiative Land-
scape Strategy: Economics and Utilization Analysis. Four Forest RestorationInitiative Stakeholder Group, Flagstaff, AZ. Available online at: http://4fri.org/pdfs/documents/CFLRP/econ_and_utilization_final_draft.pdf (last accessed09.05.13.).
Sheppard, P.R., Comrie, A.C., Packin, G.D., Angersbach, K., Hughes, M.K., 2002. Theclimate of the US southwest. Clim. Res. 21, 219e238.
Skog, K.E., Pingoud, K., Smith, J.E., 2004. A method countries can use to estimatechanges in carbon stored in harvested wood products and the uncertainty ofsuch estimates. Environ. Manag. 33 (Suppl. 1), S65eS73.
Sorensen, C., Finkral, A.J., Kolb, T.E., Huang, C., 2011. Short- and long-term effects ofthinning and prescribed fire on carbon stocks in ponderosa pine stands innorthern Arizona. For. Ecol. Manag. 261, 460e472.
Swetnam, T.W., Baisan, C.H., 1996. Historical fire regime patterns in the South-western United States since AD 1700. In: Allen, C.D. (Ed.), Proceedings of theSecond La Mesa Fire Symposium. Los Alamos, New Mexico, 29e31 March 1996.Rocky Mountain Research Station, Fort Collins, Colorado, USA, pp. 11e32. USDAForest Service general technical report RM-GTR-286.
United States Forest Service, 2012. Timber Cut and Sold on National Forests underSales and Land Exchanges. Available online at: http://www.fs.fed.us/forestmanagement/documents/sold-harvest/reports/2012/2012_Q4_CandS_R03.pdf (last accessed 09.05.13.).
Viscusi, W.K., 1992. Fatal Tradeoffs. Oxford University Press, New York. Table 4e1.Vegh, T., Huang, C., Finkral, A.J., 2013. Carbon credit possibilities and economic
implications of fuel reduction treatments. West. J. Appl. For. 28 (2), 57e65.Wang, H., He, J., 2010. The Value of Statistical Life: A Contingent Investigation in
China. The World Bank. Policy research working paper 5421.Ward, J., Davis, S., Batten, B., Boyd, S., Carbpenter, J., Duggal, V., Duleep, K.G.,
Gelman, R., Kalish, Y., Laughlin, M., Schaeffer, W., Singh, G., Sklad, P., Smith, R.,Vyas, A., Wise, A., Yeakel, S., 2009. Energy Efficiency and Renewable Energy:2008 Vehicle Technologies Market Report. DOE/G0-102009-2860. USDOE, Na-tional Renewable Energy Laboratory, Washington, DC.
Wiedinmyer, C., Neff, J.C., 2007. Estimates of CO2 from fires in the United States:implications for carbon management. Carbon Balance Manag. 2, 10. http://dx.doi.org/10.1186/1750-0680-2-10.
[WRCC] Western Regional Climate Center, 2010. RAWS USA Climate Archive. Flag-staff, Arizona. URL http://www.raws.dri.edu/cgi-bin/rawMAIN.pl?azAFLG (lastaccessed 09.02.10.).
Related Documents