Journal of Applied Finance & Banking, vol.2, no.1, 2012, 225-246 ISSN: 1792-6580 (print version), 1792-6599 (online) International Scientific Press, 2012 Toward Efficient Management of Working Capital: The case of the Palestinian Exchange Ibrahim M. Awad 1 and Abdel-Rahman Al-Ewesat 2 Abstract The importance of this study comes from the truth that financial statements' users need reliable, relevant, and useful financial information that should be reflected in stock prices. However, this study aims at investigating current ratio, receivables turnover, inventory turnover, and earnings per share for 18 companies listed on PEX over the period from 2006 to 2011. Regression analysis and econometric techniques of Unit root test, Co-integration, and Granger causality are applied. The study outcomes indicate that stock prices of companies listed on PEX are affected by working capital components. The results of traditional Granger Causality reveal that there is no causal relationship between stock prices and working capital components. In addition, there is a positive relationship between CR and EPS and stock prices whereas there is a negative relationship between RT and IT. The paper concludes that cash, times of receivables collection and inventory turnover are necessary to be taken into account by both investors and companies for improved the management of working capital at the PEX. 1 Department of Economics, Al-Quds University, e-mail: [email protected] 2 Department of Accounting,, Al-Quds University, e-mail: [email protected] Article Info: Received : December 2, 2011. Revised : January 17, 2012 Published online : February 28, 2012

Welcome message from author
This document is posted to help you gain knowledge. Please leave a comment to let me know what you think about it! Share it to your friends and learn new things together.
Transcript
Journal of Applied Finance & Banking, vol.2, no.1, 2012, 225-246 ISSN: 1792-6580 (print version), 1792-6599 (online) International Scientific Press, 2012
Toward Efficient Management of Working Capital:
The case of the Palestinian Exchange
Ibrahim M. Awad1 and Abdel-Rahman Al-Ewesat2
Abstract
The importance of this study comes from the truth that financial statements' users
need reliable, relevant, and useful financial information that should be reflected in
stock prices. However, this study aims at investigating current ratio, receivables
turnover, inventory turnover, and earnings per share for 18 companies listed on
PEX over the period from 2006 to 2011. Regression analysis and econometric
techniques of Unit root test, Co-integration, and Granger causality are applied.
The study outcomes indicate that stock prices of companies listed on PEX are
affected by working capital components. The results of traditional Granger
Causality reveal that there is no causal relationship between stock prices and
working capital components. In addition, there is a positive relationship between
CR and EPS and stock prices whereas there is a negative relationship between RT
and IT. The paper concludes that cash, times of receivables collection and
inventory turnover are necessary to be taken into account by both investors and
companies for improved the management of working capital at the PEX.
1 Department of Economics, Al-Quds University, e-mail: [email protected] 2 Department of Accounting,, Al-Quds University, e-mail: [email protected] Article Info: Received : December 2, 2011. Revised : January 17, 2012 Published online : February 28, 2012

226 Management of Working Capital
JEL classification numbers: G30
Keywords: Causality, Dickey-fuller test, PEX, Stock prices, and Working capital
management
1 Introduction
The Palestinian Exchange (PEX) was established in 1995 to promote
investment in Palestine. The PEX was fully automated upon establishment- the
first among the Arab Stock Exchanges. The PEX became a public shareholding
company in February 2010 responding to principles of transparency and good
governance. The PEX operates under the supervision of the Palestinian Capital
Market Authority. The market index is known as Al-Quads Index. There are 41
listed companies in PEX as of June 31st, 2010 with market capitalization of about
$2.5 billion across five main economic sectors: banking and financial services,
insurance, investments, industry, and services. Most of the listed companies are
profitable and trade in Jordanian Dinar, while others trade in US$. Only stocks are
currently traded on PEX, but there is potential and readiness to trade other
securities in the future (PEX website).
In 2009, the PEX ranked thirty-third amongst the worldwide security markets,
and regionally comes in second in terms of investor protection. PEX’s Vision
provides a model for Arab and regional financial markets, through providing
innovative services, proposing ideal investment opportunities in securities,
attracting investments, using of state-of-the-art technology, complying with the
rules of corporate governance, and establishing constructive relations with Arab,
regional and global markets. PEX aims at providing a safe and enabling trading
environment characterized by efficiency, fairness and transparency, to increase the
investment awareness of the local community and enhance PEX relations with
local, Arab and international economic institutions and forums, to increase the

I. Awad and A. Al-Ewesat 227
depth of the exchange by continuously listing new companies and to provide new
and diverse financial tools and services (PEX website).
Management of working capital means how the firm will efficiently and
effectively use the cash to finances its operations or its activities, deal with
inventory, receivables collections, pay current maturities. In other words, how
firms should use cash in order to generate cash, which requires the company to
make financial plans. “Proper planning is necessary for the efficient working of
any organizations. This can be in terms of marketing, production/operations,
human resources and financial plans (Dash and Hanuman, 2009).
The existing literature on the management of working capital is limited in scope,
and most prior studies use variables such as current ratio, quick ratio, and net
working capital to evaluate enterprises’ management of short term working capital.
We will investigate determinants of the management of working capital, including
business indicator, industry effect, debt ratio, growth opportunities, operating cash
flow, firm performance and firm size (Chiou and Cheng, 2006). Added to this, in
Palestine we are not only lacking of empirical studies that focus on working
capital management, but also it is still non-existent.
Working capital management plays role in the efficiency and effectiveness
determination, so that reported net working capital can be a good indicator about
the financial position of the firm, and therefore stock prices adjust to reflect that
information. Working capital also includes important elements that support
investors, creditors, and other users in making their decisions because working
capital includes cash and short term asset that can easily converted into cash. In
addition, through working capital, investors can measure current financial
performance and expect future flows. Accordingly, they may decide to buy, sell or
hold securities.
However, the overall objective of this proposed study is to provide both
decision-makers and researchers with specific recommendations and information
on water capital management. It also investigates and uncovers the importance and
228 Management of Working Capital
usefulness of working capital in supporting operating activities and in relation to
market share. The specific objectives are to: (1) determine whether or not the
working capital of Palestinian companies listed in PEX is efficiently managed; (2)
investigate the relationship between working capital management and stock prices;
(3) provide investors and other users with importance of working capital in
measuring financial performance of company; and (4) provide policy makers with
some recommendations regarding working capital presentation in financial
statements.
The remainder of the paper is organized as follows: Section 2 discusses
previous empirical studies. Section 3 shows the hypothesized relationship between
working capital management and stock prices. Section 4 describes the research
methodology being followed. Section 5 presents the results and Section 6 provides
our conclusions and recommendations.
2 Previous Research
All companies are required to release financial statements to provide financial
information concerning their financial situations. Users of those statements are
always interested in investigation the financial situation of firms. They use
analysis of current assets including cash, short term investments, accounts
receivable, inventory, and prepayments and use current liabilities such as
accounts payable, wages and salaries payable, tax payable to measure the
efficiency and effectiveness of working capital management. Accordingly,
working capital management requires efficient and effective use of cash because
efficient working capital means availability of cash. This analysis may support
these users to make profitable decisions. Hill, Kelly, and Highfield (2010) studied
factors influencing working capital behavior and found a weak negative
correlation exists between working capital requirements and market share. If the

I. Awad and A. Al-Ewesat 229
managers aggressively manage working capital accounts (cash, accounts
receivables, inventories, accounts payables, and prepayments), this will result in
cash flow streams (Reason 2004). Petersen and Rajan (1997) found that
receivables are directly related to profitability and capital market access and
Emery (1987) indicates that it is more profitable to increase inventory in time the
sales have increased and Singh (2008) concluded that the size of inventory
directly affects working capital and its management. That is, inventory is a major
component in working capital that may affect cash generation and indicate the
ability of firm to meet its debts as they come due.
In our study we will measure the extent to which that information is useful for
decision making. According to researchers in finance, stock prices can reflect the
accounting information, which is contained in the financial statements. If
accounting information or other financial disclosures reflects items that affect
firm's value, then they should be reflected in the firm's security price (Schroeder
et al. 2005). To gauge the financial performance of any company, financial
statements’ users will use financial ratios as tools for financial measuring process.
As such, the financial ratios capture the relationship between stock prices and
financial performance. In addition, the financial ratios indicate that some listed
companies in PEX face liquidity problems and insufficient net working capital,
but still achieve increasing stock prices. We will, therefore, examine the
relationship between working capital management and stock prices. Awad and
Daraghmah (2009) indicate that the serial correlation tests indicate that the PEX
(previously named PSE) is inefficient at the weak-level. Furthermore, the runs
tests conclude that the PSE at the weak-form is inefficient. Boisjoly (2009)
indicated that there were significant shifts in the means of the accounts payable,
working capital per share and cash flow per share measures over the investigated
period. That is, because financial analysts and financial statements' users need
information about sources of cash, cash generated from operating activities,
efficiency of using assets to generate that cash, and evaluating expected future
230 Management of Working Capital
cash flows, they have to study working capital elements and efficiency of
managing those elements. So, firms can depend on internal financing sources in
order to finance their operations by making rapid sales and producing efficiently.
Mathews et al. (2010) revealed that Firms with greater internal financing capacity
and superior capital market access employ more conservative working capital
policies. Deloof and Jegers (1999) concluded that payables are positively related
to financing deficits.
Generally, recorded working capital and its elements constitute good indicators of
availability of liquidity, which in turn positively or negatively affect(s) stock
prices. Schroeder et al. (2005) indicated that the evaluation of a company's
working capital position and current operating cycle can highlight possible
liquidity problems. Liquidity problems can arise from the failure to convert
current assets into cash in a timely manner or from excessive bad debt losses.
Therefore, liquidity is an important aspect that conveys a good picture about the
ability of the firm to generate cash and pay short-term liabilities and long-term
debts as they come due.
The financial analysts investigate the sources of cash and takes information
about investing, financing, and operating activities from statement of cash flow to
verify the value of cash as recorded in the balance sheet. They then investigate the
accounts receivables and creation of allowance for doubtful accounts, efficiency
of receivables collection, and efficiency of managing inventory in relation with
profitability. Deloof (2003) concluded that management of working capital has a
significant impact on profitability. This conclusion leads us to say increasing
collection of receivables, selling of inventory and delaying of accounts payables
will lead to higher earnings per share, which may affect stock prices. As such,
company can efficiently manage those components to achieve that strategy to
increase its capital market access. Nobanee et al. (2009) suggested more accurate
measures of the efficiency of working capital management where optimal levels
of inventory, receivables and payables are identified. So, financial ratios related to

I. Awad and A. Al-Ewesat 231
working capital can be used in order to examine efficiency of working capital
management and measure the existence of relationship between working capital
and stock prices.
Working capital elements are represented by sales, cost of goods sold, gross
profit, accounts receivables, inventory and net income, which will be adjusted to
result in cash availability for operations. However, those elements are different in
their relationships to working capital management. Lazaridis and Tryfonidis
(2006) showed that there is statistical significance between profitability-measured
through gross operating profit- and the cash conversion cycle.
3 Main Hypothesis
We expect that financial information regarding efficient working capital
management makes no difference in stock prices at the PEX, so that the main
hypothesis of this study is formulated as follows:
Ho: Working capital management doesn’t affect the stock prices.
H1: Working capital management affects the stock prices.
4 Methodology
The study depends on econometric models to investigate the long run causal
relationship between dependent variables and independent variables. They check
the long run relationship between price index and working capital components that
measured by current ratio (CR), receivables turnover (RT), inventory turnover (IT),
and earnings per share (EPS). Because the study depends on time series data,
those variables may be affected by each other from period to period. Accordingly,
the study uses unit-root test to investigate whether the current year is affected by

232 Management of Working Capital
the previous year. Then we use Granger test to investigate causality between
variables. After that, regression analysis is used to investigate the significance of
variables. The study population contains about 45 companies and 18 companies
have been randomly selected as a sample during the stipulated study period
(2006-2010). Because the financial statements weren’t released on a quarterly
basis until 2006, we selected twenty four companies that were the only listed
companies on that date. But six companies are excluded because of lack of data.
The data collected is secondary data (time series data) based on deriving financial
ratios that related to working capital components from the financial statements of
listed companies in the PEX. The data will be analyzed by using Econometric
techniques such as unit root tests to investigate data stationary and error correction
model to investigate the reliability of data measure and causality. Multiple
regression analysis will be used to allow variables to be measured. Our study
basically depends on multiple regression as a mean to investigate the relationship
between dependent and independent variables. Regression indicates the
probability that the regression output isn’t by chance. The small the small the P
the R isn’t by chance. The four important parts of the output of regression are:
Accuracy of R square, significance of F of the regression, reliability of
coefficients, and residuals show no patterns. Thus, we will determine whether or
not dependent variable is affected by independent variable(s). In this case, we will
examine the goodness of fit of the model. In order to test the goodness of fit for
the model, adjusted R2, ts, and p-value will be used.
With regard to the metric of relationship between stock price and efficient
working capital, the following model is used:
Y = f(x) = a + k1x1 + k2x2 + k3x3 + k4x4 + k5x5,
where, Y is the dependent variable; Price index (PI) that is affected by
independent variables, a: constant (Y intercept), X1: current ratio (CR), X2:
receivables turnover (RT), X3: inventory turnover (IT), X4::change in cash (CIC),
X5 is EPS. This model is used for better understanding of the factors influencing
I. Awad and A. Al-Ewesat 233
working capital behavior as reflected in the WCR. The required ratios are:
1- Current ratio = current assets / current liabilities
2- Receivable turnover r= net sales / average trade receivables*
*Average trade receivables= (beg. Receivables + Ending Receivables) / 2.
3- Inventory turnover = cost of goods sold / average inventory*
*Average inventory = (Beg. + end. ) / 2
4- Earning per share = Net income / # of shares outstanding
This model is likely to be helpful to future research. It is the first to
investigate the factors influencing the investment in working capital. On the basis
of this model, stock price, as the dependent variable, is affected by the mentioned
variables that are denoted by Xs. If the company produces products with high
quality and low cost, the sales will grow, which in turn increase the earnings per
share (EPS). Cash flow from operating activities will be reflected in stock prices.
In other words, an increase in the inventory turnover indicates that sales increase,
which will increase EPS, but will not increase cash because the sales may be on
account which may be negatively reflected in stock price because EPS is a general
indicator of performance. However, we have to consider whether these sales are
on account or not because if the accounts receivable are quickly collected, the cash
will increase and therefore it increases the ability of the company to meet its
obligation. As a result, increase in accounts receivable turnover will increase the
cash and therefore improve the firm's liquidity.
Therefore, those five variables can be considered as independent variables to
the correlations between Xs (Measurements of efficient working capital
management) and y (stock price).
Our study depends on quarterly data from Jan.1, 2006 through Dec.31,
2010 with 20 observations (The only data are available at PEX website because
the PEX is still young). A theory of finance holds that stock prices yt are affected
by financial information. Stock price could be affected by information related to
working capital presented in balance sheet and measured by selected six financial
234 Management of Working Capital
ratios. Stock prices denoted by yt are determined by working capital
measurements denoted by Xs.
4.1 Unit-root test
As mentioned above, the study undertakes econometric framework for
analysis of stock prices changes. However, we will use unit root tests by utilizing
a Dickey Fuller test in order to test the stationary of time series data,
xt = f (xt-1)
The analysis depends on the following format:
y = f(x1, x2, x3, x4, x5, x6).
Dickey and Fuller (1979) actually consider three different three regression
equations that can be used to test for the presence of a unit root (Enders, 2010):
∆yt = γyt-1 + �t (1)
∆yt = �0 + γyt-1 + �t (2)
∆yt = �0 + γyt-1 + �2t + �t (3)
From null hypothesis the time series has no clear overall trend direction, the
relevant parameters restrictions for a stochastic trend are that α = 0 and ρ = 0. The
alternative of a stationary process corresponds to -2 < ρ < 0 and in this case ρ is
included to model the possibly non-zero mean of the process. So the testing
problem become: (Heij et al. 2004)
H0: α=0 and ρ=0, there is a trend
H1: (-2<) ρ<0 and α ≠ 0, there is no trend.
The simplest stochastic trend model is the random walk model:
∆yt =α + �t
So that
yt = y1+ α (t-1) + �t

I. Awad and A. Al-Ewesat 235
The hypotheses regarding time series is:
H0: non-stationary
H1: stationary
The application of the model regarding stock prices in relation with working
capital components, the following test equation used:
∆spt = β0 + k1spt-1 + εt
In addition, we use the following model for cointegration analysis:
∆xt = ∑ xt-1 + a + εt
To investigate the stationary level of the sample observations, we use unit root test.
This requires: (Heij et al, 2004)
- Plotting time series yt and xt for unit root test.
- Test the cointegration between the series yt and xt
- Estimate error correction model for the series yt=f(xt-1)
That is, to test whether unit root is present in an autoregressive model:
Yt = βyt-1 + εt;
where yt is the stock price that changes over time by t, which is the time index, α is
a coefficient, and �t is the error term. If β=1, a unit root is present and would be
non-stationary under this assumption. The regression model can be written as:
∆yt = (β-1) yt-1 + �t = α yt-1 + εt,
where ∆ is the difference in stock price and this model could be estimated for unit
root is applicable to test α = 0 where α = β – 1.
This model can be rewritten as follows:
∆SP = α + αT +∑ β1∆CAt-1 +∑ β2∆ARt-1+∑ β3∆It-1+∑ β4∆EPSt-1+ εt-1,
where ∆SP is change in stock prices, α is y-coefficient (constant), T is time trend,
β is the percentage change in stock price, ∆CA is change in current assets, ∆AR is
change in accounts receivables, ∆I is change in inventory, ∆EPS is change in
earnings per share, and � is error term.
236 Management of Working Capital
4.2 Co-integration model
According to the abovementioned model, we will use unit root test to test the
stationary of time series data. Accordingly, we will consider the joint dependent
time series variables. When the data or variables are stationary, we will use error
correction model as a mechanism between the time series. In other words, we will
investigate whether or not the time series data are cointegrated. The Cointegration
Model will be used because the independent variables are actually correlated
while multiple regression indicates that they aren't correlated. The Cointegration
model tries to discover Multicollinearity among variables. This can help for
testing hypothesis that the stock prices are related or not to working capital
management. The required regression model is:
yt = kxt + εt
In case the data is stationary, so we can use cointegration modal. Models to
be used to test changes of variables are;
∆ yt = yt – yt-1 and ∆xt = xt – xt-1,
where ∆ yt is change in stock prices, whereas ∆xt is change in independent
variables (Xs). Such as, we employ an econometric tool of time series variables-
stock prices and all mentioned independent variable. If stock prices and
independent variables are non-stationary, then the time series are cointegrated. To
write a linear combination of the stationary variables ∆ yt and ∆xt, we derive the
following cointegration model:
∆ yt = β0 ∆xt – β1 ∆yt + ∑ ∆yt-k + ∑ ∆xt-k + εt
Ln (stock prices) = k0 + k1 (years of investment) + εt
More specifically, the model is:
yt – (yt-1 – yt-1) = kxt + k (xt-1 – xt-1) + εt,
if the two variables yt and xt are both integrated of order 1- that is, if they both
contain stochastic trends- then the ECM model yt-1 – yxt-1 – δ can be written as a
linear combination of the stationary variables �t, ∆yt and ∆xt and their lags. This
implies that yt-1 – yxt-1 is also stationary.
I. Awad and A. Al-Ewesat 237
The model can be rewritten as follows: (Heij, Boer, Franses, Kloek, Dijk,
2004)
∆yt = - (yt-1 – kxt-1) + kxt + εt
This will support empirical results if the hypothesis is confirmed regarding
working capital management and stock prices.
4.3 Causality Test
Under this test, we use the causality test of Granger in order to investigate
whether or not there is a causal relationship between two variables in the long-run
and which one causes this relationship. Thus, the Granger model is used to
investigate how much of current Y can be explained by a past value of X-
independent variable. If the independent variables- Xs are statistically significant,
Y can be Granger caused by those Xs and then Xs help in the prediction of Y.
However, to determine the relationship, Granger causality test can provide
indication of the relationship between those variables. This leads to acceptance or
rejection of H0 using F-test and probability. The following equation can estimate
of that relationship:
∆xt-1 = α1∆xt-1 + β1∆yt-1 + �t,
where X is the independent variables and y is the dependent variable- PI.
This study requires gathering data from financial statements of 17 listed firms
in Palestinian Exchange (PEX) and then analyzing the information related to
working capital management using financial ratios as a test of hypothesis. The
data include quarterly financial statements including information on sales, cash,
receivables, inventories, operating cash flows, and current payables. This
information will be used in order to derive financial ratios to be used as
measurements of efficient market hypothesis. As such, the study undertakes a
quantitative approach because the analysis mainly considers financial ratios as
measurements for working capital management. The source of data will be the

238 Management of Working Capital
financial statements of the selected 18 companies listed on PEX, which are
secondary data. This data will be obtained from the official website of PEX.
5 Empirical Results and Analysis
This study used quarterly observations of price index in relation of working
capital components’ ratios. As mentioned before, the period of time under
examination starts from Jan.1, 2006 through Dec.31, 2010 with 20 observations.
Figure 1 provides general look of Average PI direction of 18 companies listed on
PEX during the mentioned period. Figure 2 provides description of CR, RT, IT,
and EPS trends under examination over the 20 quarters.
As Figure 1 and 2 depicted before, the data don’t appear stationary and there
is no trend, so we use unit root test at lag 2 to investigate the extent to which the
current year is significantly affected by previous year.
Figure 1: Price Index (PI) trend from Jan.1 2006 to Dec.31, 2010.

I. Awad and A. Al-Ewesat 239
Figure 2: Independent variables trend from Jan.1 2006 to Dec.31, 2010.
5.1 Augmented Dickey-fuller
Table 1 shows the results of the Augmented Dickey fuller unit root test
investigating whether data under examination period are stationary or not and
determining if there is a trend or not.
Table 1: ADF tests for dependent and independent variables
Variable D(PI,3) D(CR,3) D(RT,3) D(IT,3) D(EPS,3) Test critical val. at 5%
-3.791172 -3.791172 -3.759743 -3.791172 -3.759743
One-sided p-value 0.2690 0.0055 0.0001 0.0060 0.0003 Co-efficient 0.478442 0.822831 0.572006 1.501432 0.748066 Std. Error 0.462361 0.291177 0.074001 0.467542 0.199412 t-statistic 1.034780 2.825881 7.729674 3.211330 3.751363 Prob. 0.3310 0.0223 0.0000 0.0124 0.0038 Adjusted R-square
0.594676 0.929172 0.985015 0.883082 0.881526
F-statistic 4.814614 35.10871 231.0663 20.63772 27.04225 Prob(F-statistic) 0.025038 0.000031 0.000000 0.000221 0.000024 Durbin-Watson stat
1.387536 2.443654 2.611892 2.379845 1.743838

240 Management of Working Capital
At level of 5% significance, we conclude the time series data are stationary
and there is a trend, so CR, RT, IT, and EPS are considered by investors and they
are reflected in stock prices, and therefore, we accept H1 in favor of Ho.
5.2 Co-integration analysis
As indicated before, cointegration test determine whether non-stationary series is
cointegrated or not. In Table 2, cointegration output presented to support the result
regarding residuals, so we can accept whether series stationary or not.
Table 2: Cointegration output
Variable Eigenvlaue Trace statistic 0.05 critical value Prob. PI 0.109717 2.091877 3.841466 0.1481 CR 0.138460 2.682610 3.841466 0.1014 RT 0.415157 9.655415 3.841466 0.0019 IT 0.564601 14.96686 3.841466 0.0001 EPS 0.324583 7.063659 3.841466 0.0079
According to cointegration output, trace test indicates no cointegration at the
0.05 significance level and at a probability of 0.1481; we accept H0 and reject H1.
Thus the residuals regarding PI and CR are non-stationary and therefore there is
no cointegration between those variables. However, trace test indicates 1
cointegration eqn(s) at the 0.05 level regarding RT, IT and EPS, thus we reject H0
and accept H1, and thus the residuals regarding RT, IT and EPS are stationary and
therefore there is a cointegration between those variables.
I. Awad and A. Al-Ewesat 241
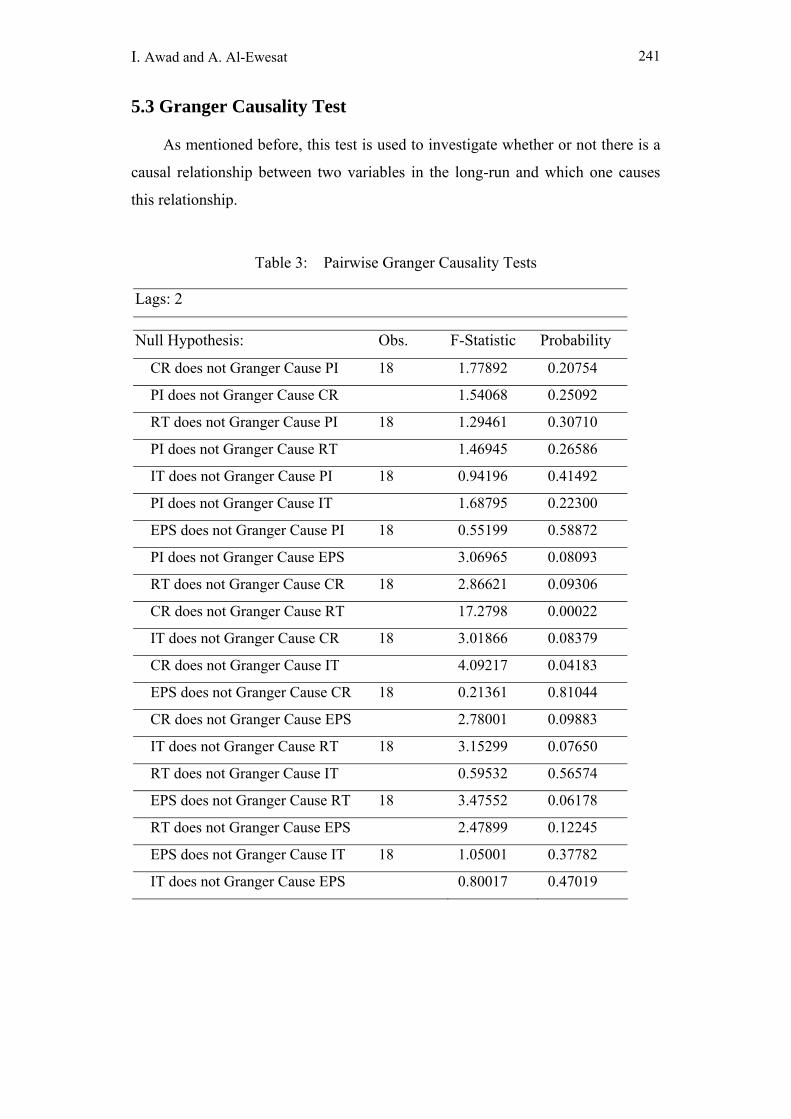
5.3 Granger Causality Test
As mentioned before, this test is used to investigate whether or not there is a
causal relationship between two variables in the long-run and which one causes
this relationship.
Table 3: Pairwise Granger Causality Tests
Lags: 2
Null Hypothesis: Obs. F-Statistic Probability
CR does not Granger Cause PI 18 1.77892 0.20754
PI does not Granger Cause CR 1.54068 0.25092
RT does not Granger Cause PI 18 1.29461 0.30710
PI does not Granger Cause RT 1.46945 0.26586
IT does not Granger Cause PI 18 0.94196 0.41492
PI does not Granger Cause IT 1.68795 0.22300
EPS does not Granger Cause PI 18 0.55199 0.58872
PI does not Granger Cause EPS 3.06965 0.08093
RT does not Granger Cause CR 18 2.86621 0.09306
CR does not Granger Cause RT 17.2798 0.00022
IT does not Granger Cause CR 18 3.01866 0.08379
CR does not Granger Cause IT 4.09217 0.04183
EPS does not Granger Cause CR 18 0.21361 0.81044
CR does not Granger Cause EPS 2.78001 0.09883
IT does not Granger Cause RT 18 3.15299 0.07650
RT does not Granger Cause IT 0.59532 0.56574
EPS does not Granger Cause RT 18 3.47552 0.06178
RT does not Granger Cause EPS 2.47899 0.12245
EPS does not Granger Cause IT 18 1.05001 0.37782
IT does not Granger Cause EPS 0.80017 0.47019
242 Management of Working Capital
Thus, the Granger model is used to investigate how much of current Y can be
explained by a past value of X- independent variable. Table 3 contains output of
Pairwise Granger Causality Tests to support the analysis.
Thus, we conclude that CR, RT, IT, and EPS aren’t likely to cause stock
price represented by price index at level of 5% significance. That is, nearly
P-values > 0.05 for all variables. In addition, independent variables don’t affect
each other, which indicate there is no causal relationship between dependent and
independent variables. So, we accept the null hypothesis that indicate that that
series data not stationary. As A result, there is no causal relationship between
dependent and independent variables on the basis of traditional Granger causal
test.
5.4 Regression Analysis
To describe the relationship between variables, we must use regression as a
mean to do that. Multiple regression describe the relationship among dependent
variable (PI) and independent variables (CR, RT, IT, EPS) and independent
variables. The mathematical form of multiple regression is
PI= α + k1CR + k2RT + k3IT + k4EPS + εt
In Table 4 is presented a multiple regression output regarding dependent and
independent variables. From regression output, the model that can describe the
relationship between dependent and independent variables is:
PI(X) = 1.55 + 0.198CR - 0.098RT - 0.006IT + 3.6EPS
To assess whether this model is likely to describe the relationship between Y and
Xs, the overall significance should be evaluated. From regression output, Adj. R2
= 0.495 and R2 having statistically significant regression coefficients, which
means that the Xs explains and describe only 0.495 of dependent variable PI and
Multicollinearity isn’t a problem for this model.
I. Awad and A. Al-Ewesat 243
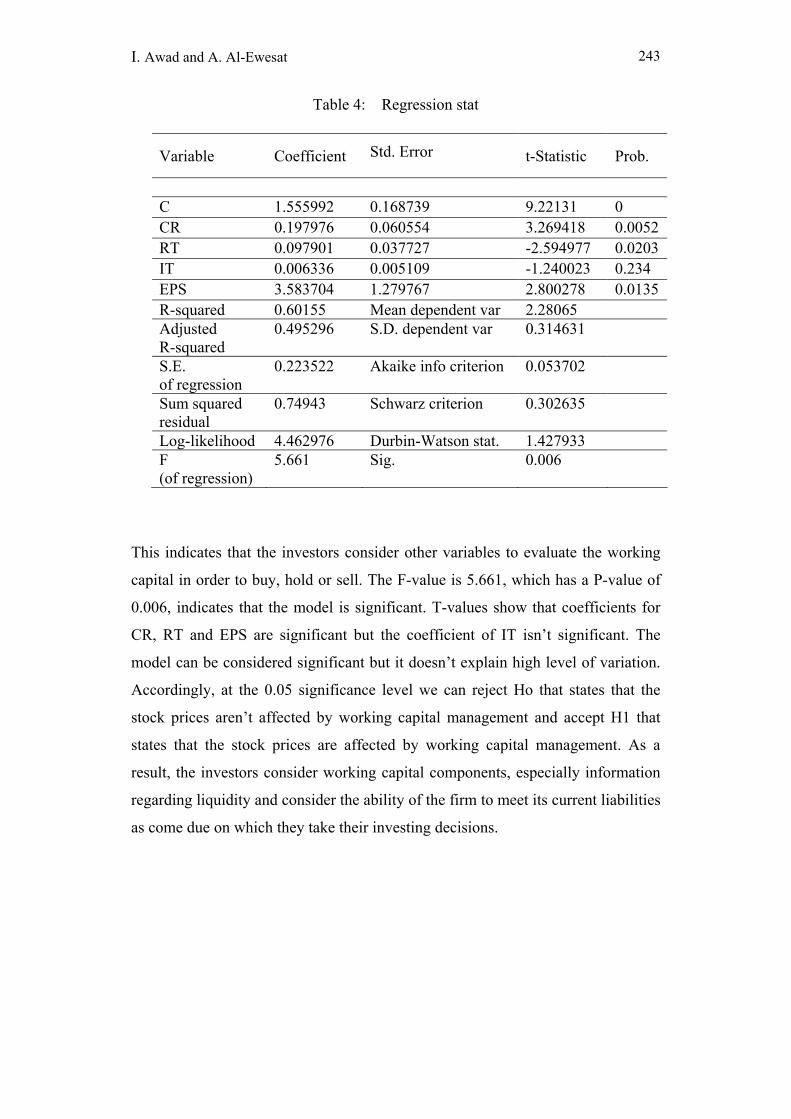
Table 4: Regression stat
This indicates that the investors consider other variables to evaluate the working
capital in order to buy, hold or sell. The F-value is 5.661, which has a P-value of
0.006, indicates that the model is significant. T-values show that coefficients for
CR, RT and EPS are significant but the coefficient of IT isn’t significant. The
model can be considered significant but it doesn’t explain high level of variation.
Accordingly, at the 0.05 significance level we can reject Ho that states that the
stock prices aren’t affected by working capital management and accept H1 that
states that the stock prices are affected by working capital management. As a
result, the investors consider working capital components, especially information
regarding liquidity and consider the ability of the firm to meet its current liabilities
as come due on which they take their investing decisions.
Variable Coefficient Std. Error t-Statistic Prob.
C 1.555992 0.168739 9.22131 0 CR 0.197976 0.060554 3.269418 0.0052 RT 0.097901 0.037727 -2.594977 0.0203 IT 0.006336 0.005109 -1.240023 0.234 EPS 3.583704 1.279767 2.800278 0.0135 R-squared 0.60155 Mean dependent var 2.28065 Adjusted R-squared
0.495296 S.D. dependent var 0.314631
S.E. of regression
0.223522 Akaike info criterion 0.053702
Sum squared residual
0.74943 Schwarz criterion 0.302635
Log-likelihood 4.462976 Durbin-Watson stat. 1.427933 F (of regression)
5.661 Sig. 0.006
244 Management of Working Capital
6 Conclusions and Policy Implications
In Palestine, empirical studies on working capital management are very rare
or non-existent yet. This study is likely to be the first one in Palestine that
examines the relationship between stock price and information about working
capital components including cash, receivables, inventories, current liabilities of
18 companies listed on PEX.
The variables of CR, RT and EPS aren’t normally distributed, but IT is
normally distributed, so the study confirms that investors consider information
regarding liquidity, receivables and EPS, but they aren't significantly considered
by investors when they make their decisions. So far we observed that financial
ratios related working capital components are considered by investors and
reflected in stock prices and those prices not significantly increasing as depicted in
figure 1. According to Augmented Dickey-fuller test (ADF), time series data
regarding independent variables are stationary but for dependent variable aren't
and management of working capital components doesn't affect stock prices.
Depending on Traditional Granger test, there is no causal relationship between
variables and this isn't in conformance with the studies of Dash and Hanuman
(2009) and Lazaridis and Dimitrios (2006). But regression output indicates that
Stock prices are related to management of working capital components. In
addition, we observed a positive relationship between CR, EPS and stock prices,
whereas RT and IT are negatively related to stock prices because of inability to
collect all receivables or to sell inventory. Furthermore, receivables and
inventories aren't efficiently managed to generate cash and therefore paying
current liabilities. Such as, investors can depend on financial information related
working capital components to measure firm's ability to meet liabilities as they
come due.
The paper findings also provide two important implications. Firstly, the
information that is revealed should be very useful for prudent investors and PEX.
Secondly, we can conclude that working capital management might be an

I. Awad and A. Al-Ewesat 245
important necessary to be taken into account by both investors and companies.
This is likely to improve working capital management.
The study indicates that the information about working capital components is
important and should be considered because this information measures the ability
of firm to pay debts and investors should consider that information. To
recommend, professional organization should require companies to release
detailed information and strengthen disclosure about current asset and current
liabilities. For further research, as the PEX is still young and lack of empirical
studies, so that conducting other studies on PEX is of special value to both
researchers and policymakers.
ACKNOWLEDGEMENT: We are grateful to anonymous referees whose
comments have made this paper better.
References
[1] I. Awad and Z. Daraghmah, Testing the Weak-Form Efficiency of the
Palestinian Securities Market, International Research Journal of Finance and
Economics, 32, (2009).
[2] P. Boisjoly, The cash flow implication of managing working capital and
capital investment, Journal of Business and Economic Studies, 15(1), (2009),
98-108.
[3] J. R. Chiou and C. Li, The determinants of working capital management,
Journal of American Academy of Business, 10(1), (2006).
[4] H. Christiaon, P. Boer, P. Franses, T. Kloek and H. Dijk, Econometrics
Methods with applications in Business and Economics, Oxford University
Press, 2004.

246 Management of Working Capital
[5] M. Dash and H. Rani, A liquidity-profitability trade-off model for working
capital management, Alliance Business School, 7, (2009).
[6] M. Deloof, M. Jegers, Trade credit, Corporate Groups, and The Financing of
Belgian Firms, Journal of Business Finance and Accounting, 26, (1999),
945-966.
[7] M. Deloof, Does working Capital Management Affect profitability of
Belgain firms?, Journal of Business Finance and Accounting, 30, (2003),
570-585.
[8] G. Emery, An Optimal Financial Response to Variable demand, Journal of
Financial and Quantitive analysis, 22, (1987), 209-225.
[9] W. Enders, Applied Econometric Time Series, Wiley, 2010.
[10] W.H. Greene, Econometric Analysis, Prentice Hall, 2003.
[11] M. Hill, G. Kelly and J. Highfield, Net operating working capital behavior: A
first look, Financial Management, (2010), 783-805.
[12] I. Lazaridis, and T. Dimitrios, The relationship between working capital
management and profitability of listed companies in the Athens Stock
Exchange, Journal of Financial Management and Analysis, 19(1), (2006).
[13] H. Nobanee, W. Alshattarat and A. Haddad, Optimizing working capital
management, SSRN, 2009.
[14] M. Petersen and R. Rajan, Trade Credit: Theories and Evidence, Review of
financial studies, 10, (1997), 661-691.
[15] T. Reason, The 2002 working capital survey, CFO magazine, (2002), 14
pages.
[16] G.R. Schroeder, W. Myrtle and M. Jack, Financial Accounting Theory and
Analysis; Text Readings and Cases, John Wiley and Sons, Inc, 2005.
[17] P. Singh, Inventory and working capital management: An empirical analysis.
The Icfai University Journal of accounting Research, (2008).
[18] Website of PEX, http://www.p-s-e.com.
Related Documents


