Tourism in the Tyrol Facts and figures 2012 Tirol Werbung / Strategien & Partner FACTS AND FIGURES 2013 1 Tourism in the Tyrol Facts and Figures 2013

Welcome message from author
This document is posted to help you gain knowledge. Please leave a comment to let me know what you think about it! Share it to your friends and learn new things together.
Transcript
1
Tourism in the TyrolFacts and figures 2012
Tirol Werbung / Strategien & Partner
FACTS AND FIGURES 2013
Tourism in the TyrolFacts and Figures 2013
FACTS AND FIGURES 2013 2
Agenda
Tirol Werbung / Strategien & Partner
1. Arrivals and overnight stays in the Tyrol
2. Markets of origin
3. Tourism associations and municipalities
4. Accommodation
5. Economic importance of tourism in the Tyrol
6. Reasons for visiting the Tyrol
FACTS AND FIGURES 2013 3Tirol Werbung / Strategien & Partner
Arrivals and overnight stays in Tyrol
FACTS AND FIGURES 2013 4
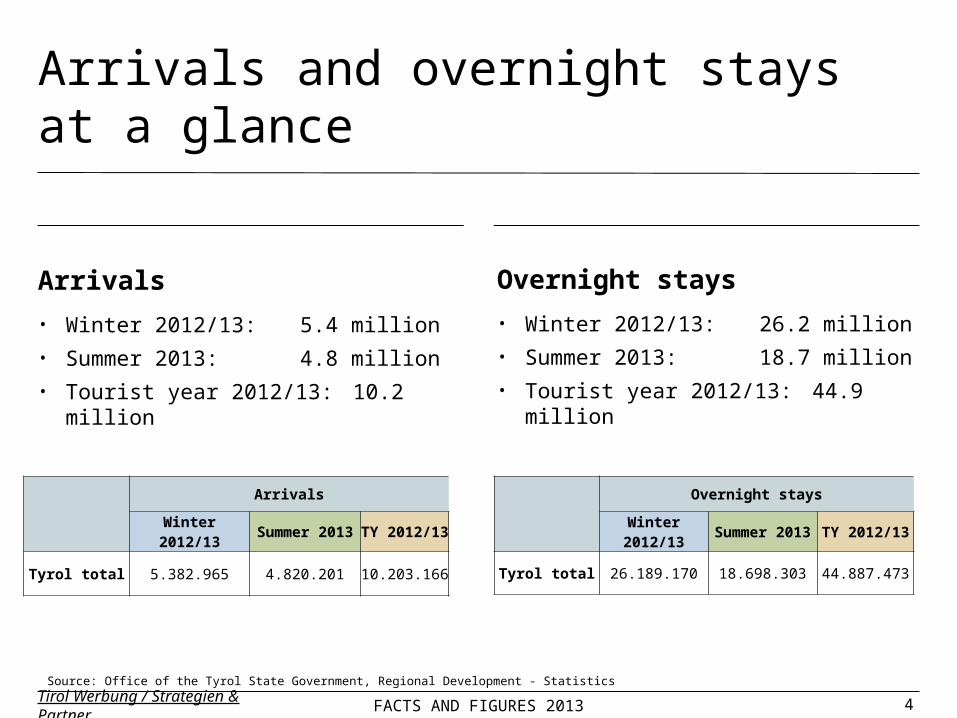
Arrivals and overnight stays at a glance
Tirol Werbung / Strategien & Partner
Arrivals
• Winter 2012/13: 5.4 million• Summer 2013: 4.8 million• Tourist year 2012/13: 10.2 million
Arrivals
Winter 2012/13
Summer 2013
TY 2012/13
Tyrol total 5.382.965 4.820.201 10.203.166
Overnight stays
• Winter 2012/13: 26.2 million• Summer 2013: 18.7 million• Tourist year 2012/13: 44.9 million
0
Overnight stays
Winter 2012/13
Summer 2013
TY 2012/13
Tyrol total 26.189.170 18.698.303 44.887.473
Source: Office of the Tyrol State Government, Regional Development - Statistics
FACTS AND FIGURES 2013 5
1951
1953
1955
1957
1959
1961
1963
1965
1967
1969
1971
1973
1975
1977
1979
1981
1983
1985
1987
1989
1991
1993
1995
1997
1999
2001
2003
2005
2007
2009
2011
2013
0
5,000,000
10,000,000
15,000,000
20,000,000
25,000,000
30,000,000
35,000,000
40,000,000
45,000,000
50,000,000
SummerWinter
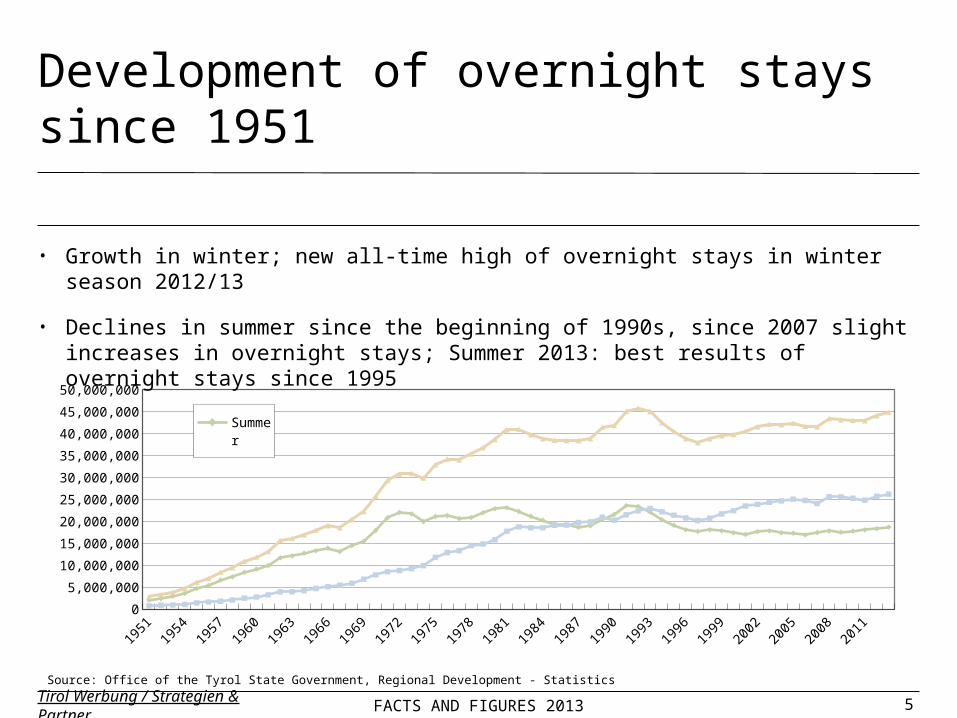
Development of overnight stays since 1951
Tirol Werbung / Strategien & Partner
• Growth in winter; new all-time high of overnight stays in winter season 2012/13
• Declines in summer since the beginning of 1990s, since 2007 slight increases in overnight stays; Summer 2013: best results of overnight stays since 1995
Source: Office of the Tyrol State Government, Regional Development - Statistics
FACTS AND FIGURES 2013 6
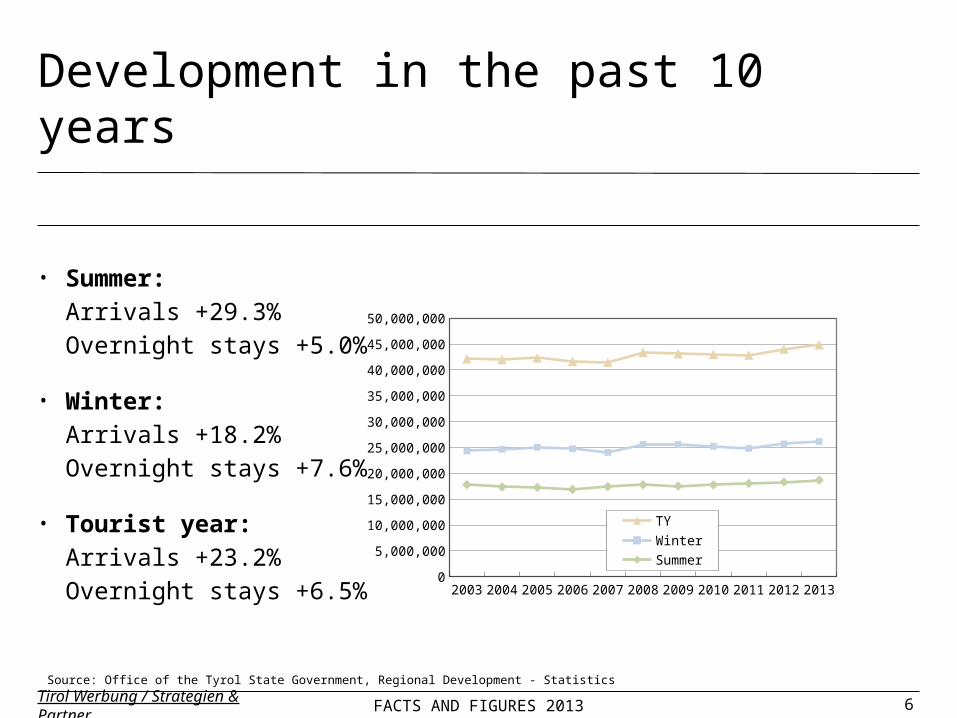
Development in the past 10 years
Tirol Werbung / Strategien & Partner
• Summer: Arrivals +29.3% Overnight stays +5.0%
• Winter: Arrivals +18.2%Overnight stays +7.6%
• Tourist year:Arrivals +23.2% Overnight stays +6.5%
Source: Office of the Tyrol State Government, Regional Development - Statistics
2003 2004 2005 2006 2007 2008 2009 2010 2011 2012 20130
5,000,000
10,000,000
15,000,000
20,000,000
25,000,000
30,000,000
35,000,000
40,000,000
45,000,000
50,000,000
TYWinterSummer
FACTS AND FIGURES 2013 7Tirol Werbung / Strategien & Partner
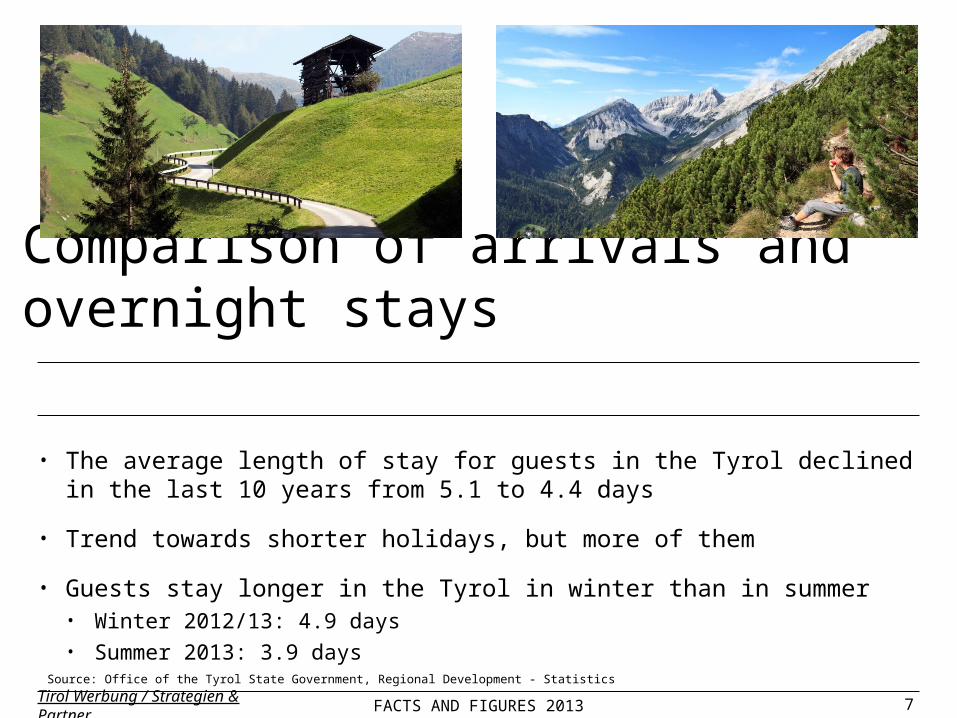
• The average length of stay for guests in the Tyrol declined in the last 10 years from 5.1 to 4.4 days
• Trend towards shorter holidays, but more of them
• Guests stay longer in the Tyrol in winter than in summer• Winter 2012/13: 4.9 days• Summer 2013: 3.9 days
Comparison of arrivals and overnight stays
Source: Office of the Tyrol State Government, Regional Development - Statistics
FACTS AND FIGURES 2013 8Tirol Werbung / Strategien & Partner
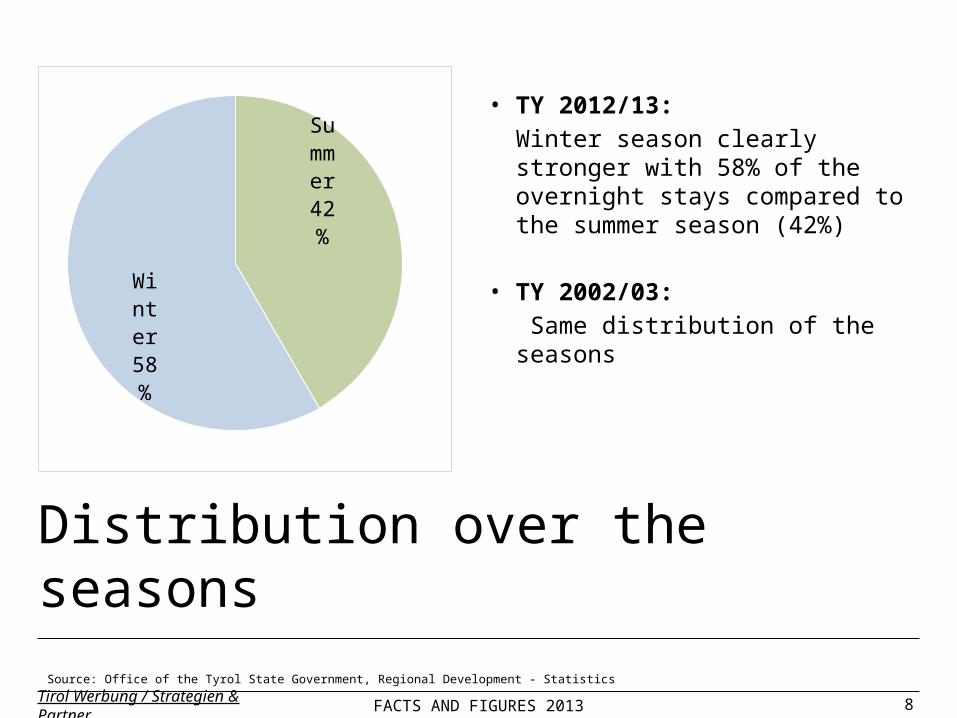
Distribution over the seasons
• TY 2012/13:Winter season clearly stronger with 58% of the overnight stays compared to the summer season (42%)
• TY 2002/03: Same distribution of the seasons
Summer
42%
Winter58%
Source: Office of the Tyrol State Government, Regional Development - Statistics
FACTS AND FIGURES 2013 9Tirol Werbung / Strategien & Partner
Markets of origin
FACTS AND FIGURES 2013 10
Source markets in winter 2012/13
Tirol Werbung / Strategien & Partner
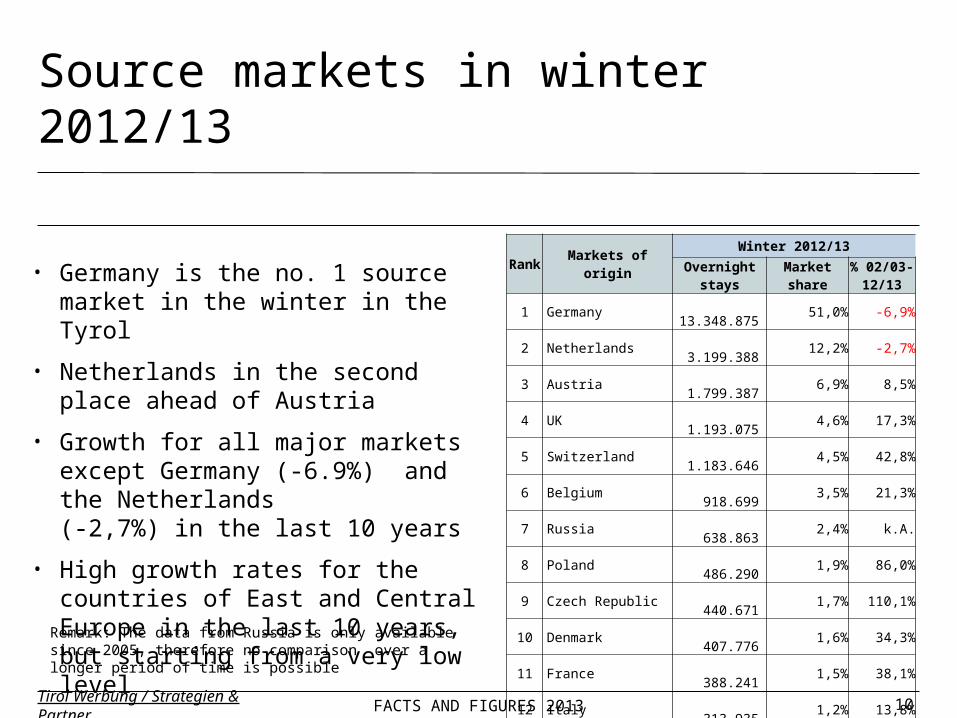
• Germany is the no. 1 source market in the winter in the Tyrol
• Netherlands in the second place ahead of Austria
• Growth for all major markets except Germany (-6.9%) and the Netherlands (-2,7%) in the last 10 years
• High growth rates for the countries of East and Central Europe in the last 10 years, but starting from a very low level
Rank Markets of origin
Winter 2012/13Overnight
staysMarket share
% 02/03-12/13
1 Germany
13.348.875 51,0% -6,9%
2 Netherlands
3.199.388 12,2% -2,7%
3 Austria
1.799.387 6,9% 8,5%
4 UK
1.193.075 4,6% 17,3%
5 Switzerland
1.183.646 4,5% 42,8%
6 Belgium
918.699 3,5% 21,3%
7 Russia
638.863 2,4% k.A.
8 Poland
486.290 1,9% 86,0%
9 Czech Republic
440.671 1,7% 110,1%
10 Denmark
407.776 1,6% 34,3%
11 France
388.241 1,5% 38,1%
12 Italy
313.935 1,2% 13,8%
13 Sweden
203.859 0,8% 44,8%
14 Romania
179.380 0,7% 2200,6%
15 Luxembourg
129.030 0,5% 38,1%
Other markets
1.358.055 5,2% 52,4%
Tyrol total
26.189.170 100,0% 7,6%
Remark: The data from Russia is only available since 2005, therefore no comparison over a longer period of time is possible
FACTS AND FIGURES 2013 11
Germany51%
Netherlands12%
Austria7%
UK5%
Switzerland
5%
Bel-gium4%Rus
sia2%
Poland
2%Czech Re-
public2%
Denmark2%
France
1%
Italy1%
Sweden1%
Romania1%
Luxembourg0%
Other markets 5%
Tirol Werbung / Strategien & Partner
Source markets in winter 2012/13
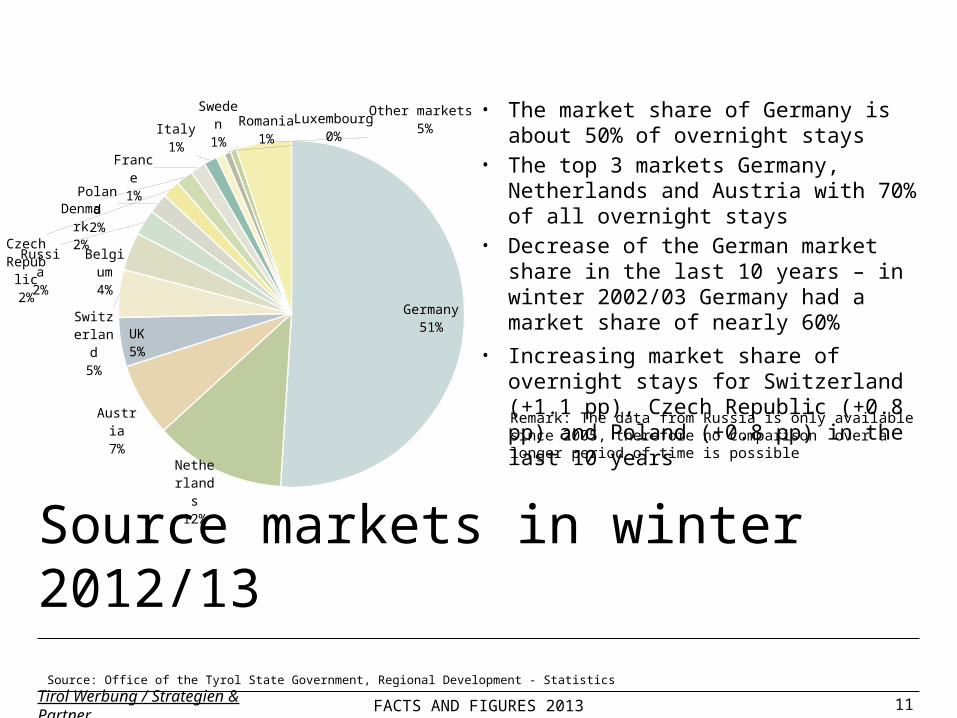
• The market share of Germany is about 50% of overnight stays
• The top 3 markets Germany, Netherlands and Austria with 70% of all overnight stays
• Decrease of the German market share in the last 10 years – in winter 2002/03 Germany had a market share of nearly 60%
• Increasing market share of overnight stays for Switzerland (+1.1 pp), Czech Republic (+0.8 pp) and Poland (+0.8 pp) in the last 10 years
Source: Office of the Tyrol State Government, Regional Development - Statistics
Remark: The data from Russia is only available since 2005, therefore no comparison over a longer period of time is possible
FACTS AND FIGURES 2013 12
Source markets summer 2013
Tirol Werbung / Strategien & Partner
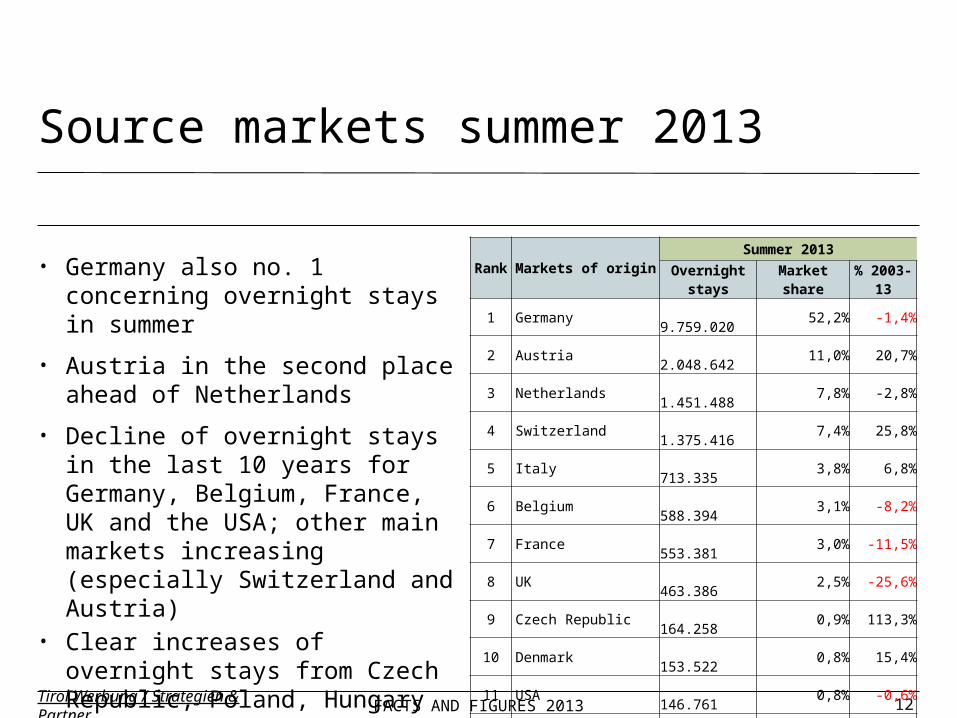
• Germany also no. 1 concerning overnight stays in summer
• Austria in the second place ahead of Netherlands
• Decline of overnight stays in the last 10 years for Germany, Belgium, France, UK and the USA; other main markets increasing (especially Switzerland and Austria)
• Clear increases of overnight stays from Czech Republic, Poland, Hungary and China, but starting from a low level
Rank Markets of originSummer 2013
Overnight stays
Market share
% 2003-13
1 Germany 9.759.020
52,2% -1,4%
2 Austria 2.048.642
11,0% 20,7%
3 Netherlands 1.451.488
7,8% -2,8%
4 Switzerland 1.375.416
7,4% 25,8%
5 Italy 713.335
3,8% 6,8%
6 Belgium 588.394
3,1% -8,2%
7 France 553.381
3,0% -11,5%
8 UK 463.386
2,5% -25,6%
9 Czech Republic 164.258
0,9% 113,3%
10 Denmark 153.522
0,8% 15,4%
11 USA 146.761
0,8% -0,6%
12 China 115.188
0,6% 1443,7%
13 Poland 98.325
0,5% 159,2%
14 Hungary 92.629
0,5% 90,4%
15 Spain 78.250
0,4% 13,5%
Other markets 896.308
4,8% 62,1%
Tyrol total 18.698.303
100,0% 5,0%
FACTS AND FIGURES 2013 13
Germany52%
Austria11%
Nether-lands8%
Switzerland7%
Italy4%
Bel-gium3%
France3%UK
2%
Czech Repub-
lic1%
Denmark1%
USA1%
China 1% Poland
1%
Hungary1% Spain
0%
Other markets 5%
Tirol Werbung / Strategien & Partner
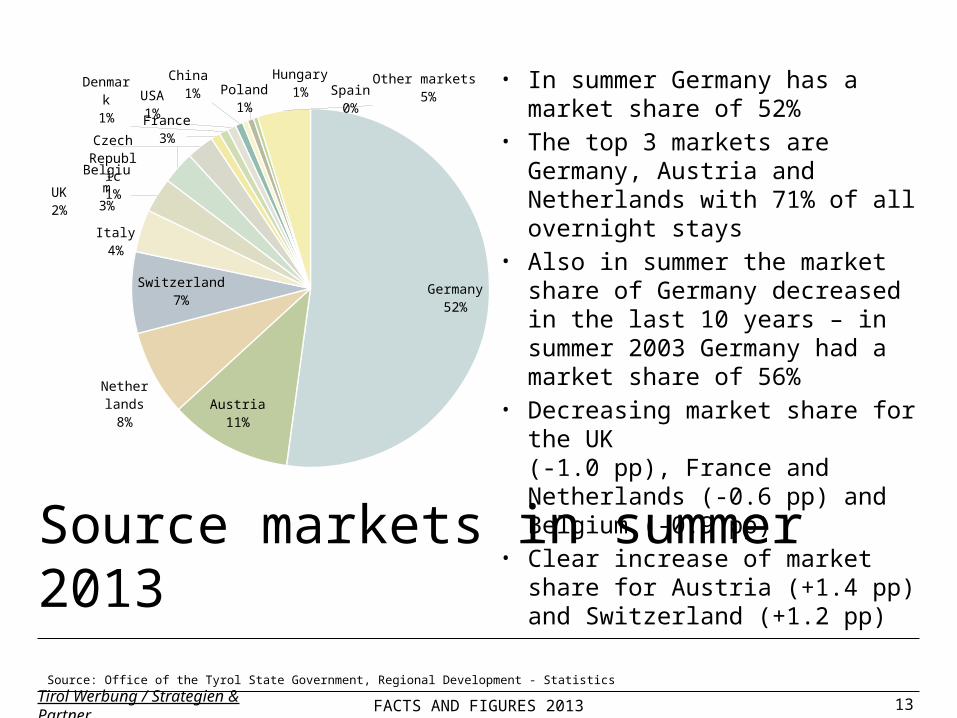
Source markets in summer 2013
• In summer Germany has a market share of 52%
• The top 3 markets are Germany, Austria and Netherlands with 71% of all overnight stays
• Also in summer the market share of Germany decreased in the last 10 years – in summer 2003 Germany had a market share of 56%
• Decreasing market share for the UK (-1.0 pp), France and Netherlands (-0.6 pp) and Belgium (-0.9 pp)
• Clear increase of market share for Austria (+1.4 pp) and Switzerland (+1.2 pp)
Source: Office of the Tyrol State Government, Regional Development - Statistics
FACTS AND FIGURES 2013 14
Source markets in TY 2012/13
Tirol Werbung / Strategien & Partner
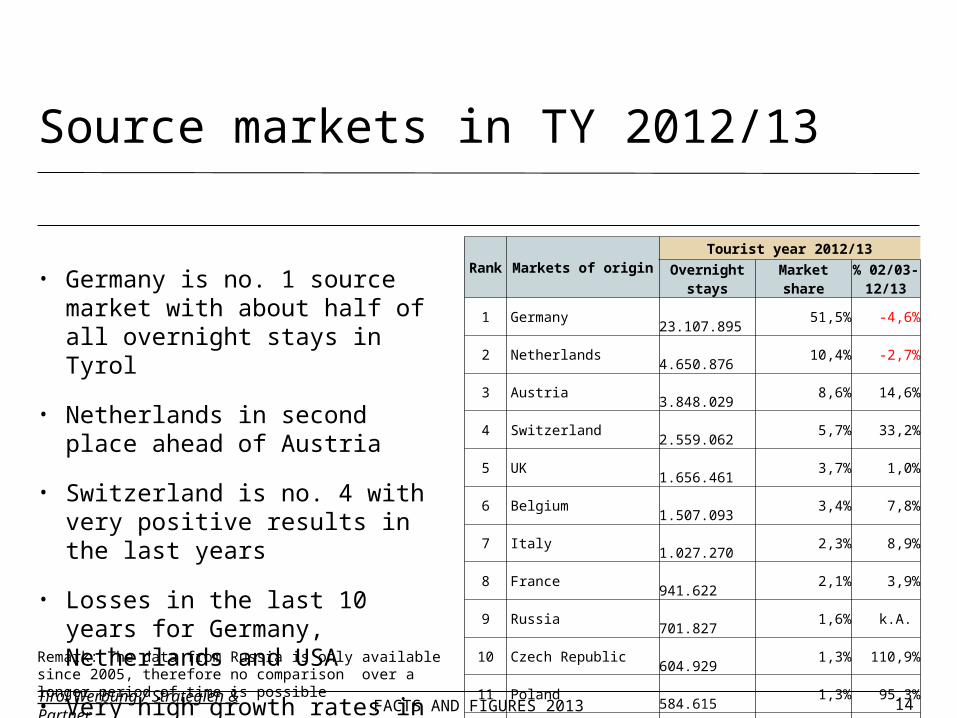
• Germany is no. 1 source market with about half of all overnight stays in Tyrol
• Netherlands in second place ahead of Austria
• Switzerland is no. 4 with very positive results in the last years
• Losses in the last 10 years for Germany, Netherlands and USA
• Very high growth rates in the markets Czech Republic, Poland and Romania
Rank Markets of originTourist year 2012/13
Overnight stays
Market share
% 02/03-12/13
1 Germany 23.107.895
51,5% -4,6%
2 Netherlands 4.650.876
10,4% -2,7%
3 Austria 3.848.029
8,6% 14,6%
4 Switzerland 2.559.062
5,7% 33,2%
5 UK 1.656.461
3,7% 1,0%
6 Belgium 1.507.093
3,4% 7,8%
7 Italy 1.027.270
2,3% 8,9%
8 France 941.622
2,1% 3,9%
9 Russia 701.827
1,6% k.A.
10 Czech Republic 604.929
1,3% 110,9%
11 Poland 584.615
1,3% 95,3%
12 Denmark 561.298
1,3% 28,6%
13 Sweden 274.344
0,6% 28,0%
14 USA 234.856
0,5% -15,9%
15 Romania 211.982
0,5% 2618,8%
Other markets 2.415.314
5,4% 65,7%
Total 44.887.473
100,0% 6,5%
Remark: The data from Russia is only available since 2005, therefore no comparison over a longer period of time is possible
FACTS AND FIGURES 2013 15
Germany51%
Netherlands10%
Austria9%
Switzerland6%
UK4%
Belgium3%
Italy2%
France2%
Russia2%
Czech Republic
1%
Poland1%
Denmark1%
Sweden1%
USA 1%
Romania1%
Other markets 5%
Tirol Werbung / Strategien & Partner
Source markets in TY 2012/13
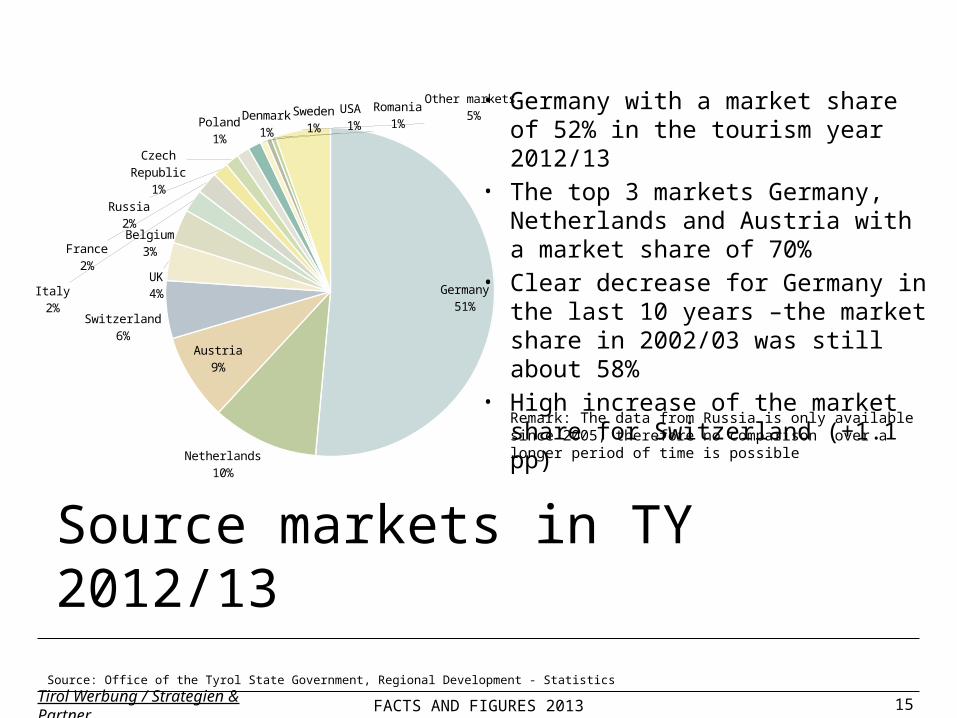
• Germany with a market share of 52% in the tourism year 2012/13
• The top 3 markets Germany, Netherlands and Austria with a market share of 70%
• Clear decrease for Germany in the last 10 years –the market share in 2002/03 was still about 58%
• High increase of the market share for Switzerland (+1.1 pp)
Source: Office of the Tyrol State Government, Regional Development - Statistics
Remark: The data from Russia is only available since 2005, therefore no comparison over a longer period of time is possible
FACTS AND FIGURES 2013 16Tirol Werbung / Strategien & Partner
Tourism associations and municipalities
FACTS AND FIGURES 2013 17
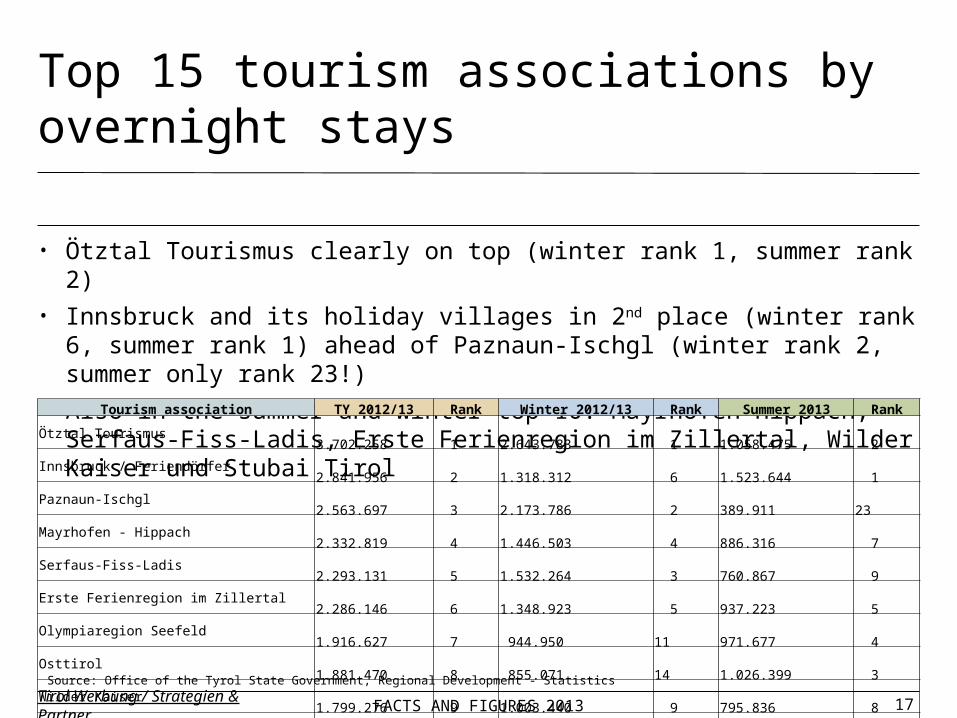
Top 15 tourism associations by overnight stays
Tirol Werbung / Strategien & Partner
• Ötztal Tourismus clearly on top (winter rank 1, summer rank 2)• Innsbruck and its holiday villages in 2nd place (winter rank 6, summer
rank 1) ahead of Paznaun-Ischgl (winter rank 2, summer only rank 23!)• Also in the summer and winter top 10: Mayrhofen-Hippach, Serfaus-
Fiss-Ladis, Erste Ferienregion im Zillertal, Wilder Kaiser und Stubai Tirol
Source: Office of the Tyrol State Government, Regional Development - Statistics
Tourism association TY 2012/13 Rank Winter 2012/13 Rank Summer 2013 RankÖtztal Tourismus 3.702.258 1 2.643.783 1 1.058.475 2 Innsbruck / Feriendörfer 2.841.956 2 1.318.312 6 1.523.644 1 Paznaun-Ischgl 2.563.697 3 2.173.786 2 389.911 23 Mayrhofen - Hippach 2.332.819 4 1.446.503 4 886.316 7 Serfaus-Fiss-Ladis 2.293.131 5 1.532.264 3 760.867 9 Erste Ferienregion im Zillertal 2.286.146 6 1.348.923 5 937.223 5 Olympiaregion Seefeld 1.916.627 7 944.950 11 971.677 4 Osttirol 1.881.470 8 855.071 14 1.026.399 3 Wilder Kaiser 1.799.276 9 1.003.440 9 795.836 8 Stubai Tirol 1.749.156 10 1.084.349 8 664.807 10 Kitzbüheler Alpen - Brixental 1.552.023 11 952.027 10 599.996 13 Tiroler Oberland 1.483.911 12 864.256 13 619.655 12 Achensee 1.478.740 13 578.602 19 900.138 6 St. Anton am Arlberg 1.453.594 14 1.240.686 7 212.908 31 Tiroler Zugspitz Arena 1.434.979 15 786.097 16 648.882 11
FACTS AND FIGURES 2013 18
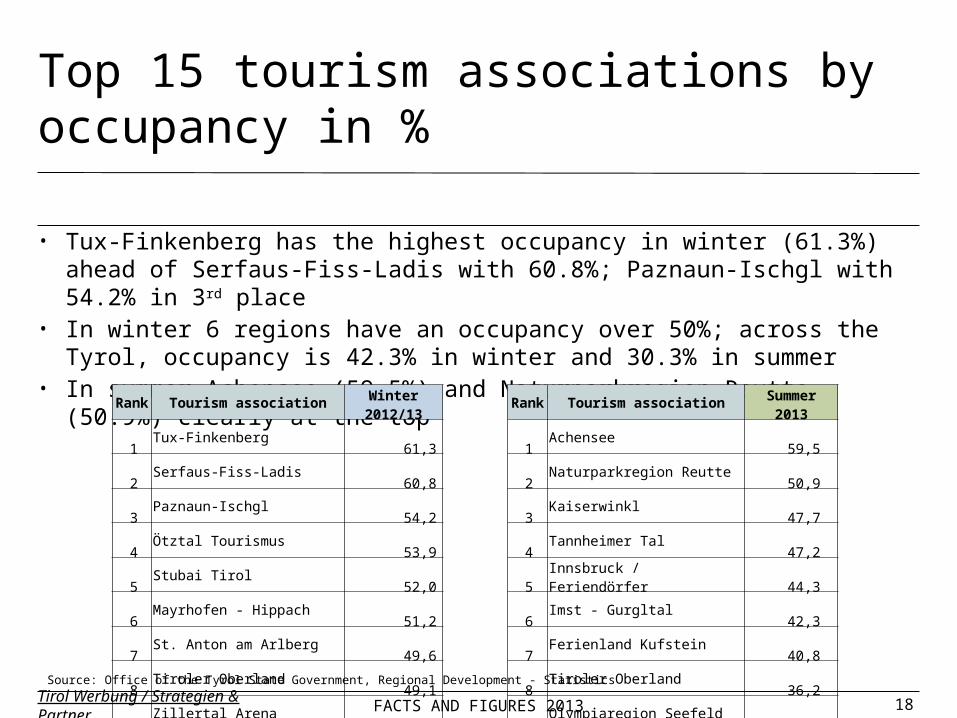
Top 15 tourism associations by occupancy in %
Tirol Werbung / Strategien & Partner
• Tux-Finkenberg has the highest occupancy in winter (61.3%) ahead of Serfaus-Fiss-Ladis with 60.8%; Paznaun-Ischgl with 54.2% in 3rd place
• In winter 6 regions have an occupancy over 50%; across the Tyrol, occupancy is 42.3% in winter and 30.3% in summer
• In summer Achensee (59.5%) and Naturparkregion Reutte (50.9%) clearly at the top
Source: Office of the Tyrol State Government, Regional Development - Statistics
Rank
Tourism associationWinter
2012/13 1
Tux-Finkenberg 61,3
2
Serfaus-Fiss-Ladis 60,8
3
Paznaun-Ischgl 54,2
4
Ötztal Tourismus 53,9
5
Stubai Tirol 52,0
6
Mayrhofen - Hippach 51,2
7
St. Anton am Arlberg 49,6
8
Tiroler Oberland 49,1
9
Zillertal Arena 48,1
10 Wilder Kaiser 43,1
11 Pitztal 42,7
12 Innsbruck / Feriendörfer 41,8
13 Tiroler Zugspitz Arena 41,8
14 Erste Ferienregion im Zillertal
41,7
15 Tannheimer Tal 41,3
Rank
Tourism associationSummer
2013 1
Achensee 59,5
2
Naturparkregion Reutte 50,9
3
Kaiserwinkl 47,7
4
Tannheimer Tal 47,2
5
Innsbruck / Feriendörfer 44,3
6
Imst - Gurgltal 42,3
7
Ferienland Kufstein 40,8
8
Tiroler Oberland 36,2
9
Olympiaregion Seefeld 35,8
10 Tiroler Zugspitz Arena 35,0
11 Silberregion Karwendel 34,8
12 Alpbachtal & Tiroler Seenland
34,4
13 Region Hall - Wattens 34,2
14 Tirol West 33,7
15 Wilder Kaiser 33,7

FACTS AND FIGURES 2013 19
Top 15 municipalities with most overnight stays
Tirol Werbung / Strategien & Partner
• Sölden clearly on top (winter rank 1, summer rank 6)• Mayrhofen in second place (winter rank 4, summer rank 3) shortly
ahead of Innsbruck (winter rank 8, summer rank 1) and Ischgl (winter rank 2, summer only rank 49!)
• Also in the summer and winter top 10: Neustift/Stubaital and Serfaus
Source: Office of the Tyrol State Government, Regional Development - Statistics
Municipalities TY 2012/13 Rank Winter 2012/13 Rank Summer 2013 RankSölden 2.309.308 1 1.883.135 1 426.173 6 Mayrhofen 1.529.850 2 923.819 4 606.031 3 Innsbruck 1.445.266 3 633.126 8 812.140 1 Ischgl 1.426.966 4 1.314.682 2 112.284 49 Neustift/Stubaital 1.208.939 5 768.087 5 440.852 5 St.Anton/Arlberg 1.139.670 6 1.016.018 3 123.652 43 Serfaus 1.134.854 7 753.127 6 381.727 7 Seefeld/Tirol 1.092.440 8 525.744 10 566.696 4 Eben/Achensee 1.024.743 9 391.623 17 633.120 2 Tux 939.013 10 640.320 7 298.693 12 Fiss 879.396 11 589.185 9 290.211 13 Kirchberg/Tirol 856.584 12 486.935 11 369.649 8 Kitzbühel 777.094 13 442.469 12 334.625 9 Wildschönau 715.812 14 416.575 13 299.237 11 Ellmau 689.066 15 369.200 18 319.866 10
FACTS AND FIGURES 2013 20Tirol Werbung / Strategien & Partner
Tyrol accommodation
FACTS AND FIGURES 2013 21
Hotels Holiday apartments
Private lodg-ings
Others 0
2,000,000
4,000,000
6,000,000
8,000,000
10,000,000
12,000,000
14,000,000
16,000,000
18,000,000
Winter 12/13 Summer 2013
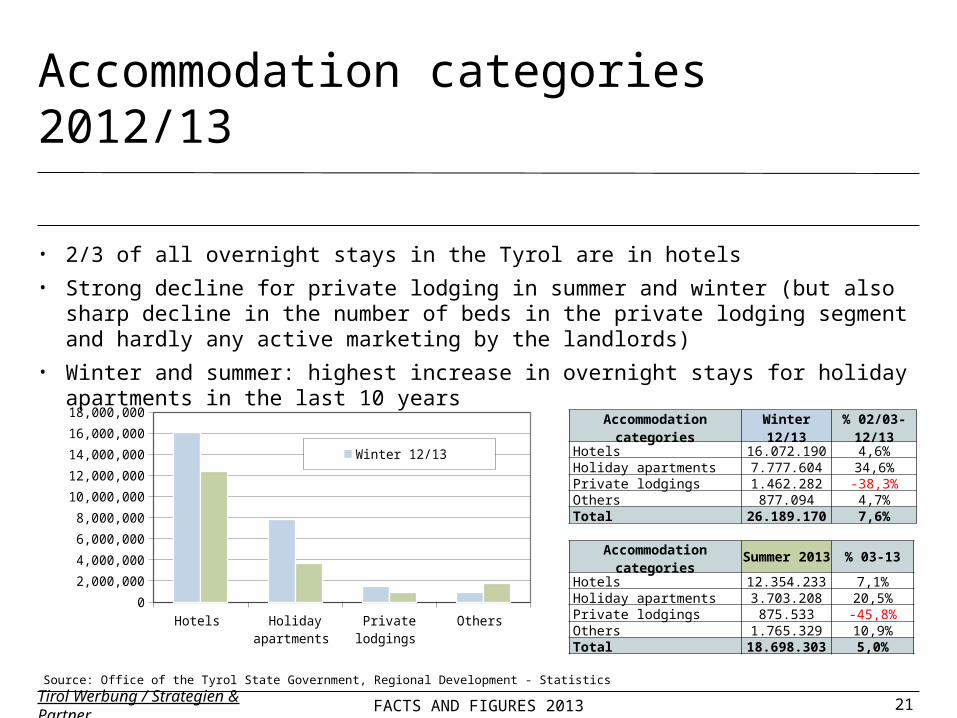
Accommodation categories 2012/13
Tirol Werbung / Strategien & Partner
• 2/3 of all overnight stays in the Tyrol are in hotels• Strong decline for private lodging in summer and winter (but also sharp decline
in the number of beds in the private lodging segment and hardly any active marketing by the landlords)
• Winter and summer: highest increase in overnight stays for holiday apartments in the last 10 years
Source: Office of the Tyrol State Government, Regional Development - Statistics
Accommodation categories
Summer 2013 % 03-13
Hotels 12.354.233 7,1%Holiday apartments 3.703.208 20,5%Private lodgings 875.533 -45,8%Others 1.765.329 10,9%Total 18.698.303 5,0%
Accommodation categories
Winter 12/13
% 02/03-12/13
Hotels 16.072.190 4,6%Holiday apartments 7.777.604 34,6%Private lodgings 1.462.282 -38,3%Others 877.094 4,7%Total 26.189.170 7,6%
FACTS AND FIGURES 2013 22
Number of beds
Tirol Werbung / Strategien & Partner
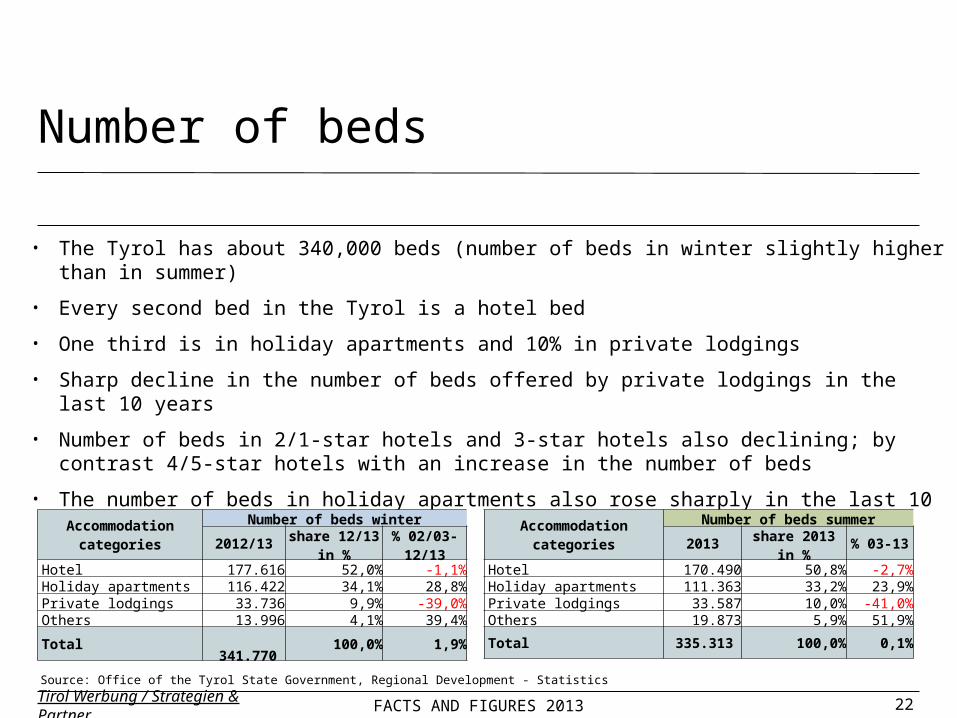
• The Tyrol has about 340,000 beds (number of beds in winter slightly higher than in summer)
• Every second bed in the Tyrol is a hotel bed
• One third is in holiday apartments and 10% in private lodgings
• Sharp decline in the number of beds offered by private lodgings in the last 10 years
• Number of beds in 2/1-star hotels and 3-star hotels also declining; by contrast 4/5-star hotels with an increase in the number of beds
• The number of beds in holiday apartments also rose sharply in the last 10 years
Source: Office of the Tyrol State Government, Regional Development - Statistics
Accommodation categories
Number of beds winter
2012/13share 12/13
in %% 02/03-
12/13Hotel 177.616 52,0% -1,1%Holiday apartments 116.422 34,1% 28,8%Private lodgings 33.736 9,9% -39,0%Others 13.996 4,1% 39,4%
Total 341.770 100,0% 1,9%
Accommodation categories
Number of beds summer
2013share 2013
in %% 03-13
Hotel 170.490 50,8% -2,7%Holiday apartments 111.363 33,2% 23,9%Private lodgings 33.587 10,0% -41,0%Others 19.873 5,9% 51,9%
Total 335.313 100,0% 0,1%
FACTS AND FIGURES 2013 23
Hotel Holiday apartments
Private lodg-ings
Others 0.0%
10.0%
20.0%
30.0%
40.0%
50.0%
60.0%
70.0%61.4%
29.7%
5.6% 3.3%
52.0%
34.1%
9.9%4.1%
Overnight stays
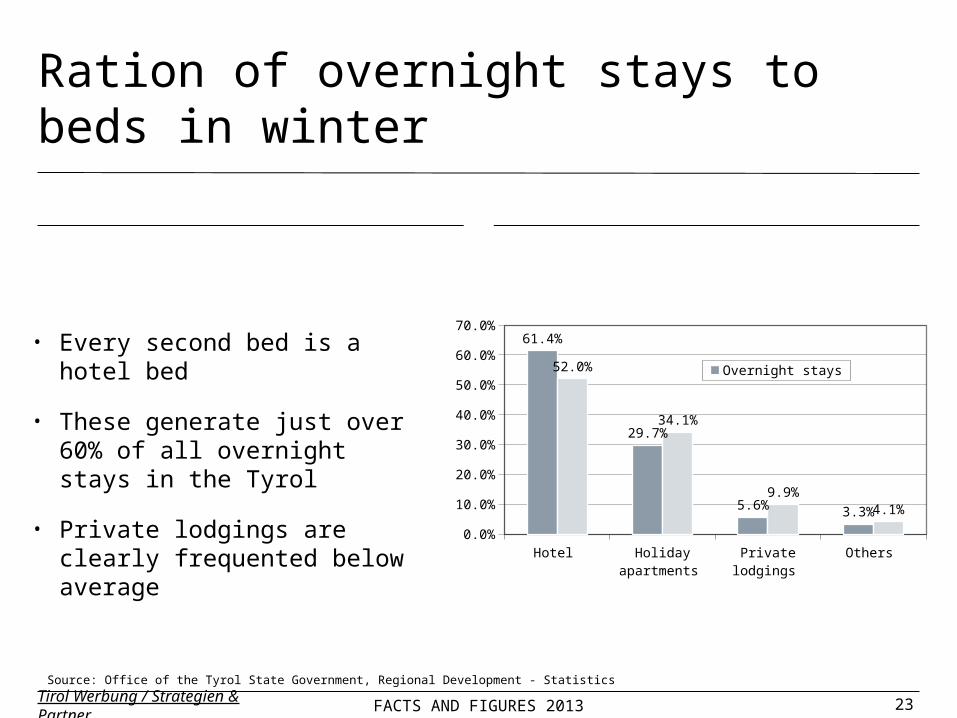
Ration of overnight stays to beds in winter
Tirol Werbung / Strategien & Partner
• Every second bed is a hotel bed
• These generate just over 60% of all overnight stays in the Tyrol
• Private lodgings are clearly frequented below average
Source: Office of the Tyrol State Government, Regional Development - Statistics
FACTS AND FIGURES 2013 24
Hotel Holiday apartments
Private lodg-ings
Others 0.0%
10.0%
20.0%
30.0%
40.0%
50.0%
60.0%
70.0% 66.1%
19.8%
4.7%9.4%
50.8%
33.2%
10.0%5.9%
Overnight stays
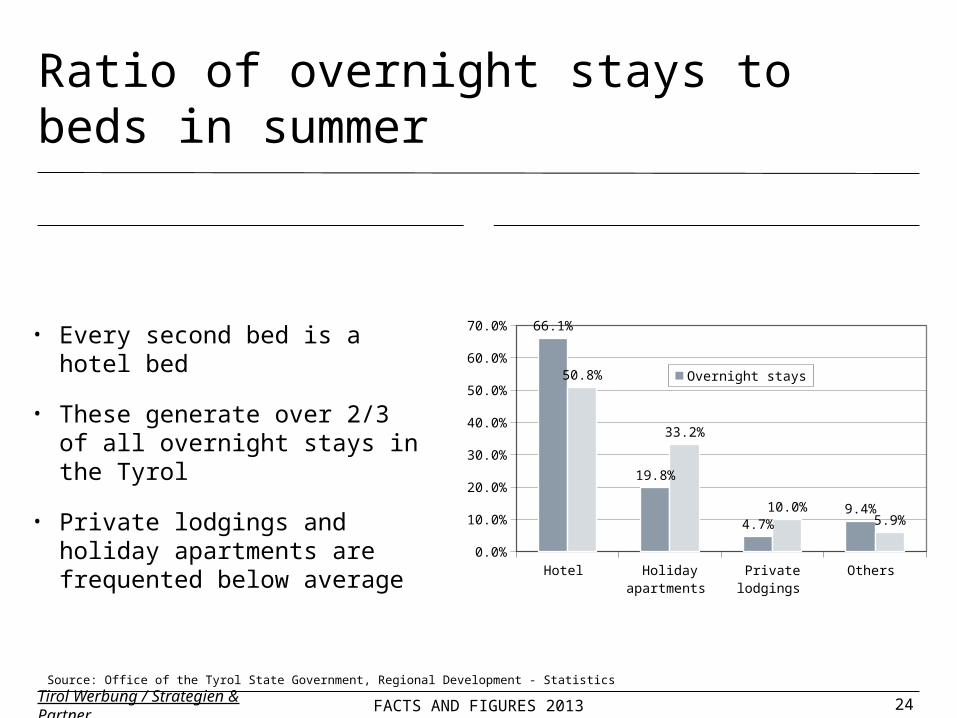
Ratio of overnight stays to beds in summer
Tirol Werbung / Strategien & Partner
• Every second bed is a hotel bed
• These generate over 2/3 of all overnight stays in the Tyrol
• Private lodgings and holiday apartments are frequented below average
Source: Office of the Tyrol State Government, Regional Development - Statistics
FACTS AND FIGURES 2013 25
4-5* Hotel 3* Hotel 2/1* Hotel Com. hol. apart.
Private hol. apart.
Private hol. apart. (farms)
Private lodg-ings
Private lodg-ings (farms)
0
10
20
30
40
50
60
70
58.2
47.6
37.544
34.829.6
25.220.5
49.3
37.1
23.7 21.116.1
21.113.9 14.8
Winter 2012/13 Summer 2013
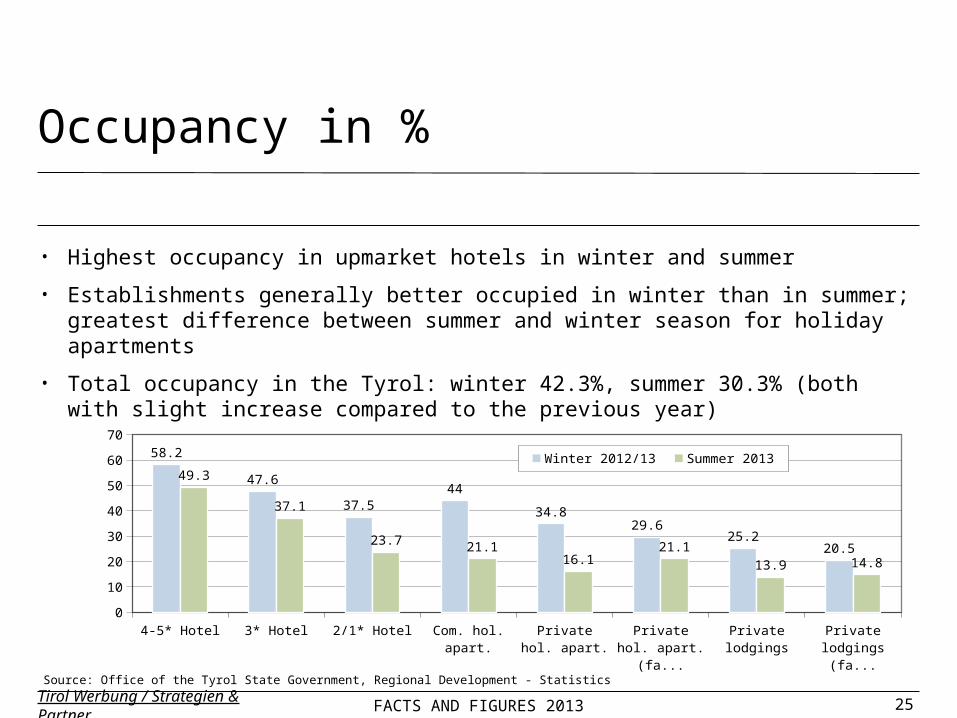
Occupancy in %
Tirol Werbung / Strategien & Partner
• Highest occupancy in upmarket hotels in winter and summer
• Establishments generally better occupied in winter than in summer; greatest difference between summer and winter season for holiday apartments
• Total occupancy in the Tyrol: winter 42.3%, summer 30.3% (both with slight increase compared to the previous year)
Source: Office of the Tyrol State Government, Regional Development - Statistics
FACTS AND FIGURES 2013 26
4-5* Hotel 3* Hotel 2/1* Hotel Com. hol. apart.
Private hol. apart.
Private hol. apart.
(farms)
Private lodg-ings
Private lodg-ings (farms)
0
20
40
60
80
100
120105
86
68
80
6354
4637
91
68
4439
3039
26 27
Winter 2012/13 Summer 2013
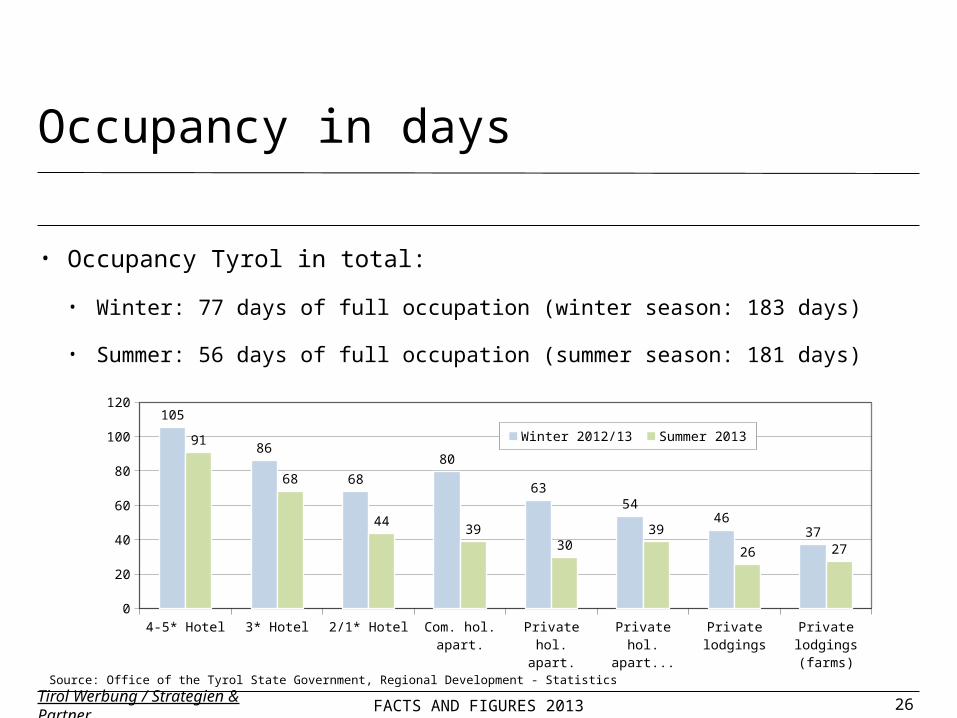
Occupancy in days
Tirol Werbung / Strategien & Partner
• Occupancy Tyrol in total:
• Winter: 77 days of full occupation (winter season: 183 days)
• Summer: 56 days of full occupation (summer season: 181 days)
Source: Office of the Tyrol State Government, Regional Development - Statistics
FACTS AND FIGURES 2013 27Tirol Werbung / Strategien & Partner
Economic importance of tourism in the Tyrol
FACTS AND FIGURES 2013 28
Employment
Tirol Werbung / Strategien & Partner
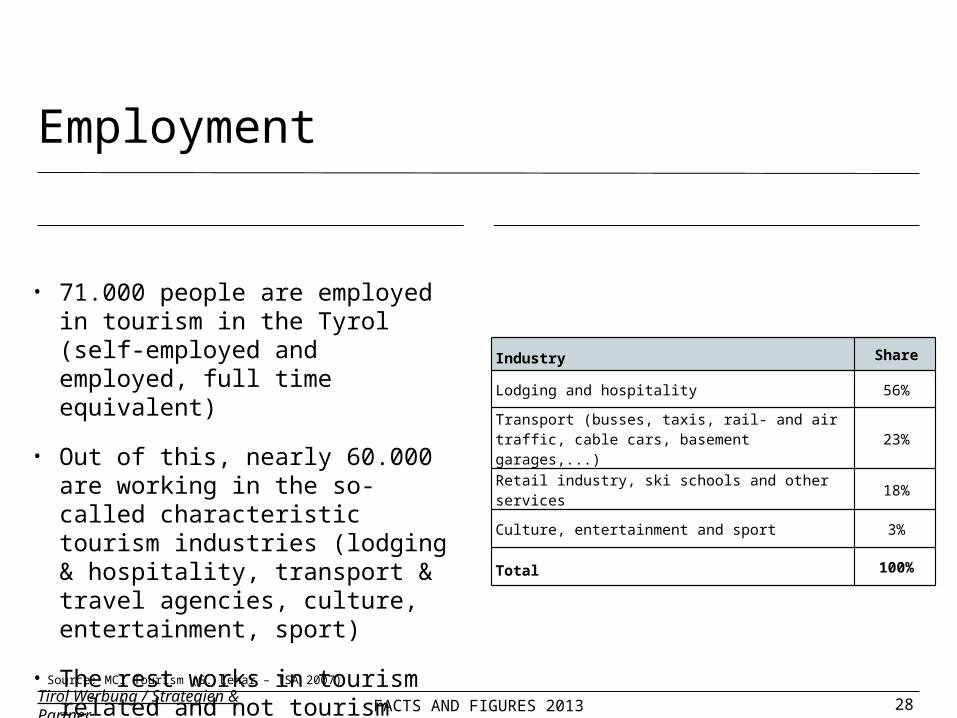
Industry Share
Lodging and hospitality 56%
Transport (busses, taxis, rail- and air traffic, cable cars, basement garages,...)
23%
Retail industry, ski schools and other services 18%
Culture, entertainment and sport 3%
Total 100%
• 71.000 people are employed in tourism in the Tyrol (self-employed and employed, full time equivalent)
• Out of this, nearly 60.000 are working in the so-called characteristic tourism industries (lodging & hospitality, transport & travel agencies, culture, entertainment, sport)
• The rest works in tourism related and not tourism specific industries (retail industry, banking industry,...)
Source: MCI Tourism (G. Lehar – TSA 2007)
FACTS AND FIGURES 2013 29
Expenditure and turnover
Tirol Werbung / Strategien & Partner
• Daily expenditure of guests (incl. arrivals) higher in winter than in summer:winter € 123,- and summer € 97,-
• Of which approx. 50% for accommodation
• Approx. 15% for food
• Purchases slightly higher in summer (7%) than in winter (6%)
• Expenditure for cable cars, public transport much higher in winter (16% in winter vs. 5% in summer)
• Expenditure for entertainment, leisure, culture and wellness summer and winter 5%
• Tourism in the Tyrol generates € 7.3 billion turnover
• € 5.6 bn for overnight tourism
• € 1.6 bn from day visitors
Source: T-Mona Summer 2011 and Winter 2011/12, Tourismus-Satellitenkonto Tirol 2007
FACTS AND FIGURES 2013 30Tirol Werbung / Strategien & Partner
• Tourism value creation for the Tyrol is approximately € 4 bn
• Average share of tourism in GDP of the Tyrol is 18%
• This figure is far higher in tourism centres
• For Austria, the share is 5.8%
• By comparison: Upper Austria 3.1% and Vienna 1.6%
Value creation
Source: Tourismus-Satellitenkonto Tyrol rev. 2008, Tourismus-Satellitenkonto Austria 2012, Upper Austria 2011 and Vienna 2008
Bild durch Klicken auf Symbol hinzufügen
FACTS AND FIGURES 2013 31Tirol Werbung / Strategien & Partner
Reasons for visiting the Tyrol
FACTS AND FIGURES 2013 32
Winter in the Tyrol
Tirol Werbung / Strategien & Partner
Holiday activities• Sport: skiing is THE sport activity,
snowboarding occupies a niche (every second skies as well); snowboarding and tobogganing especially popular with the younger guests; winter hiking and cross-country skiing are especially popular with the older target group
• Dining as an important holiday component, regional food and drinks are more important in summer than in winter
• Strong focus on nightlife
Reasons for visiting the Tyrol• Beautiful landscape/mountains
• The Tyrol has high competence in winter sports: attractive ski areas, guaranteed snow
• Nature and tranquillity
• Top accommodation
• Good experiences in the past
• Friendly locals, great hospitality
• Great accessibility
Source: T-Mona Winter 2011/12
FACTS AND FIGURES 2013 33
Summer in the Tyrol
Tirol Werbung / Strategien & Partner
Holiday activities• A lot of different sport activities
• Sport: hiking is by far THE sports activity (importance increases with age); water activities attract many in summer; climbing, mountain biking and adventure sports are gaining importance for younger guests
• Beside sports also culture, enjoyment and relaxation are important (importance increases with age)
• Walking in the nature, visiting sights, trips outside the holiday resort, enjoying regional food and beverages
Reasons for visiting the Tyrol• Beautiful landscape/mountains
• Fresh air, peace and quiet
• Hospitality
• Sport opportunities, great variety of hiking trails, bicycle- and mountain bike tracks
• Quality of accommodation
• Good experiences in the past
Source: T-Mona Summer 2011
FACTS AND FIGURES 2013 34
Ändern Sie die Farbe des Platzhalters nach Bedarf
Tirol Werbung / Strategien & Partner
Strategien & PartnerMag. Kathrin Rauch
Maria-Theresien-Straße 55 6020 Innsbruck · Österreich
+43.512.5320-236+43.512.5320-92236
Tirol Werbung GmbH
tfew
Related Documents