For more information: Facts & Figures section at www.unwto.org

Tourism Highlights 2009
Mar 28, 2016
Facts of global and regional tourism in 2008.
Welcome message from author
This document is posted to help you gain knowledge. Please leave a comment to let me know what you think about it! Share it to your friends and learn new things together.
Transcript
For more information:
Facts & Figures section at www.unwto.org

Tourism Highlights is a publication of the World Tourism Organization (UN WT O), released on the occasion of World Tourism Day,celebrated annually on 27 September. In 2009 , the 30th World Tourism Day will be commemorated in Ghana under the theme‘Tourism – Celebrating Diversity’.
Tourism Highlights aims to provide a consolidated set of key figures and trends for international tourism in the year prior to its dateof publication. For information on current short-term tourism data and trends, please refer to the UN WT O World Tourism Barometerat www.unwto.org / facts/ eng /barometer.htm.
The World Tourism Organization (UN WT O) is a specialized agency of the United Nations and the leading international organizationin the field of tourism. It serves as a global forum for tourism policy issues and a practical source of tourism know-how. Its member-ship includes 160 countries and territories and more than 390 Affiliate Members representing local governments, tourism associationsand private sector companies including airlines, hotel groups and tour operators.
– 2–
Tourism – a key to development, prosperity and well-beingO ver time, an increasing number of destinations have opened up and invested in tourism development,turning modern tourism into a key driver for socio-economic progress, through the creation of jobs andenterprises, infrastructure development, and the export income earned.
Tourism has become one of the major international trade categories. The overall export income generated byinternational tourism including passengers transport reached US$ 1.1 trillion in 2008, or US$ 3 billion a day.Tourism exports account for as much as 30% of the world’s exports of commercial services and 6% of overallexports of goods and services. Globally, as an export category, tourism ranks fourth after fuels, chemicals andautomotive products. For many developing countries it is one of the main income sources and the number oneexport category, creating much needed employment and opportunities for development.
The most comprehensive way to measure the economic importance of both international and domestic tourismin national economies is through the Tourism Satellite Account (TSA) Recommended MethodologicalFramework, approved by the UN Statistics Commission. Though many countries are in the process ofimplementing the Framework, relatively few have full, comparable results available. As data is currently stillfragmented, it is not feasible to provide precise and detailed worldwide results. However, the knowledge andexperience gained through the TSA exercise has certainly contributed to a much better understanding of therole of tourism in economies worldwide and allows for a tentative approximation of key indicators. Based onthe information from countries with data available, the worldwide contribution of tourism to gross domesticproduct (GDP) is estimated at some 5% . Tourism’s contribution to employment tends to be slightly higher andis estimated in the order of 6-7% of the overall number of jobs (direct and indirect). For advanced, diversifiedeconomies, the contribution of tourism to the GDP ranges from approximately 2% for countries where tourismis a comparatively small sector, to over 10% for countries where tourism is an important pillar of the economy.For small islands and developing countries, or specific regional and local destinations where tourism is a keyeconomic sector, the importance of tourism tends to be even higher.
Key trends 2008:! International tourist arrivals reached 922 million in 2008, up 18 million over 2007, representing a growth of 2% .! International tourism receipts rose by 1.7% in real terms to US$ 944 billion (642 billion euros).! Following four years of consecutive strong growth, an abrupt shift in trend occurred in the middle of the year, with tourism
demand falling significantly under the influence of an extremely volatile world economy (financial crisis, commodity and oil pricerises and sharp exchange rate fluctuations).
Current developments and short-term outlook:! According to the June 2009 UN WT O World Tourism Barometer, the decline in tourism demand continued to intensify in the first
four months of 2009, sliding to -8% when compared to the same period in the previous year.! The 2009 outlook is much dependent on the global economic performance and the evolution of the influenza A(H1N1) outbreak.
Taking into account the results for the first four months of 2009 and current market conditions, the pace of decline is expectedto ease during the remainder of the year and international tourist arrivals are projected to decrease by between -6% and -4% in2009.
! As part of its response activity, UN WT O has created a Tourism Resilience Committee and a web resource (www.unwto.org / trc).
Long-term trend:! International tourist arrivals have continued to grow – from 25 million in 1950, to 277 million in 1980, to 438 million in 1990, to
684 million in 2000, and reaching 922 million in 2008.! O ver the past six decades, tourism has experienced continued growth and diversification to become one of the largest and fastest
growing economic sectors in the world. Many new destinations have emerged alongside the traditional ones of Western Europeand North America. As growth has been particularly high in the world’s emerging regions, the share in international tourist arrivalsreceived by developing countries has steadily risen, from 31% in 1990 to 45% in 2008.
! By 2020 international arrivals are expected to reach 1.6 billion.
OverviewInternationalTourism,2008
2008 – International tourism challenged by deteriorating world economy
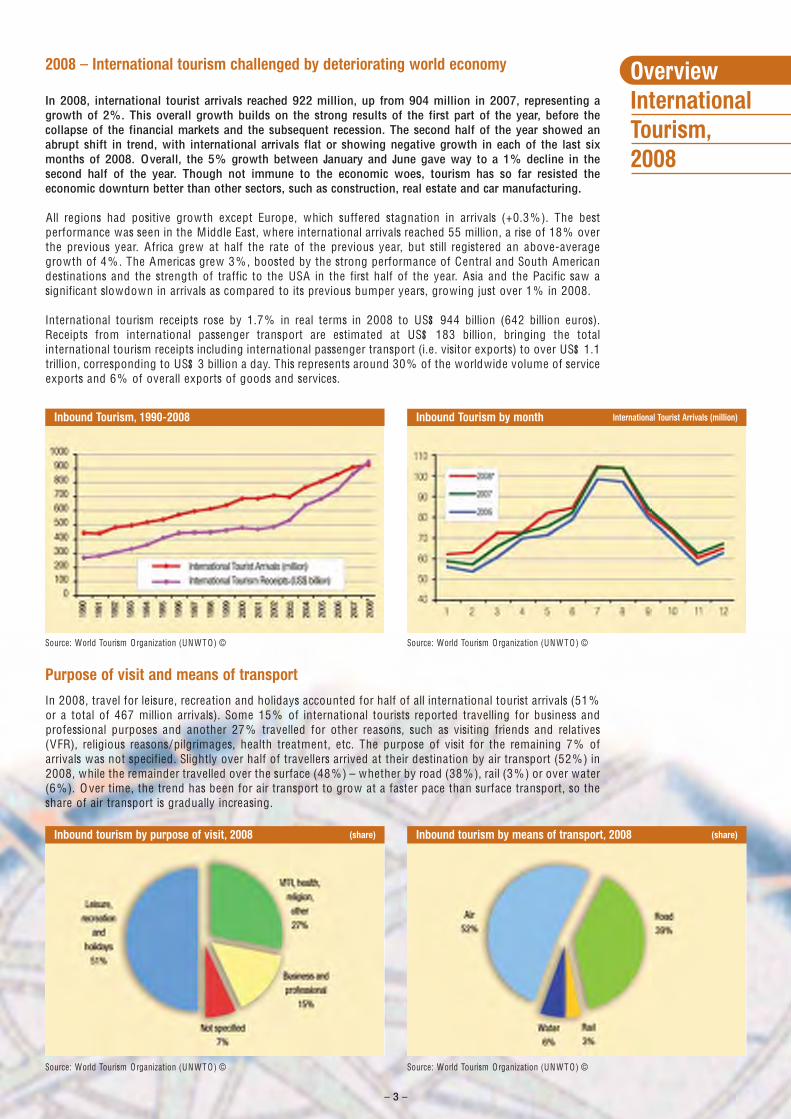
In 2008, international tourist arrivals reached 922 million, up from 904 million in 2007, representing agrowth of 2% . This overall growth builds on the strong results of the first part of the year, before thecollapse of the financial markets and the subsequent recession. The second half of the year showed anabrupt shift in trend, with international arrivals flat or showing negative growth in each of the last sixmonths of 2008. Overall, the 5% growth between January and June gave way to a 1% decline in thesecond half of the year. Though not immune to the economic woes, tourism has so far resisted theeconomic downturn better than other sectors, such as construction, real estate and car manufacturing.
All regions had positive growth except Europe, which suffered stagnation in arrivals (+0.3%). The bestperformance was seen in the Middle East, where international arrivals reached 55 million, a rise of 18% overthe previous year. Africa grew at half the rate of the previous year, but still registered an above-averagegrowth of 4% . The Americas grew 3% , boosted by the strong performance of Central and South Americandestinations and the strength of traffic to the USA in the first half of the year. Asia and the Pacific saw asignificant slowdown in arrivals as compared to its previous bumper years, growing just over 1% in 2008.
International tourism receipts rose by 1.7% in real terms in 2008 to US$ 944 billion (642 billion euros).Receipts from international passenger transport are estimated at US$ 183 billion, bringing the totalinternational tourism receipts including international passenger transport (i.e. visitor exports) to over US$ 1.1trillion, corresponding to US$ 3 billion a day. This represents around 30% of the worldwide volume of serviceexports and 6% of overall exports of goods and services.
Purpose of visit and means of transportIn 2008, travel for leisure, recreation and holidays accounted for half of all international tourist arrivals (51%or a total of 467 million arrivals). Some 15% of international tourists reported travelling for business andprofessional purposes and another 27% travelled for other reasons, such as visiting friends and relatives(VFR), religious reasons/pilgrimages, health treatment, etc. The purpose of visit for the remaining 7% ofarrivals was not specified. Slightly over half of travellers arrived at their destination by air transport (52%) in2008, while the remainder travelled over the surface (48%) – whether by road (38%), rail (3%) or over water(6%). O ver time, the trend has been for air transport to grow at a faster pace than surface transport, so theshare of air transport is gradually increasing.
Source: World Tourism Organization (UN WT O) © Source: World Tourism Organization (UN WT O) ©
Inbound Tourism, 1990-2008 Inbound Tourism by month International Tourist Arrivals (million)
Source: World Tourism Organization (UN WT O) © Source: World Tourism Organization (UN WT O) ©
Inbound tourism by purpose of visit, 2008 (share) Inbound tourism by means of transport, 2008 (share)
– 3 –

Growth in receipts mirrors that of arrivals Visitor expenditure on accommodation, food and drink, local transport, entertainment, shopping, is animportant pillar of the economies of many destinations, creating much needed employment andopportunities for development. More than 80 countries earned over US$ 1 billion from international tourismin 2008.
UN WT O estimates that worldwide receipts from international tourism reached US$ 944 billion (642 billioneuros) in 2008. In absolute terms, international tourism receipts increased by US$ 87 billion, but only by 16billion euros due to the depreciation of the US dollar against several world currencies and, in particular, theeuro (in 2008 the US dollar lost 7% against the euro).
In real terms, i.e. adjusted for exchange rate fluctuations and inflation, growth in international tourismreceipts corresponded to 1.7% , only slightly lower than the growth in international tourist arrivals. After thesubstantial growth in 2006 and 2007 – of over 5% in both years – this represents a considerable slowdown.
All regions shared in the increase in tourism receipts in absolute values. In real terms growth was in all regionsmuch weaker in 2008 than the year before with the exception of the Middle East, which registered a double-digit growth of 17% . Asia and the Pacific grew by 2.7% (compared to +9.8% in 2007) and the Americasincreased by 5.0% , slightly less than 2007’s 6.3% . Both Europe and Africa (-1% each), however, sufferednegative growth in receipts in real terms.
By subregion, the strongest increases came from North America (+7%) and South Asia (+6%). In Northern,Western and Southem/ Mediterranean Europe, North Africa, the Caribbean and Central America, receiptsdeclined in real terms in 2008. In the case of North Africa and Central America, the decline followed twoyears of very strong growth.
International
Tourism
Receipts
by (Sub) region
International Tourist Arrivals Market Change Average annual(million) share (%) (%) growth (%)
1990 1995 2000 2005 2006 2007 2008* 2008* 07/06 08*/07 '00-'08*
World 438 534 684 804 853 904 922 100 6.1 2.0 3.8
Europe 265.0 309.5 392.6 441.8 468.4 487.9 489.4 53.1 4.1 0.3 2.8Northern Europe 28.6 35.8 43.7 52.8 56.5 58.1 57.0 6.2 2.8 -1.9 3.4Western Europe 108.6 112.2 139.7 142.6 149.6 154.9 153.3 16.6 3.6 -1.1 1.2Central/Eastern Europe 33.9 58.1 69.3 87.5 91.4 96.6 99.6 10.8 5.6 3.1 4.6Southern / Mediter. Eu. 93.9 103.4 139.9 158.9 170.9 178.2 179.6 19.5 4.3 0.8 3.2
Asia and the Pacific 55.8 82.0 110.1 153.6 166.0 182.0 184.1 20.0 9.6 1.2 6.6North-East Asia 26.4 41.3 58.3 86.0 92.0 101.0 101.0 10.9 9.8 -0.1 7.1South-East Asia 21.2 28.4 36.1 48.5 53.1 59.7 61.7 6.7 12.3 3.5 6.9Oceania 5.2 8.1 9.6 11.0 11.0 11.2 11.1 1.2 1.7 -0.9 1.8South Asia 3.2 4.2 6.1 8.1 9.8 10.1 10.3 1.1 2.6 2.1 6.8
Americas 92.8 109.0 128.2 133.3 135.8 142.9 147.0 15.9 5.2 2.9 1.7North America 71.7 80.7 91.5 89.9 90.6 95.3 97.8 10.6 5.2 2.6 0.8Caribbean 11.4 14.0 17.1 18.8 19.4 19.8 20.2 2.2 1.6 2.0 2.1Central America 1.9 2.6 4.3 6.3 6.9 7.8 8.3 0.9 12.0 7.0 8.4South America 7.7 11.7 15.3 18.3 18.8 20.1 20.8 2.3 6.5 3.6 3.9
Africa 15.1 20.0 27.9 37.3 41.5 45.0 46.7 5.1 8.4 3.7 6.7North Africa 8.4 7.3 10.2 13.9 15.1 16.3 17.2 1.9 8.5 4.9 6.7Subsaharan Africa 6.7 12.7 17.6 23.4 26.5 28.7 29.5 3.2 8.3 3.1 6.7
M iddle East 9.6 13.7 24.9 37.9 40.9 46.6 55.1 6.0 14.0 18.1 10.5Source: World Tourism Organization (UN WT O) © (Data as collected by UN WT O , 2009)
International Tourism Receipts Change Change(billion) current prices (%) constant prices (%)
1990 1995 2000 2005 2006 2007 2008* 06/05 07/06 08*/07 05/04 06/05 07/06 08*/07Local currencies 8.8 8.9 6.8 3.1 5.3 5.4 1.7
US$ 264 405 475 680 745 857 944 9.5 15.1 10.1 3.9 6.0 11.9 6.1Euro 207 310 515 547 593 626 642 8.5 5.5 2.6 5.1 6.1 3.3 -0.6
International
Tourist
Arrivals
by (Sub) region
– 4 –
World’s Top
Tourism
Destinations
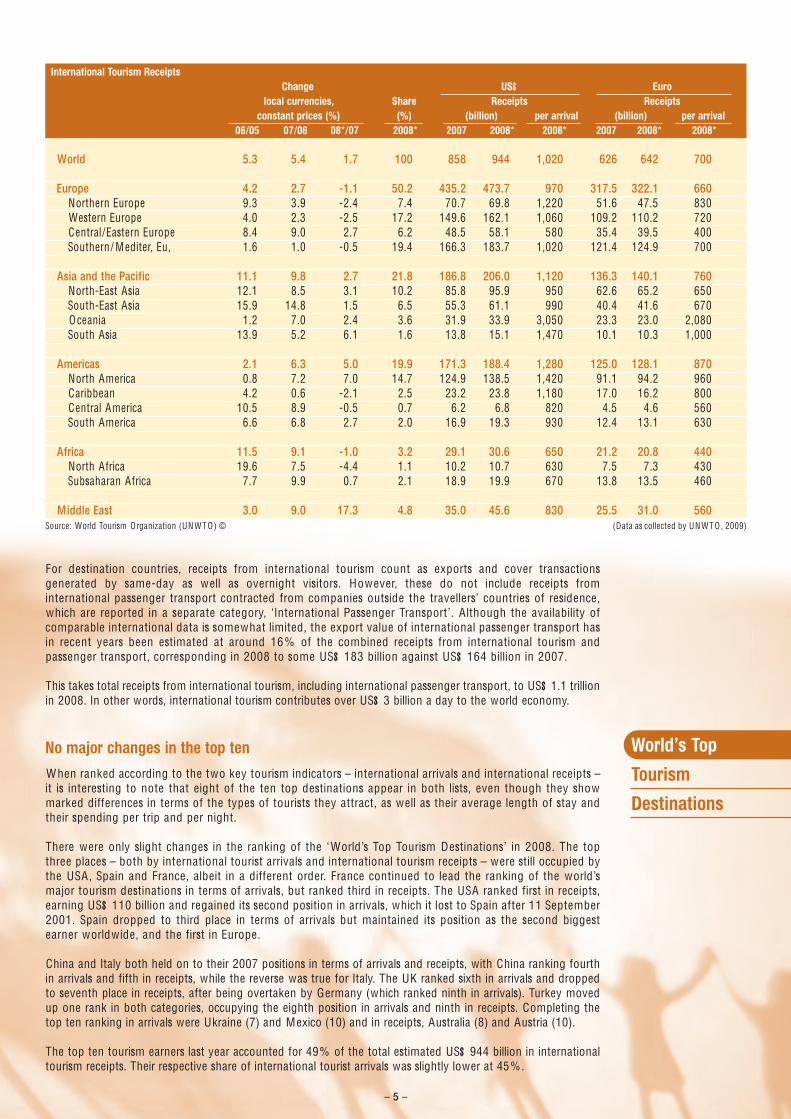
For destination countries, receipts from international tourism count as exports and cover transactionsgenerated by same-day as well as overnight visitors. However, these do not include receipts frominternational passenger transport contracted from companies outside the travellers’ countries of residence,which are reported in a separate category, ‘International Passenger Transport’. Although the availability ofcomparable international data is somewhat limited, the export value of international passenger transport hasin recent years been estimated at around 16% of the combined receipts from international tourism andpassenger transport, corresponding in 2008 to some US$ 183 billion against US$ 164 billion in 2007.
This takes total receipts from international tourism, including international passenger transport, to US$ 1.1 trillionin 2008. In other words, international tourism contributes over US$ 3 billion a day to the world economy.
No major changes in the top ten When ranked according to the two key tourism indicators – international arrivals and international receipts –it is interesting to note that eight of the ten top destinations appear in both lists, even though they showmarked differences in terms of the types of tourists they attract, as well as their average length of stay andtheir spending per trip and per night.
There were only slight changes in the ranking of the ‘World’s Top Tourism Destinations’ in 2008. The topthree places – both by international tourist arrivals and international tourism receipts – were still occupied bythe USA , Spain and France, albeit in a different order. France continued to lead the ranking of the world’smajor tourism destinations in terms of arrivals, but ranked third in receipts. The USA ranked first in receipts,earning US$ 110 billion and regained its second position in arrivals, which it lost to Spain after 11 September2001. Spain dropped to third place in terms of arrivals but maintained its position as the second biggestearner worldwide, and the first in Europe.
China and Italy both held on to their 2007 positions in terms of arrivals and receipts, with China ranking fourthin arrivals and fifth in receipts, while the reverse was true for Italy. The UK ranked sixth in arrivals and droppedto seventh place in receipts, after being overtaken by Germany (which ranked ninth in arrivals). Turkey movedup one rank in both categories, occupying the eighth position in arrivals and ninth in receipts. Completing thetop ten ranking in arrivals were Ukraine (7) and Mexico (10) and in receipts, Australia (8) and Austria (10).
The top ten tourism earners last year accounted for 49% of the total estimated US$ 944 billion in internationaltourism receipts. Their respective share of international tourist arrivals was slightly lower at 45% .
International Tourism ReceiptsChange US$ Euro
local currencies, Share Receipts Receiptsconstant prices (%) (%) (billion) per arrival (billion) per arrival
06/05 07/06 08*/07 2008* 2007 2008* 2008* 2007 2008* 2008*
World 5.3 5.4 1.7 100 858 944 1,020 626 642 700
Europe 4.2 2.7 -1.1 50.2 435.2 473.7 970 317.5 322.1 660Northern Europe 9.3 3.9 -2.4 7.4 70.7 69.8 1,220 51.6 47.5 830Western Europe 4.0 2.3 -2.5 17.2 149.6 162.1 1,060 109.2 110.2 720Central/Eastern Europe 8.4 9.0 2.7 6.2 48.5 58.1 580 35.4 39.5 400Southern / Mediter, Eu, 1.6 1.0 -0.5 19.4 166.3 183.7 1,020 121.4 124.9 700
Asia and the Pacific 11.1 9.8 2.7 21.8 186.8 206.0 1,120 136.3 140.1 760North-East Asia 12.1 8.5 3.1 10.2 85.8 95.9 950 62.6 65.2 650South-East Asia 15.9 14.8 1.5 6.5 55.3 61.1 990 40.4 41.6 670Oceania 1.2 7.0 2.4 3.6 31.9 33.9 3,050 23.3 23.0 2,080South Asia 13.9 5.2 6.1 1.6 13.8 15.1 1,470 10.1 10.3 1,000
Americas 2.1 6.3 5.0 19.9 171.3 188.4 1,280 125.0 128.1 870North America 0.8 7.2 7.0 14.7 124.9 138.5 1,420 91.1 94.2 960Caribbean 4.2 0.6 -2.1 2.5 23.2 23.8 1,180 17.0 16.2 800Central America 10.5 8.9 -0.5 0.7 6.2 6.8 820 4.5 4.6 560South America 6.6 6.8 2.7 2.0 16.9 19.3 930 12.4 13.1 630
Africa 11.5 9.1 -1.0 3.2 29.1 30.6 650 21.2 20.8 440North Africa 19.6 7.5 -4.4 1.1 10.2 10.7 630 7.5 7.3 430Subsaharan Africa 7.7 9.9 0.7 2.1 18.9 19.9 670 13.8 13.5 460
M iddle East 3.0 9.0 17.3 4.8 35.0 45.6 830 25.5 31.0 560Source: World Tourism Organization (UN WT O) © (Data as collected by UN WT O , 2009)
– 5 –
Regional
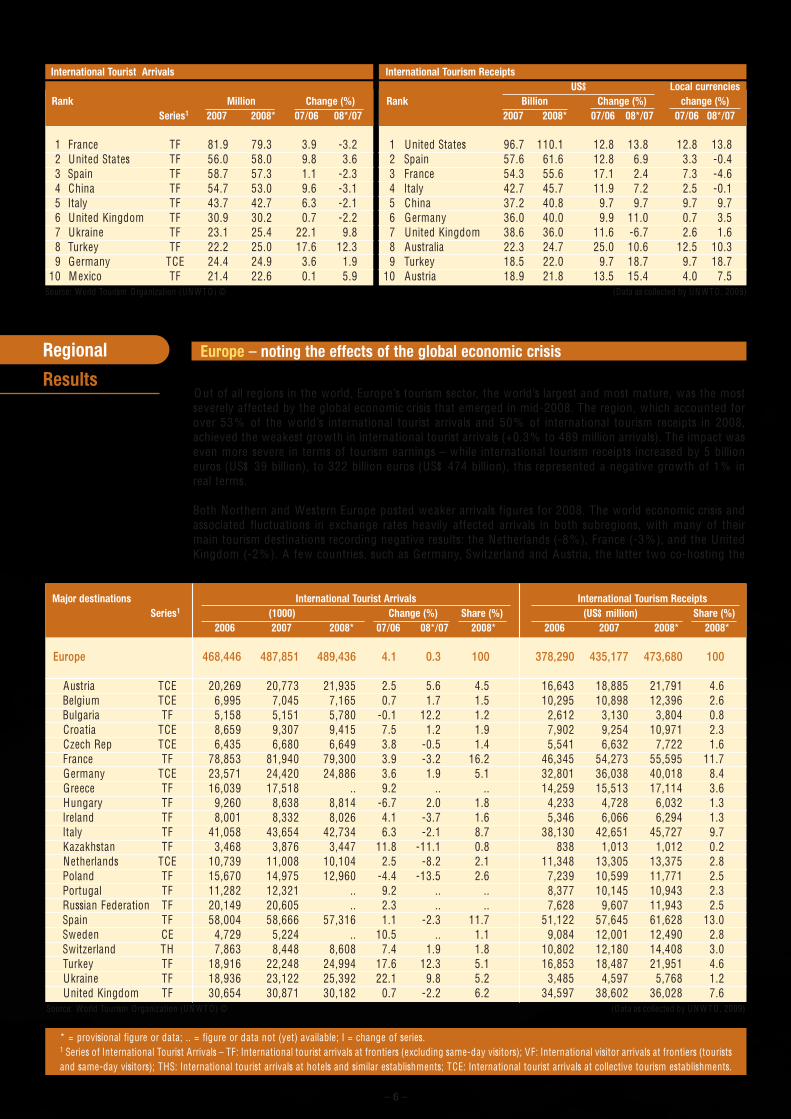
ResultsO ut of all regions in the world, Europe’s tourism sector, the world’s largest and most mature, was the mostseverely affected by the global economic crisis that emerged in mid-2008. The region, which accounted forover 53% of the world’s international tourist arrivals and 50% of international tourism receipts in 2008,achieved the weakest growth in international tourist arrivals (+0.3% to 489 million arrivals). The impact waseven more severe in terms of tourism earnings – while international tourism receipts increased by 5 billioneuros (US$ 39 billion), to 322 billion euros (US$ 474 billion), this represented a negative growth of 1% inreal terms.
Both Northern and Western Europe posted weaker arrivals figures for 2008. The world economic crisis andassociated fluctuations in exchange rates heavily affected arrivals in both subregions, with many of theirmain tourism destinations recording negative results: the Netherlands (-8%), France (-3%), and the UnitedKingdom (-2%). A few countries, such as Germany, Switzerland and Austria, the latter two co-hosting the
International Tourist Arrivals International Tourism ReceiptsUS$ Local currencies
Rank Million Change (%) Rank Billion Change (%) change (%)Series1 2007 2008* 07/06 08*/07 2007 2008* 07/06 08*/07 07/06 08*/07
1 France TF 81.9 79.3 3.9 -3.2 1 United States 96.7 110.1 12.8 13.8 12.8 13.82 United States TF 56.0 58.0 9.8 3.6 2 Spain 57.6 61.6 12.8 6.9 3.3 -0.43 Spain TF 58.7 57.3 1.1 -2.3 3 France 54.3 55.6 17.1 2.4 7.3 -4.64 China TF 54.7 53.0 9.6 -3.1 4 Italy 42.7 45.7 11.9 7.2 2.5 -0.15 Italy TF 43.7 42.7 6.3 -2.1 5 China 37.2 40.8 9.7 9.7 9.7 9.76 United Kingdom TF 30.9 30.2 0.7 -2.2 6 Germany 36.0 40.0 9.9 11.0 0.7 3.57 Ukraine TF 23.1 25.4 22.1 9.8 7 United Kingdom 38.6 36.0 11.6 -6.7 2.6 1.68 Turkey TF 22.2 25.0 17.6 12.3 8 Australia 22.3 24.7 25.0 10.6 12.5 10.39 Germany TCE 24.4 24.9 3.6 1.9 9 Turkey 18.5 22.0 9.7 18.7 9.7 18.7
10 Mexico TF 21.4 22.6 0.1 5.9 10 Austria 18.9 21.8 13.5 15.4 4.0 7.5Source: World Tourism Organization (UN WT O) © (Data as collected by UN WT O , 2009)
Europe – noting the effects of the global economic crisis
Major destinations International Tourist Arrivals International Tourism ReceiptsSeries1 (1000) Change (%) Share (%) (US$ million) Share (%)
2006 2007 2008* 07/06 08*/07 2008* 2006 2007 2008* 2008*
Europe 468,446 487,851 489,436 4.1 0.3 100 378,290 435,177 473,680 100
Austria TCE 20,269 20,773 21,935 2.5 5.6 4.5 16,643 18,885 21,791 4.6Belgium TCE 6,995 7,045 7,165 0.7 1.7 1.5 10,295 10,898 12,396 2.6Bulgaria TF 5,158 5,151 5,780 -0.1 12.2 1.2 2,612 3,130 3,804 0.8Croatia TCE 8,659 9,307 9,415 7.5 1.2 1.9 7,902 9,254 10,971 2.3Czech Rep TCE 6,435 6,680 6,649 3.8 -0.5 1.4 5,541 6,632 7,722 1.6France TF 78,853 81,940 79,300 3.9 -3.2 16.2 46,345 54,273 55,595 11.7Germany TCE 23,571 24,420 24,886 3.6 1.9 5.1 32,801 36,038 40,018 8.4Greece TF 16,039 17,518 .. 9.2 .. .. 14,259 15,513 17,114 3.6Hungary TF 9,260 8,638 8,814 -6.7 2.0 1.8 4,233 4,728 6,032 1.3Ireland TF 8,001 8,332 8,026 4.1 -3.7 1.6 5,346 6,066 6,294 1.3Italy TF 41,058 43,654 42,734 6.3 -2.1 8.7 38,130 42,651 45,727 9.7Kazakhstan TF 3,468 3,876 3,447 11.8 -11.1 0.8 838 1,013 1,012 0.2Netherlands TCE 10,739 11,008 10,104 2.5 -8.2 2.1 11,348 13,305 13,375 2.8Poland TF 15,670 14,975 12,960 -4.4 -13.5 2.6 7,239 10,599 11,771 2.5Portugal TF 11,282 12,321 .. 9.2 .. .. 8,377 10,145 10,943 2.3Russian Federation TF 20,149 20,605 .. 2.3 .. .. 7,628 9,607 11,943 2.5Spain TF 58,004 58,666 57,316 1.1 -2.3 11.7 51,122 57,645 61,628 13.0Sweden CE 4,729 5,224 .. 10.5 .. 1.1 9,084 12,001 12,490 2.8Switzerland TH 7,863 8,448 8,608 7.4 1.9 1.8 10,802 12,180 14,408 3.0Turkey TF 18,916 22,248 24,994 17.6 12.3 5.1 16,853 18,487 21,951 4.6Ukraine TF 18,936 23,122 25,392 22.1 9.8 5.2 3,485 4,597 5,768 1.2United Kingdom TF 30,654 30,871 30,182 0.7 -2.2 6.2 34,597 38,602 36,028 7.6
Source: World Tourism Organization (UN WT O) © (Data as collected by UN WT O , 2009)
* = provisional figure or data; .. = figure or data not (yet) available; I = change of series.1 Series of International Tourist Arrivals – TF: International tourist arrivals at frontiers (excluding same-day visitors); VF: International visitor arrivals at frontiers (touristsand same-day visitors); THS: International tourist arrivals at hotels and similar establishments; TCE: International tourist arrivals at collective tourism establishments.
– 6 –

UEFA Football Championship, were able to maintain positive growth, with the first two increasing by 2% ,while Austria experienced a 6% boost in arrivals.
Central and Eastern Europe bucked the trend with an increase of 3% in arrivals in 2008. Still, there was widevariation from one destination to another, with various destinations, including Bulgaria, Ukraine, Kyrgyzstan,Georgia and Armenia, recording double-digit increases. Southern and Mediterranean Europe recorded onlyslight increases in arrivals (+0.8%) with destinations such as Italy and Spain registering declines in arrivals.O ne bright spot in the region was Turkey which, with its attractive exchange rate and relaxed visa regime,achieved an increase of 12% in arrivals over 2007.
Asia and the Pacific experienced a significant slowdown in the growth pace of international tourist arrivals in2008. The deceleration from +9.6% in 2007 to +1.2% in 2008 can be attributed principally to a rise in theprice of tourism caused by increases in aviation fuel prices during the first half of the year. Growth in receiptsin Asia outpaced that of arrivals. Year-on-year growth in receipts for the region was 2.7% , to US$ 206 billion,with South Asia (+6%) reporting the highest growth rate in real terms.
North-East Asia experienced a significant drop in arrivals growth, from 10% in 2007 to -0.1% in 2008. Thedynamo for tourism in the region, China, experienced a 3% decrease in arrivals, which may be attributed tovisitors’ fear of congestion, higher prices and security concerns brought on by the 2008 Summer O lympics.Playing host to the O lympics did, however, have a positive effect on China’s tourism receipts, which grew byalmost 10% (in US dollar terms). Arrivals in Japan stagnated in 2008, which can be explained in part by theJapanese yen’s appreciation over the course of 2008. Destinations such as the Republic of Korea (+7%) andTaiwan (pr. of China) (+3%) bucked the trend and recorded above-average growth.
South-East Asia and South Asia were the strongest performing subregions of Asia and the Pacific, growingat 3% and 2% in 2008. In South-East Asia, countries like Indonesia (+13%), Cambodia (+7%) and Malaysia(+5%) grew at above-average rates. Arrivals in India, the dominant destination in South Asia, grew 6% .
Oceania reported the weakest arrivals figures in the region (-1%). The high costs of air travel – especiallysignificant for distant destinations – coupled with the global economic environment and high exchange rateshave negatively impacted international travel to Australia (-1%) and New Zealand (-0.3%). However, someof the Pacific Islands, such as Fiji (+8%), reported encouraging results in 2008.
Regional
Results
Major destinations International Tourist Arrivals International Tourism ReceiptsSeries1 (1000) Change (%) Share (%) (US$ million) Share (%)
2006 2007 2008* 07/06 08*/07 2008* 2006 2007 2008* 2008*
Asia and the Pacific 165,989 181,984 184,104 9.6 1.2 100 157,067 186,789 206,022 100
Australia VF 5,532 5,644 5,586 2.0 -1.0 3.0 17,840 22,298 24,660 12.0Cambodia TF 1,591 1,873 2,001 17.7 6.8 1.1 963 1,135 1,221 0.6China TF 49,913 54,720 53,049 9.6 -3.1 28.8 33,949 37,233 40,843 19.8Fiji TF 549 540 585 -1.6 8.4 0.3 480 497 568 0.3Guam TF 1,212 1,225 1,142 1.1 -6.8 0.6 .. .. .. ..Hong Kong (China) TF 15,822 17,154 17,320 8.4 1.0 9.4 11,638 13,754 15,300 7.4India TF 4,447 5,082 5,367 14.3 5.6 2.9 8,634 10,729 11,832 5.7Indonesia TF 4,871 5,506 6,234 13.0 13.2 3.4 4,448 5,346 7,375 3.6Iran TF 2,735 2,172 .. -20.6 .. .. 1,452 1,486 .. ..Japan VF 7,334 8,347 8,351 13.8 0.0 4.5 8,469 9,334 10,821 5.3Korea. Republic of VF 6,155 6,448 6,891 4.8 6.9 3.7 5,788 6,138 9,078 4.4Lao P.D .R. TF 842 1,142 1,295 35.6 13.4 0.7 173 233 276 0.1Macao (China) TF 10,683 12,942 10,605 21.2 .. 5.8 9,829 13,612 13,382 6.5Malaysia TF 17,547 20,973 22,052 19.5 5.1 12.0 10,424 14,047 15,277 7.4Maldives TF 602 676 683 12.3 1.1 0.4 512 602 636 0.3New Zealand VF 2,422 2,466 2,459 1.8 -0.3 1.3 4,738 5,400 4,912 2.4Nepal TF 384 527 500 37.2 -5.0 0.3 128 198 336 0.1Pakistan TF 898 840 823 -6.6 -2.0 0.5 255 276 245 0.1Philippines TF 2,843 3,092 3,139 8.7 1.5 1.7 3,501 4,931 4,388 2.1Singapore TF 7,588 7,957 7,778 4.9 -2.2 4.2 7,535 9,162 10,575 5.1Sri Lanka TF 560 494 438 -11.7 -11.2 0.3 410 385 342 0.2Taiwan (pr. of China)VF 3,520 3,716 3,845 5.6 3.5 2.1 5,136 5,213 5,937 2.9Thailand TF 13,822 14,464 14,584 4.6 0.8 7.9 13,401 16,669 17,651 8.6Vietnam VF 3,584 4,229 4,236 18.0 0.2 2.3 3,200 3,477 3,926 1.9
Source: World Tourism Organization (UN WT O) © (Data as collected by UN WT O , 2009)1 See note on page 6.
Asia and the Pacific – rising cost of travel dampens growth
– 7 –
I

International tourist arrivals in the Americas grew by 3% in 2008, to 147 million, where Central and SouthAmerica led the way with above-average increases of 7% and 4% respectively. Growth in receipts in theregion (+5%) tripled that of the world (+1.7%), with the strongest performance coming from North America(+7%). International tourism receipts for the Americas totalled US$ 188 billion in 2008, representing 20% ofthe world total.
Arrivals in South America were up 4% , following 2007’s increase of 7% . Strongest performers in thesubregion were Uruguay (+10%), Chile (+8%), Peru (+7%) and Ecuador (+7%). International arrivals inArgentina and Brazil, on the other hand, grew at more modest rates of 2% and 0.5% , respectively. In CentralAmerica, Panama had an excellent year, showing double-digit growth of 17% , and other countries, likeHonduras (+8%), Nicaragua (+7%), Costa Rica (+6%) and Guatemala (+5%), also enjoyed above averagegrowth in 2008.
The results for North America were mixed. Mexico was up 6% , as against a flat 2007. The USA’s performancewas very strong in the first eight months but the looming recession in major source markets brought growth toa halt, ending the year at 4% . By contrast, arrivals in Canada continued to slide (-4%), due to factors whichinclude a poor exchange rate, stricter travel restrictions to / from the USA , and reduced airline capacity fromimportant source markets in Europe and Japan. The Caribbean saw arrivals grow by 2% . Cuba (+9%) andAruba (+7%) posted excellent results and destinations such as Jamaica (+4%) and Puerto Rico (+6%) also didbetter than the subregion overall. Weaker results in the rest of the subregion can be attributed in large part onhigh airfares and decreased airline capacity, as well as economic difficulties in the USA and Europe.
Africa’s growth of 4% to 47 million international tourist arrivals, though at half the level achieved in 2007,was still very positive when compared to the world’s performance overall. International tourism receiptsamounted to US$ 31 billion, signifying a decrease of 1% in real terms. It is important to note that this declinefollowed a series of previous strong growth years.
North African countries Morocco (+6%) and Tunisia (+4%) posted good results, which can be attributed tostrong government support coupled with easy access and attractive prices compared to ‘euro’ destinations
Regional
Results
Americas – still considerable growth in Central and South America
Africa – above average growth in arrivals
Major destinations International Tourist Arrivals International Tourism ReceiptsSeries1 (1000) Change (%) Share (%) (US$ million) Share (%)
2006 2007 2008* 07/06 08*/07 2008* 2006 2007 2008* 2008*
Americas 135,791 142,866 147,037 5.2 2.9 100 154,503 171,295 188,355 100
Argentina TF 4,173 4,562 4,665 9.3 2.3 3.2 3,344 4,314 4,633 2.5Aruba TF 694 772 827 11.2 7.1 0.6 1,080 1,255 1,412 0.7Bahamas TF 1,601 1,528 1,463 -4.6 -4.2 1.0 2,056 2,187 2,153 1.1Barbados TF 563 575 568 2.1 -1.2 0.4 1,057 1,199 1,192 0.6Bolivia TF 521 573 594 9.9 3.7 0.4 244 292 275 0.1Brazil TF 5,017 5,026 5,050 0.2 0.5 3.4 4,316 4,953 5,785 3.1Canada TF 18,265 17,931 17,128 -1.8 -4.5 11.6 14,642 15,333 15,106 8.0Chile TF 2,253 2,507 2,699 11.3 7.7 1.8 1,213 1,478 1,757 0.9Colombia VF 1,053 1,195 1,222 13.5 2.2 0.8 1,554 1,669 1,844 1.0Costa Rica TF 1,725 1,980 2,089 14.8 5.5 1.4 1,732 2,029 2,250 1.2Cuba TF 2,150 2,119 2,316 -1.4 9.3 1.6 2,127 2,141 2,267 1.2Dominican Rep. TF 3,965 3,980 3,980 0.4 0.0 2.7 3,917 4,064 4,176 2.2Ecuador VF 841 937 1,005 11.5 7.2 0.7 490 623 763 0.4El Salvador TF 1,279 1,339 1,385 4.7 3.5 0.9 793 847 894 0.5Guatemala TF .. 1,448 1,527 .. 5.4 1.0 919 1,055 1,068 0.6Honduras TF 739 831 899 12.6 8.2 0.6 488 557 621 0.3Jamaica TF 1,679 1,701 1,767 1.3 3.9 1.2 1,870 1,910 1,984 1.1Mexico TF 21,353 21,370 22,637 0.1 5.9 15.4 12,177 12,852 13,289 7.1Nicaragua TF 749 800 858 6.8 7.2 0.6 231 255 276 0.1Panama TF 843 1,103 1,293 30.8 17.2 0.9 960 1,185 1,408 0.7Peru TF 1,721 1,916 2,058 11.4 7.4 1.4 1,570 1,723 1,991 1.1Puerto Rico TF 3,722 3,687 3,894 -0.9 5.6 2.6 3,369 3,414 3,644 1.9United States TF 50,977 55,986 58,030 9.8 3.6 39.5 85,720 96,712 110,090 58.4Uruguay TF 1,749 1,752 1,921 0.2 9.7 1.3 598 809 1,042 0.6Venezuela TF 748 771 745 3.0 -3.4 0.5 768 817 895 0.5
Source: World Tourism Organization (UN WT O) © (Data as collected by UN WT O , 2009)1 See note on page 6.
– 8 –

on the northern shores of the Mediterranean. A number of Subsaharan African destinations reported positivegrowth, with Angola, Ghana, Mali and Uganda turning in double-digit results. Boosted by increased fundingfor tourism and targeted marketing promotions, South Africa, the leading destination in the region, increasedinternational arrivals by 6% , boosted by the build-up to the hosting of the FIFA 2010 Football World Cup.
The Middle East has succeeded in sustaining the high growth rate of the past few years. International arrivalsin the region as a whole grew an estimated 18% to 55 million, and receipts increased 17% in real terms,reaching US$ 46 billion. Lebanon, Syria (both +31%) and Saudi Arabia (+28%) led the way in arrivalsgrowth, followed by Egypt (+16%), O man (+13%) and Jordan (+9%).
Regional
Results
Major destinations International Tourist Arrivals International Tourism ReceiptsSeries1 (1000) Change (%) Share (%) (US$ million) Share (%)
2006 2007 2008* 07/06 08*/07 2008* 2006 2007 2008* 2008*
Africa 41,534 45,016 46,700 8.4 3.7 100 24,896 29,089 30,612 100
Algeria VF 1,638 1,743 1,771 6.4 1.6 3.8 215 219 .. ..Angola TF 121 195 294 60.4 51.0 0.6 75 225 .. ..Botswana TF 1,843 1,990 2,131 8.0 7.1 4.6 537 546 553 1.8Cape Verde TF 242 267 285 10.4 6.7 0.6 228 303 350 1.1Ethiopia TF 290 312 330 7.4 5.8 0.7 162 176 374 1.2Gambia TF 125 143 147 14.3 2.9 0.3 75 84 .. ..Ghana TF 497 587 698 18.0 19.0 1.5 861 908 919 3.0Kenya TF 1,644 .. .. .. .. .. 687 917 752 2.5Lesotho TF 346 292 285 -15.7 -2.5 0.6 36 43 33 0.1Madagascar TF 312 344 375 10.4 9.0 0.8 232 269 333 1.1Malawi TF 638 735 742 15.2 1.0 1.6 24 27 .. ..Mali TF 153 164 190 7.4 15.9 0.4 175 221 .. ..Mauritius TF 788 907 930 15.1 2.6 2.0 1,007 1,299 1,449 4.7Morocco TF 6,558 7,408 7,879 12.9 6.4 16.9 5,984 7,181 7,202 23.6Namibia TF 833 929 .. 11.5 .. .. 384 434 378 1.2Reunion TF 279 381 396 36.5 4.2 0.8 335 447 505 1.7Senegal TF 866 875 .. 1.0 .. .. 250 531 .. ..Seychelles TF 141 161 159 14.7 -1.4 0.3 228 285 258 0.8South Africa TF 8,396 9,091 9,592 8.3 5.5 20.5 7,875 8,418 7,609 24.9Sudan TF 328 436 .. 32.9 .. .. 252 262 331 1.1Swaziland THS 873 870 754 -0.4 -13.3 1.6 75 32 .. ..Tanzania TF 628 692 750 10.2 8.4 1.6 950 1,199 1,354 4.4Tunisia TF 6,550 6,762 7,049 3.2 4.2 15.1 2,275 2,575 2,932 9.6Uganda TF 539 642 844 19.2 31.5 1.8 346 398 498 1.6Zambia TF 757 897 812 18.5 -9.5 1.7 110 138 .. ..Zimbabwe VF 2,287 2,508 .. 9.7 .. .. 338 365 .. ..
Source: World Tourism Organization (UN WT O) © (Data as collected by UN WT O , 2009)1 See note on page 6.
Major destinations International Tourist Arrivals International Tourism ReceiptsSeries1 (1000) Change (%) Share (%) (US$ million) Share (%)
2006 2007 2008* 07/06 08*/07 2008* 2006 2007 2008* 2008*
M iddle East 40,900 46,646 55,106 14.0 18.1 100 29,863 34,983 45,640 100
Bahrain TF 4,519 4,935 .. 9.2 .. .. 1,048 1,105 1,166 2.6Egypt TF 8,646 10,610 12,296 22.7 15.9 22.3 7,591 9,303 10,985 24.1Jordan TF 3,225 3,430 3,729 6.4 8.7 6.8 2,060 2,311 2,943 6.4Lebanon TF 1,063 1,017 1,333 -4.3 31.0 2.4 4,981 5,466 7,192 15.8O man TF 1,336 1,124 1,273 -15.9 13.3 2.3 544 648 804 1.8Q atar TF 946 964 .. 1.9 .. .. 874 .. .. ..Saudi Arabia TF 8,620 11,531 14,757 33.8 28.0 26.8 4,961 5,228 9,720 21.3Syrian Arab Republic TF 4,231 4,158 5,430 -1.7 30.6 9.9 2,025 2,883 .. ..Untd Arab Emirates THS .. .. .. .. .. .. 4,972 6,072 7,162 15.7Yemen THS 382 379 404 -0.8 6.6 0.7 181 425 .. ..
Source: World Tourism Organization (UN WT O) © (Data as collected by UN WT O , 2009)1 See note on page 6.
Middle East – sustained growth amid turbulent times
– 9 –

OutboundTourism
Middle East outbound market continues dynamic growth trend
Majority of international travel takes place within the traveller’s own region, with about four out of fiveworldwide arrivals originating from the same region. However, travel between different regions tends togrow at a somewhat faster rate than intraregional travel. In 2008, interregional travel increased by 3.1% asagainst a growth of 1.7% for intraregional traffic.
Source markets for international tourism are still largely concentrated in the industrialized countries ofEurope, the Americas and Asia and the Pacific. However, with rising levels of disposable income, manyemerging economies have shown fast growth over recent years, especially markets in North-East and South-East Asia, Central and Eastern Europe, the Middle East, Southern Africa and South America. Europe iscurrently the most important source market, generating 55% of international arrivals worldwide in 2008,followed by Asia and the Pacific (20%) and the Americas (16%). All three regions grew at below averagerates as the global economic crisis dampened growth in most source markets in the second part of the year.The Middle East, however, continued its dynamic growth, recording an annual increase of 16% . O utboundtourism from Africa also maintained growth at a rate of 5% .
International tourism’s top spenders – virtually equal to last year’s line-upThe ranking of international tourism spenders shows no major changes in 2008 apart from the fact that theNetherlands re-entered after a few years of absence, taking the number ten spot. Among the world’s topten spenders, apart from China (+21% in US$ terms), the Russian Federation (+12% in US$ terms) didparticularly well in 2008, as did France (+10%) and Canada (+8%). Just one market, Japan, recorded negativegrowth (-8%), while world’s top spender Germany increased spending only by a modest 2% for the year.
In spite of an overall cooling of tourism growth in the second half of 2008, emerging source markets again turnedin some of the best performances, with many registering growth rates of over 15% – Brazil, Hungary, SouthAfrica, India, Bulgaria, Ukraine, China, Saudi Arabia, United Arab Emirates, Egypt, Malaysia and Argentina.
International Tourism Local currencies Market Population ExpenditureRank Expenditure (US$ billion) change (%) share (%) 2008 per capita
2007 2008* 2007/2006 2008*/2007 2008* (million) (US$)
World 857 943 100 6,724 140
1 Germany 83.1 91.0 2.9 2.0 9.7 82 1,1082 United States 76.4 79.7 5.9 4.4 8.5 304 2623 United Kingdom 71.4 68.5 4.1 4.4 7.3 61 1,1214 France 36.7 43.1 7.9 9.6 4.6 62 6935 China 29.8 36.2 22.5 21.4 ($) 3.8 1,328 276 Italy 27.3 30.8 8.4 4.9 3.3 59 5197 Japan 26.5 27.9 -0.2 -7.6 3.0 128 2188 Canada 24.7 26.9 13.3 8.4 2.9 33 8109 Russian Federation 22.3 24.9 22.1 11.8 ($) 2.6 142 175
10 Netherlands 19.1 21.7 2.6 6.2 2.3 17 1,301Source: World Tourism Organization (UN WT O) © (Data as collected by UN WT O , 2009)
($) = percentage derived from series in US$ instead of local currency
International Tourist Arrivals Share Change Average annual(million) (%) (%) growth (%)
1990 1995 2000 2005 2006 2007 2008* 2008* 07/06 08*/07 '00-08*
World 438 534 684 804 853 904 922 100 6.1 2.0 3.8From:
Europe 254.2 308.1 395.6 451.5 475.2 502.6 508.7 55.2 5.8 1.2 3.2Asia and the Pacific 58.8 86.6 114.2 153.2 164.0 178.3 181.6 19.7 8.7 1.8 6.0Americas 99.3 108.6 131.1 136.3 142.8 149.5 151.8 16.5 4.7 1.5 1.9Middle East 8.2 9.3 14.1 22.6 24.6 27.0 31.5 3.4 9.7 16.4 10.6Africa 10.0 12.7 16.3 22.1 24.9 27.2 28.6 3.1 9.1 5.0 7.3Origin not specified¹ 7.9 8.9 12.5 18.3 21.0 19.7 20.2 2.2
Same region 352.8 429.4 540.2 635.3 670.3 710.5 722.5 78.3 6.0 1.7 3.7O ther regions 77.7 96.0 131.0 150.3 161.3 174.2 179.6 19.5 7.9 3.1 4.0
Source: World Tourism Organization (UN WT O) © (Data as collected by UN WT O , 2009)1 Countries that could not be allocated to a specific region of origin. As information is derived from inbound tourism data this occurs when data on the country of origin is missing or when a
category such as 'other countries of the world' is used grouping countries together that are not seperately specified.
– 10 –

Long-term prospects
Tourism 2020 Vision is the World Tourism Organization’s long-term outlook and assessment of thedevelopment of tourism up to the first 20 years of the new millennium. An essential outcome of the Tourism2020 Vision are quantitative forecasts covering a 25-year period, with 1995 as the base year and forecastsfor 2010 and 2020.
Although the evolution of tourism over recent years has been somewhat irregular, for the moment UN WT Ohas maintained its long-term forecast. The underlying structural trends of the forecast are believed not tohave changed significantly. Experience shows that in the short term, periods of faster growth (1995, 1996,2000, and 2004 to 2007) alternate with periods of slow growth (2001 to 2003, 2008). In fact, the actualpace of growth has actually been slightly faster than the Tourism 2020 Vision forecast as international touristarrivals showed an average annual growth of 4.3% between 1995 and 2008, compared with the projected4.1% . As part of its program of work, UN WT O is currently undertaking a major update of it long-termoutlook with the project Tourism Towards 2030.
International Tourist Arrivals by Region (million)
UN WT O ´s Tourism 2020 Vision projects that international arrivals are expected to reach nearly 1.6 billionby the year 2020. O f these worldwide arrivals in 2020, 1.2 billion will be intraregional and 0.4 billion will belong-haul travellers. East Asia and the Pacific, South Asia, the Middle East and Africa are forecast to grow atover 5% per year, compared to the world average of 4.1% . More mature regions Europe and the Americasare anticipated to show lower-than-average growth rates. Europe will maintain the highest share of worldarrivals, although this share will decline from 60% in 1995 to 46% in 2020.
The total tourist arrivals by region shows that, by 2020, the top three receiving regions will be Europe (717million tourists), East Asia (397 million) and the Americas (282 million), followed by Africa, the Middle Eastand South Asia.
Average annual ShareBase Year Forecasts growth rate (%) (%)
1995 2010 2020 1995-2020 1995 2020
Total 565 1,006 1,561 4.1 100 100Africa 20 47 77 5.5 3.6 5.0Americas 109 190 282 3.9 19.3 18.1East Asia /Pacific 81 195 397 6.5 14.4 25.4Europe 338 527 717 3.0 59.8 45.9Middle East 12 36 69 7.1 2.2 4.4South Asia 4 11 19 6.2 0.7 1.2
Intraregional (a) 464 791 1,183 3.8 82.1 75.8Long-haul (b) 101 216 378 5.4 17.9 24.2
Source: World Tourism Organization (UN WT O) ©
Notes: (a) Intraregional includes arrivals where country of origin is not specified.
(b) Long-haul is defined as everything except intraregional travel.
International Tourist Arrivals, 1950-2020
Source: World Tourism Organization (UN WT O) ©
Tourism2020Vision
– 11 –
UNWTO World Tourism Barometer
The UNWTO World Tourism Barometer offers a uniqueoverview of short-term international tourism trends. It isdeveloped by UNWTO with the aim to provide all thosedirectly or indirectly involved in tourism with adequate up-to-date statistics and analysis in a timely fashion. Each issuecontains three regular sections: an overview of short-termtourism trends including data on international tourist arrivals,tourism receipts and expenditure for over 100 countriesworldwide and data on air transport on major routes; aretrospective and prospective evaluation of current tourismperformance by the members of the UNWTO Panel of TourismExperts; and selected economic data relevant for tourism. TheUNWTO World Tourism Barometer is updated in January,June and October.
Available in English, French and Spanish
Handbook on Tourism Destination BrandingAll over, governments have become aware of tourism’s power toboost their nation’s development and prosperity. As more tourismdestinations emerge and competition for visitors becomes moreintense, a destination’s ability to project itself on the world stage anddifferentiate itself from others is ever more important. Recognizingthe value of successfully building and managing a destination’sbrand, the ETC and the UNWTO provide a useful and practical hand-book for both marketing novices and experienced destination man-agers. Introduced by Simon Anholt, it offers a step-by-step guide tothe branding process accompanied by strategies for brand manage-ment. Case studies illustrate the various concepts, present best prac-tices from around the world and provide fresh insight into destina-tion branding. It concludes with a section on evaluating brand impactand a set of practical recommendations.
Available in English
The Chinese Outbound Travel Market withSpecial Insight into the Image of Europe as a Destination
China is one of the fastest growing outbound markets in theworld. Rising incomes and relaxation of restrictions on foreigntravel led to a growth of 22% a year in trips abroad since 2000(34.5 million in 2006). China ranks 5th worldwide in terms ofspending on international tourism (US$ 30 billion in 2007). In1995, the World Tourism Organization (UNWTO) predicted thatChina would generate 100 million arrivals worldwide by 2020,making it the fourth largest market in the world (Tourism 2020Vision). In view of recent trends, China may reach that targetwell before 2020. To better understand the structure and trendsof this market is the aim of the new ETC/UNWTO report TheChinese Outbound Travel Market with Special Insight into theImage of Europe as a Destination.
Available in English
The Indian Outbound Travel Market with SpecialInsight into the Image of Europe as a Destination
India is one of the fastest-growing outbound travel markets in the world.Trips abroad have grown from 3.7 (1997) to 9.8 million (2007) andinternational tourism expenditure has increased from US$ 1.3 (1997) toUS$ 8.2 billion (2008). With more than 1.1 billion inhabitants and GDPincreasing by more than 8% every year, the country offers enormouspotential for future growth in outbound travel. Recognizing the importanceof this market, the ETC and the UNWTO have undertaken detailedresearch on the Indian outbound market. This publication covers issuessuch as travellers’ behaviour and patterns – destination choice, purpose oftravel, spending, holiday activities and market segmentation, as well as themedia or internet use trends. The report also sets out recommendations onhow to best promote a destination in the Indian market.
Available in English
World Tourism Organization (UNWTO)
PublicationsWorld Tourism O rganiz a tion
Compendium of Tourism Statistics, 2009 Edition The Compendium of Tourism Statistics is designed to provide acondensed and quick-reference guide on the major tourismstatistical indicators in each country. The 2009 edition providesstatistical information on tourism in 208 countries and territoriesaround the world for the period 2003 – 2007. This publication isedited in English and includes text in Arabic, French, German,Russian and Spanish printed in a separate pasteboard.
Yearbook of Tourism Statistics, 2009 Edition The Yearbook of Tourism Statistics provides data on totalarrivals and overnight stays associated with inbound tourism,with a breakdown by country of origin for 204 countries andterritories for the period 2003 – 2007. It is available in English,with notes given in English, French and Spanish.
The Russian Outbound Travel Market withSpecial Insight into the Image of Europe as a Destination
Russia is the 9th biggest outbound travel market in the world,generating in 2007 US$ 22 billion in spending abroad. Tobetter understand the structure and trends of this growingmarket is the aim of this ETC/UNWTO report, which identifieskey trends in the Russian outbound travel – among others, themarket size and value, growth in trip volume and spending,purpose of trip, destination choice, the role of the travel tradeand online distribution. In addition, the publication providesinformation on government policy affecting outbound travel,notably visa issues and traffic rights for foreign airlinesoperating to/from the country. All this information is critical tohelping destinations and commercial operators plan aheadwith greater foresight, providing guidance on the short-termopportunities and the longer-term potential for investment inthis market.
Available in English
Handbook on E-marketing for TourismDestinationsThis handbook is the first of its kind for tourism destinations.It is a practical ‘how-to’ manual designed to help staff atnational, regional and city tourism organisations, to improvetheir e-marketing skills and manage new projects. It coversall the basics such as web design, search engineoptimisation, social networking and e-commerce, andadvices among others on how to build better content, getdistribution of it, use CRM , succeed with online PR and getinto mobile marketing. Web analytics, online researchmethods, and performance measurement get full treatmentand new areas like digital television are covered. Also, itincludes over 30 examples of e-marketing in action.
Available in English
Handbook on Tourism ForecastingMethodologiesTourism demand is a complex phenomenon which can be affectedby an incredible number of different exogenous factors – economy,fuel prices, infrastructure, natural disasters, the image of adestination, etc. Therefore, tourism demand, in all of its differentforms, is one of the most difficult variables to foresee. Nonetheless,it gets more and more important for destinations and private sectoralike to anticipate demand trends and use such knowledge as abasis of management decisions and planning. This Handbook onTourism Forecasting Methodologies aims to be a simple guide tothe complex world of tourism forecasting. It presents the basicforecasting techniques, their advantages and disadvantages as wellas some practical examples of such methodologies in action. It alsoincludes a CD where the methodologies are further explained andexemplified in an excel file.
Available in English
The World Tourism O rganization is a specialized agency of the United Nations
and the leading international organization in the field of tourism . It serves as a
global forum for tourism policy issues and a practical source of tourism know-
how. Its membership includes 160 countries and territories and more than 390
Affiliate M embers representing local governments, tourism associations and
private sector companies including airlines, hotel groups and tour operators.
The easy way to order UN WT O publications:
www.unwto.org/infoshopFor further information, please contact:
UNWTO Publications DepartmentTel. (34) 91 567 8100 - Fax: (34) 91 571 3733
e-mail: [email protected]
Related Documents