TOURISM FORECASTS TOURISM FORECASTS 2017

Welcome message from author
This document is posted to help you gain knowledge. Please leave a comment to let me know what you think about it! Share it to your friends and learn new things together.
Transcript
TOURISMFORECASTS
TOURISM FORECASTS
2017
TOURISM FORECASTS 2017ii
TOURISM FORECASTING REFERENCE PANEL
As part of the forecasting process, Tourism Research Australia (TRA) established the Tourism Forecasting Reference Panel (the Panel) comprising experts from industry and government. Its key purpose is to review and provide feedback on TRA’s draft tourism forecasts before results are finalised. TRA acknowledge the contribution of the following Panel members:
Janice Wykes (Chair) Assistant General Manager, Tourism Research Australia
Ivan Colhoun Chief Economist, Markets, National Australia Bank
Susan Streeter Policy Manager, Tourism and Transport Forum
Daniel Gschwind Chief Executive Officer, Queensland Tourism Industry Council
Karen Halbert Executive General Manager (Corporate Affairs, Government and Industry), Tourism Australia
Simon McArthur Chairman, Australian Regional Tourism Network
Peter Shelley Managing Director, Australian Tourism Export Council
Dr. Tony Webber Managing Director, Webber Quantitative Consulting PTY LTD
.
Tourism Research Australia Australian Trade and Investment Commission (Austrade) 25 National Circuit Forrest ACT 2603
Email: [email protected] Web: www.tra.gov.au
Publication date: August 2017
This work is licensed under a Creative Commons Attribution 3.0 Australia licence. To the extent that copyright subsists in third party quotes and diagrams it remains with the original owner and permission may be required to reuse the material.
This work should be attributed as Tourism Forecasts 2017, Tourism Research Australia, Canberra.
Enquiries regarding the licence and any use of work by Tourism Research Australia are welcome at [email protected]
Cover image: Adelaide, Australia - April 26, 2015. Image courtesy of John Kirk.

ii
CONTENTS
TOURISM FORECASTING REFERENCE PANEL .............................................II
AT A GLANCE: TOURISM FORECASTS FOR 2026–27 ...................................1
1. INTRODUCTION ..................................................................................2
2. NATIONAL FORECASTS, 2017−18 TO 2026–27 .....................................3
2.1 INBOUND ARRIVALS ............................................................................................... 32.2 DOMESTIC VISITORS .............................................................................................. 72.3 AUSTRALIAN RESIDENT DEPARTURES (OUTBOUND)................................................ 72.4 TOTAL TOURISM SPEND ........................................................................................12
3. STATE AND TERRITORY FORECASTS ..................................................13
4. THE ECONOMIC FACTORS INFLUENCING THE FORECASTS ..................18
4.1 THE OUTLOOK FOR THE GLOBAL ECONOMY IS IMPROVING ....................................184.2 AUSTRALIA IS HEADING TOWARDS TREND GROWTH ..............................................194.3 WORLD OIL PRICES .............................................................................................. 20
5. OTHER DRIVERS INFLUENCING THE FORECASTS ...............................21
5.1 AVIATION ..............................................................................................................215.2 ACCOMMODATION ............................................................................................... 22
6. RISKS ..............................................................................................23
7. DATA SOURCES.................................................................................23

TOURISM FORECASTS 20171
AT A GLANCE: TOURISM FORECASTS FOR 2026–27
$151.4B OVERNIGHT SPEND IN 2026–27
50% ON 2016–17, ANNUAL GROWTH OF 4.1%
15.0M INTERNATIONAL VISITORS IN 2026–27 75% ON 2016–17, ANNUAL GROWTH OF 5.8%
CHINA: $26.2B, 168% ON 2016–17 NZ: $3.9B, 44% ON 2016–17 US: $6.3B, 77% ON 2016–17
$97.5B DOMESTIC SPEND IN 2026–27 21% ON 2016–17, ANNUAL GROWTH OF 1.9%
DOMESTIC OVERNIGHT: $75.5BDAY TRIP SPEND: $21.9B
14.8M OUTBOUND TRIPS IN 2026–27 47% ON 2016–17, ANNUAL GROWTH OF 3.9%

2
1. INTRODUCTIONPURPOSE OF THESE FORECASTS
As Australia transitions to a more diversified service-based economy, tourism is becoming increasingly important, and has the potential to be Australia’s fastest growing industry. The most recent satellite accounts show that tourism Gross Domestic Product grew 7.4% in 2015–16, well ahead of the rest of the economy.
To ensure that demand aligns with supply, and that the industry grows in a sustainable way, clear strategies are required to cater not just for the economic aspects of tourism, but for the environmental and social effects as well. Well targeted advice is also needed to inform future planning and investment decisions.
Tourism Research Australia’s (TRA) forecasts support these goals by providing policymakers, planners and investors with a decade long view on changes in:
n inbound arrivals, focusing on Australia’s main international markets
n purpose of travel for inbound arrivals
n visitor nights and expenditure for international and domestic travellers
n international and domestic visitor nights for the states and territories
n outbound travel by Australian residents, and the main country they visit.
With one of the most important outputs from tourism forecasts being the estimation of future visitor spend, results from this year’s forecasts show:
n Australia’s tourism industry is meeting expenditure targets By the end of 2020, it is forecast that total tourism spend, excluding day trips, will reach $131 billion, placing the industry slightly above the midpoint of the $115 to $140 billion spend target set under Tourism 2020.
n International tourism will capture a greater share of the visitor dollar Inbound visitor spend is forecast to grow strongly and increase its share from 33% in 2016–17 to 44% in 2026–27, while domestic tourism spend is on track for moderate growth.
n China is set to become our largest international market By 2017–18, China is expected to overtake New Zealand to become the largest source of both inbound arrivals and inbound spend.
HOW TRA DEVELOPS THE NATIONAL FORECASTS…
n Estimates of tourist activity and spend are produced using a combination of econometric and time series models. Forecasts are based on:
– global and domestic economic conditions
– aviation capacity and airfares
– domestic accommodation supply and room rates
– significant events likely to affect source markets.
n TRA conducts an industry sentiment survey to gain further insights on the most influential factors for the coming year.
…AND THE STATE AND TERRITORY FORECASTS
n Historical shares of each market and each travel purpose are used to obtain a long-term estimate of shares for each jurisdiction over time.
n These estimated shares are used to generate preliminary forecasts of visitor nights for each state and territory, which are then aligned to forecast visitor nights at the national level.
n Forecasts are adjusted again, along with inbound visitor nights to account for major sporting and business events.
Image: Melbourne lane culture Image courtesy of Kurikawa

TOURISM FORECASTS 20173
2. NATIONAL FORECASTS, 2017−18 TO 2026–27
2.1 INBOUND ARRIVALS
Over the next two years, international visitor numbers to Australia are expected to increase 13.1%, from 8.6 million in 2016–17 to 9.2 million in 2017–18 and 9.7 million in 2018–19.
Asia will continue to outperform other overseas markets over this period, brought about by increasing prosperity and the continuing transition of millions of people into consumer oriented, middle-class populations. In this environment, the volume of Asian visitors is expected to increase 17.4% in the two years to 2018–19, from 4.2 million in 2016–17 to 4.5 million in 2017–18 and 4.9 million in 2018–19. Countries making the largest contributions to growth from Asia will be:
n China – up 26.4%, from 1.3 million visitors in 2016–17 to 1.6 million in 2018–19
n India – up 21.1%, from 278,000 visitors in 2016–17 to 337,000 in 2018–19
n Japan – up 15.1%, from 427,000 visitors in 2016–17 to 492,000 in 2018–19.
The result of this above-average growth is that Asia will account for over half of all visitors to Australia during 2018–19, compared with 48% in 2016–17. Asia will also account for 64% of all visitor growth between these two time points, with China alone making a 29% contribution, followed by Japan (5.7%) and India (5.2%).
FIGURE 1 – VISITOR GROWTH, 2016–17 TO 2018–19
CHINA
INDIA
JAPAN
US
MALAYSIA
INDONESIA
CANADA
GERMANY
26.4%FROM
1.3M TO 1.6M
21.1%FROM
278K TO 337K
15.1%FROM
427K TO 492K
14.9%FROM
752K TO 864K
14.1%FROM
395K TO 451K
11.8%FROM
190K TO 213K
10.2%FROM
162K TO 179K
9.6%FROM
211K TO 231K
By comparison, growth prospects for Australia’s largest traditional markets are mixed.
Visitor numbers from the United States (US) are expected to grow very strongly – up 14.9% from 752,000 in 2016–17 to 864,000 in 2018–19. Expected improvements in their domestic economy and the lower value of the Australian dollar relative to the US currency will drive this growth.
Visitation from the United Kingdom (UK) is a story in two parts. In 2017–18, visitor numbers are forecast to grow 7.0% to 779,000, largely driven by the Ashes Test series scheduled for the 2017–18 cricket season.1 In 2018–19, and in the absence of an event of this scale, UK visitation will fall 1.1% to 770,000.
1 This series has proven to be a major boost for UK travel in the past, however, at the time of writing (in early July 2017), there is some uncertainty around whether it will proceed due to a pay dispute between players and cricket administrators. Even if the dispute is resolved, a soft UK economy and weaker currency may result in less visitation from the UK than in previous series.
Image: Travellers on bridge Image courtesy of allensima
4
BOX 1 – CHANGES TO INTERNATIONAL FORECASTS
In last year’s report, nights spent in different stopover destinations were used as the basis for national level forecasts of international visitor nights, rather than main reason for trip. For example, a business traveller going to Melbourne for three days would have business as their main reason for the trip; however, in terms of stopovers, they might spend two nights in Melbourne on business and then one night in regional Victoria to visit a relative.
This report has reverted back to using main reason for trip for these national forecasts. This ensures consistency when aligning trip activity with spend estimates, and is consistent with how the International Visitor Survey (IVS) collects spend information from respondents.
This report also introduces a simple approach to provide national forecasts for international visitor nights for holiday visitors and those visiting friends and relatives (VFR) who are under 15 years of age – a group not measured in the IVS. Forecasts for the other reasons for travel – business, education, employment and other are based on IVS estimates.
State and territory forecasts continue to use stopover nights to fully account for the fact that tourists (like the business traveller example above) can travel within Australia for more than one reason.
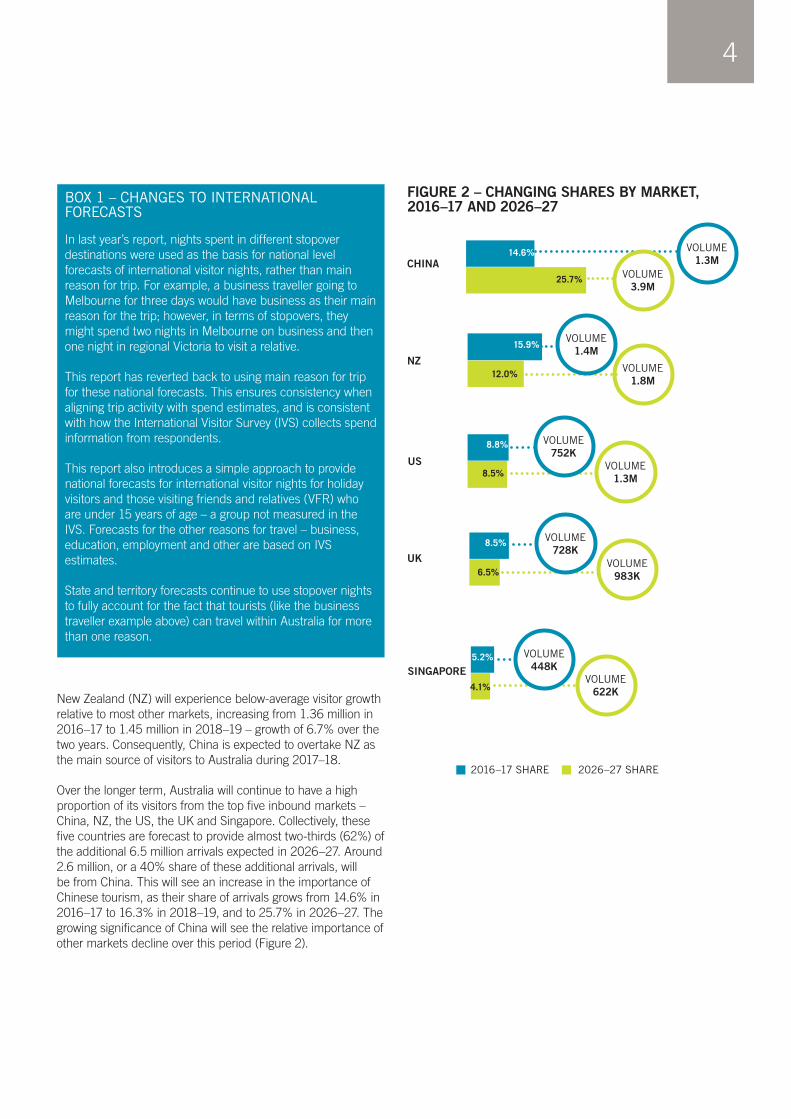
FIGURE 2 – CHANGING SHARES BY MARKET, 2016–17 AND 2026–27
2016–17 SHARE 2026–27 SHARE
14.6%
25.7%
CHINA
VOLUME 1.3M
VOLUME 3.9M
15.9%
12.0%NZ
VOLUME 1.8M
VOLUME 1.4M
8.8%
8.5%US
VOLUME 752K
VOLUME 1.3M
8.5%
6.5%UK VOLUME
983K
VOLUME 728K
5.2%
4.1%
SINGAPORE
VOLUME 448K
VOLUME 622K
New Zealand (NZ) will experience below-average visitor growth relative to most other markets, increasing from 1.36 million in 2016–17 to 1.45 million in 2018–19 – growth of 6.7% over the two years. Consequently, China is expected to overtake NZ as the main source of visitors to Australia during 2017–18.
Over the longer term, Australia will continue to have a high proportion of its visitors from the top five inbound markets – China, NZ, the US, the UK and Singapore. Collectively, these five countries are forecast to provide almost two-thirds (62%) of the additional 6.5 million arrivals expected in 2026–27. Around 2.6 million, or a 40% share of these additional arrivals, will be from China. This will see an increase in the importance of Chinese tourism, as their share of arrivals grows from 14.6% in 2016–17 to 16.3% in 2018–19, and to 25.7% in 2026–27. The growing significance of China will see the relative importance of other markets decline over this period (Figure 2).

TOURISM FORECASTS 20175
International leisure travel – comprising holiday travel and travel to visit friends and relatives (VFR) – has been a major contributor to the growth of Australian inbound tourism over the
VOLUME 606K
FIGURE 3 – GROWTH IN INTERNATIONAL TRAVEL BY CATEGORY
HOLIDAY
VISITING FRIENDS AND RELATIVES
BUSINESS
EMPLOYMENT
EDUCATION
8.1%
6.5%
6.9%
5.6%
2.8%
3.9%
6.6%
4.9%
4.3%
6.3%
2017–18 GROWTH 2018–19 GROWTH
VOLUME 2.3M
VOLUME 5.1M
VOLUME 2.4M
VOLUME 899K
VOLUME 635K
VOLUME 337K
VOLUME 317K
VOLUME 4.7M
VOLUME 865K
LEISURE TRAVEL
▲14.4% TO 7.5M
IN 2018–19
These forecast growth rates will see leisure travel volumes increase from 6.5 million arrivals in 2016–17 to 7.5 million in 2018–19. Within the leisure category, holiday travel will grow at a slightly faster rate (up 15.2% over the period), than VFR (up 12.9%).
Outside the leisure category, there is expected to be relatively slow growth in business travel and employment-related travel, extending a longer running trend. By contrast, education-related travel will continue to grow strongly – up 6.6% in 2017–18 and 4.9% in 2018–19. This category of travel has recorded double-digit growth rates over the last three years. Furthermore, because of interaction effects it is contributing to growth in other travel categories (Box 2).
BOX 2 – INTERNATIONAL EDUCATION AND INBOUND TOURISM
Education-related travel made up 6.6% of all international visitor arrivals in 2016–17 – and is one of the fastest growing sectors of the tourism industry. This type of travel is also unique in the sense that it can have an indirect effect on other categories of travel – particularly leisure travel. For example, a VFR or holiday visitor may be spending much of their time visiting a relative or friend who is studying in Australia. An analysis of International Visitor Survey (IVS) data provides an estimate of the indirect effect of international education on other leisure travel.
For example, in 2016, 4.1% of all VFR visitors indicated another purpose of their trip was to visit a friend or relative studying in Australia. Among holiday visitors, the figure was 2.7%.
Among Chinese visitors, the figures were substantially higher; 13.1% of VFR visitors and 4.5% of holiday visitors to Australia in 2016 came to visit an international student.
last few years, making up more than three-quarters (76%) of total traveller volumes in 2016–17. This dominance is expected to continue over the next two years, with total growth of 14.4% over 2017–18 and 2018–19 (Figure 3).

TOURISM FORECASTS 20176
CHINA12.6% 12.3%
NEW ZEALAND
16%
UNITED STATES
HONG KONG
INDIA
INDONESIA
MALAYSIA
FIGURE 4 – ARRIVALS GROWTH AND MARKET SHARE BY MAIN MARKETS, 2017–18 AND 2026–27
UNITED KINGDOM
SINGAPORE
JAPAN
SOUTH KOREA
2017–18 GROWTH
2018–19 GROWTH
10-YEAR GROWTH AVERAGE TO 2026–27
11.9%
3.3% 3.3% 2.9%
7.4% 7.0% 5.4%
7.0%-1.1%
3.0% 8.9% 5.8% 3.9%
2.9% 3.6% 3.3%
7.1% 6.5% 5.2%
4.4% 3.3% 2.9%
10.5% 9.6% 8.7%
4.5% 4.1% 3.8%
6.4% 5.1% 4.8%
SHARE 2017–18:
5.0%
SHARE 2018–19: 4.9%
VOLUME 2026–27: 622K
SHARE 2017–18:
2.2%
SHARE 2018–19: 2.2%
VOLUME 2026–27: 304K
SHARE 2017–18:
15.4%
SHARE 2018–19: 15.0%
VOLUME 2026–27: 1.8M
SHARE 2017–18:
4.6%
SHARE 2018–19: 4.7%
VOLUME 2026–27: 655K
SHARE 2017–18:
3.4%
SHARE 2018–19: 3.5%
VOLUME 2026–27: 642K
SHARE 2017–18:
15.4%
SHARE 2018–19: 16.3%
VOLUME 2026–27: 3.9M
SHARE 2017–18:
3.4%
SHARE 2018–19: 3.3%
VOLUME 2026–27: 399K
SHARE 2017–18:
5.1%
SHARE 2018–19: 5.1%
VOLUME 2026–27: 626K
SHARE 2017–18:
3.0%
SHARE 2018–19: 3.0%
VOLUME 2026–27: 384K
SHARE 2017–18:
8.5%
SHARE 2018–19: 7.9%
VOLUME 2026–27: 983K
SHARE 2017–18:
8.8%
SHARE 2018–19: 8.9%
VOLUME 2026–27: 1.3M

TOURISM FORECASTS 20177
2.2 DOMESTIC VISITORS
In 2017–18, only modest increases are forecast for domestic visitor nights, up 1.5% to 343 million nights, and day trips, up 2.6% to 191 million trips. This reflects a situation where Australian economic growth is expected to remain at below its historical average, and where discretionary expenditure may be reined in by slower growth in capital city house prices (particularly in Sydney and Melbourne) and by sluggish wage growth.
Domestic travel costs, particularly for accommodation in capital cities, are also likely to remain high, while continued low growth in domestic air capacity could result in higher airfares in 2017–18. One positive area is the strong likelihood that petrol prices will remain at, or near, current levels, reflecting high global oil supplies.
As economic growth picks up through 2018–19, and the Australian dollar remains near its long-term average, there will be a commensurate increase in domestic tourism activity, with domestic visitor nights up 2.9% and day trips up 3.7%.
There are also some drawcard events in 2017–18 that should boost domestic travel and international travel. Aside from the Ashes series, there are the Commonwealth Games to be held on the Gold Coast in April 2018. Estimating the impact of this event for Australian tourism is complex, however, given the lack of competing events, the timing of the Games and the proximity to large population centres, the economic impact should be significant. The impact could possibly be larger than that observed for the 2006 Melbourne Commonwealth Games (see Box 4 for more information).
FIGURE 5 – GROWTH IN DOMESTIC TRAVEL, 2016–17 TO 2026–27
2.6%
1.5%
3.7%
2.9%
2.9%
2.2%
2017–18 GROWTH
2018–19 GROWTH
10-YEAR AVERAGE TO 2026–27
DAY TRIPS DOMESTIC VISITOR NIGHTS
191.2M
198.3M
353.0M
247.4M421.4M
Over the 10 years to 2026–27, growth in domestic tourism has been moderated from that previously forecast. Day trips are now projected to increase at an average annual rate of 2.9% for the 10 years to 2026–27 (down from the previously published 4.3%), while domestic visitor nights will grow at an average annual rate of 2.2% (down from 3.5%).
These lower growth forecasts take into account a reassessment of changes to population growth and travel propensities.
In summary, ABS projections suggest that unless international migration is increased, national population growth is likely to ease from the current growth rate of 1.4% per year over the next 10 years and beyond. This, combined with information correlating estimates for trip propensities across different age groups, suggests that as more of Australia’s large baby boomer population – those born between 1946 and 1964 – become older than 75, they will travel far less in the coming decade. This is in marked contrast to the previous decade, where the baby boomer cohort were a major driver of growth in domestic travel.
However, when considering the complete age spectrum, estimated trip propensities are still expected to increase slightly over the next decade, for both day trips and overnight travel. Travel propensities for domestic overnight travel may increase further, should the Australian dollar depreciate for a sustained period.
2.3 AUSTRALIAN RESIDENT DEPARTURES (OUTBOUND)
Domestically, there are a number of factors currently affecting outbound travel, with subdued economic conditions combined with low wages growth having a negative impact on discretionary spend, including travel. At the same time, and despite a lower Australian dollar, outbound leisure package prices are expected to remain highly price competitive in 2017–18 and beyond.
The net effect of this is expected to be modest growth in outbound travel by Australian residents for the next two years, with departures expected to increase 4.0% to 10.5 million in 2017−18, and by 4.2% to 10.9 million in 2018–19.
343.2M

8
BOX 3 – CHANGES TO HISTORIC ESTIMATES USED IN DOMESTIC FORECASTS
In the March quarter 2014, TRA changed its survey methodology for the National Visitor Survey (NVS), to include mobile phone sampling as part of a new dual frame (mobile-landline) overlap survey. This change ensured the NVS would be a better representation of the Australian resident population. For more information see: NVS methodology revisions.
Following on from this, TRA undertook a major exercise in early 2017 to backcast its historical estimates for overnight travel and day travel, resulting in a change in NVS survey estimates for the 2014 and 2015 calendar years, which were subsequently published as part of the March quarter 2017 NVS release.
In terms of forecasts, the average growth rate over the five years to 2016 did not change due to the backcasting, however, backcasting did cause minor changes to the growth profile for specific financial years. For example, growth in visitor nights in 2013–14 changed from 3.1% to 3.5%, while for 2014–15 it changed from 6.4% to 5.4%. The largest change nationally was for day trips in Australia for 2013–14, where the initial estimate for a 1.6% decline was changed to an increase of 2.0%. These effects are summarised below.
REVISED ESTIMATES TO FORECAST GROWTH FROM BACKCASTING
Financial year
Domestic overnight Day tripsCurrent estimate/forecast - growth (%)
Revision to previous forecasts
Current estimate/forecast - growth (%)
Revision to previous forecasts
2013–14 (e) 3.5 up 0.4 ppts 2.0 up 3.6 ppts
2014–15 (e) 5.4 down -0.9 ppts 2.6 up 0.3 ppts
2015–16 (e) 4.3 down -0.2 ppts 7.0 down -2.7 ppts
2016–17 (e) 3.8 no change -1.0 down -5.5 ppts
2017–18 (f) 1.5 down -1.6 ppts 2.6 down -1.5 ppts
2018–19 (f) 2.9 no change 3.7 up 0.2 ppts
10-year average annual growth
2.2 down -0.8 ppts 3.0 down -1.4 ppts
*ppts = percentage points (e) estimates (f) forecasts
There were also substantial changes in subnational visitor activity and spend estimates due to these revisions. An interactive tool showing these effects can be found at tra.gov.au.
Aside from revising historical estimates for domestic tourism, TRA is now basing its domestic visitor nights forecasts on main reason for travel. Previously, these estimates were based on stopover reason. This change was made so as to be internally consistent with estimates for trip spend.
TOURISM FORECASTS 20179
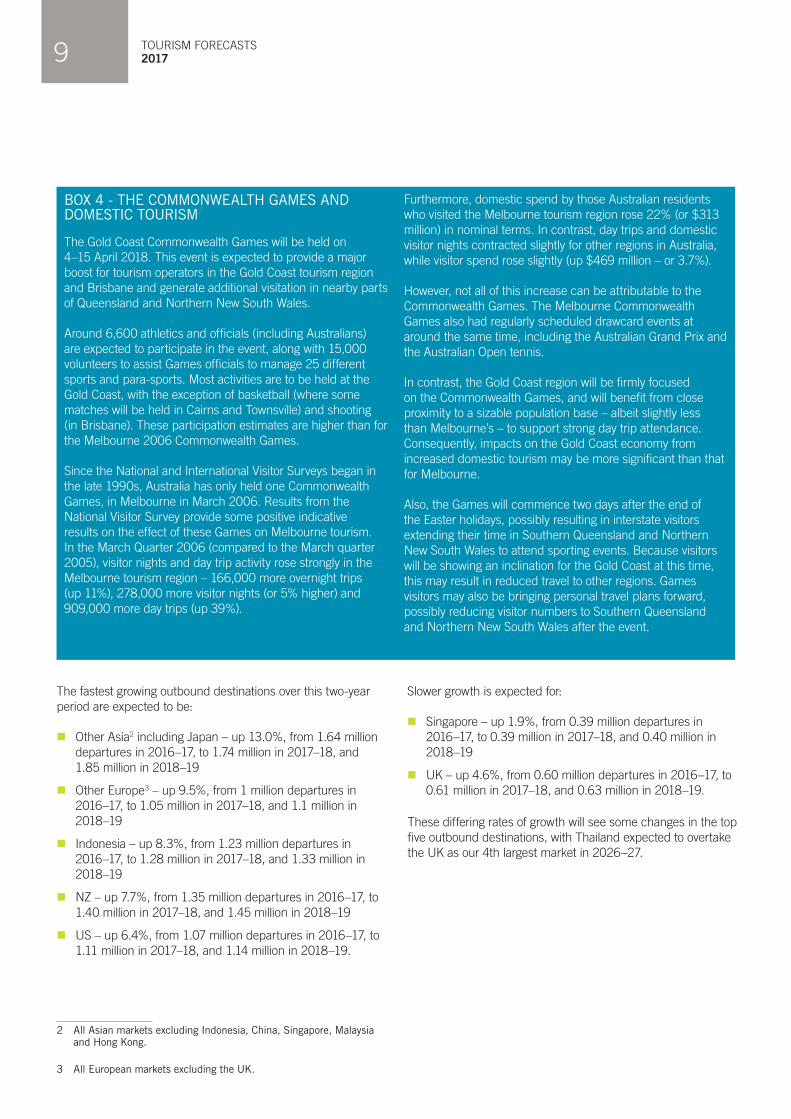
BOX 4 - THE COMMONWEALTH GAMES AND DOMESTIC TOURISM
The Gold Coast Commonwealth Games will be held on 4–15 April 2018. This event is expected to provide a major boost for tourism operators in the Gold Coast tourism region and Brisbane and generate additional visitation in nearby parts of Queensland and Northern New South Wales.
Around 6,600 athletics and officials (including Australians) are expected to participate in the event, along with 15,000 volunteers to assist Games officials to manage 25 different sports and para-sports. Most activities are to be held at the Gold Coast, with the exception of basketball (where some matches will be held in Cairns and Townsville) and shooting (in Brisbane). These participation estimates are higher than for the Melbourne 2006 Commonwealth Games.
Since the National and International Visitor Surveys began in the late 1990s, Australia has only held one Commonwealth Games, in Melbourne in March 2006. Results from the National Visitor Survey provide some positive indicative results on the effect of these Games on Melbourne tourism. In the March Quarter 2006 (compared to the March quarter 2005), visitor nights and day trip activity rose strongly in the Melbourne tourism region – 166,000 more overnight trips (up 11%), 278,000 more visitor nights (or 5% higher) and 909,000 more day trips (up 39%).
Furthermore, domestic spend by those Australian residents who visited the Melbourne tourism region rose 22% (or $313 million) in nominal terms. In contrast, day trips and domestic visitor nights contracted slightly for other regions in Australia, while visitor spend rose slightly (up $469 million – or 3.7%).
However, not all of this increase can be attributable to the Commonwealth Games. The Melbourne Commonwealth Games also had regularly scheduled drawcard events at around the same time, including the Australian Grand Prix and the Australian Open tennis.
In contrast, the Gold Coast region will be firmly focused on the Commonwealth Games, and will benefit from close proximity to a sizable population base – albeit slightly less than Melbourne’s – to support strong day trip attendance. Consequently, impacts on the Gold Coast economy from increased domestic tourism may be more significant than that for Melbourne.
Also, the Games will commence two days after the end of the Easter holidays, possibly resulting in interstate visitors extending their time in Southern Queensland and Northern New South Wales to attend sporting events. Because visitors will be showing an inclination for the Gold Coast at this time, this may result in reduced travel to other regions. Games visitors may also be bringing personal travel plans forward, possibly reducing visitor numbers to Southern Queensland and Northern New South Wales after the event.
The fastest growing outbound destinations over this two-year period are expected to be:
n Other Asia2 including Japan – up 13.0%, from 1.64 million departures in 2016–17, to 1.74 million in 2017–18, and 1.85 million in 2018–19
n Other Europe3 – up 9.5%, from 1 million departures in 2016–17, to 1.05 million in 2017–18, and 1.1 million in 2018–19
n Indonesia – up 8.3%, from 1.23 million departures in 2016–17, to 1.28 million in 2017–18, and 1.33 million in 2018–19
n NZ – up 7.7%, from 1.35 million departures in 2016–17, to 1.40 million in 2017–18, and 1.45 million in 2018–19
n US – up 6.4%, from 1.07 million departures in 2016–17, to 1.11 million in 2017–18, and 1.14 million in 2018–19.
2 All Asian markets excluding Indonesia, China, Singapore, Malaysia and Hong Kong.
3 All European markets excluding the UK.
Slower growth is expected for:
n Singapore – up 1.9%, from 0.39 million departures in 2016–17, to 0.39 million in 2017–18, and 0.40 million in 2018–19
n UK – up 4.6%, from 0.60 million departures in 2016–17, to 0.61 million in 2017–18, and 0.63 million in 2018–19.
These differing rates of growth will see some changes in the top five outbound destinations, with Thailand expected to overtake the UK as our 4th largest market in 2026–27.

10
FIGURE 6 – RESIDENT DEPARTURES, GROWTH BY MAIN DESTINATION, 2017–18 AND 10-YEAR AVERAGE TO 2026–27
2017–18
270K4.0%
2026–27
359K3.3% p.a.
MALAYSIA
2017–18
608K1.9%
2026–27
745K2.2% p.a.
UK2017–18
550K3.8%
2026–27
747K3.5% p.a.
THAILAND
2017–18
1.1M3.1%
2026–27
1.5M3.1% p.a.
US
2017–18
1.4M4.0%
2026–27
1.9M3.2% p.a.
NZ
2017–18
1.0M4.2%
2026–27
1.6M4.9% p.a.
OTHER EUROPE
2017–18
484K2.3%
2026–27
710K4.2% p.a.
CHINA
2017–18
356K4.0%
2026–27
467K3.1% p.a.
FIJI
2017–18
389K1.4%
2026–27
518K2.7% p.a.
SINGAPORE
2017–18
1.3M4.1%
2026–27
1.8M3.8% p.a.
INDONESIA 2017–18
1.7M6.5%
2026–27
2.9M5.7% p.a.
OTHER ASIA
TOURISM FORECASTS 201711
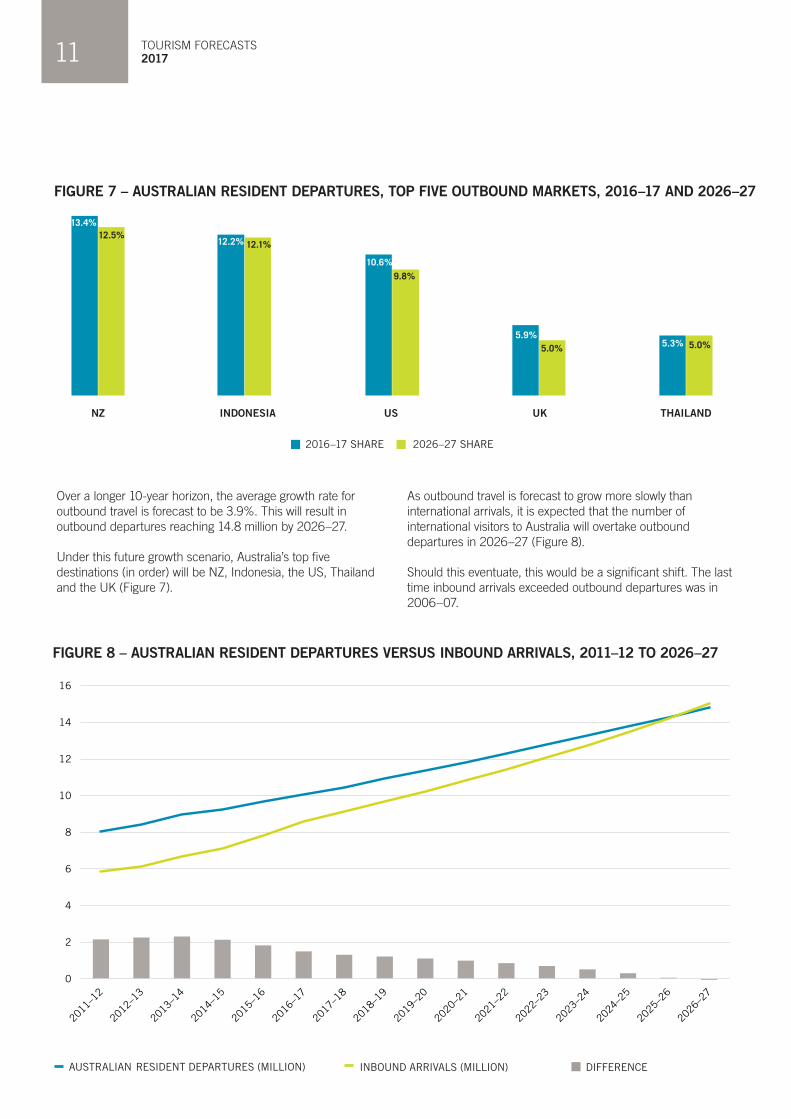
Over a longer 10-year horizon, the average growth rate for outbound travel is forecast to be 3.9%. This will result in outbound departures reaching 14.8 million by 2026–27.
Under this future growth scenario, Australia’s top five destinations (in order) will be NZ, Indonesia, the US, Thailand and the UK (Figure 7).
FIGURE 7 – AUSTRALIAN RESIDENT DEPARTURES, TOP FIVE OUTBOUND MARKETS, 2016–17 AND 2026–27
13.4%12.5%
NZ
12.2% 12.1%
INDONESIA
10.6%9.8%
US
5.9%5.0%
UK
5.3% 5.0%
THAILAND
2016–17 SHARE 2026–27 SHARE
FIGURE 8 – AUSTRALIAN RESIDENT DEPARTURES VERSUS INBOUND ARRIVALS, 2011–12 TO 2026–27
AUSTRALIAN RESIDENT DEPARTURES (MILLION) INBOUND ARRIVALS (MILLION) DIFFERENCE
0
2
4
6
8
10
12
14
16
Difference Resident Departures (million) Inbound Arrivals (million)
As outbound travel is forecast to grow more slowly than international arrivals, it is expected that the number of international visitors to Australia will overtake outbound departures in 2026–27 (Figure 8).
Should this eventuate, this would be a significant shift. The last time inbound arrivals exceeded outbound departures was in 2006–07.

12
DIFFERENCE
2.4 TOTAL TOURISM SPEND
In real terms, total tourism spend, which includes spend by international visitors, plus overnight and day trip spend by Australian residents, is forecast to increase 4.7% to $126.2 billion in 2017−18. Total spend will then increase a further 4.6% to $131.9 billion in 2018−19. Over this period, the most rapidly growing spend segment will be international travel.
These spend trends are expected to persist over the longer term, with the 10-year average growth rate of 3.7% being the net effect of:
n 6.7% average annual growth in international spend, from $39.8 billion in 2016–17 to $75.8 billion in 2026–27
n 2.1% average annual growth in domestic overnight spend, from $61.4 billion in 2016–17 to $75.5 billion in 2026–27
n 1.3% average annual growth in day trip spend, from $19.3 billion in 2016–17 to $21.9 billion in 2026–27.
FIGURE 9 – SPEND GROWTH BY TRAVEL TYPE, 2016–17 TO 2026–27
2017–18 GROWTH
2018–19 GROWTH
10-YEAR AVERAGE GROWTH TO 2026–27
9.9%
7.3%
3.0%
3.3%
2.5%
INTERNATIONAL
DOMESTIC OVERNIGHT
DAY TRIPS
6.7%
2.1%
1.3%
-0.4%
Due to these differing growth rates, there will be substantial changes in shares for each type of travel. Therefore, by 2026–27, the forecast total visitor spend of $173.3 billion (in real terms) is expected to comprise:
n a 44% share of spend from international visitors, up from 33% in 2016–17
n a 44% share of spend from domestic overnight travel, down from 51% in 2016–17
n a 13% share of spend from day trips, down from 16% in 2016–17.
By 2026–27, the five largest inbound markets in terms of visitor spend will be China, the US, the UK, NZ and India, which collectively will contribute over 58% of inbound visitor spend. China’s dominance is set to continue, and is expected to account for 46% of the increase in spend between 2016–17 and 2026–27.
Chart Title
1 2 3 4 5 6 7
Expenditure ($billion) 2016-17
China USA UK New Zealand Japan India Other
FIGURE 10 – AUSTRALIA'S SHARE OF SPEND BY INTERNATIONAL MARKET, 2016–17 AND 2026–27
CHINA
US
UK
NZ
JAPAN
INDIA
OTHER
2016–17
2026–27
TOTAL SPEND $39.8B
TOTAL SPEND
$75.8b
24.6%
9.0%
8.6%
6.7%4.4%3.5%
43.2%
34.6%
8.4%
5.7%5.1%3.7%
4.5%
38.0%
TOURISM FORECASTS 201713
3. STATE AND TERRITORY FORECASTS
Nationally, total visitor nights in Australia are forecast to increase by 4.7% in 2017–18 from 603 million nights in 2016–17 to 631 million nights. Around 46% of nights will be from international visitors, with the remaining 54% from domestic overnight travel by Australian residents.41
Visitor growth rates for 2017–18 will be largest for:
n Australian Capital Territory – total visitor nights increasing 7.0% over the year to 11.8 million nights; the result of a 3.3% increase in domestic nights and a 12.2% increase in international nights
n Queensland – total visitor nights increasing 5.7% to 146 million nights; the result of a 3.1% increase in domestic nights and a 9.7% increase in international nights
n South Australia – total visitor nights increasing 4.8% over the year to 34 million nights; the result of a 2.7% increase in domestic nights and a 9.0% increase in international nights
n New South Wales – total visitor nights increasing 4.8% over the year to 198 million nights; the result of a 0.9% increase in domestic nights and a 9.0% increase in international nights.
For other states and territories, forecast growth in visitor nights for 2017–18 is between 3.0% (Tasmania) and 4.1% (Western Australia) (Figure 11).
4 Due to the methodology used, state and territory forecasts of visitor nights do not account for persons aged under 15 years. If those under 15 are included, the national figure increases from 617 million in 2016–17 to 645 million in 2018–19.
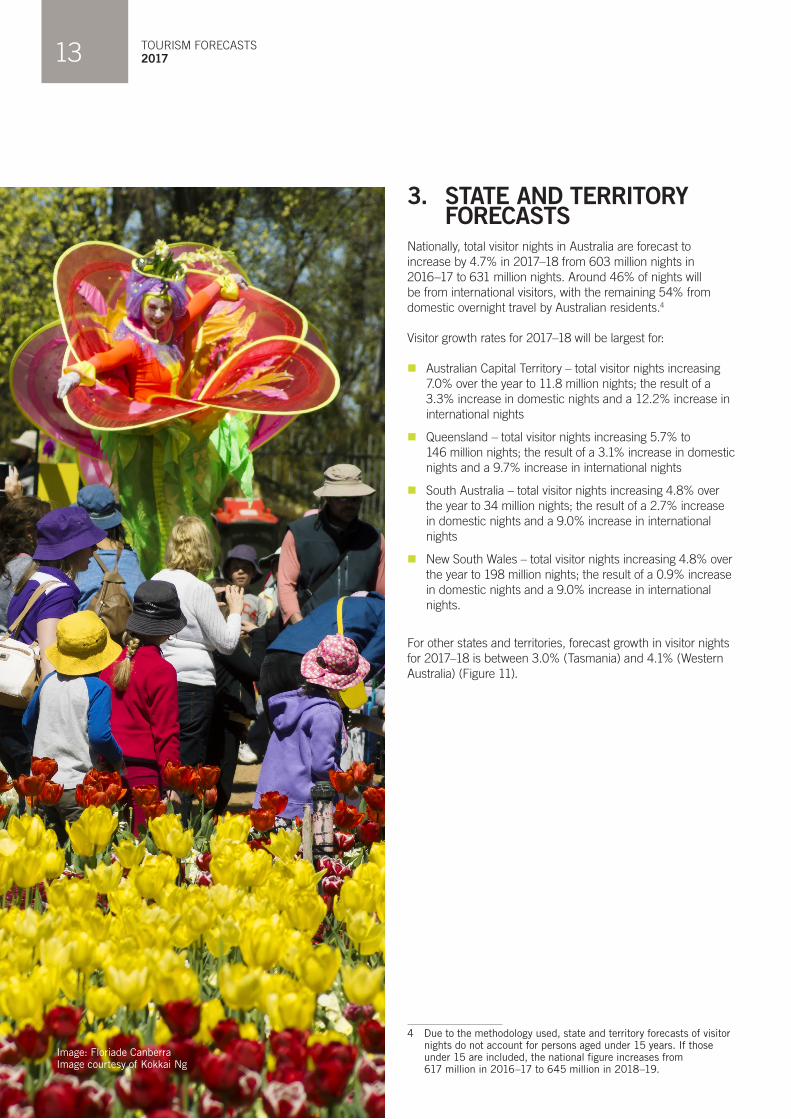
Image: Floriade Canberra Image courtesy of Kokkai Ng

14
FIGURE 11 – VISITOR NIGHTS BY STATE AND TERRITORY, 2017–18
NSWVISITOR NIGHTS: 198M 4.8%
INTERNATIONAL: 99M 9.0%DOMESTIC: 99M 0.9%
TOTALVISITOR NIGHTS: 631M 4.7%
INTERNATIONAL VISITOR NIGHTS: 288M 8.7%DOMESTIC VISITOR NIGHTS: 343M 1.5%
VICVISITOR NIGHTS: 140M 4.0%
INTERNATIONAL: 74M 7.1%DOMESTIC: 66M 0.7%
QLDVISITOR NIGHTS: 146M 5.7%
INTERNATIONAL: 59M 9.7%DOMESTIC: 87M 3.1%
SAVISITOR NIGHTS: 34M 4.8%
INTERNATIONAL: 12M 9.0%DOMESTIC: 22M 2.7%
WAVISITOR NIGHTS: 74M 4.1%
INTERNATIONAL: 31M 9.3%DOMESTIC: 43M 0.6%
TASVISITOR NIGHTS: 15M 3.0%
INTERNATIONAL: 4M 9.5%DOMESTIC: 11M 0.8%
NTVISITOR NIGHTS: 13M 3.5%
INTERNATIONAL: 4M 8.9%DOMESTIC: 8M 1.0%
ACTVISITOR NIGHTS: 12M 7.0%
INTERNATIONAL: 5M 12.2%DOMESTIC: 7M 3.3%
TOURISM FORECASTS 201715
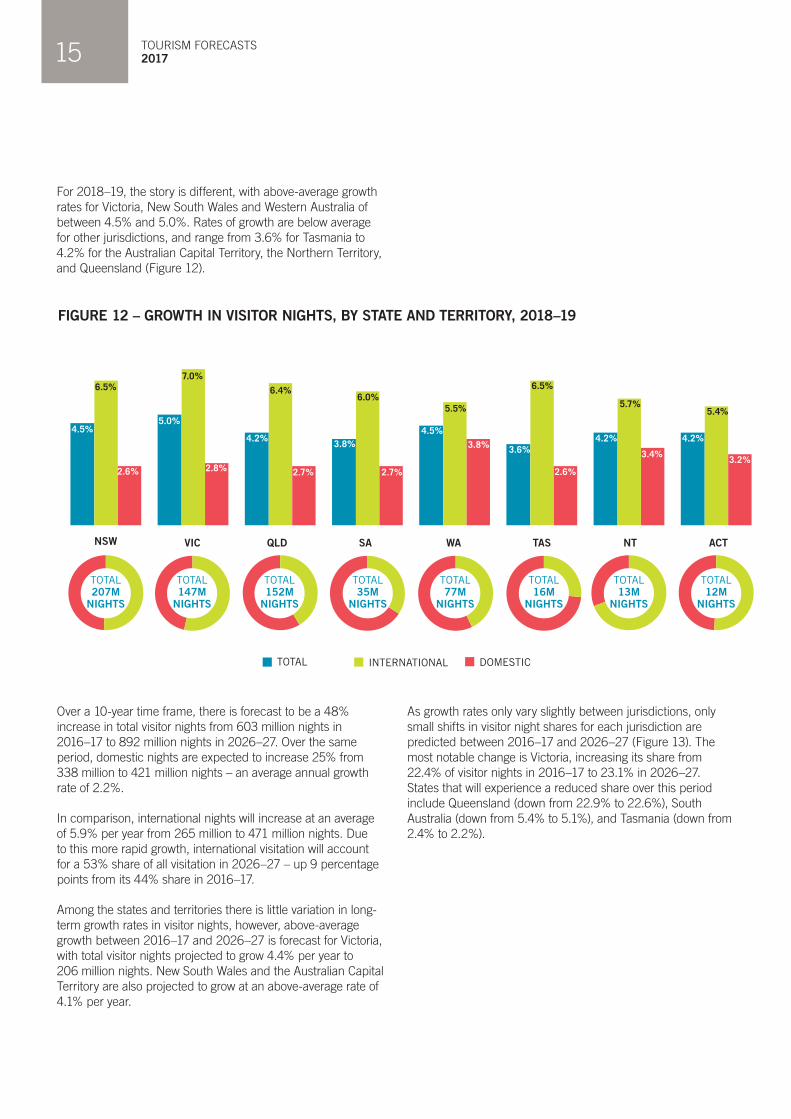
For 2018–19, the story is different, with above-average growth rates for Victoria, New South Wales and Western Australia of between 4.5% and 5.0%. Rates of growth are below average for other jurisdictions, and range from 3.6% for Tasmania to 4.2% for the Australian Capital Territory, the Northern Territory, and Queensland (Figure 12).
FIGURE 12 – GROWTH IN VISITOR NIGHTS, BY STATE AND TERRITORY, 2018–19
NSW VIC QLD SA WA TAS NT ACT
TOTAL INTERNATIONAL DOMESTIC
4.5%5.0%
4.2%3.8%
4.5%
3.6%4.2% 4.2%
6.5%7.0%
6.4%6.0%
5.5%
6.5%
5.7%5.4%
2.6% 2.8% 2.7% 2.7%
3.8%
2.6%
3.4%3.2%
TOTAL207M
NIGHTS
TOTAL147M
NIGHTS
TOTAL152M
NIGHTS
TOTAL35M
NIGHTS
TOTAL77M
NIGHTS
TOTAL16M
NIGHTS
TOTAL13M
NIGHTS
TOTAL12M
NIGHTS
Over a 10-year time frame, there is forecast to be a 48% increase in total visitor nights from 603 million nights in 2016–17 to 892 million nights in 2026–27. Over the same period, domestic nights are expected to increase 25% from 338 million to 421 million nights – an average annual growth rate of 2.2%.
In comparison, international nights will increase at an average of 5.9% per year from 265 million to 471 million nights. Due to this more rapid growth, international visitation will account for a 53% share of all visitation in 2026–27 – up 9 percentage points from its 44% share in 2016–17.
Among the states and territories there is little variation in long-term growth rates in visitor nights, however, above-average growth between 2016–17 and 2026–27 is forecast for Victoria, with total visitor nights projected to grow 4.4% per year to 206 million nights. New South Wales and the Australian Capital Territory are also projected to grow at an above-average rate of 4.1% per year.
As growth rates only vary slightly between jurisdictions, only small shifts in visitor night shares for each jurisdiction are predicted between 2016–17 and 2026–27 (Figure 13). The most notable change is Victoria, increasing its share from 22.4% of visitor nights in 2016–17 to 23.1% in 2026–27. States that will experience a reduced share over this period include Queensland (down from 22.9% to 22.6%), South Australia (down from 5.4% to 5.1%), and Tasmania (down from 2.4% to 2.2%).

16
FIGURE 13 – TOURISM SHARES, INTERNATIONAL, DOMESTIC AND REGIONAL, 2016–17 AND 2026–27
31%
23%
23%
5%
12%
2%2%
2%
39% IN REGIONAL
AREAS
45% IN REGIONAL
AREAS
31% IN REGIONAL
AREAS
47% IN REGIONAL
AREAS
43% IN REGIONAL
AREAS
46% IN REGIONAL
AREAS
50% IN REGIONAL
AREAS
892M NIGHTS,40% OF NIGHTS IN REGIONAL AREAS
2016–17 2026–27
NSW WAQLD NTVIC TASSA ACT
31%
22%
23%
5%
12%
2%2%
2%
45% IN REGIONAL
AREAS
37% IN REGIONAL
AREAS
50% IN REGIONAL
AREAS
47% IN REGIONAL
AREAS
49% IN REGIONAL
AREAS
51% IN REGIONAL
AREAS
47% IN REGIONAL
AREAS
603M NIGHTS,44% OF NIGHTS IN REGIONAL AREAS
0% IN REGIONAL
AREAS0% IN
REGIONAL AREAS
Figure 13 also shows the share of visitor nights that are forecast to be spent in the regions outside of the capital cities and the Gold Coast. This shows that regional tourism’s share of visitor nights at a national level is expected to decrease from 44.4% to 39.9% between 2016–17 and 2026–27 – a decline of 4.5 percentage points. At a state and territory level, a falling regional share of visitor nights is forecast across all jurisdictions. These falls range from 6.2 percentage points for New South Wales, down from 45.3% to 39.1%, to 1.6 percentage points for Tasmania, down from 51.4% to 49.9%.
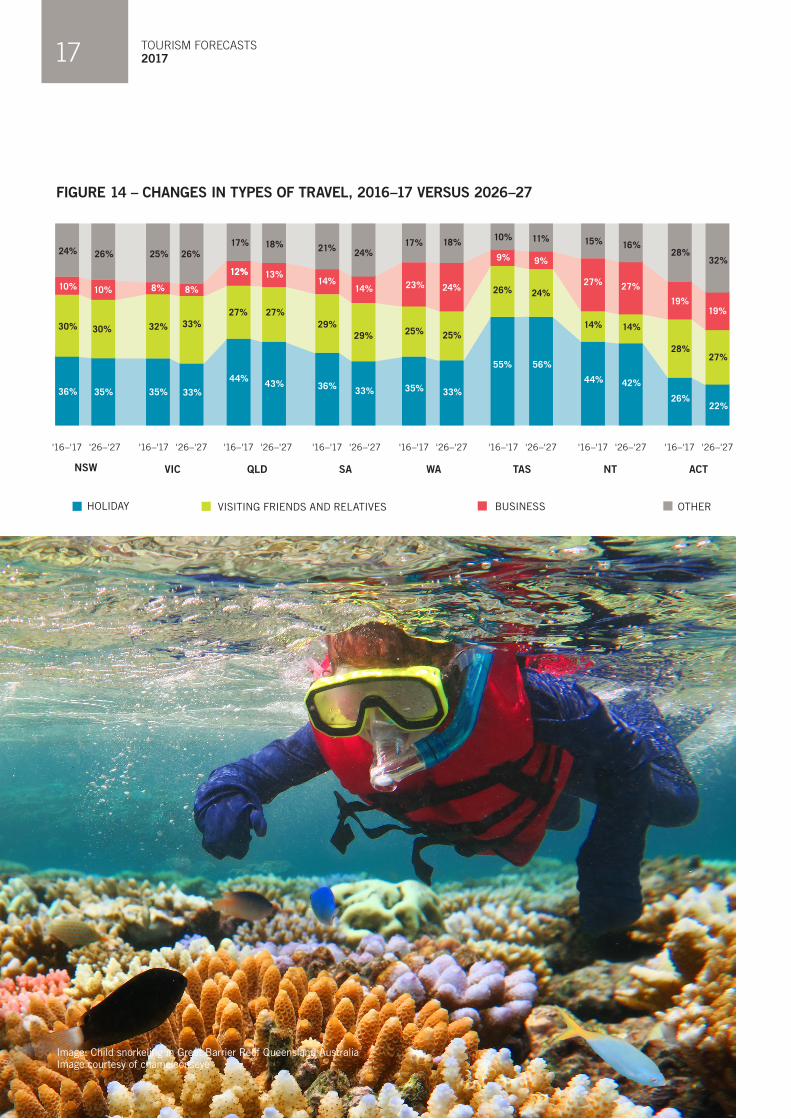
Between 2016–17 and 2026–27, ‘other travel’ – a category mostly comprising education and employment-related travel – is forecast to grow its share of visitor nights – up from 21.1% to 22.8%. Over the same period, the share of visitor nights from holiday travel will fall from 37.9% to 36.1%. There will be modest changes in the share for VFR travel (from 28.6% to 28.8%) and business travel (from 12.5% to 12.3%). Figure 14 shows how shares attributable to these types of travel will shift among different states and territories over the 10-year period.
TOURISM FORECASTS 201717
FIGURE 14 – CHANGES IN TYPES OF TRAVEL, 2016–17 VERSUS 2026–27
NSW VIC QLD SA WA TAS NT ACT
HOLIDAY VISITING FRIENDS AND RELATIVES BUSINESS OTHER
'16–'17 '26–'27 '16–'17 '26–'27 '16–'17 '26–'27 '16–'17 '26–'27 '16–'17 '26–'27 '16–'17 '26–'27 '16–'17 '26–'27 '16–'17 '26–'27
36% 35% 35% 33%44% 43% 36% 33% 35% 33%
55% 56%
44% 42%
26%22%
30% 30% 32% 33%27% 27%
29%29% 25% 25%
26% 24%
14% 14%
28%27%
10% 10% 8% 8%
12%12% 13%14%
14% 23% 24%
9% 9%
27% 27%
19%19%
24% 26% 25% 26%17% 18% 21% 24%
17% 18% 10% 11% 15% 16%28%
32%
Image: Child snorkeling in Great Barrier Reef Queensland Australia Image courtesy of chameleonseye

18
4. THE ECONOMIC FACTORS INFLUENCING THE FORECASTS
4.1 THE OUTLOOK FOR THE GLOBAL ECONOMY IS IMPROVING
International conditions continue to improve with the global economy forecast to grow by 3.5% in 2017 and 3.6% in 2018 (IMF 2017).51
The outlook for advanced economies is improving as well, with forecast growth of 2.0% for both 2017 and 2018, slightly above growth for 2016. This growth is underpinned by increasing consumer confidence and an upturn of business investment in major advanced economies such as the US, Japan, the UK and Canada.
Emerging economies are expected to grow unevenly over coming years. Resource and energy-exporting economies such as Russia and Brazil are projected to experience low growth after contracting in 2016. Asian economies, however, including China, India and Indonesia, are performing relatively well with annual rates of growth in excess of 5.0% over the forecast period. In net terms, emerging economies are forecast to grow by 4.5% in 2017 and 4.8% in 2018.
The overall picture of the world economy remains positive.
CHINA
After decades of high economic growth, China’s economy is moving from a high reliance on investment and exports as sources of growth, towards a more sustainable growth path. This has seen Chinese growth moderate in recent years and a shift towards household consumption as an important driver of economic growth. In this more consumer oriented environment, spending on international education and tourism is expected to increase.
Against this backdrop, China’s economy is expected to grow 6.3% and 6.1% respectively in 2017–18 and 2018–19, still well above the growth of most other economies. This rapid rate of growth will ensure that the Chinese middle class will continue to swell – providing an important enabler for international travel.
NZ
The economic growth of NZ has exceeded expectations in recent years and is gaining momentum. The stronger growth of service sectors and construction has more than offset declines in the manufacturing and agriculture industries. These positive net effects should underpin solid growth in consumer spending on domestic and outbound travel.
5 “World Economic Outlook: Gaining Momentum?”, International Monetary Fund, April 2017.
Looking forward, these positive trends are expected to continue over the next two years with the economy forecast to grow by 3.1% in 2017–18 and 2.8% in 2018–19.
THE US
The US economy is expected to strengthen over the next two years as a result of greater government spending, solid growth in private consumption and strong business confidence. Consumer confidence is also improving as the US labour market nears full employment.
Overall, the US economy is expected to grow by 2.3% in 2017–18 and 2.2% in 2018–19.
THE UK AND EUROZONE
In the wake of the turmoil arising from the June 2016 Brexit referendum, the UK economy demonstrated considerable resilience with better-than-expected economic growth of 1.8% for 2016. Following on from this, the UK economy is forecast to grow by 1.7% in 2017–18 and 1.5% in 2018–19. However, the UK’s medium-term economic outlook is overshadowed by additional trade and migration barriers, following the UK-EU negotiations.
In the Eurozone, economic recovery is continuing slowly with positive signs of an improving job market and increasing consumer confidence, noting however that growth among key economies remains uneven. This modest recovery is expected to be supported by a mildly expansionary fiscal policy, more positive financial conditions and positive spillovers from a likely US fiscal stimulus. However, the UK’s exit from the European Union is likely to have a long-term negative impact on the Eurozone economy. Adding to this uncertainty are concerns about the health of the European banking sector and the European Central Bank’s extreme monetary policy.
JAPAN
In 2016, the Japanese economy experienced slow growth of 1.1% due to improved domestic demand and a strong export performance. The slow pace of economic growth is expected to continue, with forecasts of 1.2% in 2017–18 and 1.0% in 2018–19 – still below that of most advanced economies. However, the Japanese economy is expected to remain in low-growth territory due to a persistently low inflation rate, high government debt and a shrinking labour force brought about by an aging population. The economic prospect is further clouded with the country’s consumption tax scheduled to increase in October 2019 from 8% to 10%.

TOURISM FORECASTS 201719
INDIA
India’s economy has exhibited spectacular growth over the last few years and is expected to be the leading performer among Australia’s top 10 tourism source markets in coming years. Despite the temporary consumption shock brought about by cash shortages, and payment disruptions from the recent currency initiative, India’s economy is projected to increase by 7.4% in 2017–18 and 7.5% in 2018–19. The forecast growth is supported by government structural reform programs including the introduction of a national Goods and Services Tax, a new bankruptcy code and measures to promote financial inclusion and improve business conditions.
The higher economic growth will flow on to wider society, increasing the size of middle-income groups, and adding to travel propensities.
4.2 AUSTRALIA IS HEADING TOWARDS TREND GROWTH
The Australian economy is expected to rebound from lower-than-expected growth of 1.8% in 2016–17 to approach its trend rate of growth over the next two years. The Treasury forecast real GDP to grow by 2.75% in 2017–18, increasing to 3.0% in 2018–19.
The improved growth prospects are supported by increases in household consumption and non-mining business investment, plus greater exports due to a more competitive exchange rate. These forecasts assume that the Australian dollar will average US$0.72 in 2017–18 and US$0.74 in 2018–19. The lower value of the Australian dollar, if maintained, is also expected to continue driving the growth of international visitor spend in Australia in the coming years.
A number of other favourable factors, including relatively low fuel prices, an improving jobs market and historically low interest rates, will encourage increased consumer spend, but this may be offset to an extent by continued low real wage growth. The Treasury forecasts the Australian unemployment rate to reduce to 5.75% in the June quarter of 2017–18 and to 5.5% the following year. Wage growth is expected to improve but remain subdued in 2017–18 and 2018–19, while real household consumption growth is forecast to rise to 2.75% in 2017–18 and 3.0% in 2018–19.
Image: Young Asian barista serving coffee to female customer in cafe Image courtesy of JohnnyGreig
20
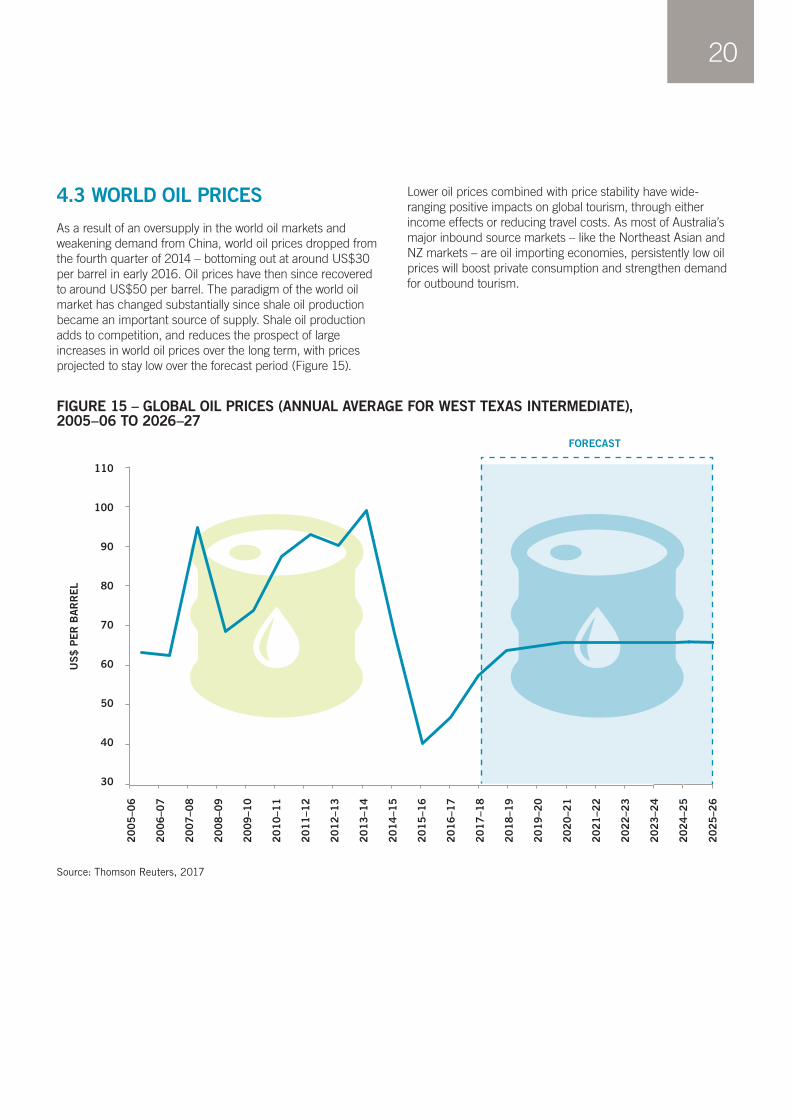
FIGURE 15 – GLOBAL OIL PRICES (ANNUAL AVERAGE FOR WEST TEXAS INTERMEDIATE), 2005–06 TO 2026–27
20
05
–06
20
06
–07
20
07
–08
20
08
–09
20
09
–10
20
10
–11
20
11
–12
20
12
–13
20
13
–14
20
14
–15
20
15
–16
20
16
–17
20
17
–18
20
18
–19
20
19
–20
20
20
–21
20
21
–22
20
22
–23
20
23
–24
20
24
–25
110
100
90
80
70
60
50
40
30
US
$ P
ER
BA
RR
EL
FORECAST
20
25
–26
4.3 WORLD OIL PRICES
As a result of an oversupply in the world oil markets and weakening demand from China, world oil prices dropped from the fourth quarter of 2014 – bottoming out at around US$30 per barrel in early 2016. Oil prices have then since recovered to around US$50 per barrel. The paradigm of the world oil market has changed substantially since shale oil production became an important source of supply. Shale oil production adds to competition, and reduces the prospect of large increases in world oil prices over the long term, with prices projected to stay low over the forecast period (Figure 15).
Lower oil prices combined with price stability have wide-ranging positive impacts on global tourism, through either income effects or reducing travel costs. As most of Australia’s major inbound source markets – like the Northeast Asian and NZ markets – are oil importing economies, persistently low oil prices will boost private consumption and strengthen demand for outbound tourism.
Source: Thomson Reuters, 2017

TOURISM FORECASTS 201721
5. OTHER DRIVERS INFLUENCING THE FORECASTS
5.1 AVIATION
INTERNATIONAL AVIATION
International aviation capacity to Australia grew 8.6% over the first three-quarters of 2016−17. At the same time, there has been slightly larger growth in seat capacity than in passenger numbers. This has resulted in a slightly lower passenger load factor of 81.4% in the first nine months of 2016–17, compared to the same period in 2015–16. Based on the Northern Summer Timeline (2017) and other market intelligence, TRA expects further gains in the last quarter of the financial year, with total inbound aviation capacity forecast to grow 11.6% in 2016–17.
Looking forward, TRA expects inbound air capacity to grow 5.6% in 2017–18 and 5.5% in 2018–19, on the back of the improved financial performance of major international airlines, buoyant passenger demand, and lower oil prices. In the longer term, average annual growth of 5.0% is projected over 2017–18 to 2026–27.
CHINA AND OTHER NORTHEAST ASIAN MARKETS
The first nine months of 2016–17 saw inbound aviation capacity from China increase 20.3% compared with the same period in 2015–16, mainly due to increased activity from non-traditional operators in China’s second tier cities. Based on market intelligence for the last quarter of the financial year, TRA estimates that inbound aviation capacity from China to have grown 31% over the full 2016–17 financial year.
A significant event impacting on air routes between China and Australia is the open skies pact with China which was signed in December 2016. This has removed any administrative restrictions on expanding aviation capacity between the two countries and liberalised traffic rights and code share arrangements as well.
Looking forward, strong growth is expected to be sustained over the next few years with growth to be sourced largely from ‘new’ airlines and second-tier cities such as Wuhan, Chengdu and Xian rather than the traditional operators and the first-tier cities of Shanghai, Guangzhou and Beijing. TRA forecasts that inbound aviation capacity from China will grow 11.8% and 10.0% in 2017–18 and 2018–19 respectively.
The first nine months of 2016–17 also saw inbound capacity from Japan increase 10.1% as a result of All Nippon Airways (ANA) re-entering the Australian market and Qantas commencing weekly services between Melbourne and Tokyo. TRA forecasts 6.3% growth of inbound aviation capacity from Japan in 2017–18, based on market intelligence that Japan Airlines may start services to Melbourne in the near future. Growth is expected to slow to 3.1% in 2018–19.
Inbound air capacity from South Korea increased 5.5% in the first nine months of 2016–17, largely due to Korean Air replacing its Boeing 777s with larger A380s from late 2015. With the fleet roll-out nearly complete, flat growth in total inbound air capacity is expected for 2017–18 and 2018–19.
Other new capacity in the Northeast Asian market is expected to be sourced from Hong Kong where some low-cost carriers (LCC) may expand services.
SINGAPORE AND SOUTHEAST ASIAN MARKETS
As an aviation hub, inbound aviation capacity from Singapore increased 6.8% in the first nine months of 2016–17, with Singapore Airlines dominating the route and flying with high frequency to major Australian airports. Based on market intelligence, TRA expects air capacity between the Singaporean and Australian routes to increase 5.2% in 2017–18 and 5.3% in 2018–19.
LCC are expected to contribute strongly to growth of inbound air capacity from other Southeast Asian markets. Malaysia Airlines have stabilised their operation after significant cutbacks, while new LCC have increased services, with growth expected to continue into the future.
Growth in air capacity between Australia and Indonesia has been largely driven by Australian outbound visitors with Jetstar, Virgin Australia and Garuda being the major carriers. However, market intelligence indicates that Indonesian LCC activity is expected to increase in the future. Meanwhile, for routes between Thailand and Australia, Thai International regularly adjusts frequency and capacity to match their demand. In future, it is expected that LCC operations will increase on these routes.
Major areas for future growth in Asia include Vietnam and the Philippines. In the case of the Philippines, LCC activity may increase from airports other than Manila.
NZ
Over the last nine months of 2016–17, direct air capacity from NZ increased 9.0% over the same period in 2015–16. While much of the growth has been due to a surge in the capacity of Jetstar, growth has also been sourced from other major carriers, including Qantas, Virgin and Air New Zealand.
US AND CANADA
For the first nine months of 2016–17, direct air capacity between Australia and the US contracted slightly as a result of United Airlines replacing B747 aircraft with B777-2000 and B787-8 aircraft. Market intelligence suggests that Qantas and American Airlines plan to add at least two new trans-Pacific routes over the next five years, which bodes well for solid capacity growth in the market.

22
Over the same period, seat capacity between Australia and Canada nearly doubled due to Air Canada commencing daily services from Brisbane to Vancouver. Air Canada announced a peak period operation between Melbourne and Vancouver from December 2017 to February 2018 with thrice-weekly 787-9 services. It is expected that this operation will eventually grow to a daily service.
UK
British tourists come to Australia via a number of hubs in the Middle East and Southeast Asia with the major carriers being Emirates, Qantas, Etihad and Singapore Airlines. Qantas has announced that it will start a new direct flight from Perth to London from April 2018. At the same time, it will reduce capacity in other areas by replacing the daily A380 from Melbourne to London with the smaller Boeing 787-9 on the Melbourne-Perth-London route.
MIDDLE EAST
It is expected that expansion of operations by the three Middle East airlines (Emirates, Etihad and Qatar) will continue in future with an increase in the size of aircraft travelling to Australian destinations and the addition of new services. This should see capacity grow at an average annual rate of 10% over the next 10 years.
DOMESTIC AVIATION
In 2017, about one-quarter (24%) of Australian domestic overnight trips involved air transport. Domestic air capacity influences the business travel segment more than any other travel segment.
The growth of domestic air capacity has been low since 2013–14, following strong growth during the peak of the mining boom. In more recent years, major domestic carriers have reduced seat capacities in order to increase passenger loads and maintain yields. In this context, TRA expects flat growth for 2017–18 before growth picks up to 4.0% in 2018–19.
5.2 ACCOMMODATION
ACCOMMODATION PERFORMANCE
In 2015–16, the Australian accommodation sector continued to perform well according to the ABS’ Survey of Tourist Accommodation:
n National room supply increased 1.4% to 249,131 rooms. This was driven by stronger growth in capital cities (up 2.1% to 133,153 rooms) compared to regional areas (up 0.6% to 116,978 rooms)
n Accommodation demand (room nights occupied) increased 3.7% (or 2.1 million nights) to 59.8 million nights. This increase in demand saw room occupancy increase 1.2 percentage points to 66%
n Revenue per room night available (RevPAR) continued to increase (up 3.8% to $115 per night) driven by capital cities (up $4.20 to $145 per night), but regional areas continued to increase at rates above inflation (up $3.70 to $81 per night).
ACCOMMODATION OUTLOOK
According to Deloitte Access Economics’ (DAE) Tourism and Hotel Market Outlook 2017, strong growth in tourism demand is expected to continue to deliver positive results for the accommodation sector, heavily dominated by supply expectations:
n Room stocks are expected to expand by 15,800 rooms by December 2019, with 122 establishments in the supply pipeline
n Room occupancy is expected to reach 70.8% by December 2019. This is somewhat lower than previous forecasts due to greater increases in supply, with room nights available expected to expand 2.1% per year, while room nights occupied will increase by 2.7% per year.
n Average room rates are expected to increase 2.5% per year, driving RevPAR up 3.1% per year to $123 by December 2019.
The development pipeline remains relatively large for Sydney, Melbourne, Brisbane and Perth, with these markets expected to drive room supply. While the supply-demand differential is notably lower than observed in previous years, it is expected that some of this excess demand will be supported by other ‘non-traditional’ accommodation options, including the sharing economy.

23
6. RISKS TRA’s tourism forecasts represent the most likely outcomes given past trends, current information and the impact of known policy changes. The current information includes macroeconomic and industrial (mainly aviation and accommodation) forecasts and sentiment indices, plus external specialist agencies and market intelligence. As with all forecasts, any variations in the assumptions or any disruptive events could produce risks that may drive tourism forecasts either upward or downward.
A range of uncertainties centre around the global economic outlook, which have the potential to decrease inbound tourism:
1. There is considerable uncertainty surrounding China’s smooth transition to the consumption and services-driven growth model. A scenario of much-lower-than expected growth for China’s economy will not only pose risks to consumers’ income, but will also exacerbate capital outflows. Should this eventuate, capital controls, foreign exchange restrictions, or currency devaluation could be policy options.
2. In the US, any inward shift in policies towards protectionism would lower global economic growth through restraining trade and investment flows.
3. In Europe, any unexpected outcome surrounding the post Brexit UK-EU negotiation would cast a shadow over the outlook for European economic growth.
Another real risk lies with the assumed value of the Australian dollar. While TRA adopts Consensus Economics’ forecasts of exchange rates and advice from its Tourism Forecasting Reference Panel, there is a diversity of opinion on the subject, reflecting varying views on the significance of future policy change. For example, a sooner-than-expected set of interest rate hikes in the US could drive the value of the Australian dollar lower than what has been assumed, tilting the risks of TRA’s tourism forecasts to the upside.
Major geopolitical events, which are both difficult to predict and difficult to quantify will also disrupt underlying assumptions. These events include any terrorists’ attacks, infectious disease outbreaks, and military tensions between Australia’s major trading partners.
7. DATA SOURCESAirport Coordination Australia, S2017 Scheduling
Australian Bureau of Statistics
n Overseas Arrivals and Departures, April 2017 (ABS Cat. No. 3401.0)
n Tourism Satellite Account, 2015–16 (ABS Cat. No. 5249.0)
n Tourist Accommodation, 2015–16 (ABS Cat. No. 8635.0)
Bureau of Infrastructure, Transport and Regional Economics (BITRE)
n Domestic Airline Activity (April 2017 issue)
n International Airline Activity (March 2017 issue)
Consensus Economics Inc.
n Asia-Pacific Consensus Forecasts (various issues)
n Consensus Forecasts (various issues)
n Foreign Exchange Consensus Forecasts (various issues)
Commonwealth Treasury, Budget Strategy and Outlook 2017–18, Budget Paper No. 1
Deloitte Access Economics (DAE), Tourism and Hotel Market Outlook, 2017
Department of Immigration and Border Protection, Overseas Arrivals and Departures (unpublished database)
International Monetary Fund, Word Economic Outlook (April 2017 issue)
Reserve Bank of Australia
Thomson Reuters Database
Tourism Australia
n Quarterly Market Update (2017)
n Market Profiles (2017)
Tourism Research Australia (TRA)
n International Visitor Survey – Year Ending March 2017 Results of the International Visitor Survey
n Travel by Australians – Year Ending March 2017 Results of the National Visitor Survey
n Tourism Investment Monitor, 2016
n Tourism Forecasts (various issues)
Related Documents