March 2015 IPA.CO.UK TOUCHPOINTS5: THE POWER OF PASSIVE DATA

Welcome message from author
This document is posted to help you gain knowledge. Please leave a comment to let me know what you think about it! Share it to your friends and learn new things together.
Transcript
March 2015
IPA.CO.UK
TOUCHPOINTS5:
THE POWER OF PASSIVE DATA

1
2
Contents 1. Executive Summary ............................................................................. 1
2. Introduction ....................................................................................... 3
3. Methodology and sample ....................................................................... 4
4. What are people doing on their smartphones .............................................. 6
A. Communication ........................................................................... 9
B. Social Media .............................................................................. 12
C. Media Content ............................................................................ 15
D. General Commerce ...................................................................... 18
5. How are they using their smartphones ..................................................... 21
Online vs. offline use ....................................................................... 21
Apps v browser .............................................................................. 21
Location ...................................................................................... 21
Use as a second screen ..................................................................... 22
6. Going forward ................................................................................... 23
Annex A. Taxonomy for Passive Data in TouchPoints5 ..................................... 24

1
TouchPoints5: The Power of Passive Data
1. Executive Summary
Passive monitoring of mobile phone use allows us to understand more accurately what people are doing on their phones, for how long and by what means without relying on the claims or memory of a user. Focusing on Communications, Social Media, Media Content and General Commerce, this report considers this passive data and also how its impact can be enhanced by combining it with attitudinal or behavioural elements captured through the TouchPoints survey.
Key highlights:
Overall use
On average, young people use their phones every couple of minutes Adults use their phones for an average of 264 times a day, including voice calls and texting. This increases to 387 sessions for 15-24 year olds which, when the amount of time they are awake is taken into account, is equivalent to using their phones every other minute.
Men are more likely to access sports information but women are more likely to access health and fitness sites The most used functions on a mobile are phone (voice calls or texting) and the built-in facilities (e.g. camera, calendar). There are some differences according to gender, for example, men are more likely to access information about people taking part in sport whereas women are more likely to access information about their own fitness.
A. Communications
Mobile phones are primarily a communication device Despite the multiple uses and internet access available on a mobile, they are primarily a communication device with around half of time spent on these devices being used for engaging with other people, increasing to 57% of time among young people.
Smartphones are least like to be used for communications at a weekend Using a phone for communication peaks on a Thursday evening as people begin preparing for the weekend. However, the need to communicate at a weekend drops with the lowest communication activity occurring on a Saturday and Sunday.
B. Social Media
Over half of young people in the sample use WhatsApp The free messaging service WhatsApp is the most used messaging service with over two-fifths of smartphone users in the sample using this service. This increases to 53% of young those aged 15-24.

2
Use of communication apps may not always be good for us Being accessible by and available on a range of technology communication methods may be affecting the amount of time people relax. For example, 63% of adults think there aren’t enough hours in the day but his increases to 82% of those who use Skype. Similarly, young people who use WhatsApp are more likely to say they are feeling more stressed these days.
Nearly nine in ten access social networking sites Ninety two per cent of the sample accessed social media, primarily driven by social networking sites such as Facebook.
Almost three quarters of young people use either Instagram or Snapchat Photo sharing sites are more likely to be used by 15-24 year olds with Instagram or Snapchat being the preferred brands. Cool Iris is the brand favoured by older users of this type of social media.
Sunday is the most likely day to access Facebook on a mobile Although people are less likely to use communications in general on a mobile at weekends, Sunday is when people are most likely to use Facebook this way especially for those with a large number of Facebook contacts.
C. Media Content
Three out of four use smartphones to view streamed AV content On average people spend nine minutes each day accessing some form of media content on their mobile phones. This is most likely to be streamed AV content with three quarters of those in the sample accessing this type of content, increasing to 84% of 15-24 year olds.
YouTube is the most popular destination for streamed AV content The availability of short clips on YouTube is likely to be behind the popularity of this service for AV content on mobiles with almost two thirds of adults (64%) accessing content via this brand.
D. General Commerce
25-44 year olds are most likely to access retail sites via their phones Over three quarters of adults accessed general commerce apps or browsers in the sample period. This is particularly driven by the 25-44 age group who are the most likely to access sites offering a range of different types of products such as eBay or Amazon. Younger people are most likely to access sites selling tickets for events.
Amazon is twice as popular as eBay for older smartphone users Although eBay and Amazon are accessed by a similar amount of adults overall (45% and 43% respectively), those aged over 65 are twice as likely to use Amazon as eBay (31% v 15%).
Mobile phones are used most often at home rather than when mobile Despite the name, most mobile phone use is when users are at home with 68% of activity carried out in the location.

3
2. Introduction
Mobile phones are now a fixture of everyday life: at the start of the millennium, half of UK adults claimed to own a mobile phone; fourteen years later this stands at 93% of adults 1 . A large majority of these are ‘smartphones’ (61% of adults own a smartphone 2 ), allowing users to access the internet from wherever they are. Smartphones3 are also used to facilitate a vast array of other activities by offering a seemingly unlimited range of functions and apps such as a camera, travel and weather apps, a calendar to organise your day as well as apps that allow you to order your groceries on your way home.
As the range of technology devices and their capabilities increases, people are spending more of their time using media and communication sources through multiple access points. To understand this behaviour and consumer attitudes towards personal use of media and communications devices, IPA developed the TouchPoints survey. Launched in 2006, TouchPoints has been repeated every two years4 and offers a deep insight into consumer behaviour and activities in half hour segments across a seven day period.
Using this research, we can understand a considerable amount about what people do from the moment they wake up to when they go to bed at the end of the day. We also know what they think about the technology they use. For example, just over half (56%) of those with a mobile phone agree they could not imagine life without this device increasing to 72% of smartphone users. Over half of smartphone users (51%) say they never turn off their phones, increasing to 58% of 25-34 year olds.
In addition to claimed behaviour and attitudes, for the first time TouchPoints5 utilised passive mobile measurement to provide a comprehensive overview of all activity taking place on a smartphone. Using an app downloaded to the respondent's own smartphone, a reading was taken every 10 seconds to capture all smartphone activity over a 28 day period. This pioneering research enables us to consider consumer attitudes in conjunction with actual mobile phone use.
Focusing on this passive data, this report provides an overview of how mobile phones facilitate daily life.
Ofcom Communications Market Report 2014 lbidThroughout the remainder of this report the term ‘mobile phone’ will be used to refer to smartphones4 From 2015 the Touchpoints survey will be carried out annually

4
3. Methodology and sample
TouchPoints is based on a representative sample of c5,000 adults aged 15+, living in Great Britain. Each respondent is asked to complete a paper questionnaire covering aspects such as attitudes, product ownership, shopping, media behaviour. In addition, they also keep an e-diary detailing their activities on a half hourly basis over a seven day period
A new element added within TouchPoints5 was among a sub-sample who downloaded an app onto their smartphone which passively measured their mobile phone behaviour over a four-week period.
In total, 1,159 TouchPoints5 participants installed the passive app on their phone which returned at least 21 days of passive data out of a 28-day period. 690 participants were Android, BlackBerry and Symbian users who, in addition to the 28-day period, returned passive data in the same 7-days they completed the e-diary and the self-completion questionnaire.
For the remainder of the participants (469), their passive data collection period did not overlap with the week they completed the e-diary and the self-completion questionnaire. The vast majority of these participants were iOS users.
There are differences in the demographics of the iOS sample and the Android, Blackberry and Symbian users. These differences may impact on any findings when only looking at the 7-day sample who are Android, Blackberry or Symbian smartphone users. The three charts below illustrate some key differences in terms of gender, age and socio-economic classification. Although the full sample is evenly split between male and female, the Android, Blackberry or Symbian users are more likely to be male compared to iOS users – 54% v 45% (Figure 1).
When we consider age, figure 2 shows that 55% of iOS users in the sample are under 35 compared to around half of the Android, Blackberry and Symbian users (49%). There are also differences in the socio-economic status with around a third (32%) of iOS users classified as AB compared to 28% of the other users in the passive data sample (Figure 3).
Figure 1 Gender profile of passive data participants
Source: TouchPoints5

5
Figure 2 Age profile of passive data participants
Source: TouchPoints5
Figure 3 Socio-economic profile of passive data participants
Source: TouchPoints5
In order to make sense of the passive data, the different uses of a mobile phone have been organised into 15 distinct categories (Figure 4). These are then broken down into a further 101 sub-categories (e.g. email or clothing/fashion) and then into 484 specific items (e.g. Outlook or Asos). The full taxonomy is available in the appendix. The main emphasis of this report will be the Communication, Social, Media Content and General Commerce categories.
Figure 4 Defined categories of mobile phone uses
Category
Phone
Communication
Social
Games
Media content
General commerce
Search and portals
Sports and gaming
Technology commerce
General interest
Reference
Travel
Personal finance and real estate
Health
Other
Utility
6
4. What are people doing on their smartphones
Mobile phones are more than just portable telephones: they enable text communications via SMS or email, they can connect to the internet through wifi or data networks, they can be integral to leisure time such as providing games or recipe apps and they also offer calendar and camera tools. This section looks at the use of the different categories and how they differ by age.
Overall use
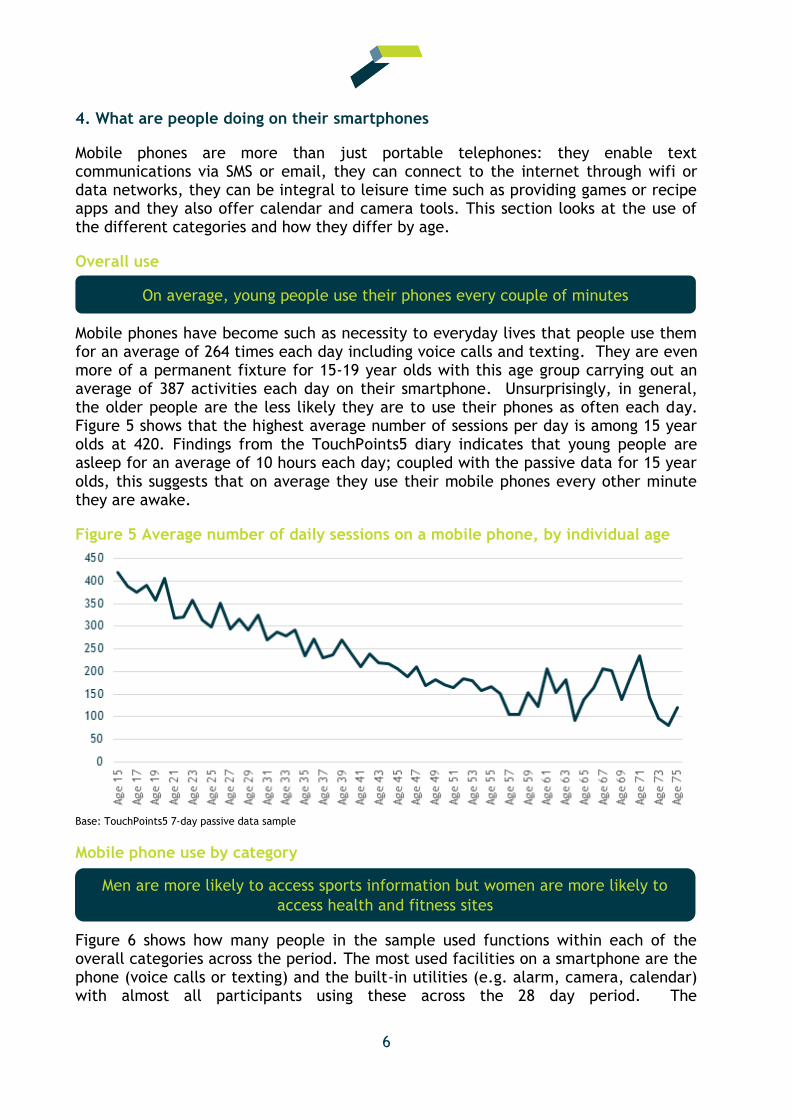
Mobile phones have become such as necessity to everyday lives that people use them for an average of 264 times each day including voice calls and texting. They are even more of a permanent fixture for 15-19 year olds with this age group carrying out an average of 387 activities each day on their smartphone. Unsurprisingly, in general, the older people are the less likely they are to use their phones as often each day. Figure 5 shows that the highest average number of sessions per day is among 15 year olds at 420. Findings from the TouchPoints5 diary indicates that young people are asleep for an average of 10 hours each day; coupled with the passive data for 15 year olds, this suggests that on average they use their mobile phones every other minute they are awake.
Figure 5 Average number of daily sessions on a mobile phone, by individual age
Base: TouchPoints5 7-day passive data sample
Mobile phone use by category
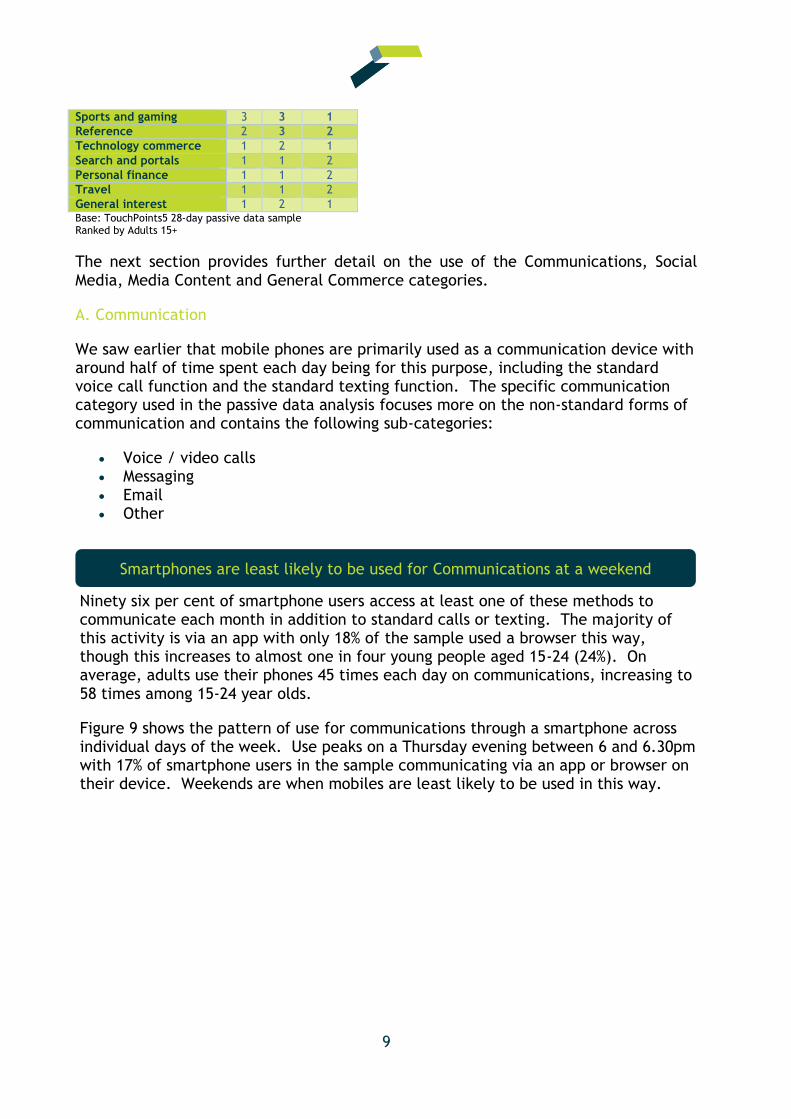
Figure 6 shows how many people in the sample used functions within each of the overall categories across the period. The most used facilities on a smartphone are the phone (voice calls or texting) and the built-in utilities (e.g. alarm, camera, calendar) with almost all participants using these across the 28 day period. The
On average, young people use their phones every couple of minutes
Men are more likely to access sports information but women are more likely to
access health and fitness sites

7
communications facilities such as email or messaging are also used by the majority of participants.
Ninety two per cent of participants accessed media content on their smartphones across the period, increasing to 97% of those aged 25-34. Those aged 45-64 are the least likely to access media content this way though it is still used by over two fifths of these age groups.
Social media apps and sites are most likely to be accessed by young people with 97% using their phones this way, increasing to 98% among 15-19 year olds.
There are some differences in use according to gender. For example, 68% of women access games on their phones compared to 63% of men; men are more likely to access sports content this way (29% v 19% of women); and women are more likely to use their phones to access medical or fitness advice (39% v 22% of men).
Figure 6 Monthly reach of each category of passive data, by age
15+ 15-24 25-34 35-44 45-54 55-64 65+
Phone 100% 100% 100% 100% 100% 99% 100%
Utility 100% 100% 100% 100% 100% 98% 100%
Communications 96% 97% 97% 95% 94% 94% 88%
Other 95% 97% 97% 95% 93% 90% 97%
Technology commerce 94% 95% 95% 93% 94% 88% 91%
Reference 94% 95% 95% 93% 93% 93% 90%
Media content 92% 95% 97% 91% 84% 83% 91%
Social media 92% 97% 95% 93% 86% 75% 79%
Search and portals 86% 89% 88% 87% 86% 77% 72%
General commerce 76% 77% 84% 79% 69% 58% 54%
Games 65% 73% 68% 69% 57% 45% 36%
Personal finance 52% 52% 64% 50% 40% 43% 36%
General interest 33% 35% 38% 33% 27% 20% 17%
Sports and gaming 32% 26% 33% 37% 29% 35% 41%
Health 30% 34% 37% 30% 22% 16% 18%
Travel 21% 21% 24% 21% 18% 20% 7%
Base: TouchPoints5 28-day passive data sample Ranked by Adults 15+
On average, adults spend 83 minutes each day on their mobile phones. Although smartphones can be used as a tool to engage in and access information on all of the
Mobile phones are primarily a communication device

8
defined categories, the passive data indicates that their main use is as a communication tool. A fifth of time (20%) spent on a mobile phone in an average day is on voice calls or texting followed by 19% on social media apps or sites. In total, around half (49%) of time spent on a mobile phone involves communicating with others, increasing to 57% for 15-19 year olds.
The age group who use their phones for the longest amount of time each day are young people aged 15-24 who spend 97 minutes on their phone. For the upper end of this group (aged 20-24), this increases to 101 minutes of use. Young people are much more likely to spend time on social media than other users (27 minutes v 20 minutes for all adults).
Figure 7 Average amount of time (mins) spent on each category per day, by age
15+ 15-24 25-34 35-44 45-54 55-64 65+
Total time (ave mins/day) 83 97 95 75 70 56 47
Phone 21 24 23 18 19 14 14
Social media 20 27 25 17 12 8 5
Games 15 13 14 17 18 16 15
Communications 10 12 12 8 7 7 5
Media content 9 11 9 7 8 6 4
Utility 8 7 8 7 8 12 9
General commerce 4 4 5 4 3 2 2
Health 4 2 2 4 9 5 1
Sports and gaming 3 4 3 2 2 1 1
Other 3 3 4 3 2 3 3
Reference 2 2 2 2 3 3 2
Technology commerce 1 1 1 1 2 2 1
Search and portals 1 1 2 1 1 1 1
Personal finance 1 1 1 1 1 1 1
Travel 1 1 3 1 1 1 1
General interest 1 1 1 1 2 2 1 Base: TouchPoints5 28-day passive data sample Ranked by Adults 15+
There are also differences depending on gender. On average, women spend 16 minutes longer on their phones each day compared to men (91 minutes v 75 minutes). The differences in use are most likely in social media apps or sites (26minutes v 18 minutes), calls or texting (24 minutes v 18 minutes) and games (17 minutes v 13 minutes).
Figure 8 Average amount of time (mins) spent on each category per day, by gender
15+ Male Female
Total time (ave mins/day) 83 75 91
Phone 21 18 24
Social media 20 18 26
Games 15 13 17
Communications 10 10 10
Media content 9 9 8
Utility 8 8 8
General commerce 4 3 5
Health 4 3 4
Other 3 3 2
9
Sports and gaming 3 3 1
Reference 2 3 2
Technology commerce 1 2 1
Search and portals 1 1 2
Personal finance 1 1 2
Travel 1 1 2
General interest 1 2 1 Base: TouchPoints5 28-day passive data sample Ranked by Adults 15+
The next section provides further detail on the use of the Communications, Social Media, Media Content and General Commerce categories.
A. Communication
We saw earlier that mobile phones are primarily used as a communication device with around half of time spent each day being for this purpose, including the standard voice call function and the standard texting function. The specific communication category used in the passive data analysis focuses more on the non-standard forms of communication and contains the following sub-categories:
Voice / video calls Messaging Email Other
Ninety six per cent of smartphone users access at least one of these methods to communicate each month in addition to standard calls or texting. The majority of this activity is via an app with only 18% of the sample used a browser this way, though this increases to almost one in four young people aged 15-24 (24%). On average, adults use their phones 45 times each day on communications, increasing to 58 times among 15-24 year olds.
Figure 9 shows the pattern of use for communications through a smartphone across individual days of the week. Use peaks on a Thursday evening between 6 and 6.30pm with 17% of smartphone users in the sample communicating via an app or browser on their device. Weekends are when mobiles are least likely to be used in this way.
Smartphones are least likely to be used for Communications at a weekend

10
Figure 9 Reach (%) of communications by time across individual days
Base: TouchPoints5 28-day passive data sample
Looking at the sub-categories, figure 10 shows us that email is the primary form of communication with around nine in ten using this function on their phones. Just over half (52%) use a messaging app or browser service, increasing to 62% of 15-34 year olds. Only one in four (26%) of those aged 65+ use messaging services. Voice / video call services are used by just over one in three of smartphone users, increasing to 41% of those aged 20-24.
Figure 10 Reach (%) to communication sub-categories, by age
15+ 15-24 25-34 35-44 45-54 55-64 65+
Email 90% 90% 92% 88% 89% 88% 85%
Messaging 52% 62% 62% 44% 42% 32% 26%
Voice / video calls 35% 37% 38% 34% 31% 29% 35%
Other comms 17% 17% 19% 18% 14% 10% 11% Base: TouchPoints5 28-day passive data sample Ranked by Adults 15+
The passive data also allows us to look at the use of particular brands accessed for Communication.
Figure 11 below shows us that the main email service used is the built-in service offered by the phone (69% of smartphone users) followed by Gmail (36%). Older users in the sample are more likely to use the Google email service than younger people (41% of those aged 65+ v 32% of 15-24 year olds). Conversely, Outlook is used more by younger people with over a fifth (22%) using this service compared to just 7% of those aged 65+.
Over half of young people use WhatsApp

11
Considering messaging, the texting service WhatsApp is by far the most popular of those available: 42% of smartphone users message this way, increasing to 53% of those aged 20-24.
Figure 11 Reach (%) to email and messaging brands by age
Source: TouchPoints5 28-day passive data sample Chart shows any brand with reach above 10% among those aged 15+
There are differences when the operating system is taking into account due to the availability and access to different apps. For example, 92% of iOS users access the built-in email services compared to just 53% of the Android/Blackberry or Symbian users. However, Gmail is on a par with the built-in email service for the Android users with 54% accessing this compared to just 8% of iOS users.
Figure 12 Reach (%) to each communication brand by type of smartphone user
Source: TouchPoints5 Chart shows any brand with reach above 5% among those aged 15+
However, being so readily accessible to others through messaging or communication apps may not necessarily be good for us. For example, when combined with the 7-day diary data we can see that 63% of all adults in this sample agree that ‘there are not
Use of communication apps may not always be good for us
12
enough hours in the day to all the things I want to do’, increasing to 82% of those who use Skype on their smartphones. Fifty three per cent of 15-24 year olds in the sample agree with the statement ‘I am feeling more stressed these days’ but this increases further to 62% of those who use WhatsApp messaging service. Incredibly, an article in Metro5 reported that a church leader in Peru has even blamed WhatsApp for the country’s growing divorce rate.
B. Social Media
The Social media category contains the following sub-categories:
Social networking Photo / video sharing Online dating Forums and aggregators Blogging
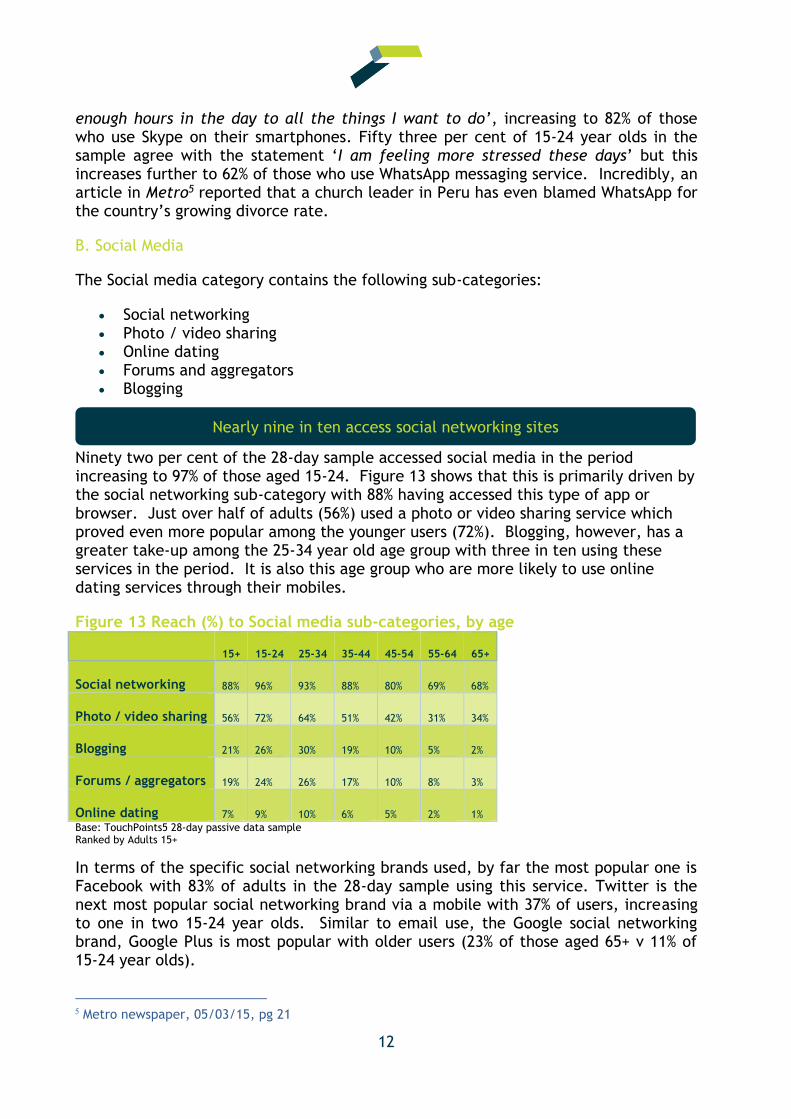
Ninety two per cent of the 28-day sample accessed social media in the period increasing to 97% of those aged 15-24. Figure 13 shows that this is primarily driven by the social networking sub-category with 88% having accessed this type of app or browser. Just over half of adults (56%) used a photo or video sharing service which proved even more popular among the younger users (72%). Blogging, however, has a greater take-up among the 25-34 year old age group with three in ten using these services in the period. It is also this age group who are more likely to use online dating services through their mobiles.
Figure 13 Reach (%) to Social media sub-categories, by age
15+ 15-24 25-34 35-44 45-54 55-64 65+
Social networking 88% 96% 93% 88% 80% 69% 68%
Photo / video sharing 56% 72% 64% 51% 42% 31% 34%
Blogging 21% 26% 30% 19% 10% 5% 2%
Forums / aggregators 19% 24% 26% 17% 10% 8% 3%
Online dating 7% 9% 10% 6% 5% 2% 1%
Base: TouchPoints5 28-day passive data sample Ranked by Adults 15+
In terms of the specific social networking brands used, by far the most popular one is Facebook with 83% of adults in the 28-day sample using this service. Twitter is the next most popular social networking brand via a mobile with 37% of users, increasing to one in two 15-24 year olds. Similar to email use, the Google social networking brand, Google Plus is most popular with older users (23% of those aged 65+ v 11% of 15-24 year olds).
Metro newspaper, 05/03/15, pg 21
Nearly nine in ten access social networking sites

13
Figure 14 Reach (%) to social networking brands by age
Base: TouchPoints5 28-day passive data sample All with 15+ reach above 5% shown
There is also a marked younger skew to the most popular photo or video sharing brands. In particular, 15-24 year olds are more than twice as likely to use Snapchat compared to the adults in the sample (36% of 15-24 year olds v 15% of adults 15+). Instagram is more likely to be used by 20-24 year olds than 15-19 year olds (41% v 33%) whereas Snapchat has a slightly younger skew with 39% of those in the sample using it compared to 33% of 20-24 year olds. Cool Iris is the brand that dominates among the older population in this category achieving an 18% reach among the 65+ group compared to just 3% for the most popular photo sharing brand, Instagram.
Figure 15 Reach (%) to photo / video sharing brands by age
Base: TouchPoints5 28-day passive data sample All with 15+ reach above 5% shown
There are also differences in reach to different brands depending on mobile platform used. This is likely to be because of the younger skew of iOS users as there is generally a higher reach of the social media services on this platform. Similarly, the
Almost three quarters of young people use either Instagram or Snapchat

14
photo sharing service Cool Iris has a higher reach on the Android/Blackberry/Symbian platforms which also has a higher reach among the older age group.
Figure 16 Reach (%) to each social media brand by type of smartphone user
Base: TouchPoints5
Considering how Facebook via a smartphone use varies across the week, figure 17 shows that through daytime, the weekends tend to be the most popular with Mondays being the most popular days in the morning and later evening.
Figure 17 Reach (%) to Facebook across the day by individual day
Base: TouchPoints5 7-day passive data sample
The chart above showed that Facebook use across a week peaks on a Sunday. When this passive data is combined with information provided through the diary, we can see how other factors can drive these patterns. For example, figure 18 shows how use of Facebook varies depending on the size of a user’s social circle. The clear peak of use
Sunday is the most likely day to access Facebook on a mobile

15
of this social networking site via mobile on a Sunday is during the half hour 1.30pm-2pm with 36% of users with over 501 Facebook contacts using the service.
Figure 18 Reach (%) to Facebook on a Sunday by number of Facebook contacts
Base: TouchPoints5 7-day passive data sample
The table below shows that an app is the favoured access point for Facebook via a mobile regardless of number of contacts but those with over 501 contacts access this social network almost three times as often compare to those with between 1 and 50 contacts.
Figure 19 Number of times Facebook is accessed via a mobile, by number of contacts
1-50 Facebook contacts 501+ Facebook contacts
App Browser App Browser
Average number of daily sessions 31 1 86 6
Base: TouchPoints5 7-day passive data sample
C. Media Content
The Media Content category contains the following sub-categories:
Streaming music Radio Streaming video / TV News aggregators Magazines Newspapers TV networks Music, movies and entertainment reviews Other
This category allows us to look in greater detail at how a mobile phone is used to access any type of media from music to short video clips to information about latest film releases.

16
Thinking about why people access this type of content on their mobiles, a sensible assumption would be to keep them occupied while they’re on the go. However, the chart below shows that reach is actually higher when users are at home than compared to when they’re travelling.
Figure 20 Reach (%) to Media Content, Monday-Friday: at home or travelling
Base: TouchPoints5 7-day passive data sample
The table below shows that three quarters (75%) of users in the 28-day sample accessed some sort of streamed audio-visual content, though only half of those aged 65+ did this. Using a mobile to play streamed music was the next most popular type of media content (63%) followed by accessing sites or apps of TV networks. Although overall, radio content was only the seventh most popular type of media content with 21% of people accessing it, 28% of those aged 55-64 used it, their fifth most popular type of media content.
Figure 21 Reach (%) to Media Content sub-categories, by age
15+ 15-24 25-34 35-44 45-54 55-64 65+
Streaming video / TV 75% 84% 84% 74% 63% 50% 50%
Streaming music 63% 73% 69% 60% 58% 40% 49%
TV networks 58% 57% 63% 61% 51% 50% 59%
Newspapers 39% 42% 46% 36% 28% 32% 32%
Music, movies, ents reviews 32% 40% 37% 29% 23% 18% 20%
News aggregators 28% 36% 34% 22% 21% 17% 18%
Radio 21% 22% 20% 19% 20% 28% 21%
Magazines 11% 16% 13% 8% 6% 5% 2%
Other media content 13% 17% 15% 10% 11% 10% 16%
Three out of four use smartphones to view streamed AV content

17
Base: TouchPoints5 28-day passive data sample Ranked by Adults 15+
The passive data also allows us to look at the use of particular brands accessed for Media Content.
Figure 22 shows that YouTube is the streamed AV service with the highest reach. This is likely to be due to the convenience of watching shorter clips on a smaller screen compared to longer form programmes.
Figure 22 Reach (%) to streaming video / TV brands by age
Base: TouchPoints5 28-day passive data sample All with 15+ reach above 5% shown
For streamed music services, use is primarily driven by built-in music players where users can listen to their personal stored music collections as opposed to services that allow listeners to access or purchase a wider range of tracks such as iTunes or Spotify.
Figure 23 Reach (%) to streaming music brands, by age
Base: TouchPoints5 28-day passive data sample All with 15+ reach above 5% shown
YouTube is the most popular destination for streamed AV content

18
Again, use of different services varies depending on the smartphone platform. The chart below shows how the built-in music player is used by 74% of those using iOS compared to just 42% of those on the other platforms. Unsurprisingly, iTunes is more likely to be used by iOS smartphone users with 49% of them using this compared to just 3% of other users.
Figure 24 Reach (%) to streaming music brands, by smartphone platform
Base: TouchPoints5
D. General Commerce
The General Commerce category contains the following sub-categories:
All / Variety Clothing / fashion Fast food, grocery and delivery Tickets Automotive Classified ads Coupons / reward sites Sports equipment and clothing
Over three quarters (76%) of smartphone users in the passive data sample use their phones to access general retail sites or apps. For most sub-categories within this section, it is generally the 25-44 year olds who are most likely to do this though sites used for ticket purchases are most popular among 15-24 year olds (21% v 15% of all adults).
The most popular type of commerce sites or apps are the variety or department-type services, offering a range of different products. Two thirds of adults (66%) have accessed these, increasing to 75% of 25-34 year olds.
25-44 year olds are most likely to access retail sites via their phones
19
Figure 25 Reach (%) to General Commerce sub-categories, by age
15+ 15-24 25-34 35-44 45-54 55-64 65+
All / variety 66% 64% 75% 70% 60% 47% 38%
Coupons / reward sites 31% 31% 39% 34% 20% 18% 17%
Fast food, grocery and delivery 30% 31% 35% 33% 23% 15% 22%
Clothing / fashion 19% 23% 25% 20% 8% 5% 12%
Tickets 15% 21% 18% 14% 9% 6% 5%
Automotive / classified 14% 14% 19% 14% 11% 6% 4%
Sports 5% 6% 5% 5% 4% 4% 5%
Other 16% 13% 24% 17% 12% 10% 6%
Base: TouchPoints5 28-day passive data sample Ranked by Adults 15+
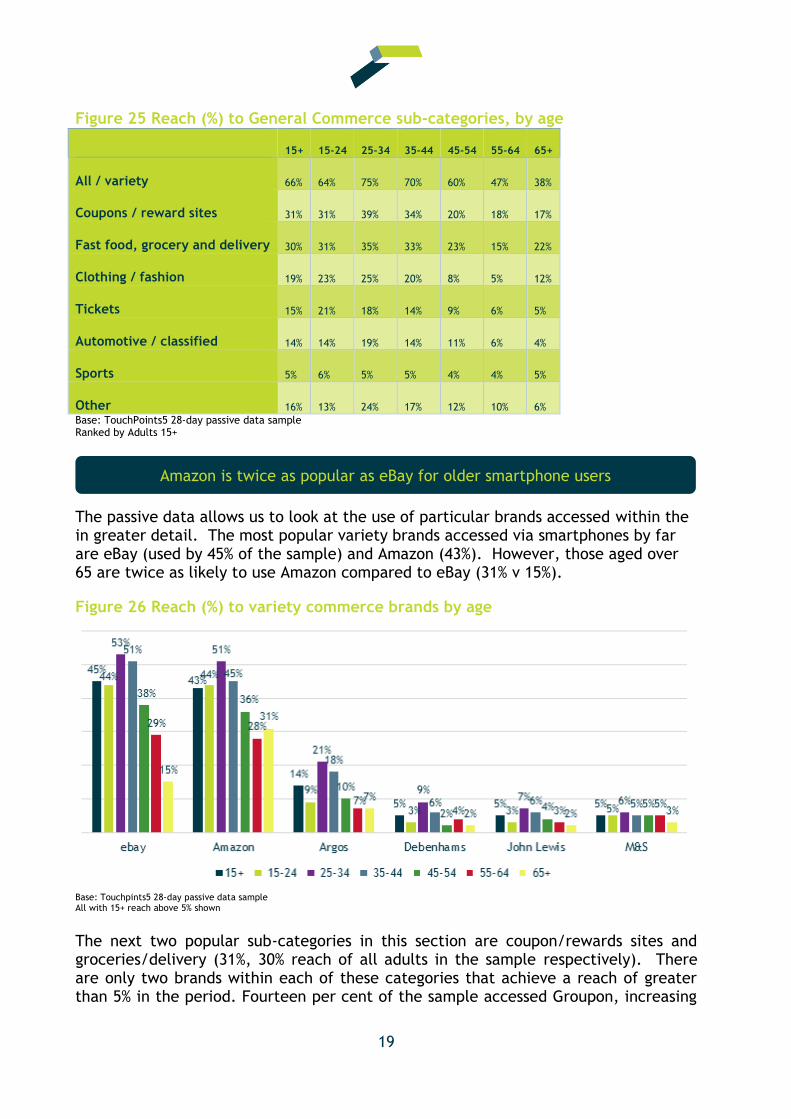
The passive data allows us to look at the use of particular brands accessed within the in greater detail. The most popular variety brands accessed via smartphones by far are eBay (used by 45% of the sample) and Amazon (43%). However, those aged over 65 are twice as likely to use Amazon compared to eBay (31% v 15%).
Figure 26 Reach (%) to variety commerce brands by age
Base: Touchpints5 28-day passive data sample All with 15+ reach above 5% shown
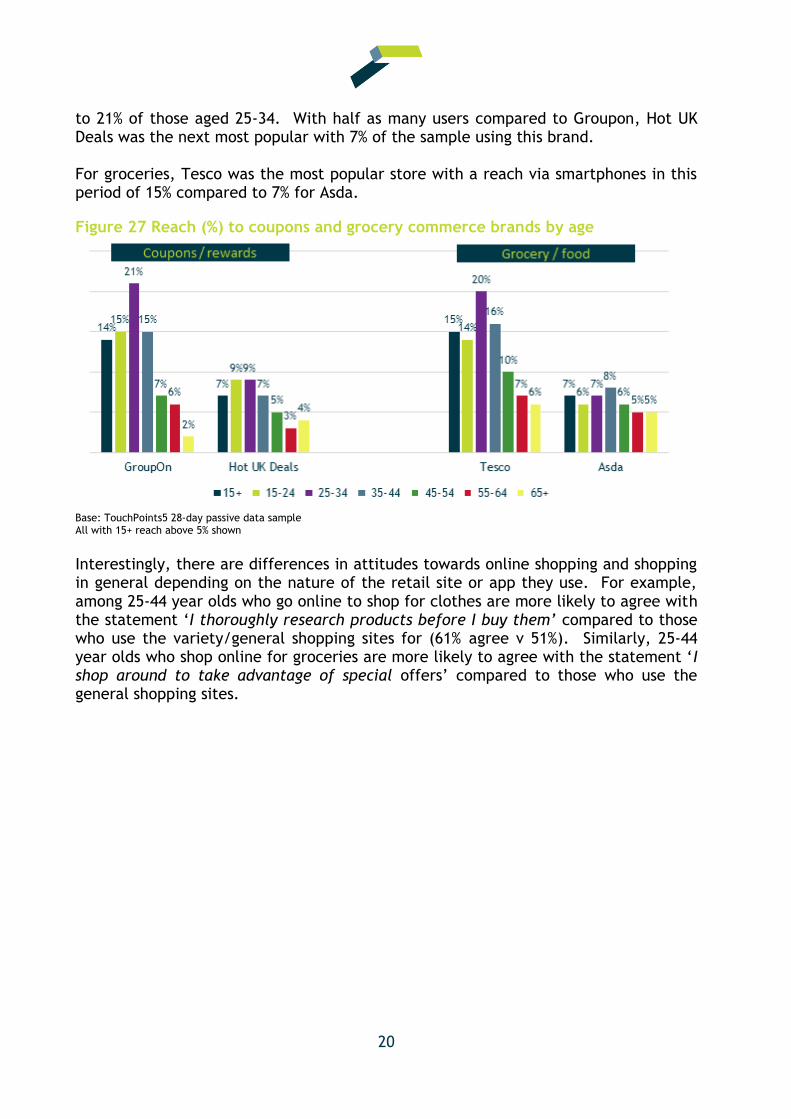
The next two popular sub-categories in this section are coupon/rewards sites and groceries/delivery (31%, 30% reach of all adults in the sample respectively). There are only two brands within each of these categories that achieve a reach of greater than 5% in the period. Fourteen per cent of the sample accessed Groupon, increasing
Amazon is twice as popular as eBay for older smartphone users
20
to 21% of those aged 25-34. With half as many users compared to Groupon, Hot UK Deals was the next most popular with 7% of the sample using this brand. For groceries, Tesco was the most popular store with a reach via smartphones in this period of 15% compared to 7% for Asda.
Figure 27 Reach (%) to coupons and grocery commerce brands by age
Base: TouchPoints5 28-day passive data sample All with 15+ reach above 5% shown
Interestingly, there are differences in attitudes towards online shopping and shopping in general depending on the nature of the retail site or app they use. For example, among 25-44 year olds who go online to shop for clothes are more likely to agree with the statement ‘I thoroughly research products before I buy them’ compared to those who use the variety/general shopping sites for (61% agree v 51%). Similarly, 25-44 year olds who shop online for groceries are more likely to agree with the statement ‘I shop around to take advantage of special offers’ compared to those who use the general shopping sites.
21
5. How are they using their smartphones
The previous section looked in detail at what people are doing on their mobile phones. This section gives a brief overview of how they are using them: online v offline, apps v browsers, use with other media and location.
Online vs. offline use
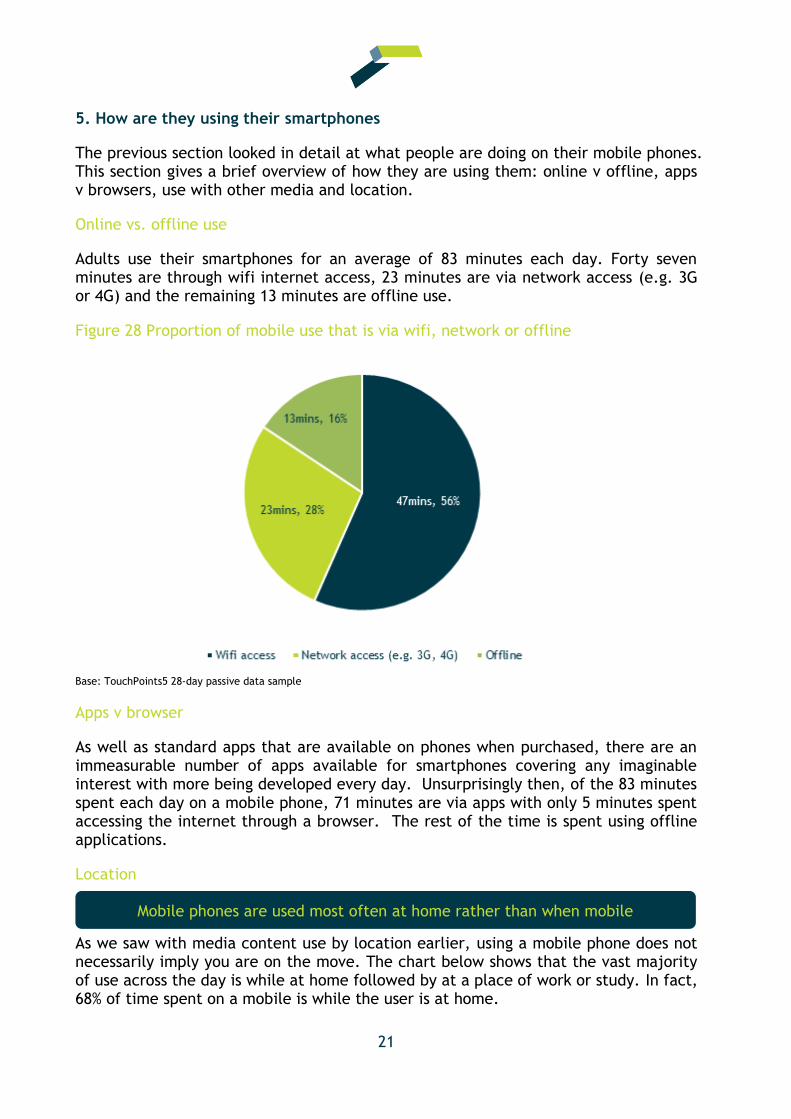
Adults use their smartphones for an average of 83 minutes each day. Forty seven minutes are through wifi internet access, 23 minutes are via network access (e.g. 3G or 4G) and the remaining 13 minutes are offline use.
Figure 28 Proportion of mobile use that is via wifi, network or offline
Base: TouchPoints5 28-day passive data sample
Apps v browser
As well as standard apps that are available on phones when purchased, there are an immeasurable number of apps available for smartphones covering any imaginable interest with more being developed every day. Unsurprisingly then, of the 83 minutes spent each day on a mobile phone, 71 minutes are via apps with only 5 minutes spent accessing the internet through a browser. The rest of the time is spent using offline applications.
Location
As we saw with media content use by location earlier, using a mobile phone does not necessarily imply you are on the move. The chart below shows that the vast majority of use across the day is while at home followed by at a place of work or study. In fact, 68% of time spent on a mobile is while the user is at home.
Mobile phones are used most often at home rather than when mobile

22
Figure 29 Mobile phone use across weekdays, by location
Source: TouchPoints5 7-day passive data sample
Use as a second screen
The portability and size of mobile phones enables users to carry out other activities while also using their phones. The chart below shows that mobile phone use whilst watching television on TV set varies by age across the week, in line with known viewing behaviour by age. This suggests that mobile phones are often used as a ‘second screen’ to the main TV set, allowing users to interact with others or catch-up on other activities whilst relaxing in front of the television.
Figure 30 Reach (%) across weekdays, while watching TV on a TV set, by age
Source: TouchPoints5 7-day passive data sample

23
6. Going forward
The analysis of passive data of mobile phone use allows us to understand exactly how people use their mobile phones such as how people are accessing online services, if they are using apps or browsers and what they are specifically doing on their devices.
Considering this information alongside the data gained through the TouchPoints survey enhances the power of the passive measurement still further by allowing us to look at it in the context of attitudes and other behavioural findings. For example, we know by looking at the passive data and the survey data that young people who use the WhatsApp messaging service are more likely to say they feel stressed these days.
This report has provided a snapshot of the passive data and examples of how it can be used in conjunction with the TouchPoints survey data. There are many other ways in which the two data sources could be used to inform the advertising industry. For example, we saw that the mobile phone is often used at the same time as watching TV. This could be probed further to find out exactly which apps or browsers people are using while watching TV on particular days or particular times to understand more about the role of the second screen. We also saw that the majority of time spent on mobiles is on apps rather than via a browser. This data could be scrutinised still further by looking at amount of time spent on particular apps and then compare this with media consumption habits or shopping habits.
The next TouchPoints survey6 will also include passive data measurement on mobile phones but, as a further enhancement, will also include passive measurement on tablet devices. The survey has also been refined and updated to include a greater range of attitudinal statements on aspects such as online shopping, privacy and using another screen while watching television.
6 TouchPoints6 will be available later in 2015

24
Annex A. Taxonomy for Passive Data in TouchPoints5 Category Subcategory Item
Phone Built-in Voice Calls - Received Built-in Voice Calls - Received
Phone Built-in Voice Calls - Outgoing Built-in Voice Calls - Outgoing
Phone Built-in sms/mms Built-in sms/mms
Communication Voice/Video calls Google Talk/Hangouts
Communication Voice/Video calls Facetime
Communication Voice/Video calls skype
Communication Voice/Video calls viber
Communication Voice/Video calls Tango
Communication Voice/Video calls Other Voice/Video calls
Communication messaging whatsapp
Communication messaging bbm
Communication messaging chaton
Communication messaging kik
Communication messaging Facebook Messenger
Communication messaging Other messaging
Communication Email Built-in email
Communication Email Outlook
Communication Email Yahoo Mail
Communication Email Gmail
Communication Email Other
Communication other Vlingo
Communication other Other Communication
Social Social Networking Facebook
Social Social Networking Twitter
Social Social Networking LinkedIn
Social Social Networking Foursquare
Social Social Networking tumblr
Social Social Networking Google Plus
Social Social Networking Ask fm
Social Social Networking Other social networking
Social Photo/ Video Sharing instagram
Social Photo/ Video Sharing snapchat
Social Photo/ Video Sharing bitstrips
Social Photo/ Video Sharing pinterest
Social Photo/ Video Sharing Paper Artist
Social Photo/ Video Sharing vine
Social Photo/ Video Sharing Shoebox
Social Photo/ Video Sharing flickr
Social Photo/ Video Sharing vimeo
Social Photo/ Video Sharing Cool Iris
Social Photo/ Video Sharing DropBox
Social Photo/ Video Sharing Photobucket

25
Social Photo/ Video Sharing Other Photo/Video Sharing
Social Online Dating Plenty of Fish
Social Online Dating Tinder
Social Online Dating Badoo
Social Online Dating Match.com
Social Online Dating Other online dating
Social Forums and Aggregators Sickipedia
Social Forums and Aggregators Money Saving Expert
Social Forums and Aggregators Studentroom
Social Forums and Aggregators Just Answer
Social Forums and Aggregators Examiner
Social Forums and Aggregators Mumsnet
Social Forums and Aggregators Netmums
Social Forums and Aggregators FanFiction
Social Forums and Aggregators Other forums/aggregators
Social Blogging Wordpress
Social Blogging TypePad
Social Blogging Blogger
Social Blogging Other blogging
Games Puzzle Candy Crush Saga
Games Puzzle Pet Rescue Saga
Games Puzzle Angry Birds
Games Puzzle Flow
Games Puzzle Jelly Splash
Games Puzzle 4 Pics, 1 word
Games Puzzle 4 Pics, 1 Song
Games Puzzle Bubble Witch
Games Puzzle Bejeweled
Games Puzzle Sudoku
Games Puzzle Jewel Mania
Games Puzzle Tetris
Games Puzzle Scramble with Friends
Games Puzzle Cut the rope
Games Puzzle Dumb Ways to Die
Games Puzzle Other puzzle games
Games Word Games Words with Friends
Games Word Games Word Mole
Games Word Games Scrabble
Games Word Games Other word games
Games Card Games Solitaire
Games Card Games Poker
Games Card Games Other card games
Games Simulation The Simpsons
Games Simulation Megapolis
Games Simulation Other simulation games

26
Games Action/Arcade Temple Run
Games Action/Arcade Coin Dozer
Games Action/Arcade Subway Surfers
Games Action/Arcade Minecraft
Games Action/Arcade Hill Climb Racing
Games Action/Arcade Fruit Ninja
Games Action/Arcade Brick Breaker
Games Action/Arcade Despicable Me
Games Action/Arcade Doodle Jump
Games Action/Arcade Other action/arcade games
Games Sports FIFA
Games Sports Stick Cricket
Games Sports Other sports games
Games Other Plants vs Zombies
Games Other SongPop
Games Other Guess the Food
Games Other Cbeebies Playtime
Games Other Any Disney
Games Other Built-in games
Games Other Other games
Media Content Streaming Music Built-in music players
Media Content Streaming Music Spotify
Media Content Streaming Music Deezer
Media Content Streaming Music Soundcloud
Media Content Streaming Music iTunes
Media Content Streaming Music Amazon MP3
Media Content Streaming Music Other streaming music
Media Content Radio Tunein Radio
Media Content Radio iPlayer Radio
Media Content Radio Built-in FM Radio
Media Content Radio Radioplayer
Media Content Radio Capital Radio
Media Content Radio Other Global station
Media Content Radio Other radio station
Media Content Radio BBC Playlist
Media Content Radio Absolute
Media Content Radio Other radio
Media Content Streaming Video/TV YouTube
Media Content Streaming Video/TV BBC iPlayer
Media Content Streaming Video/TV ITV Player
Media Content Streaming Video/TV 4oD
Media Content Streaming Video/TV demand5
Media Content Streaming Video/TV Sky Go
Media Content Streaming Video/TV NetFlix
Media Content Streaming Video/TV TVCatchUp

27
Media Content Streaming Video/TV FilmOn
Media Content Streaming Video/TV BT Sport
Media Content Streaming Video/TV Vevo
Media Content Streaming Video/TV LoveFilm
Media Content Streaming Video/TV DailyMotion
Media Content Streaming Video/TV Built-in Video players
Media Content Streaming Video/TV Sky Sports
Media Content Streaming Video/TV Virgin Media TV Anywhere
Media Content Streaming Video/TV Other streaming video/TV
Media Content News aggregators and online only Flipboard
Media Content News aggregators and online only Google Play Newsstand
Media Content News aggregators and online only Huffington Post
Media Content News aggregators and online only Buzzfeed
Media Content News aggregators and online only Reuters
Media Content News aggregators and online only Reddit
Media Content News aggregators and online only Other news aggregators
Media Content Magazines (with offline) Radio Times
Media Content Magazines (with offline) TimeOut
Media Content Magazines (with offline) Cosmopolitan
Media Content Magazines (with offline) Glamour
Media Content Magazines (with offline) Marie Claire
Media Content Magazines (with offline) Other magazines
Media Content Newspapers (with offline) Daily Mail
Media Content Newspapers (with offline) Guardian
Media Content Newspapers (with offline) The Sun
Media Content Newspapers (with offline) Metro
Media Content Newspapers (with offline) The Times
Media Content Newspapers (with offline) Mirror
Media Content Newspapers (with offline) Independent
Media Content Newspapers (with offline) Manchester Evening News
Media Content Newspapers (with offline) New York Times
Media Content Newspapers (with offline) Telegraph
Media Content Newspapers (with offline) Daily Record
Media Content Newspapers (with offline) WSJ
Media Content Newspapers (with offline) Express
Media Content Newspapers (with offline) Daily Star
Media Content Newspapers (with offline) Other newspapers
Media Content TV Networks (with offline) BBC News (app only)
Media Content TV Networks (with offline) Sky News
Media Content TV Networks (with offline) Sky Plus
Media Content TV Networks (with offline) Other Sky
Media Content TV Networks (with offline) X Factor
Media Content TV Networks (with offline) BBC websites
Media Content TV Networks (with offline) ITV
Media Content TV Networks (with offline) CNN

28
Media Content TV Networks (with offline) Channel 4
Media Content TV Networks (with offline) Disney
Media Content TV Networks (with offline) MTV
Media Content TV Networks (with offline) Other TV networks
Media Content Music, movies and entertainment reviews and commentary
iMDb
Media Content Music, movies and entertainment reviews and commentary
Movies.app
Media Content Music, movies and entertainment reviews and commentary
Any TV guide
Media Content Music, movies and entertainment reviews and commentary
IGN
Media Content Music, movies and entertainment reviews and commentary
Gamespot
Media Content Music, movies and entertainment reviews and commentary
Xbox
Media Content Music, movies and entertainment reviews and commentary
Digitalspy
Media Content Music, movies and entertainment reviews and commentary
Rotten Tomatoes
Media Content Music, movies and entertainment reviews and commentary
Entertainmentwise
Media Content Music, movies and entertainment reviews and commentary
ContactMusic
Media Content Music, movies and entertainment reviews and commentary
Eonline
Media Content Music, movies and entertainment reviews and commentary
GameFAQs
Media Content Music, movies and entertainment reviews and commentary
Zergnet
Media Content Music, movies and entertainment reviews and commentary
Other
Media Content Other Shazam
Media Content Other Sound Hound
Media Content Other Other
General Commerce All / Variety ebay
General Commerce All / Variety Amazon
General Commerce All / Variety Argos
General Commerce All / Variety Debenhams
General Commerce All / Variety John Lewis
General Commerce All / Variety M&S
General Commerce All / Variety Boots
General Commerce All / Variety Littlewoods
General Commerce All / Variety Ikea
General Commerce All / Variety Not On the Highstreet
General Commerce All / Variety Toysrus
General Commerce All / Variety Mothercare
General Commerce All / Variety House of Fraser
General Commerce All / Variety Game
General Commerce All / Variety B&Q
General Commerce All / Variety Very
General Commerce All / Variety Photobox

29
General Commerce All / Variety Wilkinsons
General Commerce All / Variety Homebase
General Commerce All / Variety Pets at Home
General Commerce All / Variety Dunelm-Mill
General Commerce All / Variety Wickes
General Commerce All / Variety Hobbycraft
General Commerce All / Variety Kiddicare
General Commerce All / Variety Firebox
General Commerce All / Variety Etsy
General Commerce All / Variety Halfords
General Commerce All / Variety Play
General Commerce All / Variety Smyths Toys
General Commerce All / Variety Other
General Commerce Clothing/Fashion Next
General Commerce Clothing/Fashion Asos
General Commerce Clothing/Fashion New Look
General Commerce Clothing/Fashion River Island
General Commerce Clothing/Fashion Top Shop
General Commerce Clothing/Fashion Top Man
General Commerce Clothing/Fashion Dorothy Perkins
General Commerce Clothing/Fashion Matalan
General Commerce Clothing/Fashion H&M
General Commerce Clothing/Fashion Office
General Commerce Clothing/Fashion M&M Direct
General Commerce Clothing/Fashion Other
General Commerce Fast food, Grocery and Delivery sites Tesco
General Commerce Fast food, Grocery and Delivery sites Asda
General Commerce Fast food, Grocery and Delivery sites Just Eat
General Commerce Fast food, Grocery and Delivery sites Dominos
General Commerce Fast food, Grocery and Delivery sites Ocado
General Commerce Fast food, Grocery and Delivery sites Morrisons
General Commerce Fast food, Grocery and Delivery sites Sainsburys
General Commerce Fast food, Grocery and Delivery sites McDonalds
General Commerce Fast food, Grocery and Delivery sites My Supermarket
General Commerce Fast food, Grocery and Delivery sites Co-op
General Commerce Fast food, Grocery and Delivery sites Other
General Commerce Tickets Cineworld
General Commerce Tickets Odeon
General Commerce Tickets Vue
General Commerce Tickets Ticketmaster
General Commerce Tickets Seetickets
General Commerce Tickets Showcase Cinemas
General Commerce Tickets Other
General Commerce Automotive Other
General Commerce Classified Ads Gumtree

30
General Commerce Classified Ads Autotrader
General Commerce Classified Ads Craigslist
General Commerce Classified Ads Preloved
General Commerce Classified Ads Other
General Commerce Coupons / Reward sites GroupOn
General Commerce Coupons / Reward sites Vouchercodes
General Commerce Coupons / Reward sites Vouchercloud
General Commerce Coupons / Reward sites Nectar
General Commerce Coupons / Reward sites Topcashback
General Commerce Coupons / Reward sites Quidco
General Commerce Coupons / Reward sites Wowcher
General Commerce Coupons / Reward sites Hot UK Deals
General Commerce Coupons / Reward sites High Street Vouchers
General Commerce Coupons / Reward sites Discount Vouchers
General Commerce Coupons / Reward sites Other
General Commerce Sports equipment and clothing JD Sports
General Commerce Sports equipment and clothing Sports Direct
General Commerce Sports equipment and clothing Wiggle
General Commerce Sports equipment and clothing Other
General Commerce Other British Gas
General Commerce Other Money Supermarket
General Commerce Other Which
General Commerce Other Royal Mail
General Commerce Other Post Office
General Commerce Other Hermes
General Commerce Other DPD
General Commerce Other Uswitch
General Commerce Other Other
Search and Portals General Search Google
Search and Portals General Search Bing
Search and Portals General Search Yahoo
Search and Portals General Search AOL
Search and Portals General Search MSN
Search and Portals General Search Ask
Search and Portals General Search StumbleUpon
Search and Portals General Search Other
Search and Portals Other Yell
Search and Portals Other 192.com
Search and Portals Other Yelp
Search and Portals Other Other
Sports and Gaming Sports Headlines and Updates Any BBC Sport (app only)
Sports and Gaming Sports Headlines and Updates Any Sky Sport
Sports and Gaming Sports Headlines and Updates LiveScore soccer
Sports and Gaming Sports Headlines and Updates ESPN
Sports and Gaming Sports Headlines and Updates Other
31
Sports and Gaming Professional Sports Teams Premiere League
Sports and Gaming Professional Sports Teams Arsenal
Sports and Gaming Professional Sports Teams Other
Sports and Gaming Fantasy Sports Other
Sports and Gaming Lotteries and gaming National lottery
Sports and Gaming Lotteries and gaming Sky betting
Sports and Gaming Lotteries and gaming William Hill
Sports and Gaming Lotteries and gaming Paddy Power
Sports and Gaming Lotteries and gaming Health Lottery
Sports and Gaming Lotteries and gaming Other
Technology Commerce Electronics and Computers Apple
Technology Commerce Electronics and Computers PC World
Technology Commerce Electronics and Computers Currys
Technology Commerce Electronics and Computers Other
Technology Commerce Software Microsoft
Technology Commerce Software Adobe
Technology Commerce Software Other
Technology Commerce App Stores Unspecified
Technology Commerce ebook stores Amazon Kindle
Technology Commerce ebook stores iBooks
Technology Commerce ebook stores Google Play books
Technology Commerce ebook stores Other
Technology Commerce Mobile phones and service plans o2
Technology Commerce Mobile phones and service plans Vodafone
Technology Commerce Mobile phones and service plans Orange
Technology Commerce Mobile phones and service plans EE
Technology Commerce Mobile phones and service plans Three
Technology Commerce Mobile phones and service plans T-Mobile
Technology Commerce Mobile phones and service plans Carphone Warehouse
Technology Commerce Mobile phones and service plans GiffGaff
Technology Commerce Mobile phones and service plans Sony Mobile
Technology Commerce Mobile phones and service plans Other
Technology Commerce Cable and Internet service plans BT
Technology Commerce Cable and Internet service plans Virgin Media
Technology Commerce Cable and Internet service plans Other
Technology Commerce Web hosting and website design services Other
Technology Commerce Other Techradar
Technology Commerce Other Other
General Interest Arts and culture National Trust
General Interest Arts and culture Other
General Interest Career Reed
General Interest Career Job Rapido
General Interest Career Indeed
General Interest Career UCAS
General Interest Career Other

32
General Interest Decorating and Renovation Fixya
General Interest Decorating and Renovation Other
General Interest Family and Parenting Other
General Interest Reading, books and literature Other
General Interest Recipes and Cooking BBC Good Food
General Interest Recipes and Cooking All Recipes
General Interest Recipes and Cooking Jamie Oliver
General Interest Recipes and Cooking Delicious
General Interest Recipes and Cooking Delia Online
General Interest Recipes and Cooking Nigella
General Interest Recipes and Cooking Yummly
General Interest Recipes and Cooking The Kitchn
General Interest Recipes and Cooking Other
General Interest Religion Bible
General Interest Religion Other
General Interest Restaurant bookings and reviews Top Table
General Interest Restaurant bookings and reviews Other
General Interest Politics Change.org
General Interest Other Good to Know
General Interest Other Freecycle
General Interest Other E-how
General Interest Other Pistonheads
General Interest Other Other
Reference Education Other
Reference Encyclopedias, Dictionaries, Thesaurus wikipedia/wikimedia
Reference Encyclopedias, Dictionaries, Thesaurus Google Translate
Reference Encyclopedias, Dictionaries, Thesaurus Dictionary
Reference Encyclopedias, Dictionaries, Thesaurus Urban Dictionary
Reference Encyclopedias, Dictionaries, Thesaurus Other
Reference Government Central government sites
Reference Government Local government/councils
Reference Government Other
Reference Local Other
Reference Maps Google Maps
Reference Maps Google Earth
Reference Maps Google Street
Reference Maps Map My Walk/Run/Ride
Reference Maps Citymapper
Reference Maps Other maps
Reference Productivity Other
Reference Transportation The Trainline
Reference Transportation National Rail
Reference Transportation Tube map
Reference Transportation Bus times
Reference Transportation The AA

33
Reference Transportation TFL / London Transport
Reference Transportation Other
Reference Weather BBC weather (app only)
Reference Weather Met office
Reference Weather Built-in weather app
Reference Weather AccuWeather
Reference Weather Other
Reference Other Lyrics Freak
Reference Other A-Z Lyrics Universe
Reference Other iopeningtimes
Reference Other Converters (any)
Reference Other Answers.com
Reference Other Other
Travel Travel Consolidators Skyscanner
Travel Travel Consolidators Travelzoo
Travel Travel Consolidators Booking
Travel Travel Consolidators Secret Escapes
Travel Travel Consolidators Thomson
Travel Travel Consolidators Thomas Cook
Travel Travel Consolidators Lastminute
Travel Travel Consolidators Travel Supermarket
Travel Travel Consolidators Other
Travel Hotels Travel Lodge
Travel Hotels Premier Inn
Travel Hotels Other
Travel Airlines British Airways
Travel Airlines Easyjet
Travel Airlines Other
Travel Rental Cars Other
Travel Holiday destinations and resorts Other
Travel Travel Review Sites Tripadvisor
Travel Travel Review Sites Other
Travel Other Waze
Travel Other Other
Personal Finance and Real Estate
Personal Banking NatWest
Personal Finance and Real Estate
Personal Banking Barclays
Personal Finance and Real Estate
Personal Banking Santander
Personal Finance and Real Estate
Personal Banking Lloyds TSB
Personal Finance and Real Estate
Personal Banking HSBC
Personal Finance and Real Estate
Personal Banking Halifax
Personal Finance and Real Estate
Personal Banking Nationwide

34
Personal Finance and Real Estate
Personal Banking First Direct
Personal Finance and Real Estate
Personal Banking RBS
Personal Finance and Real Estate
Personal Banking Paypal
Personal Finance and Real Estate
Personal Banking Co-operative Bank
Personal Finance and Real Estate
Personal Banking Other
Personal Finance and Real Estate
Investments, Stocks and Trading Other
Personal Finance and Real Estate
Taxes and Tax Advice HMRC
Personal Finance and Real Estate
Insurance Other
Personal Finance and Real Estate
Charities, donations and Microfinance Justgiving
Personal Finance and Real Estate
Charities, donations and Microfinance Other
Personal Finance and Real Estate
Real estate and housing Rightmove
Personal Finance and Real Estate
Real estate and housing Zoopla
Personal Finance and Real Estate
Real estate and housing Other
Personal Finance and Real Estate
Other ThisisMoney
Personal Finance and Real Estate
Other Other
Health Health Insurance Providers Other
Health Hospitals and Healthcare providers NHS
Health Medical Advice and ailment look-up MedicineNet
Health Medical Advice and ailment look-up Active Beat
Health Medical Advice and ailment look-up MedHelp
Health Medical Advice and ailment look-up Mayo Clinic
Health Medical Advice and ailment look-up WebMD
Health Medical Advice and ailment look-up Patient
Health Medical Advice and ailment look-up Other
Health Support and Discussion Groups Babycentre
Health Support and Discussion Groups Bounty
Health Support and Discussion Groups Other
Health Weight Loss and Nutrition Slimming World
Health Weight Loss and Nutrition Weightwatchers
Health Weight Loss and Nutrition Other
Health Exercise and Fitness My Fitness Pal
Health Exercise and Fitness Strava
Health Exercise and Fitness Runkeeper Pro
Health Exercise and Fitness LiveStrong
Health Exercise and Fitness Other
Health Other Honcode
Health Other Other

35
Other Market Research and Points Rewards Other
Other Adult All adult sites
Other Other All Schools
Other Other All other academic institutions
Other Uncategorised All uncategorised
Utility Calculator Calculator
Utility Calendar/Memo/Notes Calendar/Memo/Notes
Utility Camera/Video/Photos Camera/Video/Photos
Utility Clock / timer / alarm Clock / timer / alarm
Utility Contacts Contacts
Utility Flashlight Flashlight
Related Documents