Total Tax Contribution of UK Financial Services Eighth Edition RESEARCH REPORT CITY OF LONDON CORPORATION www.cityoflondon.gov.uk/economicresearch Report prepared for the City of London Corporation by

Welcome message from author
This document is posted to help you gain knowledge. Please leave a comment to let me know what you think about it! Share it to your friends and learn new things together.
Transcript

Total Tax Contribution of UK Financial ServicesEighth EditionRESEARCH REPORT CITY OF LONDON CORPORATION
www.cityoflondon.gov.uk/economicresearch
Report prepared for the City of London Corporation by

www.cityoflondon.gov.uk/economicresearch
Total Tax Contribution of UK Financial ServicesEighth EditionRESEARCH REPORT CITY OF LONDON CORPORATION

Total Tax Contribution is published by the City of London Corporation. The author of this report is PwC.
© City of London Corporation, December 2015. All rights reserved.
City of London PO Box 270, Guildhall London EC2P 2EJ
http://www.cityoflondon.gov.uk/economicresearch
This publication has been prepared for general guidance on matters of interest only, and does not constitute professional advice. You should not act upon the information contained in this publication without obtaining specific professional advice. No representation or warranty (express or implied) is given as to the accuracy or completeness of the information contained in this publication, and, to the extent permitted by law, the authors and distributors do not accept or assume any liability, responsibility or duty of care for any consequences of you or anyone else acting, or refraining to act, in reliance on the information contained in this publication or for any decision based on it.

Contents Executive summary .................................................................................................................................... 2
Purpose and outline of the study ............................................................................................................ 3
Estimated contribution of the financial services sector in the UK ..................................................... 5
Trends in tax payments ............................................................................................................................. 8
Profile of taxes paid by survey participants ........................................................................................ 12
Employment taxes.................................................................................................................................... 15
Corporation tax ........................................................................................................................................ 18
Trends in other business taxes borne .................................................................................................... 20
Putting Total Tax Contribution data in the context of turnover and profits .................................. 22
Results for different parts of the sector ................................................................................................. 25
Appendices ............................................................................................................................................... 30
Appendix 1 – List of UK taxes borne and collected by financial service companies ............ 30
Appendix 2 – Data provided by 48 financial services companies taking part in the study . 31
Appendix 3 – Illustration of Total Tax Rate trends during an economic cycle ........................ 32
Table of figures Figure 1 Total Tax Contribution of the financial services sector in the UK Financial year to 31 March 2015 .................................................................................................................................................. 5 Figure 2 Total Tax Contribution of the financial services sector in the UK .................................. 6 Figure 3 Trends in taxes borne and collected 2014/2015 ............................................................. 9 Figure 4 Trends in taxes borne and collected 2007/2015 ........................................................... 10 Figure 5 Trend in taxes borne and collected for companies that have participated in all
years of the study ................................................................................................................ 10 Figure 6 The changing profile of the tax system from 2007 to 2015 .......................................... 11 Figure 7 Taxes borne by financial services companies ............................................................... 12 Figure 8 Taxes collected by financial services companies ........................................................ 13 Figure 9 Total Tax Contribution of financial services companies .............................................. 14 Figure 10 Employment taxes borne and collected by the financial services sector in the UK
................................................................................................................................................ 15 Figure 11 Trends in employment and employment taxes – 2014/2015 ..................................... 16 Figure 12 Trends in wages per employee and employment taxes for companies providing data in 2014/2015 ..................................................................................................................................... 17 Figure 13 Government corporation tax receipts by business sector ......................................... 18 Figure 14 Government corporation tax receipts from the financial services sector .............. 19 Figure 15 Trend in other taxes borne payments for financial services companies ................. 21 Figure 16 Total Tax Contribution as a percentage of turnover for financial services companies ................................................................................................................................................ 22 Figure 17 Total Tax Rates for financial services companies ........................................................ 24 Figure 18 Survey participants by sector ........................................................................................... 25 Figure 19 Analysis of study data by financial services sub-sector – number of companies in
the study and Total Tax Contribution figures ................................................................. 26 Figure 20 Analysis of study data by financial services sub-sector – employee numbers and
employment taxes .............................................................................................................. 26 Figure 21 Analysis of study data by financial services sub-sector – corporation tax, total taxes borne, taxes collected and Total Tax Contribution ................................................................ 27 Figure 22 Corporation tax paid by the FS sector – 2006 to 2015 ................................................. 28 Figure 23 Employment taxes paid by the banking sector – 2006 to 2015 ................................. 28
1

Executive summary The key findings from this eighth study show that, for the financial services (FS) sector in the UK in the year to 31 March 2015:
• The sector paid an estimated amount of total taxes in the region of £66.5bn,or 11.0% of total UK Government tax receipts (2014: 11.5%). This includes bothtaxes borne of £26.2bn and taxes collected of £40.3bn.
• £66.5bn is 1.4% higher than our estimate of the contribution of the UK financialservices sector in 2014 (£65.6bn). The increase was driven by taxes borne andpartially offset by a decrease in taxes collected.
• Corporation tax paid by the FS sector increased from £5.4bn to £7.6bnbetween 2014 and 2015. Further, the bank levy paid increased from £2.2bn to£2.7bn between 2014 and 2015 due to rate changes. These taxes contributedto an increase in taxes borne from £24.8bn in 2014 to £26.2bn in 2015.
• Employers’ NIC is the largest tax borne at 33.5%. Corporation tax and banklevy represent a smaller portion of the total taxes borne at 19.8% and 6.8%,respectively.
• 1.1m people (3.4% of the UK workforce) were employed by the FS sector.Estimated employment taxes broadly remained stable at £30bn (2014:£30bn), with a slight decrease within these figures. These taxes represent 11%of government receipts of PAYE (pay as you earn) and NIC (nationalinsurance contributions). As with 2014, employment taxes are the largest taxesborne and collected.
• In 2007, for every £1 of corporation tax there was £1.45 of other taxes bornewhile in 2015 the figure was £4.05. The study further highlights the changingprofile of the tax system since 2007. In 2015, corporation tax represents 19.8%of taxes borne (2007: 40.8%), employers’ NIC represents 33.5% (2007: 21.3%)and irrecoverable VAT 25.3% (2007: 19.1%).
• Looking at the trend in individual taxes, the absolute amount of irrecoverableVAT has increased by 74.8% since 2007 while employers’ NIC has increased by23.4% since 2007.
• We estimate that FS companies pay £25,439 on average in employmenttaxes for each employee.
• At a sub-sector level, for the survey population, the banks are the largestemployers and are also the largest payers of tax in the sector. The banksaccount for 29.2% of participants by number, but 65.6% of the UK FS Total TaxContribution. They provide jobs for 65.3% of people employed by thecompanies in the study.
2

Purpose and outline of the study Estimating the size of the financial services sector’s tax contribution This is the eighth study we have carried out for the City of London Corporation. It looks at the Total Tax Contribution (TTC) of the FS sector in the UK for the year to 31 March 2015. The purpose of all eight studies is to estimate the size of the contribution that the financial services sector makes to tax revenues in the UK, and how this has changed over time and been affected by the economic climate and changes in government policy.
The Total Tax Contribution methodology The studies use the PwC Total Tax Contribution methodology, which looks at all the different taxes that companies pay and administer, including corporation tax, employment taxes, VAT, and other taxes. The study reports on the total taxes that are borne by these companies, and also on the taxes they administer and collect on behalf of the Government.
The distinction between taxes borne and taxes collected The Total Tax Contribution methodology makes a distinction between taxes borne and taxes collected.
Taxes borne are all the taxes levied on a company, which are its cost and will affect its results. They include corporation tax, employers’ national insurance contributions (NIC), irrecoverable VAT, and business rates. Taxes borne are a company’s direct contribution to tax revenues. Taxes collected include employee income tax and NIC administered through the payroll, and the insurance premium tax charged to customers. These are the taxes of employees and customers respectively, but are collected from them by companies and paid over to the Government. Taxes collected are generated by a company’s business activity and are part of its indirect contribution to tax revenues. Appendix 1 lists these in full.
How we collected the data This eighth study has been carried out using data provided by 48 financial services companies on all their UK tax payments. These companies employed 40.3% of the UK financial services sector workforce and include retail banks, investment banks, insurers, asset managers, real estate companies and other financial services sector companies. The results are a measure of their cash taxes paid, covering both taxes borne and taxes collected. The results provide information which would not otherwise be in the public domain, since this is not information the companies are required to disclose in their financial reports. PwC has anonymised and aggregated the data provided by the financial services companies to produce the study results. PwC has not verified, validated, or audited the data and cannot therefore give any undertaking as to the accuracy of the study results. Where we refer to data published by the Government and HMRC, this is clearly indicated.
A note on the time period covered This eighth study looks at tax payments by financial services companies in their accounting period ended in the tax year to 31 March 2015; for the majority (75%), this is the calendar year to 31 December 2014. The first study we carried out looked at tax payments by financial services companies in their accounting year ended in the tax year to 31 March 2007. The eight studies therefore measure years covering before, during and after the financial crisis and the impact of these events on UK tax
3

payments by the sector can be seen in the results. All eight studies use the same methodology and we are therefore able to compare the results.
Putting the Total Tax Contribution report in context of the current debate on tax transparency Over the nine years that this survey has been carried out, there have been significant developments in the tax transparency debate and whether large multinationals are paying ‘their fair share of tax’. Financial services companies have responded to the debate by providing more extensive voluntary disclosures on tax often including Total Tax Contribution disclosures. The OECD and EU have responded to the debate by introducing regulations requiring companies to report tax payments on a country-by-country basis.
In this current environment, data on the contribution of the financial services sector to the public finances is helpful in informing that debate, and this study features data from the highest number of participants so far.
Recent UK tax changes This eighth study shows the impact of rate changes in UK taxes during the year. The changes that have occurred to the UK tax system and which might be expected to have a significant impact on the Total Tax Contribution of the financial services sector in the UK are:
• The main rate of UK corporation tax was reduced from 23% to 21% from 1 April2014.
• The bank levy was introduced in 2011 and was intended to raise £2.5bn ayear from banks operating in the UK. The rate of the bank levy has graduallyincreased each year since its introduction in order to ensure that it raises theintended amount. By the end of 2014, the rate for short term chargeableequity or liabilities was 0.156% (2013: 0.130%), which rose to 0.21% as of 1 April2015. The rate for long term chargeable equity liabilities was 0.078% (2013:0.065%), which rose to 0.105% as of 1 April 2015.
• The threshold for the 40% rate of income tax was lowered to £31,865 from£32,011 while the personal allowance was increased from £9,440 to £10,000.
Looking forward Legislative changes have been introduced which will affect the TTC of the FS sector, specifically the banks, in future periods. Utilisation of losses brought forward by banks (those existing at 1 April 2015) will be restricted to 50%. In addition, the deductibility of compensation expenditure made by banks arising on or after 8 July 2015 will be restricted.
In the Summer 2015 Budget, the Government also announced that a corporation tax surcharge of 8% on the profits1of banking companies will apply to the banking sector from 1 January 2016. The surcharge will be paid alongside the company liability to corporation tax so the banking sector will therefore pay corporation tax at a higher rate than the headline rate of 20%. These changes were not in force in the current survey period but can be expected to impact the TTC of FS sector going forward.
1 The profits are calculated on the same basis as for corporation tax but with some reliefs added back.
4
Estimated contribution of the financial services sector in the UK
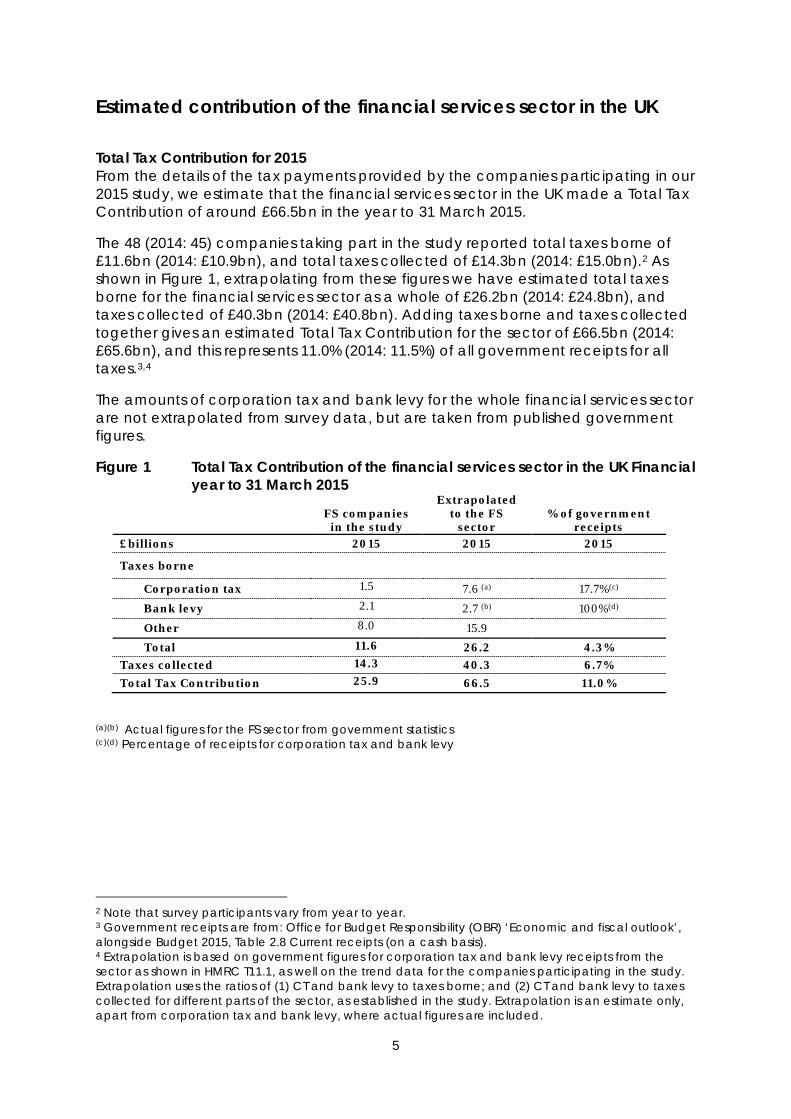
Total Tax Contribution for 2015 From the details of the tax payments provided by the companies participating in our 2015 study, we estimate that the financial services sector in the UK made a Total Tax Contribution of around £66.5bn in the year to 31 March 2015.
The 48 (2014: 45) companies taking part in the study reported total taxes borne of £11.6bn (2014: £10.9bn), and total taxes collected of £14.3bn (2014: £15.0bn).2 As shown in Figure 1, extrapolating from these figures we have estimated total taxes borne for the financial services sector as a whole of £26.2bn (2014: £24.8bn), and taxes collected of £40.3bn (2014: £40.8bn). Adding taxes borne and taxes collected together gives an estimated Total Tax Contribution for the sector of £66.5bn (2014: £65.6bn), and this represents 11.0% (2014: 11.5%) of all government receipts for all taxes.3,4
The amounts of corporation tax and bank levy for the whole financial services sector are not extrapolated from survey data, but are taken from published government figures.
Figure 1 Total Tax Contribution of the financial services sector in the UK Financial year to 31 March 2015
FS companies in the study
Extrapolated to the FS
sector % of government
receipts £billions 2015 2015 2015
Taxes borne
Corporation tax 1.5 7.6 (a) 17.7%(c)
Bank levy 2.1 2.7 (b) 100%(d)
Other 8.0 15.9
Total 11.6 26.2 4.3% Taxes collected 14.3 40.3 6.7% Total Tax Contribution 25.9 66.5 11.0%
(a)(b) Actual figures for the FS sector from government statistics (c)(d) Percentage of receipts for corporation tax and bank levy
2 Note that survey participants vary from year to year. 3 Government receipts are from: Office for Budget Responsibility (OBR) ‘Economic and fiscal outlook’, alongside Budget 2015, Table 2.8 Current receipts (on a cash basis). 4 Extrapolation is based on government figures for corporation tax and bank levy receipts from the sector as shown in HMRC T11.1, as well on the trend data for the companies participating in the study. Extrapolation uses the ratios of (1) CT and bank levy to taxes borne; and (2) CT and bank levy to taxes collected for different parts of the sector, as established in the study. Extrapolation is an estimate only, apart from corporation tax and bank levy, where actual figures are included.
5

Trends in Total Tax Contribution Figure 2 shows the Total Tax Contribution of the FS sector, as estimated in the eight studies, both as absolute amounts and as a percentage of government tax receipts.
The Total Tax Contribution has increased by 1.4% since last year. The increase was driven by taxes borne, mainly coming from corporation tax and the bank levy, and partially offset by a decrease in taxes collected. Decreases in taxes collected are due to a slight fall in employment taxes and a drop in stamp duty reserve tax. There are also small decreases in a variety of minor taxes borne that partially offset the increases in corporation tax and the bank levy.
Looking at the previous years, the estimated Total Tax Contribution fell by 9.4% comparing 2007 and 20095, driven mainly by lower corporation tax payments. The Total Tax Contribution then fell a further 13.0% between 2009 and 2010, again driven by lower corporation tax, but also reflecting other factors such as job losses in the sector and the temporary cut in the VAT rate to 15%.
In 2011, the estimated Total Tax Contribution rose by 18.0% compared to 2010. Higher payments of corporation tax, the introduction of the bank payroll tax, and increases in the standard rate of VAT all contributed to the increase. The overall amount of the estimated Total Tax Contribution remained stable between 2011 and 2012. The fall in taxes borne between 2011 and 2012 is due largely to the drop in corporation tax payments, partly explained by the reduction in the corporation tax rate and the end of bank payroll tax. The increase of 3.2% in the estimated Total Tax Contribution between 2012 and 2013 was driven by the increase in taxes borne, reflecting the increase in corporation tax and bank levy. Between 2013 and 2014, Total Tax Contribution increased by 0.9%, driven by other taxes borne, which were largely offset by a decrease in corporation tax. Increases in taxes collected in that same period were due to increases in employee income taxes and taxes deducted at source.
Figure 2 Total Tax Contribution of the FS sector in the UK
Comparison of the eight study results
Monetary figures refer to amounts of taxes borne and collected together.
5 Note: No study conducted in 2008.
£67.8 £61.4
£53.4 £63.0 £63.0 £65.0 £65.6 £66.5
13.9% 12.1%
11.2% 12.1% 11.6% 11.7% 11.5% 11.0%
0.0%
2.0%
4.0%
6.0%
8.0%
10.0%
12.0%
14.0%
16.0%
0.0
10.0
20.0
30.0
40.0
50.0
60.0
70.0
80.0
2007 2009 2010 2011 2012 2013 2014 2015Taxes borne Taxes collected FS sector as a percentage of government receipts
£bn
6

Wider economic contribution For the fourth year we asked companies to provide information on their wider economic contribution in the form of capital investments and research and development expenditure.
Thirty two companies provided data on their capital expenditure in the period under review totalling £7.1bn. Eight companies provided data on research and development expenditure of £417m.
We have collected data on the wider economic contribution since 2011 and over the four year period, companies in the survey population have contributed £22.6bn in capital investment additions and £1.3bn in research and development.
7

Trends in tax payments Trends between 2014 and 2015 The extrapolation for the financial services sector is performed at the level of taxes borne, taxes collected and those taxes for which details of taxes paid are available from the Government for the financial services sector as a whole.
In order to understand the changes in the separate taxes that make up the taxes borne and the taxes collected, and the impact that these might have on the financial services sector as a whole, we can compare like for like data for the 41 (2014: 34) financial services companies that provided data for both the 2014 and 2015 studies (figures in brackets show the change between 2013 and 2014 , relating to the 34 companies participating in both the 2013 and 2014 studies).
Taxes borne As shown in Figure 3, total taxes borne increased by 5.6% overall (2014: 0.1% decrease) for the companies in both the 2014 and 2015 studies. Figure 3 shows how particular taxes contributed to this trend. For the companies included in the trend, corporation tax payments contributed 2.2% of the overall increase, offsetting the decrease in employers’ NIC of 0.2% and the other taxes borne of 0.6%.
The bank levy paid by 14 banks in the study increased total taxes borne by 4.2%, which could be associated with an increase in rate from 0.130% to 0.156% for short term chargeable equity & liabilities and from 0.065% to 0.078% for long term chargeable equity & liabilities. Irrecoverable VAT for this period remained steady in comparison to last year.
Government data is available at the sector level and it shows that corporation tax for the FS sector increased from £5.4bn to £7.6bn between 2014 and 2015. Further, the bank levy paid increased from £2.2bn to £2.7bn between 2014 and 2015 due to rate changes.
Taxes collected As shown in Figure 3, total taxes collected decreased by 1.3% overall (2014: 1.4% increase) between 2014 and 2015 for the companies in both studies. The decrease is due to the decrease in employee income tax deducted under PAYE and employee’s NIC, a result of the drop in employment observed for the survey population in the period. Another factor contributing to this decrease in tax collected was the drop in stamp duty reserve tax of 0.4%, as shown in Figure 3.
8

Figure 3 Trends in taxes borne and collected 2014/2015 % increase/decrease
Taxes borne Corporation tax 2.2% Bank levy 4.2% Employers' NIC -0.2% Irrecoverable VAT 0.0% Other taxes borne -0.6% Total increase 5.6% Taxes collected Employee income tax -0.9% Employees' NIC -0.2% Net VAT 0.0% Tax deducted at source 0.1% Stamp Duty Reserve Tax -0.4% Insurance premium tax 0.1% Total increase -1.3%
Trends between 2007 and 2015 Eighteen companies from the 2015 study also participated in the first study in 2007, so we can look at the trends for this smaller group over that period, spanning before and after the financial crisis.6
Figure 4 shows the trends in taxes borne and collected for the smaller group since the first study was carried out in 2007. Overall, total taxes borne for the 18 financial services companies in both studies are 4.3% lower than in 2007. Although there is a lower corporation tax payment, the overall taxes borne level is almost flat, driven by bank levy and irrecoverable VAT. In addition, employers’ NIC increased due to increases in employment from 2007 to 2015.
The statutory rate of corporation tax has decreased from 30% in 2007 to 21% in 2014. In addition, the 2015 corporation tax payments are affected by the legacy of the financial crisis and corresponding decline in profitability. Increases in irrecoverable VAT, employers’ NIC and the introduction of the bank levy partly offset the fall in corporation tax.
Taxes collected have increased by 15.0% since 2007, driven by increased tax deducted at source and employee income tax.
6 For the companies participating in both the 2014 and 2015 studies, and in both the 2007 and 2015 studies, trends in the tax payments have been calculated on a like-for-like basis. Figures are included only where the same companies provided data for the same taxes in both years.
9

Figure 4 Trends in taxes borne and collected 2007/2015
% increase/decrease
Taxes borne Corporation tax -47.1% Bank levy 24.8% Employers NIC 4.0% Irrecoverable VAT 14.3% Other taxes borne -0.3% Total decrease -4.3% Taxes collected Employee income tax 10.7% Employee NIC -1.5% Net VAT 1.5% Tax deducted at source 5.4% Other taxes collected -1.1% Total increase 15.0%
Figure 5 shows the trend since 2007 in the total amount of corporation tax and taxes borne paid by the 12 companies that have participated in all eight years of the study, taking 2007 as the base year. The impact of the financial crisis can be seen in the 2009 and 2010 studies.
For this sample of companies, there has been a substantial fall in corporation tax. In the early years of the study, the trend in taxes borne followed the trend in corporation tax. More recently, while corporation tax has fallen, the amount of taxes borne has increased, highlighting the changing profile of taxes on the financial services sector. In particular, the total of corporation tax and bank levy has remained broadly constant between 2011 and 2015.
Figure 5 Trend in taxes borne for companies that have participated in all years of the study
Over the period from 2007 to 2015, the profile of taxes borne has changed for financial services companies as shown by Figure 6. In 2007 corporation tax was 40.8% of total taxes borne, with employers’ NIC accounting for 21.3%. In 2015, corporation tax is 19.8% of taxes borne and employers’ NIC is 33.5%.
0%
20%
40%
60%
80%
100%
120%
2007 2009 2010 2011 2012 2013 2014 2015
Corporation Tax Corporation Tax and Bank Levy Total Taxes Borne
10

In part this is due to changes in the Government’s tax regime; there have been increases in the rates of employers’ NIC from 12.8% to 13.8% and in irrecoverable VAT from 17.5% to 20% between 2007 and 2015. In addition, the legacy of the financial crisis created tax losses brought forward which offset the corporation tax due on current profits. As a result, there is a drop in the level of corporation tax payments in 2015, combined with the lower statutory corporate tax rate of 21% in 2015, compared to 30% in 2007. The Government introduced the bank levy in 2011and this represented 6.8% of taxes borne in 2015.
Figure 6 The changing profile of the tax system from 2007 to 2015: Taxes Borne
Corporation tax, 40.8%
Corporation tax, 19.8%
Business rates, 6.5%
Business rates, 8.1%
Stamp duties, 10.8%
Stamp duties, 5.7%
PSA & Employers NIC, 21.3%
PSA & Employers NIC, 33.5%
Bank Levy, 6.8%
Irrecoverable VAT, 19.1%
Irrecoverable VAT, 25.3%
Other taxes 1.5% Other taxes 0.8%
0%
10%
20%
30%
40%
50%
60%
70%
80%
90%
100%
2007 2015
11

Profile of taxes paid by survey participants As well as looking at the amounts of each tax borne or collected by the study participants, we have considered the relative proportions of the different taxes in more detail.
Profile of taxes borne Figure 7 shows the profile of taxes borne for companies providing data for the study. All of these taxes are a direct cost to these companies and have an impact on their financial results. Aside from corporation tax, many are “above the line” taxes that are deductible in calculating profit before tax, and will not be separately disclosed in financial statements. Total taxes borne are the direct tax contributions of financial services companies to the public finances.
For every £1 of corporation tax paid there is another £4.05 (2014: £4.85) paid in other taxes borne. Employers’ NIC is 33.5% of the total, the largest tax borne, followed by irrecoverable VAT (25.3%). Corporation tax is the third largest tax borne (19.8%); this proportion has increased compared to 2014 (17.1%).
Figure 7 Taxes borne by financial services companies
Chart shows the average result for companies in the study.
The high percentage of employers’ NIC reflects that the companies in the study are large employers, together employing 447,528 (2014: 469,502) staff. Payment of the bank levy in the 2015 study period represents 6.8% (2014: 4.6%) of taxes borne on average.
Irrecoverable VAT is the second largest tax cost for the financial services sector at 25.3% (2014: 26.9%) of total taxes borne on average. We have extrapolated from the figures provided in the study to estimate irrecoverable VAT for the financial services as a whole being in the region of £6.1bn to £7.2bn.7
7 Extrapolation uses the ratio of irrecoverable VAT to taxes borne (excluding bank levy and corporation tax), averaged across the different parts of the sector. Extrapolation is an estimate only.
Corporation tax 19.8%
Business rates 8.1%
Stamp duties 5.7%
PSA & Employers NIC 33.5%
Bank Levy 6.8%
Irrecoverable VAT 25.3%
Other taxes 0.8%
12

Profile of taxes collected Figure 8 shows the profile of the taxes collected by the companies in the study. These are the taxes collected from employees and customers and are not a direct cost to the companies themselves, other than the cost of administration. The companies are responsible for administering these taxes and paying the amounts collected over to the Government, and we are therefore able to measure the cash contribution to the public finances. Taxes collected arise from the jobs created and the services provided to customers by financial services companies and are part of their indirect contribution to tax revenues.
Taxes collected are 1.24 times the size of taxes borne (2014: 1.37), and for every £1 of corporation tax paid by financial services companies there is another £6.29 (2014: £8.04) in taxes collected.
Figure 8 Taxes collected by financial services companies
Chart shows the average result for companies in the study.
Employees’ income tax and NIC deducted under PAYE are the largest taxes collected, and together represent on average 65.2% (2014: 55.9%) of the total.
The financial services sector also administers and collects VAT and several other taxes on behalf of government. On average, tax deducted at source is 17.6% (2014: 16.7%) of the total, and includes tax deducted from interest paid to customers by the retail banks, and from annuities paid by life insurers. Insurance companies (non-life insurers) administer insurance premium tax, investment banks administer stamp duty reserve tax, and real estate companies administer the property income distribution.
Total Tax Contribution profile Figure 9 combines taxes borne and taxes collected to show the average Total Tax Contribution profile for companies in the study.
Employment by the sector generates the largest amounts of tax paid into the public finances. NIC (employer and employee) and employee income tax under PAYE together account for 47.3% (2014: 45.3%) of the total.
Tax deducted at source 17.6%
SDRT 2.7%
PAYE 55.7%
Employee NIC 9.5%
Net VAT 5.4%
IPT 9.1%
13
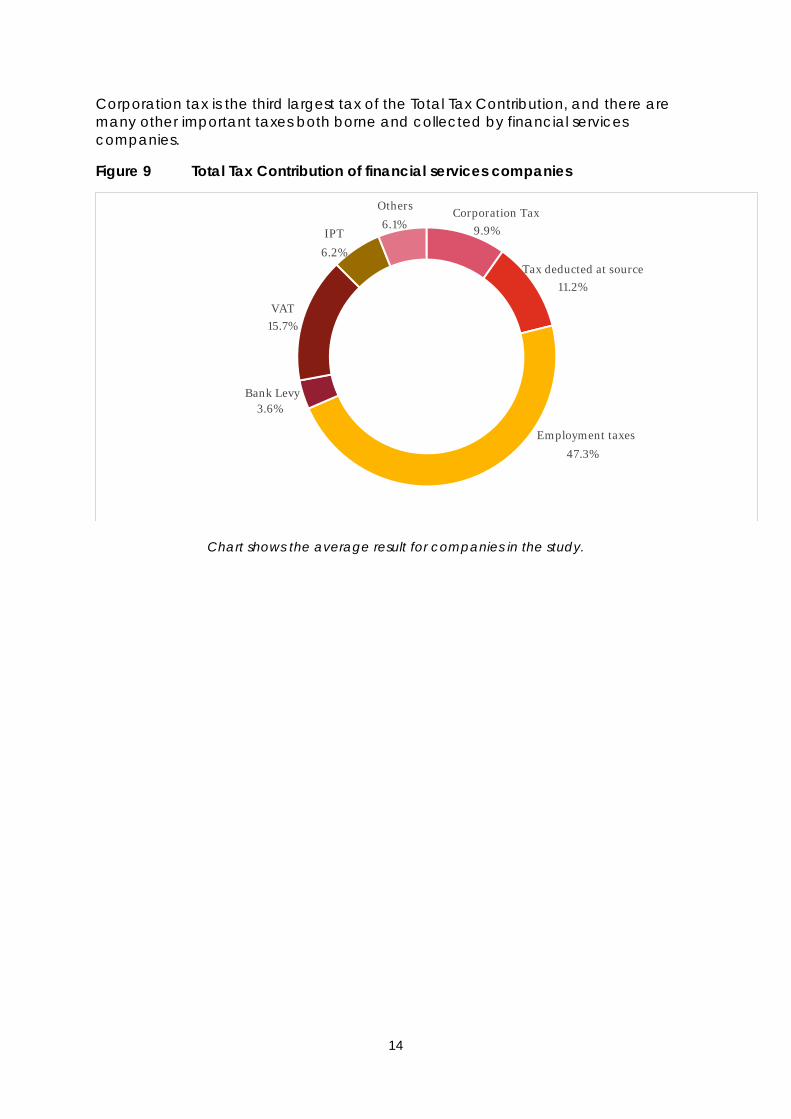
Corporation tax is the third largest tax of the Total Tax Contribution, and there are many other important taxes both borne and collected by financial services companies.
Figure 9 Total Tax Contribution of financial services companies
Chart shows the average result for companies in the study.
Corporation Tax 9.9%
Tax deducted at source 11.2%
Employment taxes
47.3%
Bank Levy 3.6%
VAT 15.7%
IPT
6.2%
Others
6.1%
14

Employment taxes Extrapolation of the employment taxes paid by the financial services sector Employment is an important way in which the financial services sector contributes to the UK economy. Government figures show that the sector employs over 1.1 million employees, which is 3.4% (2014: 3.7%) of the total UK workforce (both private and public sector together).8 Using the data provided for this study, we estimate that employment in the financial services sector generates total employment taxes of around £30bn (see Figure 10).9 We estimate this to be 11% of Government tax receipts from employment.10 Overall, the employment taxes remained broadly stable with slight decrease from 2014 (£30bn) due to a small drop in the employment in the financial sector. Publicly available data shows that the number of employees fell in some subsectors within the financial services sector.11
Figure 10 shows the employment taxes for the financial services companies taking part in the study, totalling £11.7bn. This includes the employer NIC totalling £3.1bn, and employee NIC and income tax deducted under PAYE totalling £8.6bn. Extrapolating from these figures, we estimate total employment taxes borne by the sector of £8bn (2014: £8bn) and total employment taxes collected of £22bn (2014: £22bn). Employment taxes account for the largest share of taxes borne and collected by financial services companies; and these taxes arising from the employment generated by the sector are a major contribution to the public finances. Furthermore, employment taxes provide a more stable source of revenue for the government than corporation tax receipts which are more volatile and depend on profitability and the economic cycle.
Figure 10 Employment taxes borne and collected by the financial services sector in the UK
FS companies in the study
Extrapolated to the FS sector
£billions 2015 2015 Employment taxes borne
Employer NIC 3.1(a) 8
Employment taxes collected
Employee PAYE and NIC 8.6 22
Total employment taxes 11.7 30
(a) Includes benefit tax (PAYE agreements) of £45.8m (2014: £58.7m).
8 Office for National Statistics, ‘Labour market statistics’, October 2015, employment table JOBS02. 9 Extrapolation has been carried out using trends in employment taxes per employee, multiplying the average employers’ NIC, employees’ NIC and PAYE for the employees in the study to the total number of employees in the FS sector and using the ratio of employment taxes to TTC. Extrapolation is an estimate only. 10 Calculation is extrapolated employment taxes as a percentage of government receipts for income tax under PAYE and all NIC receipts. 11 Office for National Statistics, Business Register and Employment Survey (BRES), Table 2: Industry.
15
Wages and taxes per employee The financial services sector employs skilled, well-paid, staff. Across all employees in the study, the average wage12 was £54,257. The UK national average for the period was £27,200.13 Companies that employed 74% of the employees paid an average wage per employee less than £60,000.
For 2015, employment taxes per employee is £25,439 on average14 including taxes borne and collected. To also create a like-for-like comparison, we included only those companies that provided both wages and employment taxes in 2015 and 2014, from the total survey population. In this case, there was an increase in average employment taxes per employee of 2%. These are an indicator of the direct benefit to the Exchequer for each job created or maintained in the sector. For the companies which together employed 74% of employees, the average employment taxes per employee are less than £30,000.
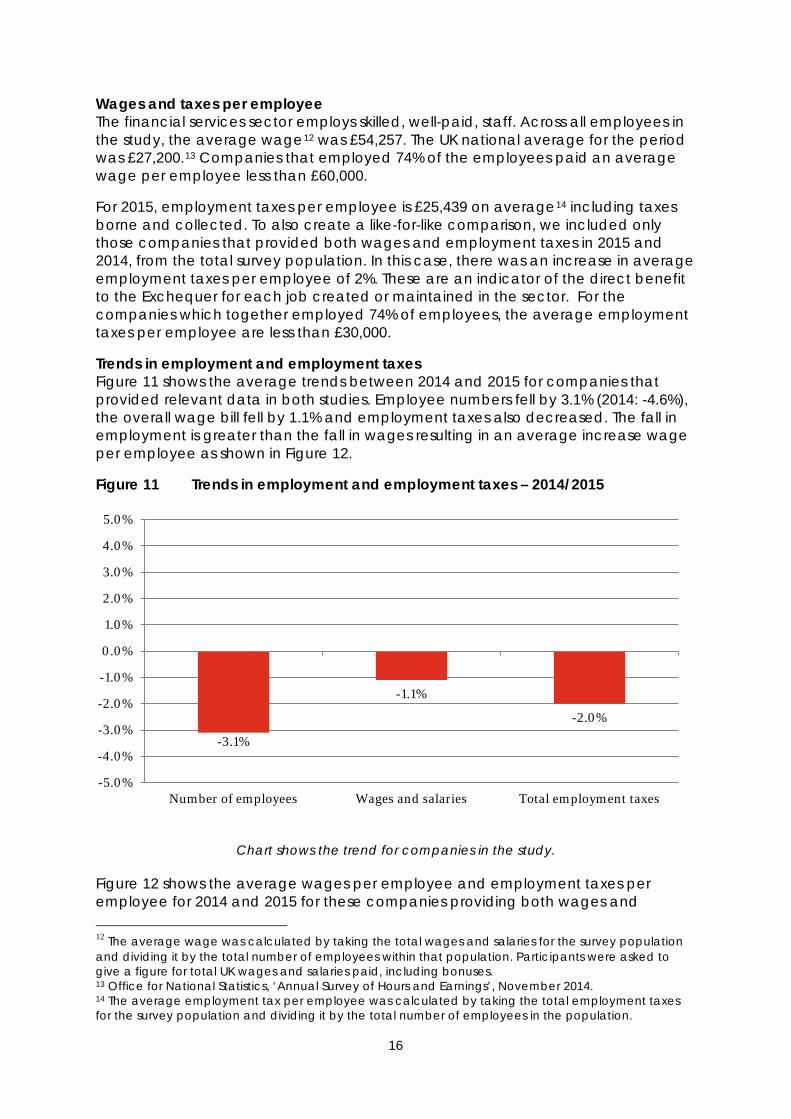
Trends in employment and employment taxes Figure 11 shows the average trends between 2014 and 2015 for companies that provided relevant data in both studies. Employee numbers fell by 3.1% (2014: -4.6%), the overall wage bill fell by 1.1% and employment taxes also decreased. The fall in employment is greater than the fall in wages resulting in an average increase wage per employee as shown in Figure 12.
Figure 11 Trends in employment and employment taxes – 2014/2015
Chart shows the trend for companies in the study.
Figure 12 shows the average wages per employee and employment taxes per employee for 2014 and 2015 for these companies providing both wages and
12 The average wage was calculated by taking the total wages and salaries for the survey population and dividing it by the total number of employees within that population. Participants were asked to give a figure for total UK wages and salaries paid, including bonuses. 13 Office for National Statistics, ‘Annual Survey of Hours and Earnings’, November 2014. 14 The average employment tax per employee was calculated by taking the total employment taxes for the survey population and dividing it by the total number of employees in the population.
-3.1%
-1.1%
-2.0%
-5.0%
-4.0%
-3.0%
-2.0%
-1.0%
0.0%
1.0%
2.0%
3.0%
4.0%
5.0%
Number of employees Wages and salaries Total employment taxes
16
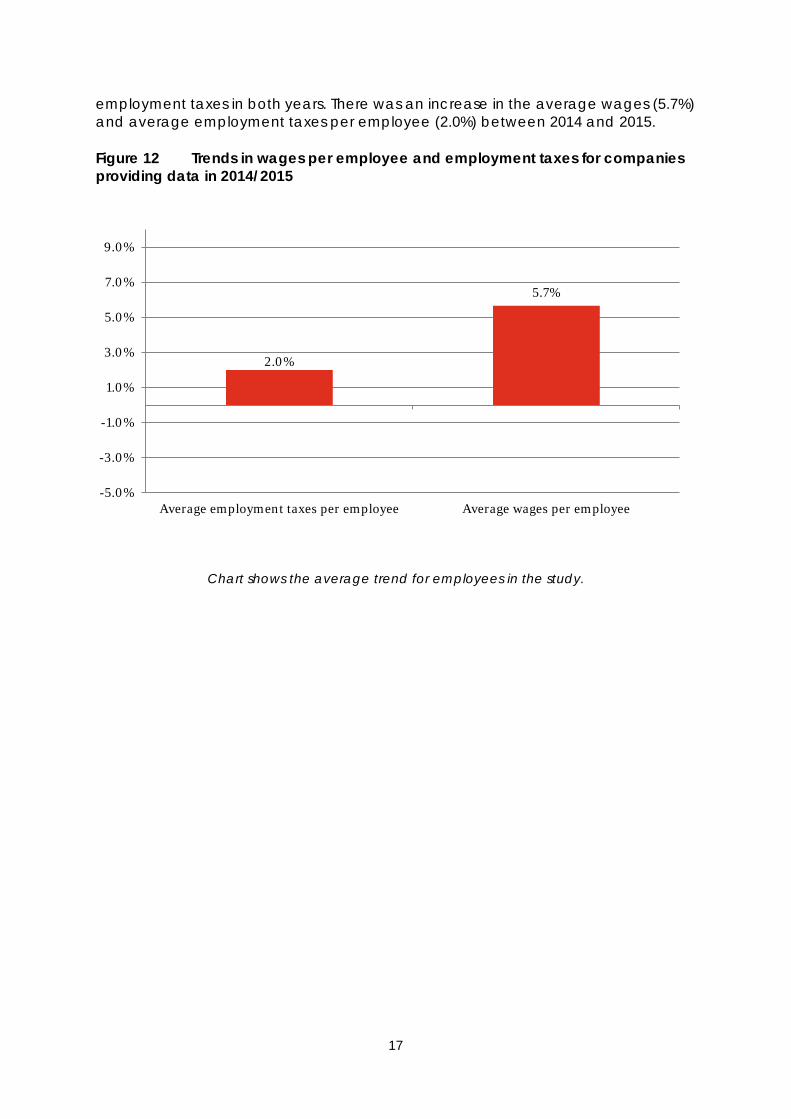
employment taxes in both years. There was an increase in the average wages (5.7%) and average employment taxes per employee (2.0%) between 2014 and 2015.
Figure 12 Trends in wages per employee and employment taxes for companies providing data in 2014/2015
Chart shows the average trend for employees in the study.
2.0%
5.7%
-5.0%
-3.0%
-1.0%
1.0%
3.0%
5.0%
7.0%
9.0%
Average employment taxes per employee Average wages per employee
17

Corporation tax The financial services sector paid more corporation tax than North Sea companies. Government figures show the importance of the financial services sector for corporation tax receipts. The figures show that in 2015, the corporation tax payments of the financial services sector are higher than those of North Sea companies, due in part to a reduction in oil prices, and increases in operating costs and capital investment in the North Sea. In 2015, financial services companies paid 17.7% (2014: 13.9%) of total corporation tax receipts, and North Sea companies 4.8% (2014: 9.2%).15 16
Figure 13 Government corporation tax receipts by business sector
The trend in corporation tax Government receipts from corporation tax have been heavily affected by the financial crisis, as well as by the reduction in the main corporation tax rate from 30% in 2007/2008 to 28% in 2008/2009, 26% in 2011/2012, 24% in 2012/2013, 23% in 2013/2014 and 21% in 2014/2015. The total from all business sectors in 2015 is 2.9% below that in 2007.
Figure 14 shows rates of corporation tax and the pattern of corporation tax receipts from the financial services sector for all years from 2001 (tax year to March 2001). It shows a cyclical pattern over the last fifteen years. From 2014 to 2015, corporation tax payments increased irrespective of the fall in the tax rate.
15 HMRC National Statistics, ‘Corporation Tax’ - Table T11.1 16 Other industrial and commercial sector includes a variety of subsectors such as health, communication, etc.
-
5.00
10.00
15.00
20.00
25.00
Manufacturing Distribution Financial Services North Seacompanies
Other industrialand commercial
(£bn
)
FY2006 FY2007 FY2008 FY2009 FY2010 FY2011 FY2012 FY2013 FY2014 FY2015
18

Figure 14 Rates of corporation tax and government corporation tax receipts from the financial services sector
11.3 10.5
7.2 7.0
8.9
11.2 12.2 12.4
7.7
5.6
7.2
5.4 6.5
5.4
7.6
30% 30% 30% 30% 30% 30% 30% 30% 28% 28% 28% 26% 24% 23% 21%
0%
10%
20%
30%
40%
50%
60%
70%
0.0
2.0
4.0
6.0
8.0
10.0
12.0
14.0
£' b
n
Corporation tax receipts Corporation tax rates
19
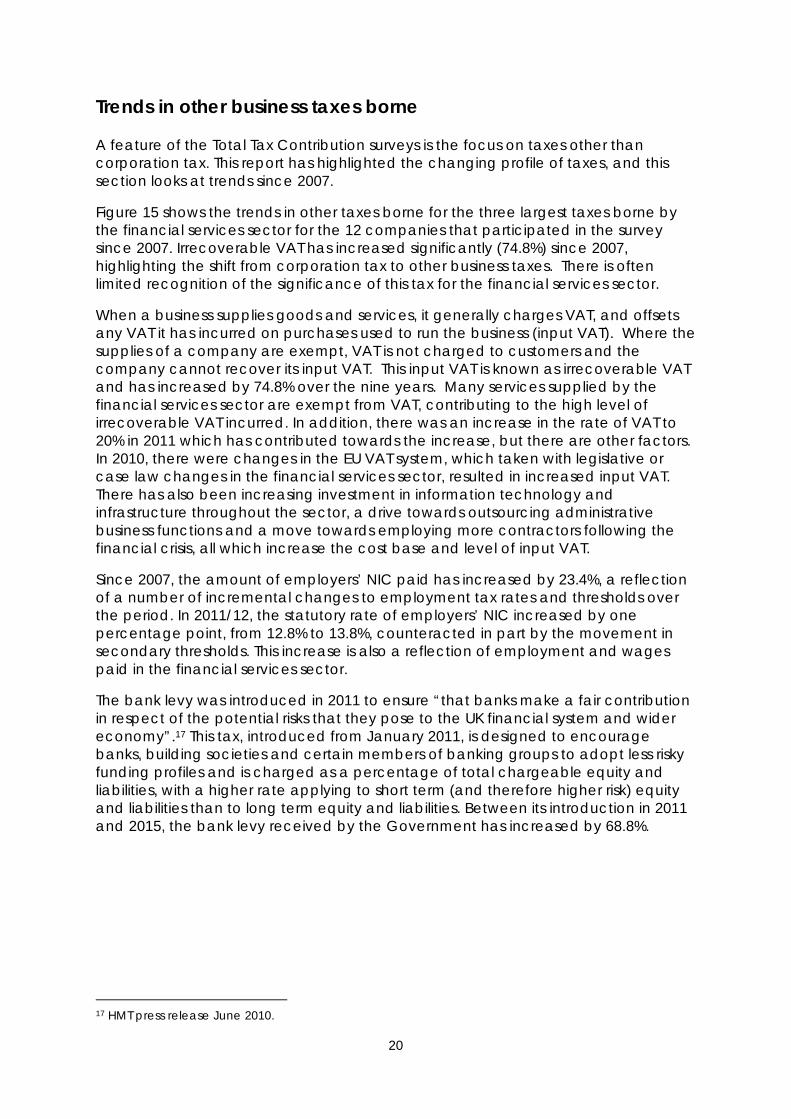
Trends in other business taxes borne
A feature of the Total Tax Contribution surveys is the focus on taxes other than corporation tax. This report has highlighted the changing profile of taxes, and this section looks at trends since 2007.
Figure 15 shows the trends in other taxes borne for the three largest taxes borne by the financial services sector for the 12 companies that participated in the survey since 2007. Irrecoverable VAT has increased significantly (74.8%) since 2007, highlighting the shift from corporation tax to other business taxes. There is often limited recognition of the significance of this tax for the financial services sector.
When a business supplies goods and services, it generally charges VAT, and offsets any VAT it has incurred on purchases used to run the business (input VAT). Where the supplies of a company are exempt, VAT is not charged to customers and the company cannot recover its input VAT. This input VAT is known as irrecoverable VAT and has increased by 74.8% over the nine years. Many services supplied by the financial services sector are exempt from VAT, contributing to the high level of irrecoverable VAT incurred. In addition, there was an increase in the rate of VAT to 20% in 2011 which has contributed towards the increase, but there are other factors. In 2010, there were changes in the EU VAT system, which taken with legislative or case law changes in the financial services sector, resulted in increased input VAT. There has also been increasing investment in information technology and infrastructure throughout the sector, a drive towards outsourcing administrative business functions and a move towards employing more contractors following the financial crisis, all which increase the cost base and level of input VAT.
Since 2007, the amount of employers’ NIC paid has increased by 23.4%, a reflection of a number of incremental changes to employment tax rates and thresholds over the period. In 2011/12, the statutory rate of employers’ NIC increased by one percentage point, from 12.8% to 13.8%, counteracted in part by the movement in secondary thresholds. This increase is also a reflection of employment and wages paid in the financial services sector.
The bank levy was introduced in 2011 to ensure “that banks make a fair contribution in respect of the potential risks that they pose to the UK financial system and wider economy”.17 This tax, introduced from January 2011, is designed to encourage banks, building societies and certain members of banking groups to adopt less risky funding profiles and is charged as a percentage of total chargeable equity and liabilities, with a higher rate applying to short term (and therefore higher risk) equity and liabilities than to long term equity and liabilities. Between its introduction in 2011 and 2015, the bank levy received by the Government has increased by 68.8%.
17 HMT press release June 2010.
20

Figure 15 Trend in other taxes borne payments for financial services companies
Chart shows the average trend for companies in the study providing data for each year. Bank levy represents the Government figures.
0%20%40%60%80%
100%120%140%160%180%200%
2007 2009 2010 2011 2012 2013 2014 2015
VAT NI Bank Levy
21

Putting Total Tax Contribution data in the context of turnover and profits
The total amount of taxes borne and collected, as a percentage of turnover is an indication of the size of the Total Tax Contribution of the financial services sector companies in relation to the size of their business.
On average, the Total Tax Contribution for 2015 was equivalent in size to 23.9% (2014: 22.1%) of turnover, with a split of 9.5% taxes borne and 14.4% taxes collected (2014: 7.3% taxes borne and 14.8% taxes collected). These figures reflect the broadly constant level of turnover between 2014 and 2015, an increase in taxes borne and a decrease in taxes collected as compared to the survey population. Figure 16 shows the comparison with previous studies.
In 2007, Total Tax Contribution as a percentage of turnover was 15.4%. In 2009 during the recession, it rose to 18.7% as turnover fell to a greater extent than taxes which in turn reflects the impact of non-profit related taxes. Turnover recovered in 2010, but since 2011 it has been slowly declining. As turnover has declined the impact of these taxes not directly related to profit, such as the bank levy or irrecoverable VAT, has led to a steady increase in the proportion of revenue taken up by taxes.
Figure 16 Total Tax Contribution as a percentage of turnover for financial services companies
Comparison of the eight study results
Chart shows the average result for companies in each study.
7.4% 8.2%
7.3% 7.0% 6.8% 7.3% 7.3%
9.5%
8.0%
10.5% 11.1% 11.9%
13.2%
13.8% 14.8%
14.4%
0.0%
5.0%
10.0%
15.0%
20.0%
2007 2009 2010 2011 2012 2013 2014 2015
Taxes collected
Taxes borne
22

In addition to turnover, we are able to compare the tax contribution to profits, using the Total Tax Rate methodology. It is calculated by taking total taxes borne as a percentage of profits before all those taxes borne. Only taxes borne are included in the Total Tax Rate calculation; taxes collected are not included.
As profitability improves during periods of growth, and falls in a recession, this results in a change in corporation tax payments. By contrast, other taxes borne, which are not directly linked to profits, remain more stable, with an impact on the Total Tax Rate.
The Total Tax Rate increases during a recession as the non-profit related taxes increase as a proportion of profits. In addition, a recession gives rise to corporation tax losses which are carried forward for use in future years.
As the economy recovers, profits increase, and other taxes borne are more stable causing the Total Tax Rate to decrease. In addition, losses brought forward offset the corporation tax due on these profits, depressing the Total Tax Rate even further. This is illustrated in Appendix 3.
The average Total Tax Rate for financial services companies in the 2015 study is 30.2% (2014: 39.0%). This fall is the result of a 22% average increase in profitability, brought forward corporation tax losses which have reduced taxable profits and there is some volatility in the individual companies.
Figure 17 shows the average Total Tax Rate in each of the eight studies. In the 2009 study, the average rate rose sharply above the rate in the first (2007) study, carried out before the financial crisis. This was due to falling profits between the two years. In this period corporation tax payments fell with declining profit, but payments of the other taxes borne, which are not so directly linked to profits, remained more stable and the Total Tax Rate rose as a result.
As profits have recovered since the 2009 study, Total Tax Rates have reduced. In 2014 and 2015 the fall in the Total Tax Rate reflects the recovery in profitability, the impact of losses brought forward and some volatility in the data.
23

Figure 17 Total Tax Rates for financial services companies
Comparison of the eight study results
Chart shows the average results for companies in each study, GDP and UK statutory corporation Tax rates throughout the years.
36.4%
57.4%
48.5% 47.5%
39.5% 42.5%
39.0%
30.2%
30% 28% 28% 28% 26%
24% 23%
21%
-
500,000
1,000,000
1,500,000
2,000,000
2,500,000
3,000,000
0%
10%
20%
30%
40%
50%
60%
2007 2009 2010 2011 2012 2013 2014 2015TTR UK Statutory Tax Rate GDP
24

Results for different parts of the sectorOverview of the companies that participated The companies that participated in the 2015 survey represent a significant part of the financial services sector in the UK (Figure 18). In total, 48 financial services companies provided data on their UK tax payments for the 2015 study (2014: 45) and together they employed 40.3% (2014: 41.6%) of the total employees in the sector.
The breakdown of these by sector is shown below:
Figure 18 Survey participants by sector
Asset manager 6 12% Insurance 8 17% Investment bank 6 13% Investment services 2 4% Real estate 4 8% Retail & commercial banks 8 17% Life insurance 8 17% Other financial services 6 12% Total 48 100%
The participants included UK listed (60%), foreign listed (30%), and privately owned/mutual companies (10%).
Given the range of sub-sectors, this section provides some results separately for three sub-sectors – banks (including retail and investment banks), insurers (life and general insurance), and all other financial services.
The banking sector accounts for the greatest share of Total Tax Contribution Figure 19 shows an analysis of the Total Tax Contribution figures (taxes borne and collected together) for the 48 companies taking part in the 2015 study split into banking, insurance and other sectors.
The banks are the largest taxpayers in the sector, with 65.6% (2014: 64.7%) of the Total Tax Contribution figures, 45.2% (2014: 46.7%) coming from UK based banks and 20.3% (2014: 18.0%) from foreign banks.
25

Figure 19 Analysis of study data by financial services sub-sector – number of companies in the study and Total Tax Contribution figures
The banking sector accounts for the greatest share of employment and employment taxes The banks in the study are also the largest employers and generate the largest employment taxes. Figure 20 analyses the study figures by sub-sector and shows that, for the study participants, banks employed 65.3% (2014: 63.1%) of the employees and generated 72.1% (2014: 73.1%) of the employment taxes (employer taxes borne, and employee taxes collected together).
Figure 20 Analysis of study data by financial services sub-sector – employee numbers and employment taxes
Again, these are figures only for the companies in the study. Employment tax figures for the entire banking sector for 2006 to 2015 are shown in Figure 23.
Taxes borne and taxes collected by sector Figure 21 breaks down the Total Tax Contribution figures to show an analysis by sector for corporation tax, total taxes borne (including corporation tax), and taxes
29.2% 33.3%
37.5%
65.6%
26.5%
8.0%
0.0%
10.0%
20.0%
30.0%
40.0%
50.0%
60.0%
70.0%
Banks Insurance OthersNo. of companies TTC
65.3% 72.1%
29.3% 17.0%
5.4% 10.9%
0%
20%
40%
60%
80%
100%
Number of employees Employment taxes borne and collected
Banks Insurers Other
26

collected. The insurance companies pay a greater proportion of taxes collected than they do of taxes borne. This is due, in part, to the fact that the insurance companies collect insurance premium tax from their customers and pay it over to the Government.
It is important to stress that Figure 18, Figure 19, Figure 20 and Figure 21 show an analysis only of the figures provided by the companies in the study, and so cannot be extrapolated to the sector as a whole.
Figure 21 Analysis of study data by financial services sub-sector – corporation tax, total taxes borne, taxes collected and Total Tax Contribution
As can be seen from Figure 21, of the industries in the study, the insurance companies are the largest payers of corporation tax (45.8%, 2014: 55.8%) whereas the banks have the biggest proportion of total taxes borne (74.0%, 2014: 71.9%), including employers’ NIC, irrecoverable VAT and bank levy, as well as corporation tax. The banks have been the biggest payers of taxes borne in all eight studies and this compares to 70.3% in 2007. The banks are also the biggest collectors of taxes, with 58.8% (2014: 59.5%) of the figures in 2015.
Corporation tax in the banking sector The previous figures are only for companies included in the study. However, HM Revenue & Customs have published details of employment taxes and corporation tax receipts from the entire banking sector from 2006 to 2015.18
Figure 22 shows these figures for corporation tax together with the total corporation tax receipts from the financial services sector. It is clear that lower payments by the banks following the financial crisis have had a major impact on corporation tax receipts from the sector. The increase in corporation tax payments by the banking sector of 66.7% between 2010 and 2011 reversed in 2012 with a 62.9% decrease and increased again in 2013 with a rise of 76.9%. The corporation tax receipts from the banks have decreased by 30.4% between 2013 and 2014 and increased again in 2015. The bank levy (£1.6bn in 2012 and 2013, £2.2bn in 2014 and £2.7bn in 2015) is not included in Figure 22. The bank levy was introduced to offset the expected reduction in corporation tax payments by banks following reductions in the statutory rate of corporation tax.
18 HM Revenue & Customs Official Statistics August 2015, Pay As You Earn and corporation tax receipts from the banking sector.
37.5%
74.0% 58.8% 65.6%
45.8%
19.7% 31.9%
26.5%
16.6% 6.3% 9.3% 8.0%
0.0%
10.0%
20.0%
30.0%
40.0%
50.0%
60.0%
70.0%
80.0%
90.0%
100.0%
Corporation tax Total taxes borne Total taxes collected TTC
Other
Insurers
Banks
27

Figure 22 Corporation tax paid by the FS sector – 2006 to 2015
Employment taxes by sector The recent HM Revenue & Customs paper also included employment tax figures for the entire banking sector for 2006 to 2015 and these are shown in Figure 23.
Figure 23 Employment taxes paid by the banking sector – 2006 to 2015
There was an increase in employment taxes paid by the banking sector between 2014 and 2015 of 1.7%. Since 2009 the employment taxes has increased by 27.9%. For the last five years, receipts of employment taxes from the banking sector have been greater than before the financial crisis.
4.2 4.9
5.8
3.8 3.5 3.7 4.1 4.2 3.8 5.3
7.0
7.3 6.6
3.9
2.1
3.5 1.3
2.3 1.6
2.3
-
2
4
6
8
10
12
14
2006 2007 2008 2009 2010 2011 2012 2013 2014 2015
£bn
Banking sector
All FS excluding bankingsector
13.6
15.9 16.7
14.0 15.2
17.5 17.6 17.8 17.6 17.9
0.0
2.0
4.0
6.0
8.0
10.0
12.0
14.0
16.0
18.0
20.0
2006 2007 2008 2009 2010 2011 2012 2013 2014 2015Employment taxes borne and collected
£bn
28

The following appendices detail the UK taxes borne and collected by financial services companies, and the data provided on total taxes borne and collected by the 48 financial services companies taking part in the study, and an illustration of Total Tax Rate trend, during an economic cycle.
29
Appendices
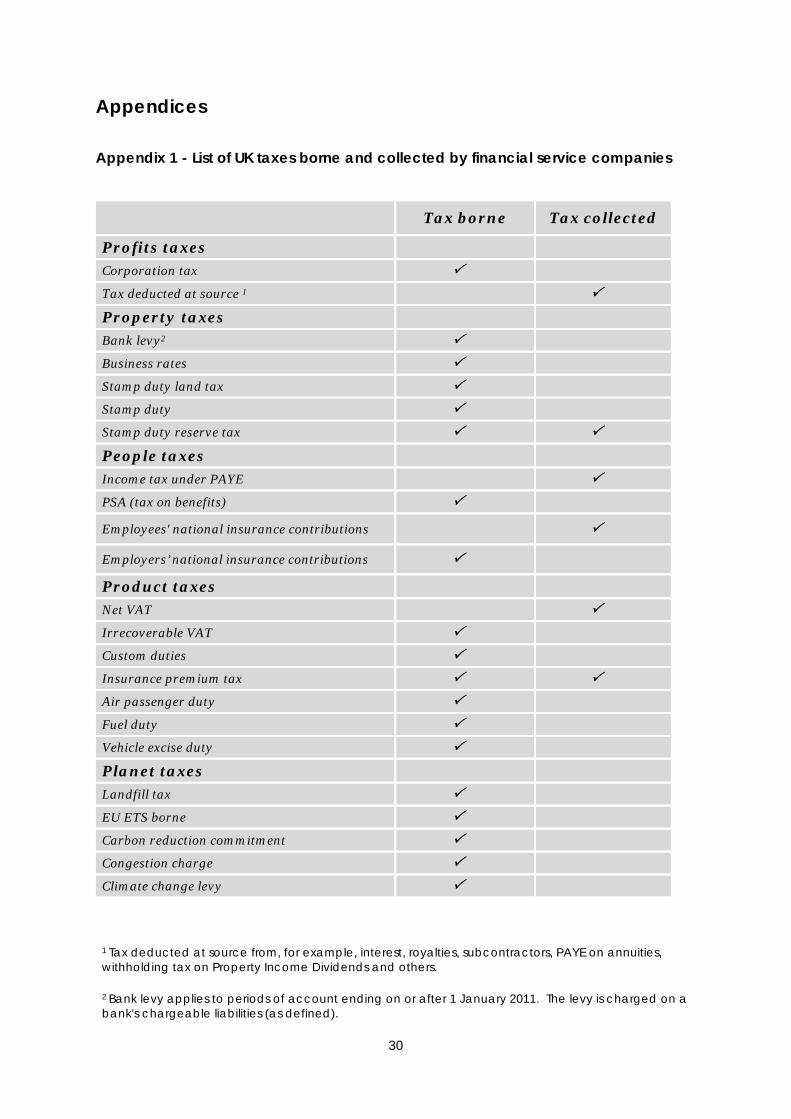
Appendix 1 - List of UK taxes borne and collected by financial service companies
Tax borne Tax collected
Profits taxes Corporation tax Tax deducted at source 1
Property taxes Bank levy2 Business rates Stamp duty land tax Stamp duty Stamp duty reserve tax
People taxes Income tax under PAYE
PSA (tax on benefits)
Employees' national insurance contributions
Employers’ national insurance contributions
Product taxes Net VAT
Irrecoverable VAT Custom duties Insurance premium tax
Air passenger duty Fuel duty Vehicle excise duty Planet taxes Landfill tax EU ETS borne Carbon reduction commitment Congestion charge Climate change levy
1 Tax deducted at source from, for example, interest, royalties, subcontractors, PAYE on annuities, withholding tax on Property Income Dividends and others.
2 Bank levy applies to periods of account ending on or after 1 January 2011. The levy is charged on a bank's chargeable liabilities (as defined).
30

Appendix 2 - Data provided by 48 financial services companies taking part in the study Taxes borne and collected in their accounting year ended in the year to 31 March 2015.
Taxes borne £millions
Profit taxes Corporation tax 1,532.3
Property taxes Bank levy 2,130.2
Business rates 661.9
Stamp duty land tax 195.6
Stamp duty 2.2
Stamp duty reserve tax 89.0
People taxes PSA (tax on benefits) 45.8
Employers' NIC 3,080.7
Product taxes Irrecoverable VAT 3,761.9
Customs duties 0.3
Insurance premium tax 4.9
Air passenger duty 6.6
Fuel Duty -
Vehicle excise duty 26.6
Planet taxes Landfill tax 1.0
EU ETS Borne -
Carbon reduction commitment 11.7
Congestion charge 0.1
Climate change levy 7.1
Total taxes borne 11,557.9
Taxes collected Profit taxes Tax deducted at source 3,231.9
Property taxes Stamp duty reserve tax 796.9
People taxes Income tax under PAYE 7,359.7
Employee's NIC 1,198.8
Product taxes Net VAT 642.3
Insurance premium tax 1,159.0
Total taxes collected 14,388.6
Total tax contribution 25,946.5
31

Appendix 3 – Illustration of Total Tax Rate trend during an economic cycle The chart below helps to illustrate behaviour of the Total Tax Rate before, during and after a recessionary period. Total Tax Rate fluctuates during an economic cycle as losses carried forward in times of recession are utilised in future years.
X0 X1 X2 X3 X4 X5
(A) Profit before all taxes 100 1 30 80 100 120
(B) Other taxes (20) (20) (20) (20) (20) (20)
(C)=(A)-(B) Profit after other taxes 80 (19) 10 60 80 100
(D) Claimed losses 0 0 0 (5) (6) (8)
(E)=[(C)-(D)]x20% Profit taxes (16) 0 (2) (11) (15) (18)
(due at 20%)
(F)=(C)+(E) Net profit 64 -19 8 49 65 82
(G)=(B)+(E) Total Taxes 36 20 22 31 35 38
(H)=(G)/(A) Total Tax Rate 36% 2000% 73% 39% 35% 32% Assumptions:
a. Above the line taxes remained fairly constant throughout the period.
b. The profit tax rate is 20% throughout the whole period.
32

Total Tax Contribution of UK Financial ServicesEighth EditionRESEARCH REPORT CITY OF LONDON CORPORATION DECEMBER 2015
www.cityoflondon.gov.uk/economicresearch
Related Documents