I | Page Chapter 1: Introduction 1.1. Company Profile: Farid Group a leading rope and net manufacturing company in Bangladesh. They have been manufacturing PE /PP rope since 1978. They have been leading the local market and exporting our products with Japanese and Germany Technology without any complains. Day by day new products are being included with higher technology. Now they are manufacturing and Leading the local market with our PE rope/PP rope/Dan line Rope/Nylon multifilament rope/Jute rope/tire cord rope /Nylon multifilament net and PE twine net. In 1978 the company started its slow step by manufacturing 1000kg/day for the time being now their manufacturing capacity has reached to 6000 kg/day. Group believes in customer's satisfaction and sincerity of 400 trained workers and 40 experienced employees has reached the company in today's position. The company is certified by ISO (9001/2000) for its quality management system. Their main products are Rope- (PP/PE/Dan line/Nylon multifilament/tire cord/jute and lead) For Fishing, Marine and Construction use. Nylon multifilament net-For Fishing only. PE twines net- For Fencing/Agro shade/Construction/Poultry/Bird protecting/Fisheries farm. The group is committed to provide quality products and services, by doing the right the first time, by meeting customers’ requirements and using competent man power. We are also committed to continually improve the effectiveness of the Quality management system we have adopted. They are always aware about their customer’s satisfaction. The production procedure goes through a well-planned way. Raw materials come out from the store then it goes to the Machine. After receiving the finished goods from the machine the wastes are separated by well-trained workers. After separating the wastes part the selected best products go for packing and Measurement. Then the products go for well-maintained Storage. After receiving the order from Customers they deliver the product according to customer’s requirements in well packed and secured condition. The qualities of the products are ensured by well trained quality inspector from first to last.

Welcome message from author
This document is posted to help you gain knowledge. Please leave a comment to let me know what you think about it! Share it to your friends and learn new things together.
Transcript
I | P a g e
Chapter 1: Introduction
1.1. Company Profile: Farid Group a leading rope and net manufacturing company in Bangladesh. They have been
manufacturing PE /PP rope since 1978. They have been leading the local market and exporting
our products with Japanese and Germany Technology without any complains. Day by day new
products are being included with higher technology. Now they are manufacturing and Leading
the local market with our PE rope/PP rope/Dan line Rope/Nylon multifilament rope/Jute rope/tire
cord rope /Nylon multifilament net and PE twine net.
In 1978 the company started its slow step by manufacturing 1000kg/day for the time being now
their manufacturing capacity has reached to 6000 kg/day. Group believes in customer's
satisfaction and sincerity of 400 trained workers and 40 experienced employees has reached the
company in today's position.
The company is certified by ISO (9001/2000) for its quality management system.
Their main products are Rope- (PP/PE/Dan line/Nylon multifilament/tire cord/jute and lead) For
Fishing, Marine and Construction use. Nylon multifilament net-For Fishing only. PE twines net-
For Fencing/Agro shade/Construction/Poultry/Bird protecting/Fisheries farm.
The group is committed to provide quality products and services, by doing the right the first
time, by meeting customers’ requirements and using competent man power.
We are also committed to continually improve the effectiveness of the Quality management
system we have adopted.
They are always aware about their customer’s satisfaction. The production procedure goes
through a well-planned way. Raw materials come out from the store then it goes to the Machine.
After receiving the finished goods from the machine the wastes are separated by well-trained
workers.
After separating the wastes part the selected best products go for packing and Measurement.
Then the products go for well-maintained Storage. After receiving the order from Customers
they deliver the product according to customer’s requirements in well packed and secured
condition. The qualities of the products are ensured by well trained quality inspector from first to
last.
II | P a g e
MAIN MOTIVE:
The group is committed to provide quality products and services, by doing the right the first
time, by meeting customers’ requirements and using competent man power. We are also
committed to continually improve the effectiveness of the Quality management system we have
adopted.
PRODUCT DETAILS:
HDPE Rope:
Polyethylene rope is floating but slightly heavier than polypropylene rope. Tensile strength is
unchangeable in dry or wet weather. So, widely used in all types of fishing industrial application
Rattan Cool Mat:
“Sriha Cool Mat” a sister concern of Farid Group is producing synthetic rattan mat that takes part
in our daily life. Since long time natural Rattan mats are being used for bedding, sleeping, sitting
etc but day by day population is increasing when the production of natural Rattan is being
decreased for many reasons.
We would like to introduce our Synthetic Rattan mat which can be used as an alternative of
natural rattan mat and where we have tried to keep the features like natural Rattans as well.
PP Danline Type Rope:
Danline rope is made of the finest polypropylene and polyethylene fiber, offering specially high
ultra-violet resistance and the best handling qualities available. The rigidly controlled standards
ensure the most flexible, best balanced, longest wearing rope. One strand of the rope may have
blue and red tracer for the identification of superior quality.
Jute Rope:
Jute rope is made from Natural jute yarn. The best natural yarn from "Tosha"jute.This rope is not
as heavy as other synthetic rope but it's friendly to the environment, Easily rotten Comfortable to
grip.
Lead Rope:
Lead-cored rope is made of lead lines which are wrapped with fiber yarn to make the fiber rope.
It’s heavier than any other synthetic rope as the tire cord rope.
III | P a g e
PE Twine Net:
Farid PE Nets are made from HDPE plastic and are knitted in modern plants. These products are
subjected to rigorous tests for weather ability. We have in-depth knowledge base for a vast range
of netting applications.
All attractive colors can be and size can be provided according to customers requirements.
Nylon Multifilament Nets:
Our Nylon Multifilament nets are produced from best Quality of Nylon and polyester yarn. We
care to check the Quality keenly after getting the delivery from Machine. The denier Of filament
is 210 and the mesh size Of the net (From ½ Inch to 5 inch) will be as per customers Demand.
Color will be white.
1.2. Objectives of the study: Our purposes were to learn through practical application, about total quality management and
their implementation in Farid Fiber.
Hence, some other objectives are stated below:
To figure out their perception regarding Total Quality Management.
To know about their implementation procedure of Total Quality Management.
To figure out the advantages of Total Quality Management.
To figure out the obstacles in implementing TQM.
To know about Counteraction against obstacles while implementing TQM.
1.3. Limitations of the study Though we put our best effort to fulfill our determined objectives, still there were some
limitations we had to go through-
Books on this issues are very few in number
Very limited time which it needs much time for preparing term paper
We were not allowed to go out for data collection during office hours.
No momentary allocation
The area on this term paper is very big but we had to finish the work within a very short
phase.
As our sample size was small, our findings might not be fully accurate.
IV | P a g e
CHAPTER 2: LITERATURE REVIEW
2.1 Introduction Management systems are usually implemented in response to current conditions. Such systems
and the terms to describe them change with time and use in new contexts. Much of the current
management literature, in education and other industries, focuses on systems that can be
described under the umbrella term, Total Quality Management, or TQM. TQM contains a mix of
original ideas and those with historical antecedents.
2.2 TQM and its Parameters
“Total Quality Management” (TQM) is a concept that is now nearly a century old that has been
applied to every possible industry. It is a broad and adaptable term that is often specifically
altered to meet the goals of the organization that is implementing a TQM system. Different
organizations use it in very different ways and conform the concepts in order to fit their own
personal goals, which makes it difficult to clearly define its parameters and confounds any
coherent analysis. In order to come to a conclusion about the generally accepted aspects of a
Total Quality Management system, we can look at various quality organizations and
philosophies that exist, and the frameworks they have each created for this concept. We can then
cross-‐examine them to result in a clear and concise illustration of TQM that can guide future
research.
One widely accepted definition comes from the
American Society for Quality’s website. It explains,
“TQM describes a management approach to long--‐ term success through customer satisfaction.
In a TQM effort, all members of an organization participate in improving processes, products,
services, and the culture in which they work”(“Total Quality Management”).
Milosan explains, “Total Quality Management is an organizational strategy founded on the idea that performance
in achieving a quality education is achieved only through involvement with the perseverance of
the entire organization in improving processes permanently. The objective is to increase the
efficiency and effectiveness in satisfying customers”.
Later on in her study, Milosan concludes, “TQM refers to an integrated approach by
management to focus all functions and levels of an organization on quality and continuous
improvement”. Milosan’s research surmised that there are six key elements to successfully
implement a TQM process: confidence, training, teamwork, leadership, recognition, and
communication.
TQM can be defined as "Doing the Right Thing, Right the First Time, All the Time; always
Striving for Improvement & always satisfying the Customer."
-[Department of Defense, 1989]
V | P a g e
2.3 The Features of TQM
When TQM is implemented in any organization, it results in high value sustainable benefits.
Some of the benefits are,
1. Improved quality and efficiency
2. Employee participation and teamwork
3. Working relationship
4. Customer satisfaction
5. Employee satisfaction
6. Better Communication
7. Improved Profitability
8. Increasing Market share
TQM along with benefits has many costs related to it as well. The costs of TQM are,
1) Resistance to change: Employees in some organizations may feel insecure under the TQM
program due to lack of trust thus result in a high employee turnover rate.
2) High cost of time: TQM program involves high costs of implementation and it might take
several years for the program to show substantial results. This may result in uncertain economic
conditions.
3) Costs of quality: According to the Business Dictionary, cost of quality is defined as the sum
of costs incurred in maintaining acceptable quality levels with the cost of failure to maintain that
level. There are three costs of quality are,
a) Failure costs
b) Appraisal costs
c) Prevention costs
2.4 Implementation of Total Quality Management
A clear and sound TQM framework needs to be created and adopted which should be
communicated to all the members, at all levels in the organizations. If business, adopts this in the
right way; it would make the procedures in the organization more comprehensive, controlled and
time managed.
Different authors and researchers have designed many TQM frameworks. One of which is the
TQM framework designed by the researcher, Besterfield.

VI | P a g e
This framework discusses the factors that are important for any institute to successfully
implement TQM within the organization and enjoy the returns.
2.5 Tools and Techniques of TQM 2.5.1. Benchmarking: Benchmarking is defined as the measurement of organization’s quality
policies, products, programs, strategies, etc. and then comparing it with the best practices in the
market. Some of the objectives of benchmarking are to determine what kind of improvements are
required on the process, to analyze how other organizations achieve their high performance
levels and to use the same information to improve their performance.
This process is done through following steps.
Benchmarking has been practiced by thousands of firms so that they can achieve the best in the
market, some of which are IBM, Wal-Mart, Cisco, P&G, FedEx, etc.
2.5.2. Information Technology (IT): There are various types of information technology systems
such as intranet, instant messaging, video conferencing, virtual learning, E-learning, E-
government, E-commerce, Business-to-business, business-to-consumers and website design
which could aid TQM in the business.
2.5.3 Quality Management Systems (QMS): QMS is a set of complex parts and components
that deal with the quality of products and processes under required controls along with
continuous improvement. Implementing QMS does not by itself make the institute profitable, but
it provides it with the potential to improve, from fields of production and sales.

VII | P a g e
The International Organization of Standardization (ISO) recognizes QMS and is reflected in the
ISO 9000 standard. ISO is non-governmental organization working for achieving quality. The
ISO 9000 provides guidance on QMS’s principles and scopes an implementation. Many
organization function without the ISO 9000 certification and depend on the internal review
committee, while ISO 9000 certification needs a formal review and approval of the QMS system
by an outside committee and is done every 6 months.
2.5.4. Statistical Process Control (SPC): In management tools, businesses focus on the root
issue of the problem by concentrating on processes rather than people. They are more subjective
than objective and help in process improvement, new-product development, cost reduction and
policy deployment.
Statistical process control is a part of TQM whose focus is on creating processes that would
deliver quality goods. SPC is an analytical decision making tool which tells us if the process is
working properly or not. The fundamental concept on which SPC is laid is quality improvement
and control using objective data and analysis. Control charts are used to show the results of the
process observation. They show a variation in a measurement in the time period this process is
observed but they do not work appropriately in all situations, thus management tools act as
effective problem-solving tools.
The early stages of SPC consist of several steps that use various tools. The quality tools available
to help organizations improve their processes are:
2.5.5. Pareto Charts: These charts are based on the Pareto Principle that states that eighty
percent of the problems come from twenty percent of the causes. These charts are extremely
important as they can be used to identify the factors that have the greatest effect on the system
that helps the maintainer prioritize the problems and would reflect the quality of the company.
2.5.6. Fishbone Diagram: A Fishbone Diagram identifies many possible causes for an effect or
problem. Professor Kaoru Ishikawa created this cause and effect analysis in the 1960s. This
technique uses a diagram-based approach to analyze all the possible causes of a problem. There
are four steps involved in this analysis:
Identify the problem
Determine the major factors involved.
Recognize all the possible causes of the problem
Analyze the diagram
2.5.7 Flowcharts: Flowcharting breaks down a process in sub-processes and analyzing each
process separately minimize the number of processes, which contribute changes in the process.
Quality control is a continuous process where factors and causes should be constantly reviewed
and changes are made accordingly. It is very important to keep referring to the fishbone diagram
to keep a track of any new factors.
2.5.8. Histogram: A histogram is a representation of a frequency distribution by means of
rectangles whose widths represent class intervals and whose areas are proportional to the
corresponding frequencies. A histogram helps analyze what is going on in the process and helps
show the capability of a process.
VIII | P a g e
2.5.9 The Deming cycle: Is another tool that can be used for statistical process control. It is a method that is used for process improvement. It has four stages: plan, do, study and Act (PDSA! cycle). It is a set of methodology that focuses on ideas and theories acquired through testing.
2.8. Summary
After thoroughly discussing the parameters, implementation, and methods of analysis of a Total
Quality Management system, it can be concluded that there are varied means to determining
exactly what is included in TQM, which can be narrowed down to some fundamental principles.
First of all, it is clear that throughout history Total Quality Management is seen as an all--
‐encompassing procedure that is intended to improve virtually every area of a business.
Secondly, it is also apparent that, although each TQM--‐based company may choose to use
different approaches to their Total Quality Management system, nearly all examples utilize the
same basic principles: customer focus, employee involvement and continuous improvement. We
can also observe that there may be both a statistical and psychological approach to evaluating the
effectiveness of a TQM process, and that each has its own individual merits that can be
employed in the analysis process.
IX | P a g e
CHAPTER 3: Research Methodology & Sample Design
3.1 Introduction This chapter examines the research methodology which generally means the selected methods of
achieving the research objectives. To be more precise, it primarily focuses on the method(s) of
data collection along with the justification of using the method(s). It also includes basic
parameters to be chosen related to the selected method(s). In addition to that, the instruments for
gathering data also fall within the definition of methodology of a research (Aminuzzaman:
1991).
3.2 Methods Assessing and identifying the Total Quality Management of Farid fiber is a matter of qualitative
judgment. For the purpose of this study, two methods are used namely
I. Content Analysis
II. Questionnaire Survey
Content Analysis: This includes collecting related information and data from all relevant books,
documents, published and unpublished research works available, online articles, notes etc
Questionnaire Survey: This survey is intended to gather primary data about Total Quality
Management of Farid Fiber industry with a semi-structured questionnaire.
3.3 Sources of Data The data for this study have been collected both from primary and secondary sources. Secondary
data are drawn from the existing literatures like books, newspaper reports, previous research
works, seminar papers, reports, online etc. Primary data have been collected through
questionnaire survey. The respondents included the production Manager, Senior Commercial
Officer, and workers who are directly related with production of Farid Fiber.
3.4 Data Collection Techniques To collect data, in-depth interviews are conducted through close ended semi structured
questionnaire.
3.5 Sampling Production in charge, supervisor, and workers are directly related with quality. They well know
about their quality system and how they manage their quality. So we took them as our sample.
X | P a g e
3.6 Sample Size Our tram paper is about Total quality Management of Farid Group. We have to take our
respondents from employees who are directly related with production. We took five quality
specialists from Farid Group. Three of them are directly related with production (workers) and
two are upper level employees who are related with quality management of Farid Group. They
help us through giving raw information about their total quality management system. They also
told us how they face problems to manage quality of their products.
3.7 Data Validation The collected data have been validated through cross checking with each other and with the
secondary sources.
3.8 Data Analysis Tools/ Techniques There are some tools which are used in analysis. These are various figures, tables, charts. These
instruments are used in the analysis with the information we got.
3.9 Summary We follow the qualitative survey system. Though our sample size is very few, our data is more
relievable.
XI | P a g e
CHAPTER 4: DATA ANALYSIS & FINDINGS
4.1 Introduction In this chapter we convert our raw data and verbal information into valuable structured
information. We make percentage of the responses. And present that percentages on different
graphs and chart.
4.2 Analysis 4.2.1 KNOWLEDGE ABOUT TOTAL QUALITY MANAGEMENT
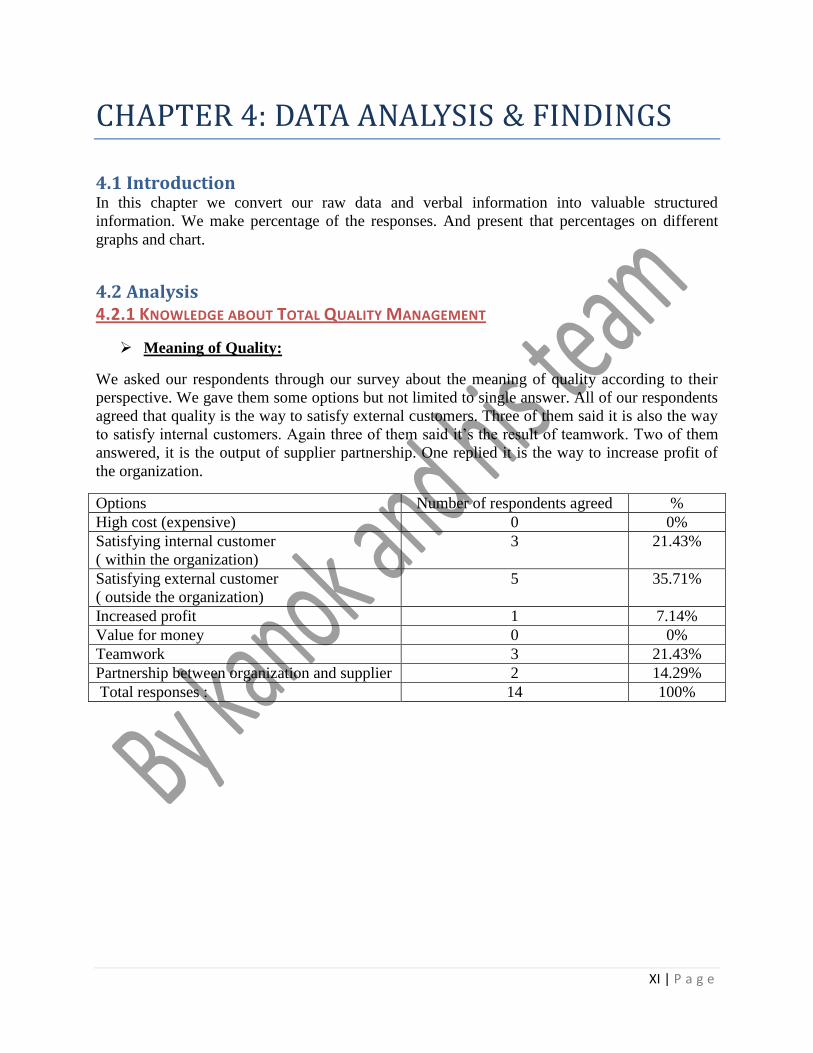
Meaning of Quality:
We asked our respondents through our survey about the meaning of quality according to their
perspective. We gave them some options but not limited to single answer. All of our respondents
agreed that quality is the way to satisfy external customers. Three of them said it is also the way
to satisfy internal customers. Again three of them said it’s the result of teamwork. Two of them
answered, it is the output of supplier partnership. One replied it is the way to increase profit of
the organization.
Options Number of respondents agreed %
High cost (expensive) 0 0%
Satisfying internal customer
( within the organization)
3 21.43%
Satisfying external customer
( outside the organization)
5 35.71%
Increased profit 1 7.14%
Value for money 0 0%
Teamwork 3 21.43%
Partnership between organization and supplier 2 14.29%
Total responses : 14 100%
XII | P a g e
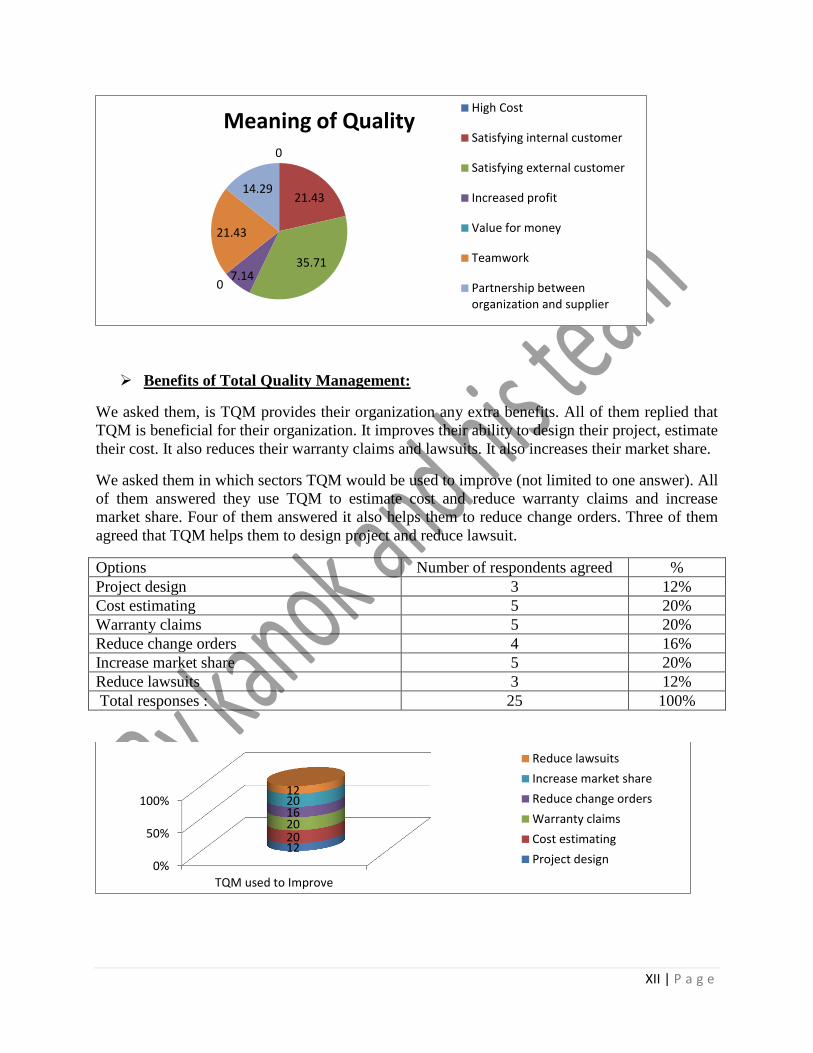
Benefits of Total Quality Management:
We asked them, is TQM provides their organization any extra benefits. All of them replied that
TQM is beneficial for their organization. It improves their ability to design their project, estimate
their cost. It also reduces their warranty claims and lawsuits. It also increases their market share.
We asked them in which sectors TQM would be used to improve (not limited to one answer). All
of them answered they use TQM to estimate cost and reduce warranty claims and increase
market share. Four of them answered it also helps them to reduce change orders. Three of them
agreed that TQM helps them to design project and reduce lawsuit.
Options Number of respondents agreed %
Project design 3 12%
Cost estimating 5 20%
Warranty claims 5 20%
Reduce change orders 4 16%
Increase market share 5 20%
Reduce lawsuits 3 12%
Total responses : 25 100%
0
21.43
35.71 7.14
0
21.43
14.29
Meaning of Quality High Cost
Satisfying internal customer
Satisfying external customer
Increased profit
Value for money
Teamwork
Partnership betweenorganization and supplier
0%
50%
100%
TQM used to Improve
12 20 20 16 20 12
Reduce lawsuits
Increase market share
Reduce change orders
Warranty claims
Cost estimating
Project design
XIII | P a g e
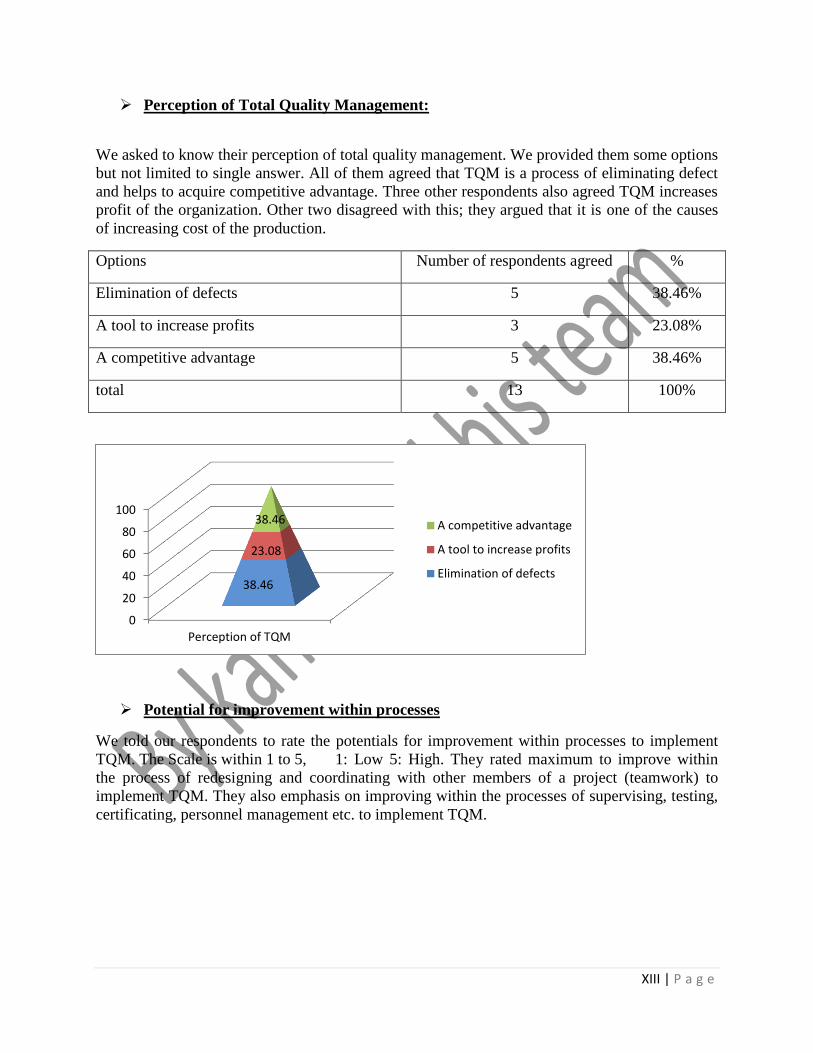
Perception of Total Quality Management:
We asked to know their perception of total quality management. We provided them some options
but not limited to single answer. All of them agreed that TQM is a process of eliminating defect
and helps to acquire competitive advantage. Three other respondents also agreed TQM increases
profit of the organization. Other two disagreed with this; they argued that it is one of the causes
of increasing cost of the production.
Options Number of respondents agreed %
Elimination of defects 5 38.46%
A tool to increase profits 3 23.08%
A competitive advantage 5 38.46%
total 13 100%
Potential for improvement within processes
We told our respondents to rate the potentials for improvement within processes to implement
TQM. The Scale is within 1 to 5, 1: Low 5: High. They rated maximum to improve within
the process of redesigning and coordinating with other members of a project (teamwork) to
implement TQM. They also emphasis on improving within the processes of supervising, testing,
certificating, personnel management etc. to implement TQM.
0
20
40
60
80
100
Perception of TQM
38.46
23.08
38.46 A competitive advantage
A tool to increase profits
Elimination of defects

XIV | P a g e
Processes Respondent
1
Responde
nt
2
Respondent
3
Respond
ent
4
Respondent
5
Tot
al
%
On-site
supervision
4 3 3 4 5 19 10.9
8%
Redesign 5 5 5 5 5 25 14.4
5%
Testing
procedures at
job site
3 3 4 4 4 18 10.4
%
Certification
of materials
3 3 3 3 4 16 9.25
%
Administratio
n of change
orders
3 3 3 3 3 15 8.67
%
Close-out of
projects
3 4 3 4 4 18 10.4
%
On-site safety
management
3 3 3 3 4 16 9.25
%
Personnel
management
of employees
5 4 4 4 4 21 12.1
5%
Coordination
with other
members of a
project
5 5 5 5 5 25 14.4
5%
Total 173 100
%
10.98
14.45
10.4
9.25 8.67
10.4
9.25
12.15
14.45
Imorovement within processes On-site supervision
Redesign
Testing procedures at job site
Certification of materials
Administration of change orders
Close-out of projects
On-site safety management
Personnel management ofemployeesCoordination with other membersof a project

XV | P a g e
Order of importance:
We asked them in which area they should carefully handle to implement TQM. We receive their
answer at scale of five.
Options Responde
nt
1
Responde
nt
2
Responde
nt
3
Responde
nt
4
Responde
nt
2
Tota
l
%
Cost 3 4 3 4 4 18 21.67
%
Scope 3 3 3 3 4 16 19.28
%
Time(Schedul
e)
5 5 4 5 5 24 28.93
%
Quality 5 5 5 5 5 25 30.12
%
Total 83 100%
0
10
20
30
40
Order of importance
21.67 19.28
28.93 30.12
Cost
Scope
Time
Quality
XVI | P a g e
4.2.2 DATA ACQUISITION METHOD
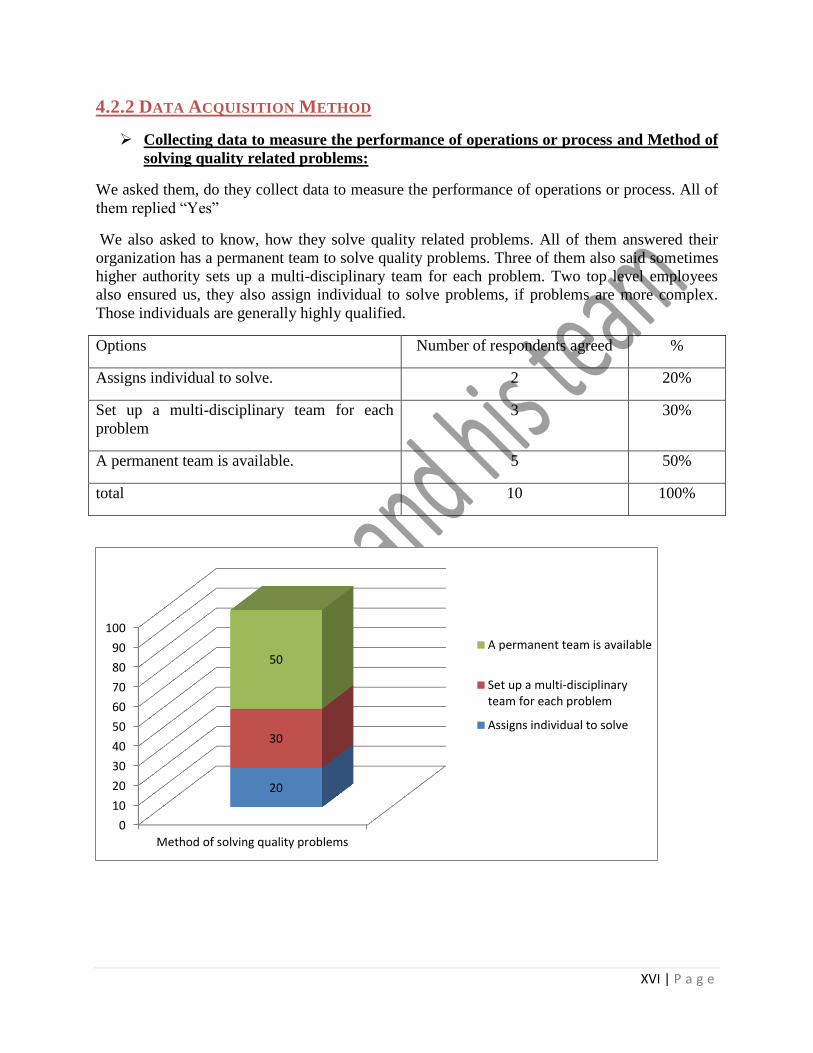
Collecting data to measure the performance of operations or process and Method of
solving quality related problems:
We asked them, do they collect data to measure the performance of operations or process. All of
them replied “Yes”
We also asked to know, how they solve quality related problems. All of them answered their
organization has a permanent team to solve quality problems. Three of them also said sometimes
higher authority sets up a multi-disciplinary team for each problem. Two top level employees
also ensured us, they also assign individual to solve problems, if problems are more complex.
Those individuals are generally highly qualified.
Options Number of respondents agreed %
Assigns individual to solve. 2 20%
Set up a multi-disciplinary team for each
problem
3 30%
A permanent team is available. 5 50%
total 10 100%
0
10
20
30
40
50
60
70
80
90
100
Method of solving quality problems
20
30
50 A permanent team is available
Set up a multi-disciplinaryteam for each problem
Assigns individual to solve
XVII | P a g e
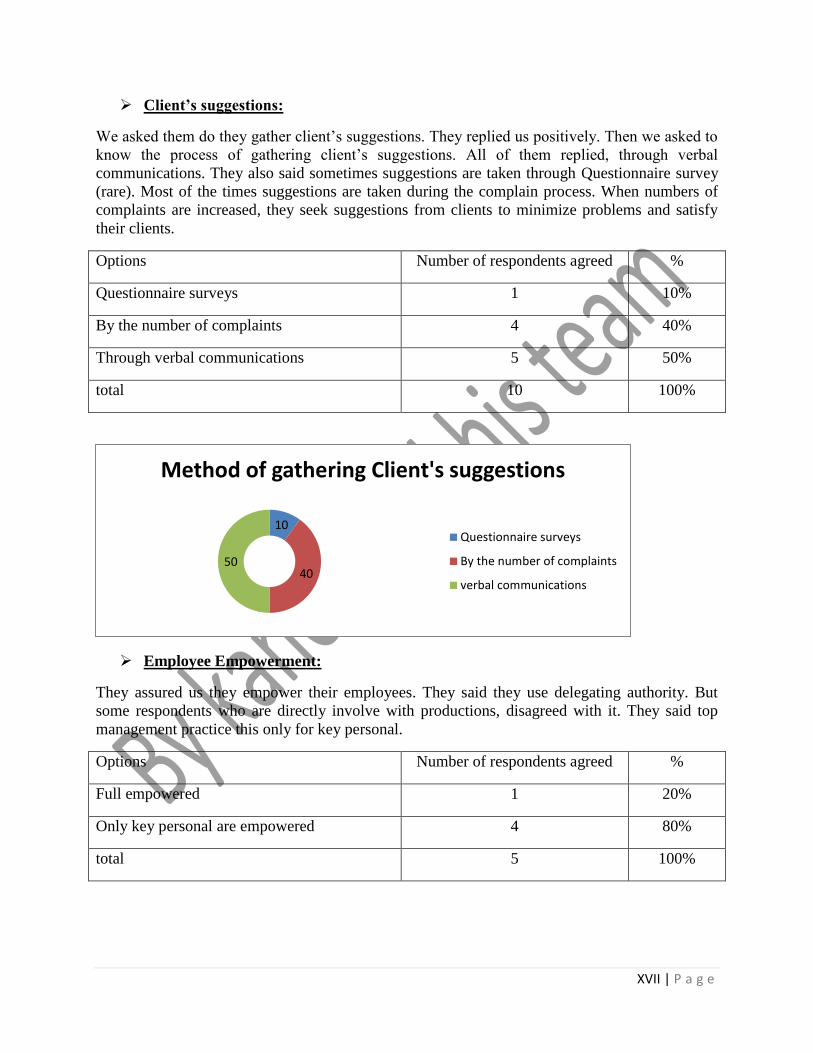
Client’s suggestions:
We asked them do they gather client’s suggestions. They replied us positively. Then we asked to
know the process of gathering client’s suggestions. All of them replied, through verbal
communications. They also said sometimes suggestions are taken through Questionnaire survey
(rare). Most of the times suggestions are taken during the complain process. When numbers of
complaints are increased, they seek suggestions from clients to minimize problems and satisfy
their clients.
Options Number of respondents agreed %
Questionnaire surveys 1 10%
By the number of complaints 4 40%
Through verbal communications 5 50%
total 10 100%
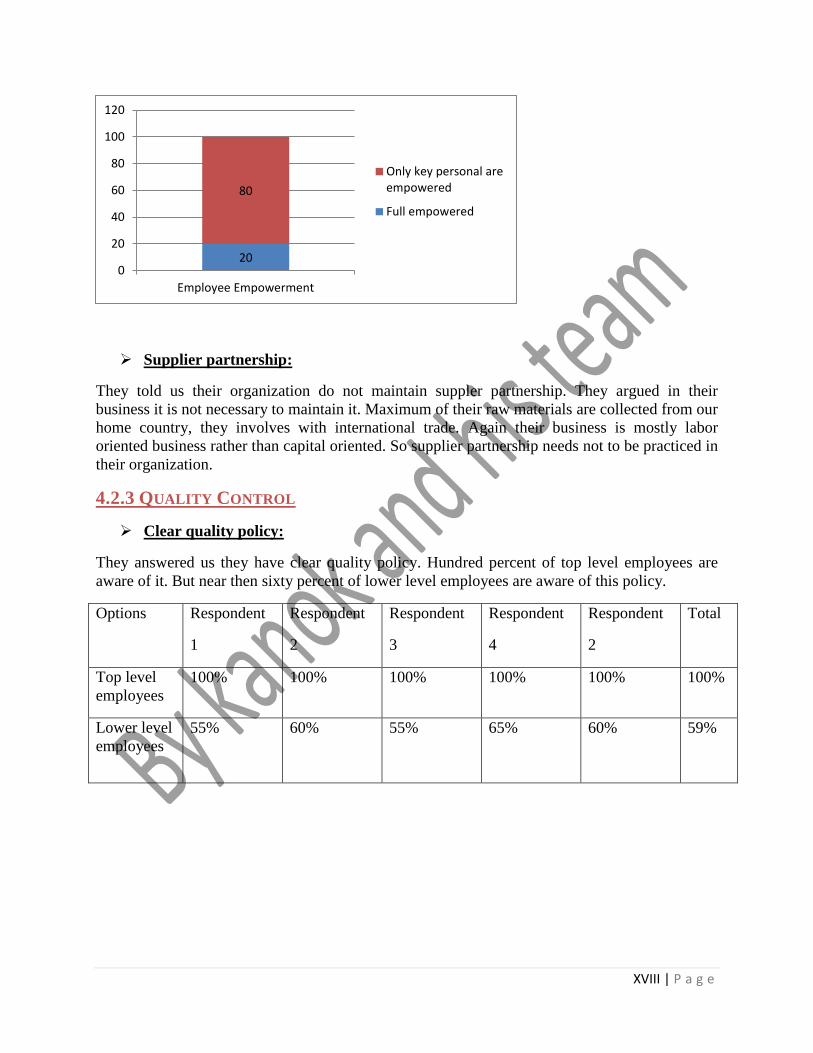
Employee Empowerment:
They assured us they empower their employees. They said they use delegating authority. But
some respondents who are directly involve with productions, disagreed with it. They said top
management practice this only for key personal.
Options Number of respondents agreed %
Full empowered 1 20%
Only key personal are empowered 4 80%
total 5 100%
10
40 50
Method of gathering Client's suggestions
Questionnaire surveys
By the number of complaints
verbal communications
XVIII | P a g e
Supplier partnership:
They told us their organization do not maintain suppler partnership. They argued in their
business it is not necessary to maintain it. Maximum of their raw materials are collected from our
home country, they involves with international trade. Again their business is mostly labor
oriented business rather than capital oriented. So supplier partnership needs not to be practiced in
their organization.
4.2.3 QUALITY CONTROL
Clear quality policy:
They answered us they have clear quality policy. Hundred percent of top level employees are
aware of it. But near then sixty percent of lower level employees are aware of this policy.
Options Respondent
1
Respondent
2
Respondent
3
Respondent
4
Respondent
2
Total
Top level
employees
100% 100% 100% 100% 100% 100%
Lower level
employees
55% 60% 55% 65% 60% 59%
20
80
0
20
40
60
80
100
120
Employee Empowerment
Only key personal areempowered
Full empowered

XIX | P a g e
Quality improvement program and factors motivating to implement TQM:
They assured us a quality improvement program has been implemented recently.
We also wanted to know about the factors which motivate them to implement Total Quality
management. We gave them some options but no limited to one answer. All of them think that
TQM is the demand of customers, and it needs to reduce rework. Four of them also think that
competitors create pressure to implement it. Again it is necessary for environmental issues.
Options Number of respondents agreed %
Pressure from competitors 4 18.18%
Demanding customers 5 22.73%
Your company’s Chief Executive 2 9.09%
Environmental issues / considerations 4 18.18%
Need to reduce costs and improve
performance
2 9.09%
Need to reduce rework and scrap 5 22.73%
Total responses : 22 100%
0 20 40 60 80 100
Lower level employees
Top level employees
59
100
41
0
Don't aware of
aware of

XX | P a g e
Help from other organizations to implement TQM
They assured us Farid groups got ISO certificate on 16 March 2007. They told us they follow
ISO 9000 guidelines to implement TQM. Again BSTI helps them to improve their product and
service quality.
Major objectives of improvement programs of TQM and the results of improvement
programs:
We asked them to know what the major objectives of improvement programs are. They answered
us; increase productivity with best quality is the major concern. Again it reduces cost and
involves employees in the quality building effort.
Options Number of respondents agreed %
Increase productivity 5 33.33%
Cost reduction 3 20%
Involvement of employees in the quality
building effort
4 26.67%
Compliance with statutory, environment and
safety regulations
3 20%
Total responses : 15 100%
0
50
100
Factors motivating to implement TQM
18.18
22.73
9.09
18.18
9.09
22.73
Need to reduce rework and scrap
Need to reduce costs and improveperformance
Environmental issues /considerations
Your company’s Chief Executive
Demanding customers
Pressure from competitors

XXI | P a g e
They assured us, after the implementation of their quality improvement program, product
quality has improved. That’s increases their market share and fulfill the customer’s demand.
4.2.4 TRAINING PROGRAMS
Implementation and duration of training programs:
They said us that they provide hundred percent training programs for managerial/supervisory
staff, who are indirectly related to the quality of the product.
Production labors are provided 3 months training programs. But some respondents told us, real
picture is not same as the rules stated. All production labors are not provided 3 months training
programs. Among the labors sixty percent are fully trained up.
0
5
10
15
20
25
30
35
Major objectives ofimprovement programs
33.33
20
26.67 20
Increase productivity
Cost reduction
Involvement ofemployees in thequality building effort
Compliance withstatutory, environmentand safety regulations
60
100
40
0
0% 10% 20% 30% 40% 50% 60% 70% 80% 90% 100%
Production related labors
Managerial staff
Trained
Untrained

XXII | P a g e
Training currently emphasizes:
All of them told us their training programs currently emphasize on Communication, teamwork
and customer satisfaction. Three of them also agreed, it also emphasize on process control and
statistical.
Options Number of respondents agreed %
Process control 3 14.29%
Statistical analysis 3 14.29%
Team work 5 23.81%
Communication 5 23.80%
Customer satisfaction 5 23.81%
Total responses : 21 100%
14.29
14.29
23.81 23.8
23.81
Training Currently Emphasizes
Process control
Statistical analysis
Team work
Communication
Customer satisfaction
XXIII | P a g e
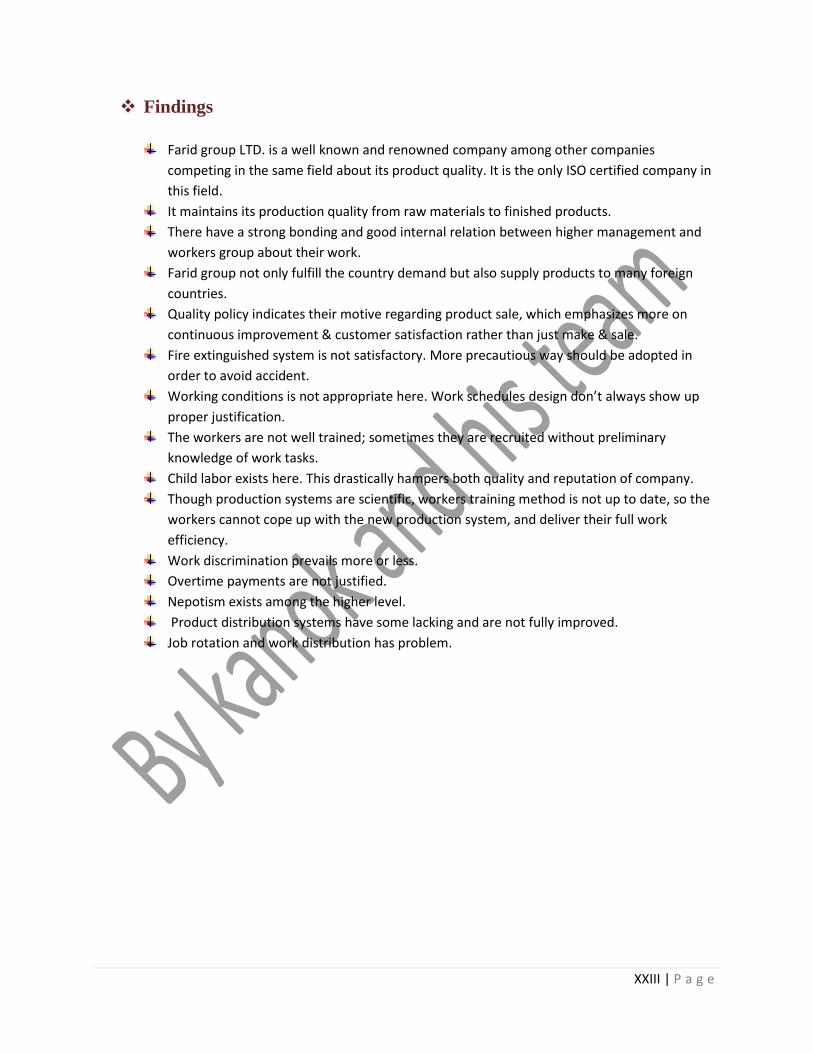
Findings
Farid group LTD. is a well known and renowned company among other companies
competing in the same field about its product quality. It is the only ISO certified company in
this field.
It maintains its production quality from raw materials to finished products.
There have a strong bonding and good internal relation between higher management and
workers group about their work.
Farid group not only fulfill the country demand but also supply products to many foreign
countries.
Quality policy indicates their motive regarding product sale, which emphasizes more on
continuous improvement & customer satisfaction rather than just make & sale.
Fire extinguished system is not satisfactory. More precautious way should be adopted in
order to avoid accident.
Working conditions is not appropriate here. Work schedules design don’t always show up
proper justification.
The workers are not well trained; sometimes they are recruited without preliminary
knowledge of work tasks.
Child labor exists here. This drastically hampers both quality and reputation of company.
Though production systems are scientific, workers training method is not up to date, so the
workers cannot cope up with the new production system, and deliver their full work
efficiency.
Work discrimination prevails more or less.
Overtime payments are not justified.
Nepotism exists among the higher level.
Product distribution systems have some lacking and are not fully improved.
Job rotation and work distribution has problem.

XXIV | P a g e
CHAPTER 5: CONCLUSION& RECOMMENDATION
Our overall observation on Farid Group came out satisfactory level. Quality system followed by
the authority was discussed as best as possible and results were shown consequently.
The group is committed to provide quality products and services, by doing the right the first
time, by meeting customers’ requirements and using competent man power.
We are also committed to continually improve the effectiveness of the Quality management
system we have adopted.
They are always aware about their customer’s satisfaction. The production procedure goes
through a well-planned way. Raw materials come out from the store then it goes to the Machine.
After receiving the finished goods from the machine the wastes are separated by well-trained
workers.
We tried to figure out the structure and practice by them.
Recommendation
Training time for workers should be at least six months, so that workers can fully understand the
production system.
Overtime payments and job rotation should handle properly.
Promotion policy should be fair.
Distribution channel should be up dated.
Fire extinguished system should be more improved, and should add more apparatus to face the
situation.
Workers should provide training on their safety issues.
Working environments should be improved.
Medical service system should be expanded for the workers.
XXV | P a g e
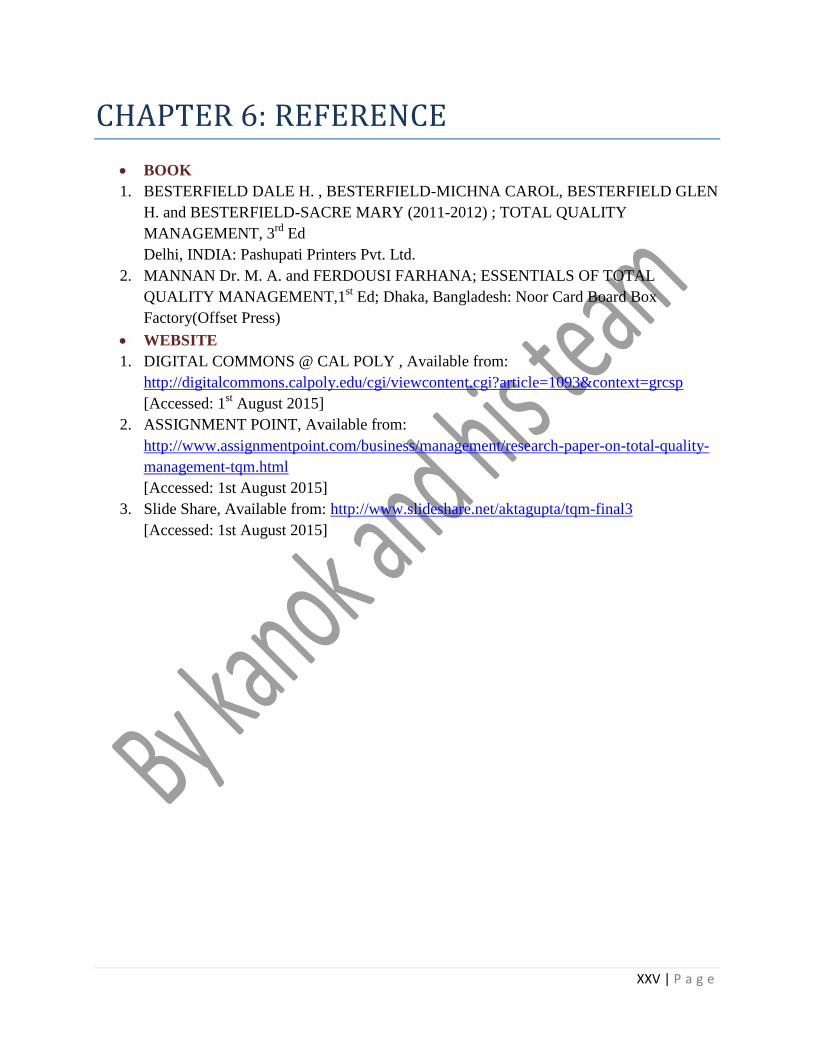
CHAPTER 6: REFERENCE
BOOK
1. BESTERFIELD DALE H. , BESTERFIELD-MICHNA CAROL, BESTERFIELD GLEN
H. and BESTERFIELD-SACRE MARY (2011-2012) ; TOTAL QUALITY
MANAGEMENT, 3rd
Ed
Delhi, INDIA: Pashupati Printers Pvt. Ltd.
2. MANNAN Dr. M. A. and FERDOUSI FARHANA; ESSENTIALS OF TOTAL
QUALITY MANAGEMENT,1st Ed; Dhaka, Bangladesh: Noor Card Board Box
Factory(Offset Press)
WEBSITE
1. DIGITAL COMMONS @ CAL POLY , Available from:
http://digitalcommons.calpoly.edu/cgi/viewcontent.cgi?article=1093&context=grcsp
[Accessed: 1st August 2015]
2. ASSIGNMENT POINT, Available from:
http://www.assignmentpoint.com/business/management/research-paper-on-total-quality-
management-tqm.html
[Accessed: 1st August 2015]
3. Slide Share, Available from: http://www.slideshare.net/aktagupta/tqm-final3
[Accessed: 1st August 2015]
XXVI | P a g e
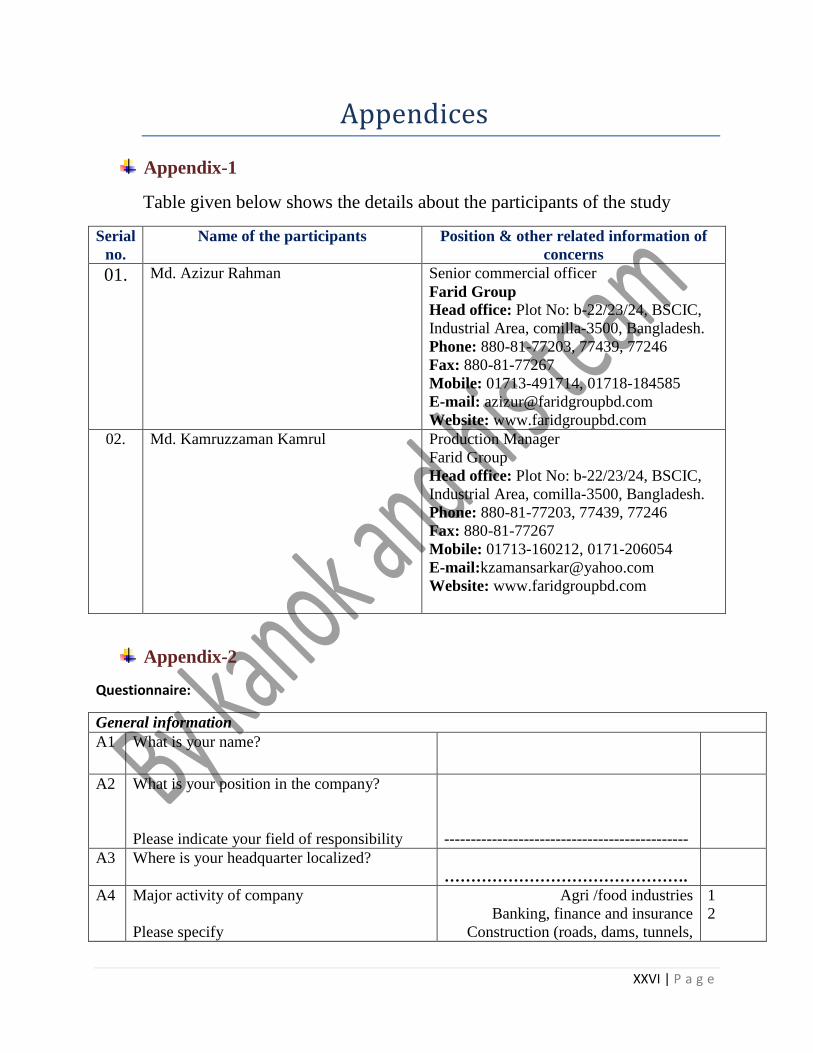
Appendices
Appendix-1
Table given below shows the details about the participants of the study
Serial
no.
Name of the participants Position & other related information of
concerns
01. Md. Azizur Rahman
Senior commercial officer
Farid Group Head office: Plot No: b-22/23/24, BSCIC,
Industrial Area, comilla-3500, Bangladesh.
Phone: 880-81-77203, 77439, 77246
Fax: 880-81-77267
Mobile: 01713-491714, 01718-184585
E-mail: [email protected]
Website: www.faridgroupbd.com
02. Md. Kamruzzaman Kamrul Production Manager
Farid Group
Head office: Plot No: b-22/23/24, BSCIC,
Industrial Area, comilla-3500, Bangladesh.
Phone: 880-81-77203, 77439, 77246
Fax: 880-81-77267
Mobile: 01713-160212, 0171-206054
E-mail:[email protected]
Website: www.faridgroupbd.com
Appendix-2
Questionnaire:
General information
A1 What is your name?
A2 What is your position in the company?
Please indicate your field of responsibility
----------------------------------------------
A3 Where is your headquarter localized?
……………………………………….
A4 Major activity of company
Please specify
Agri /food industries
Banking, finance and insurance
Construction (roads, dams, tunnels,
1
2
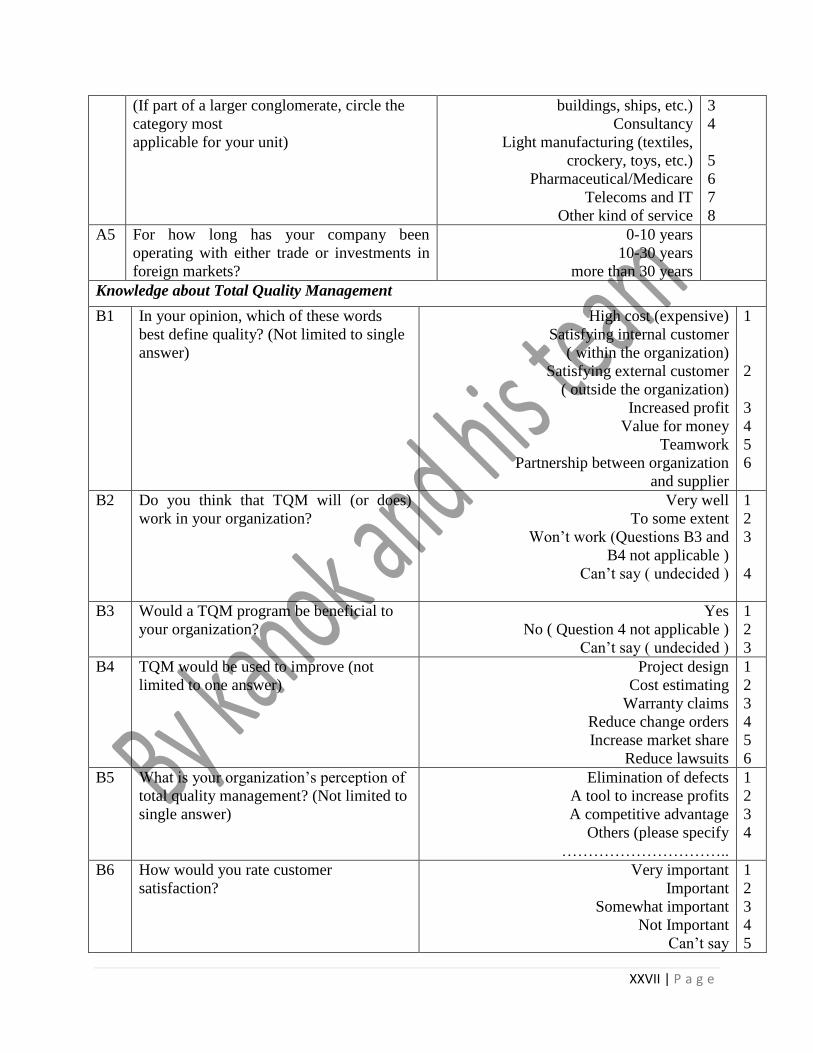
XXVII | P a g e
(If part of a larger conglomerate, circle the
category most
applicable for your unit)
buildings, ships, etc.)
Consultancy
Light manufacturing (textiles,
crockery, toys, etc.)
Pharmaceutical/Medicare
Telecoms and IT
Other kind of service
3
4
5
6
7
8
A5 For how long has your company been
operating with either trade or investments in
foreign markets?
0-10 years
10-30 years
more than 30 years
Knowledge about Total Quality Management
B1 In your opinion, which of these words
best define quality? (Not limited to single
answer)
High cost (expensive)
Satisfying internal customer
( within the organization)
Satisfying external customer
( outside the organization)
Increased profit
Value for money
Teamwork
Partnership between organization
and supplier
1
2
3
4
5
6
B2 Do you think that TQM will (or does)
work in your organization?
Very well
To some extent
Won’t work (Questions B3 and
B4 not applicable )
Can’t say ( undecided )
1
2
3
4
B3 Would a TQM program be beneficial to
your organization?
Yes
No ( Question 4 not applicable )
Can’t say ( undecided )
1
2
3
B4 TQM would be used to improve (not
limited to one answer)
Project design
Cost estimating
Warranty claims
Reduce change orders
Increase market share
Reduce lawsuits
1
2
3
4
5
6
B5 What is your organization’s perception of
total quality management? (Not limited to
single answer)
Elimination of defects
A tool to increase profits
A competitive advantage
Others (please specify
…………………………..
1
2
3
4
B6 How would you rate customer
satisfaction?
Very important
Important
Somewhat important
Not Important
Can’t say
1
2
3
4
5
XXVIII | P a g e
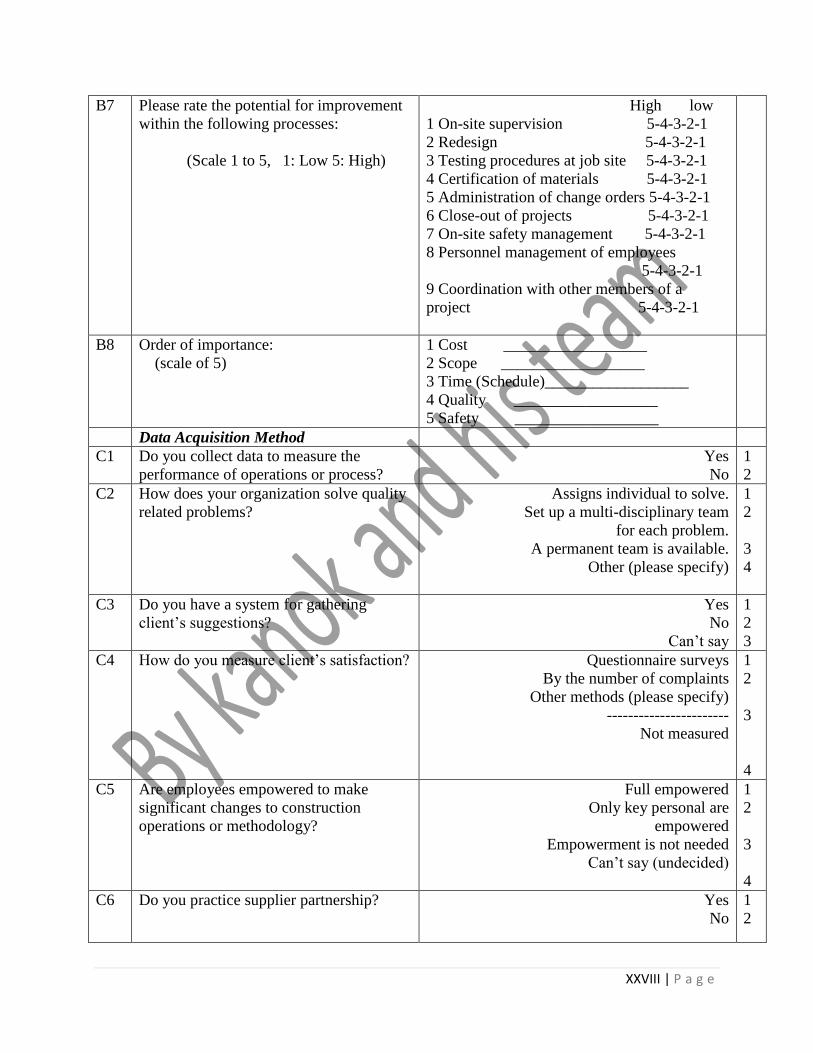
B7 Please rate the potential for improvement
within the following processes:
(Scale 1 to 5, 1: Low 5: High)
High low
1 On-site supervision 5-4-3-2-1
2 Redesign 5-4-3-2-1
3 Testing procedures at job site 5-4-3-2-1
4 Certification of materials 5-4-3-2-1
5 Administration of change orders 5-4-3-2-1
6 Close-out of projects 5-4-3-2-1
7 On-site safety management 5-4-3-2-1
8 Personnel management of employees
5-4-3-2-1
9 Coordination with other members of a
project 5-4-3-2-1
B8 Order of importance:
(scale of 5)
1 Cost __________________
2 Scope __________________
3 Time (Schedule)__________________
4 Quality __________________
5 Safety __________________
Data Acquisition Method
C1 Do you collect data to measure the
performance of operations or process?
Yes
No
1
2
C2 How does your organization solve quality
related problems?
Assigns individual to solve.
Set up a multi-disciplinary team
for each problem.
A permanent team is available.
Other (please specify)
1
2
3
4
C3 Do you have a system for gathering
client’s suggestions?
Yes
No
Can’t say
1
2
3
C4 How do you measure client’s satisfaction? Questionnaire surveys
By the number of complaints
Other methods (please specify)
-----------------------
Not measured
1
2
3
4
C5 Are employees empowered to make
significant changes to construction
operations or methodology?
Full empowered
Only key personal are
empowered
Empowerment is not needed
Can’t say (undecided)
1
2
3
4
C6 Do you practice supplier partnership?
Yes
No
1
2

XXIX | P a g e
Quality Control in your Organization
D1 Has your organization developed a clear
quality policy?
Yes
No
Can’t say (undecided)
1
2
3
D2 Percentage of employees who are aware
of the importance of quality?
D3 a) Are your Organization ISO
certified?
b) Please specify the date.
Yes
No
………………………………………
1
2
D4 Does your organization have a quality
improvement program?
A quality improvement program has been
implemented recently
A quality improvement plan has been a part of
corporate policy for some time now.
Such a plan is under consideration.
No (please skip the remaining questions and
move to the next section)
1
2
3
4
D5 Which of the following factors provided
the motivation to start TQM (not limited
to one answer)
Pressure from competitors
Demanding customers
Your company’s Chief Executive
Environmental issues / considerations
Need to reduce costs and improve performance
Need to reduce rework and scrap
1
2
3
4
5
6
D6 Your organization’s quality improvement
program can be described as:
Periodic short range resolution or
motivational plan
A formal long - term program with wide
spread employees’ awareness
Others (please specify)
…………………………………..
1
2
3
D7 Does your quality improvement plan have
the full support of top management?
Yes
No
Can’t say (undecided)
1
2
3
D8 The major objectives of your programs
are (not limited to single answer)
Increase productivity
Cost reduction
Involvement of employees in the quality
building effort
Compliance with statutory, environment and
safety regulations.
Others (please specify)
………………………………………
1
2
3
4
5

XXX | P a g e
D9 After the implementation of your quality
improvement program, services /product
quality has
Drastically improved
Improved
Remained the same
Decreased
Can’t say ( undecided )
Not applicable
1
2
3
4
5
6
D10 Do you get any help from BSTI to
develop your product and service?
Yes
No
1
2
Training
E1 Is formal training in TQM or other quality
improvement philosophies given to
employees?
No training is given (please skip the rest of this
section)
Some training is available
A formal training program is in effect
Others (please specify)
…………………………………..
1
2
3
4
E2 Percentage of managerial/supervisory
staff that have undergone quality
improvement training?
………………………%
E3 Percentage of non-managerial/technical
staff who have undergone quality
improvement training
…………………………%
E4 Training currently emphasizes (not
limited to one answer)
Process control
Statistical analysis
Data gathering & analysis
Team work
Communication
Customer satisfaction
1
2
3
4
5
6
Related Documents