Total Quality Management BUS 3 – 142 Mr. Jess Marino Spring, 2011

Total Quality Management BUS 3 – 142 Mr. Jess Marino Spring, 2011.
Dec 19, 2015
Welcome message from author
This document is posted to help you gain knowledge. Please leave a comment to let me know what you think about it! Share it to your friends and learn new things together.
Transcript
Total Quality Management
BUS 3 – 142
Mr. Jess MarinoSpring, 2011
Page 2 2
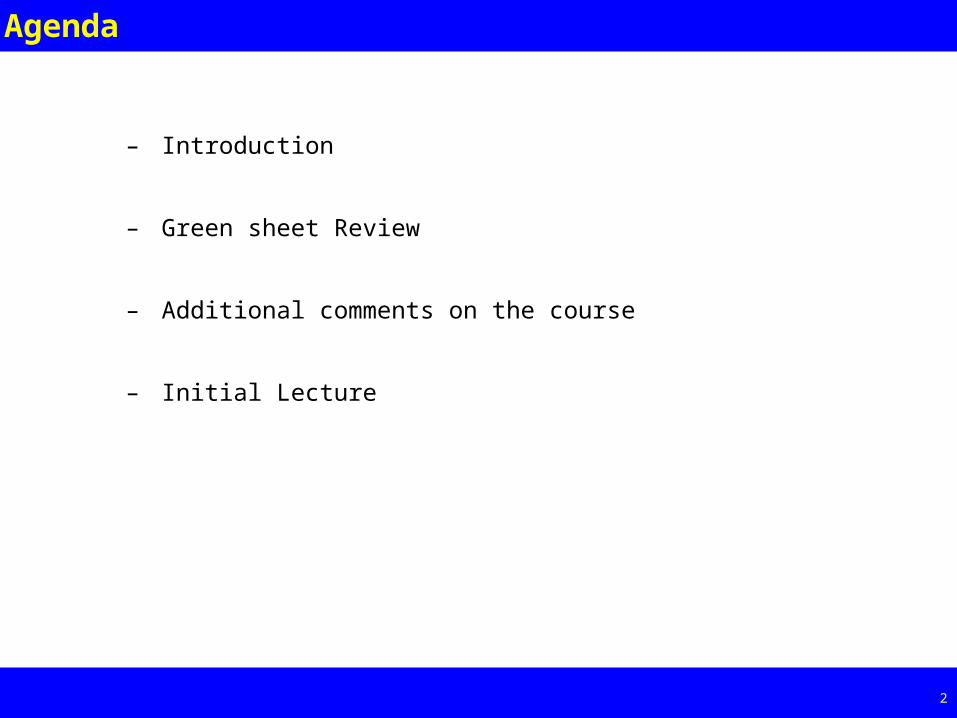
Agenda
– Introduction
– Green sheet Review
– Additional comments on the course
– Initial Lecture
Page 3 3
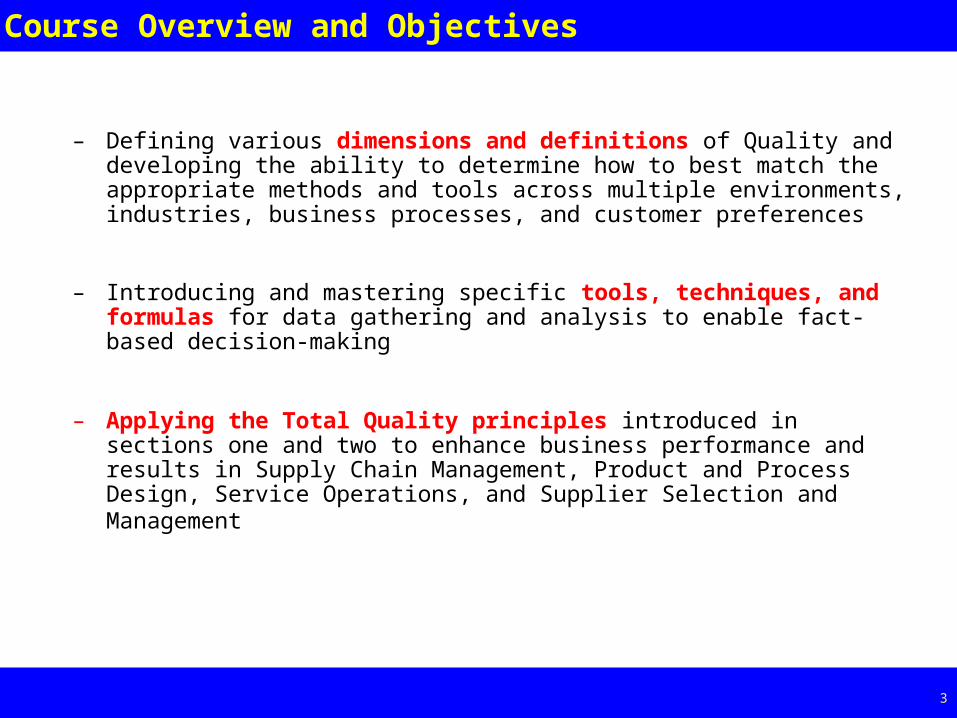
Course Overview and Objectives
– Defining various dimensions and definitions of Quality and developing the ability to determine how to best match the appropriate methods and tools across multiple environments, industries, business processes, and customer preferences
– Introducing and mastering specific tools, techniques, and formulas for data gathering and analysis to enable fact-based decision-making
– Applying the Total Quality principles introduced in sections one and two to enhance business performance and results in Supply Chain Management, Product and Process Design, Service Operations, and Supplier Selection and Management
Page 4 4
Student Learning Objectives for the Course
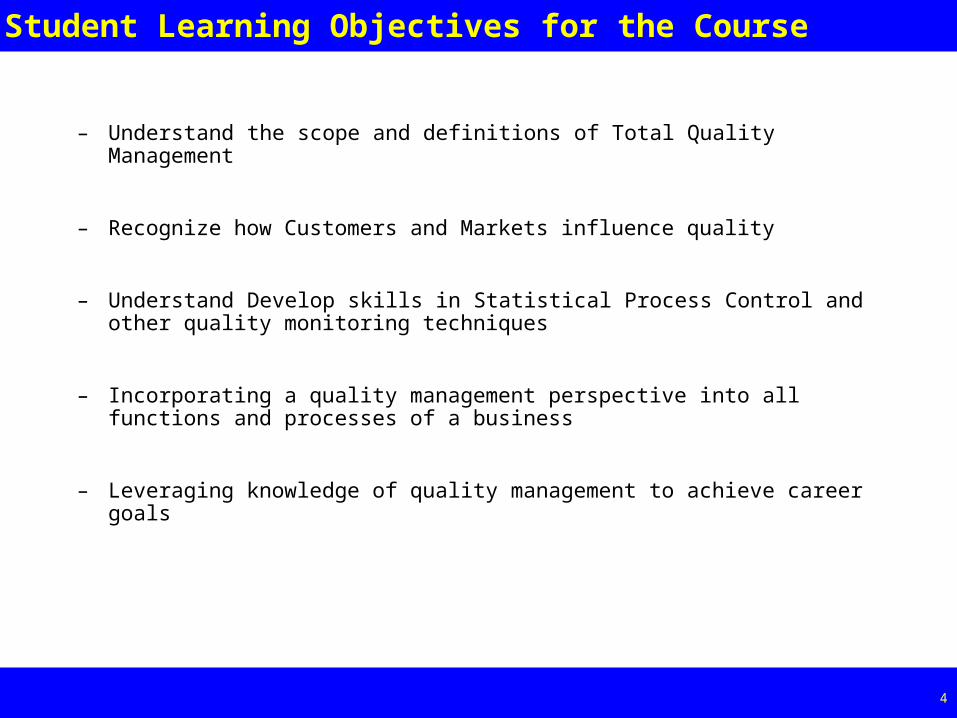
– Understand the scope and definitions of Total Quality Management
– Recognize how Customers and Markets influence quality
– Understand Develop skills in Statistical Process Control and other quality monitoring techniques
– Incorporating a quality management perspective into all functions and processes of a business
– Leveraging knowledge of quality management to achieve career goals

Semester Calendar
Introduction toQuality Management
Page 7 7
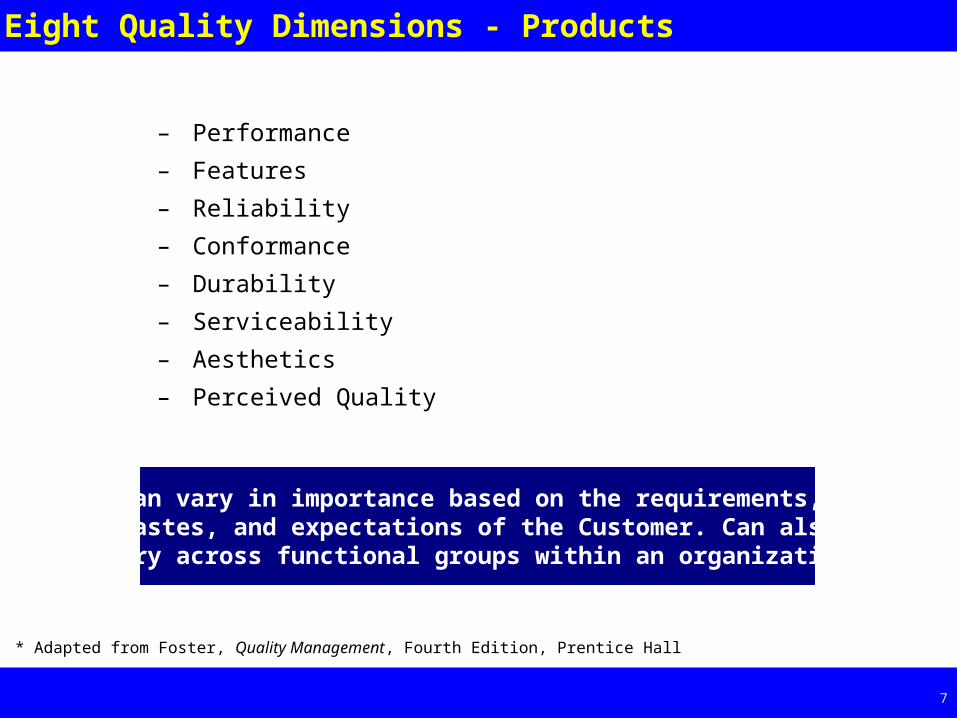
Eight Quality Dimensions - Products
– Performance
– Features
– Reliability
– Conformance
– Durability
– Serviceability
– Aesthetics
– Perceived Quality
* Adapted from Foster, Quality Management, Fourth Edition, Prentice Hall
Can vary in importance based on the requirements, tastes, and expectations of the Customer. Can also
vary across functional groups within an organization
Page 8 8
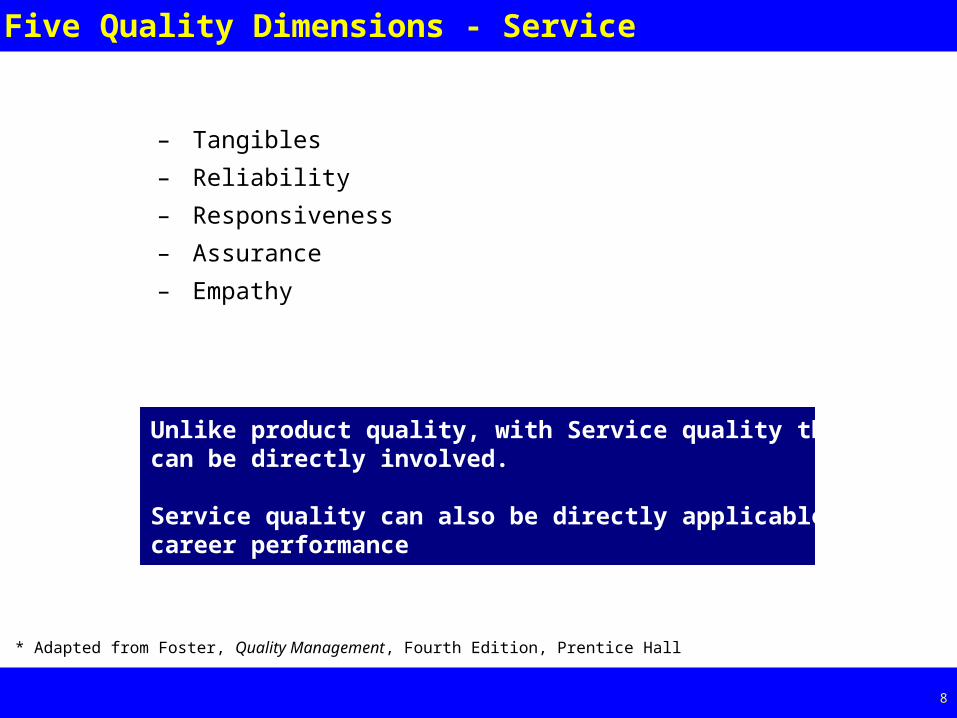
Five Quality Dimensions - Service
– Tangibles
– Reliability
– Responsiveness
– Assurance
– Empathy
* Adapted from Foster, Quality Management, Fourth Edition, Prentice Hall
Unlike product quality, with Service quality the Customercan be directly involved.
Service quality can also be directly applicable tocareer performance
Page 9 9
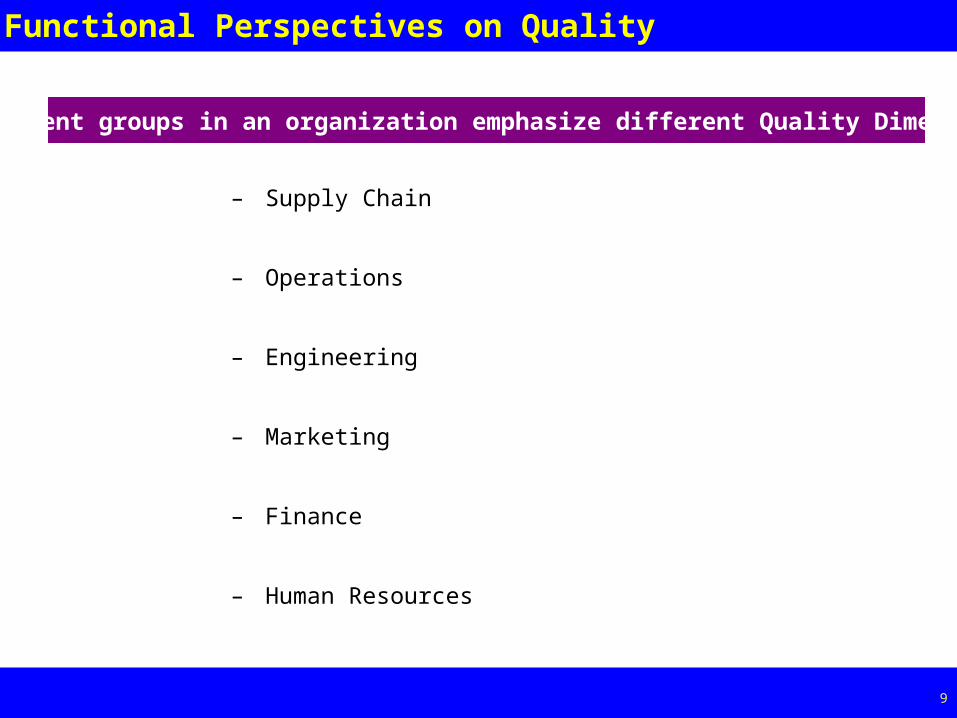
Functional Perspectives on Quality
– Supply Chain
– Operations
– Engineering
– Marketing
– Finance
– Human Resources
Different groups in an organization emphasize different Quality Dimensions
Page 10 10
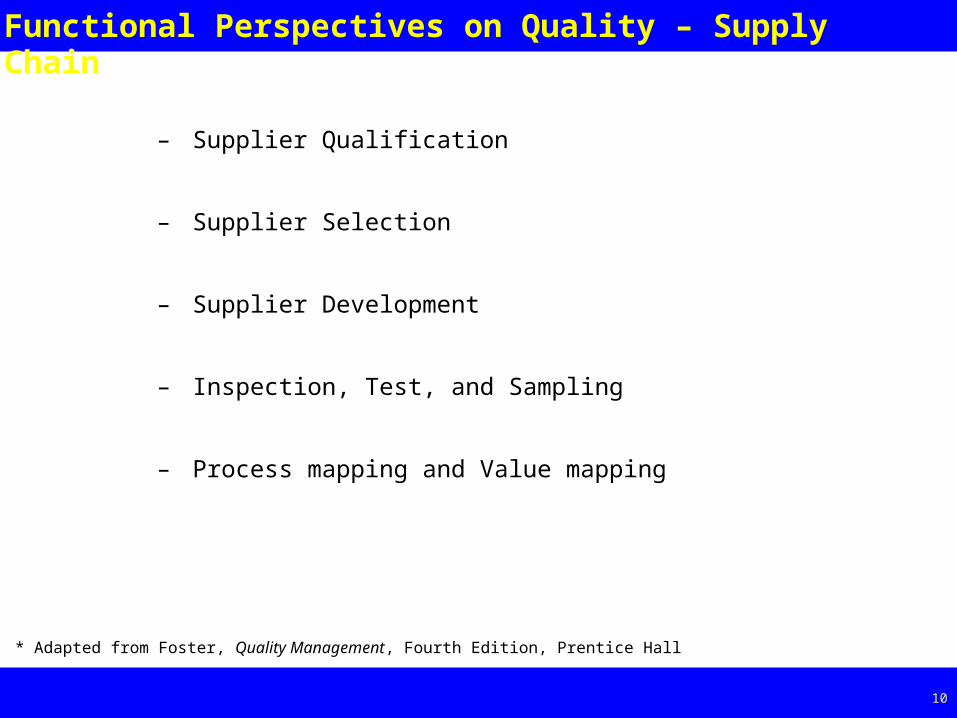
Functional Perspectives on Quality – Supply Chain
– Supplier Qualification
– Supplier Selection
– Supplier Development
– Inspection, Test, and Sampling
– Process mapping and Value mapping
* Adapted from Foster, Quality Management, Fourth Edition, Prentice Hall
Page 11 11
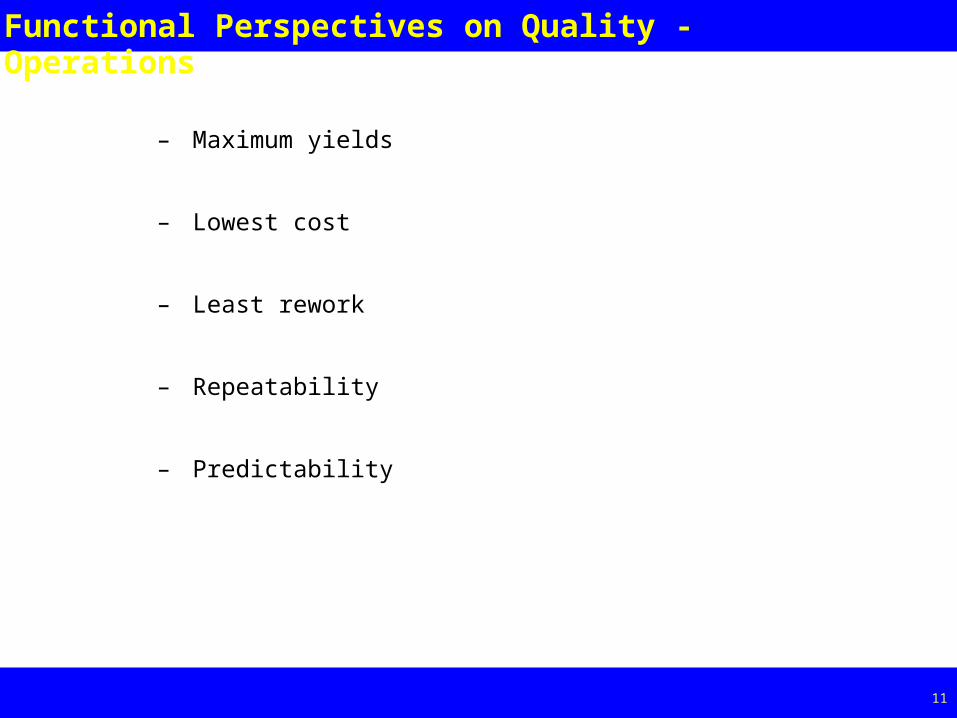
Functional Perspectives on Quality - Operations
– Maximum yields
– Lowest cost
– Least rework
– Repeatability
– Predictability
Page 12 12
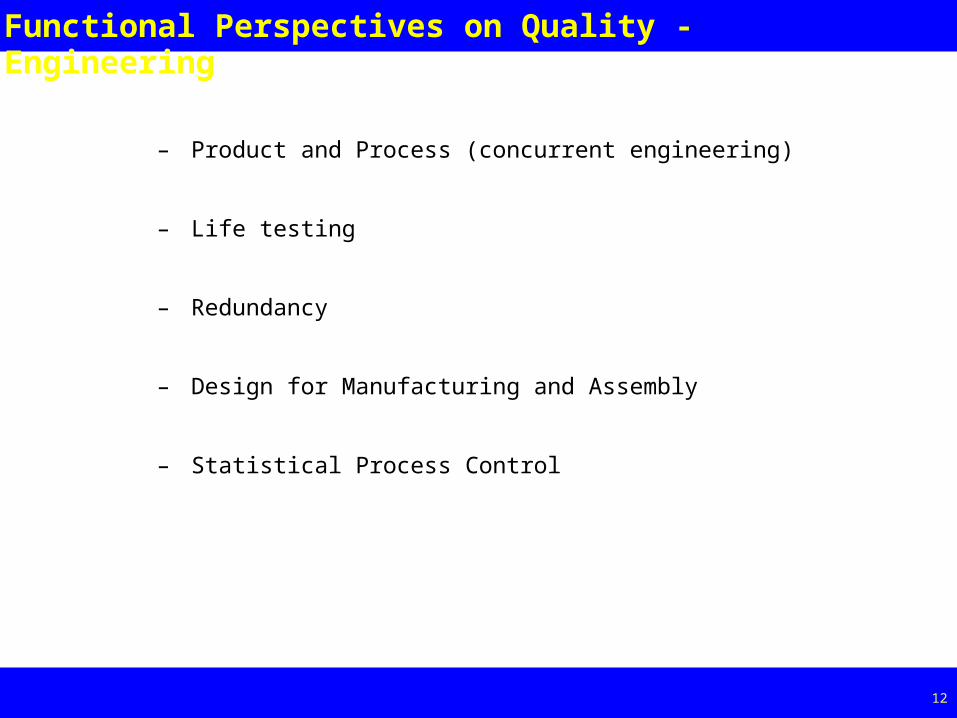
Functional Perspectives on Quality - Engineering
– Product and Process (concurrent engineering)
– Life testing
– Redundancy
– Design for Manufacturing and Assembly
– Statistical Process Control
Page 13 13
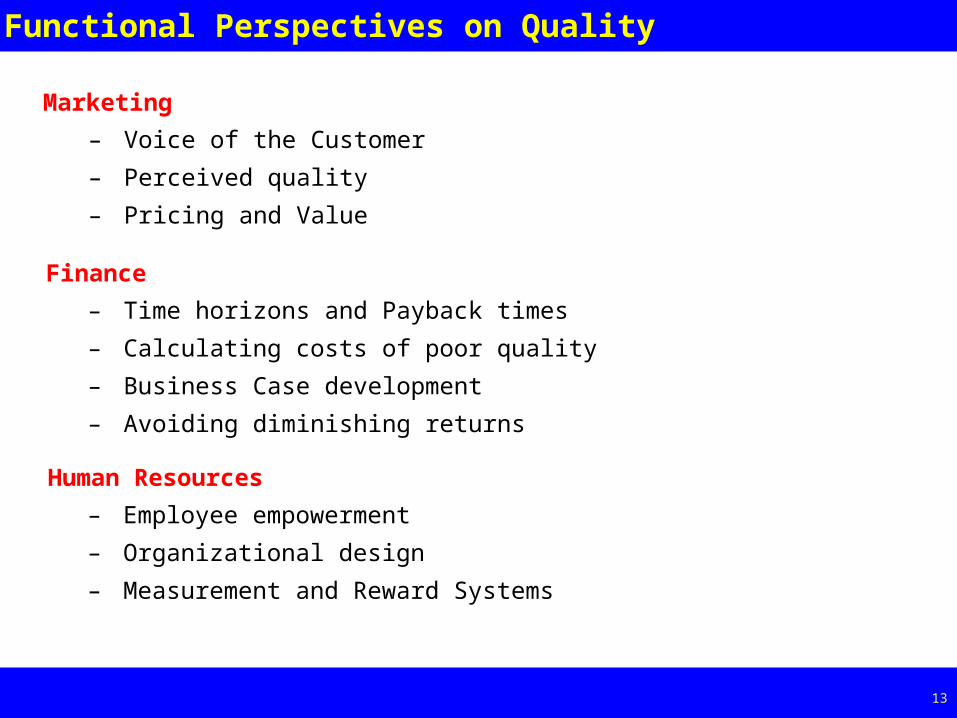
Functional Perspectives on Quality
– Voice of the Customer
– Perceived quality
– Pricing and Value
Marketing
– Time horizons and Payback times
– Calculating costs of poor quality
– Business Case development
– Avoiding diminishing returns
Finance
– Employee empowerment
– Organizational design
– Measurement and Reward Systems
Human Resources
Page 14 14
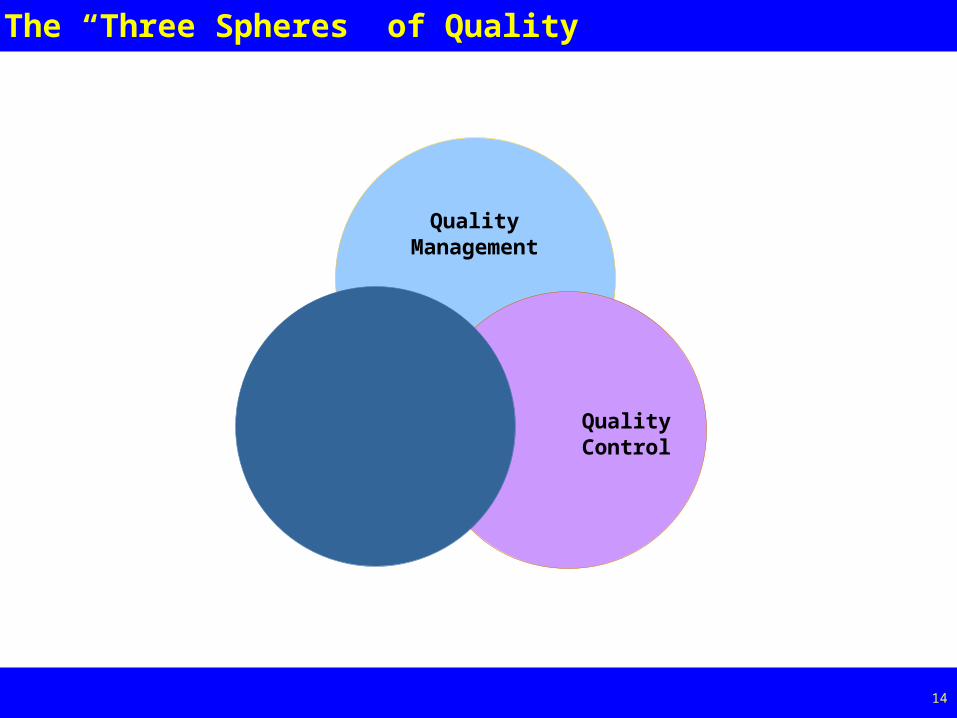
The “Three Spheres” of Quality
QualityAssurance
QualityControl
QualityManagement
Page 15 15
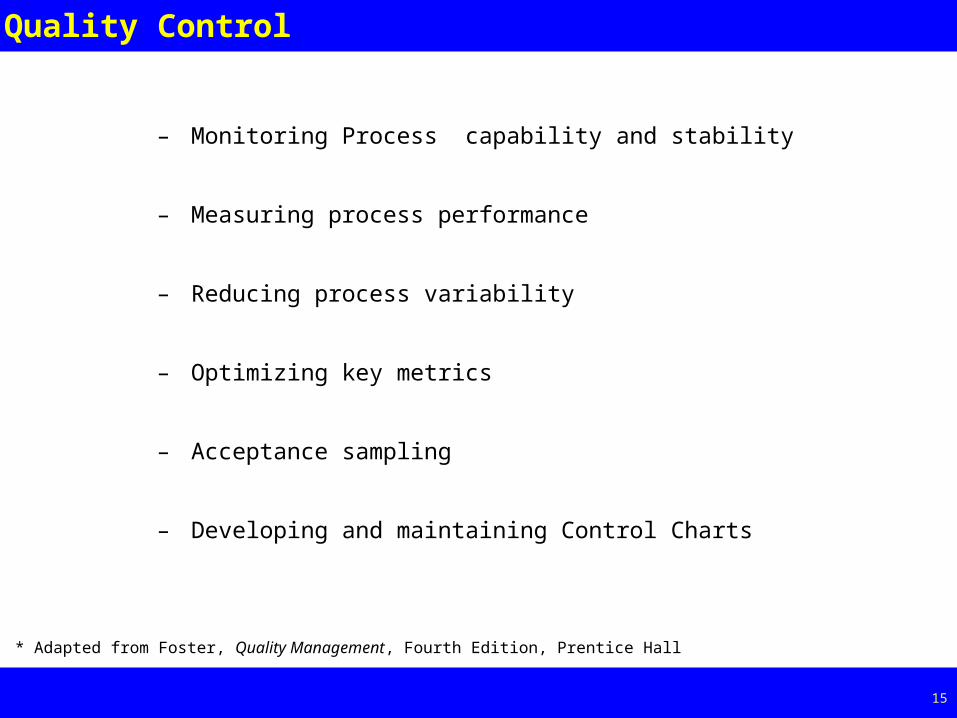
Quality Control
– Monitoring Process capability and stability
– Measuring process performance
– Reducing process variability
– Optimizing key metrics
– Acceptance sampling
– Developing and maintaining Control Charts
* Adapted from Foster, Quality Management, Fourth Edition, Prentice Hall
Page 16 16
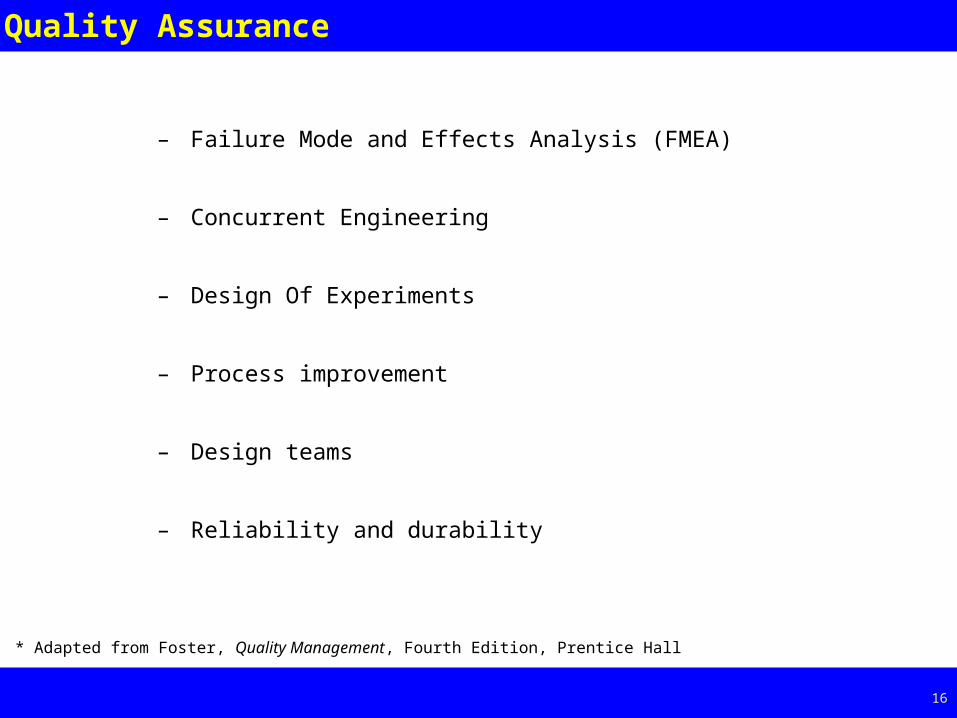
Quality Assurance
– Failure Mode and Effects Analysis (FMEA)
– Concurrent Engineering
– Design Of Experiments
– Process improvement
– Design teams
– Reliability and durability
* Adapted from Foster, Quality Management, Fourth Edition, Prentice Hall
Page 17 17
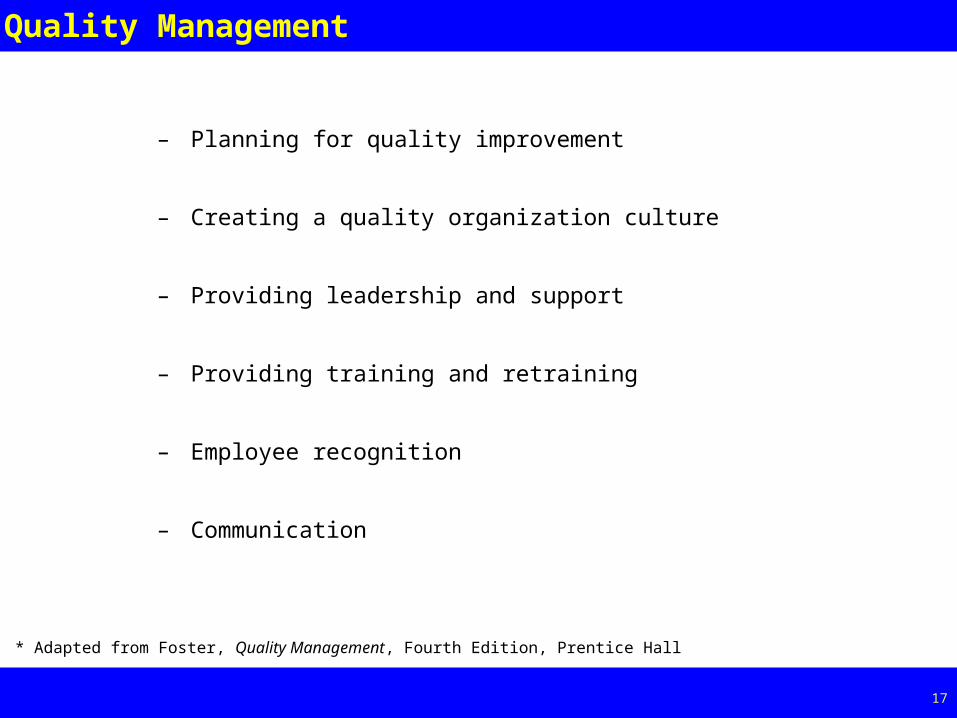
Quality Management
– Planning for quality improvement
– Creating a quality organization culture
– Providing leadership and support
– Providing training and retraining
– Employee recognition
– Communication
* Adapted from Foster, Quality Management, Fourth Edition, Prentice Hall
Page 18 18
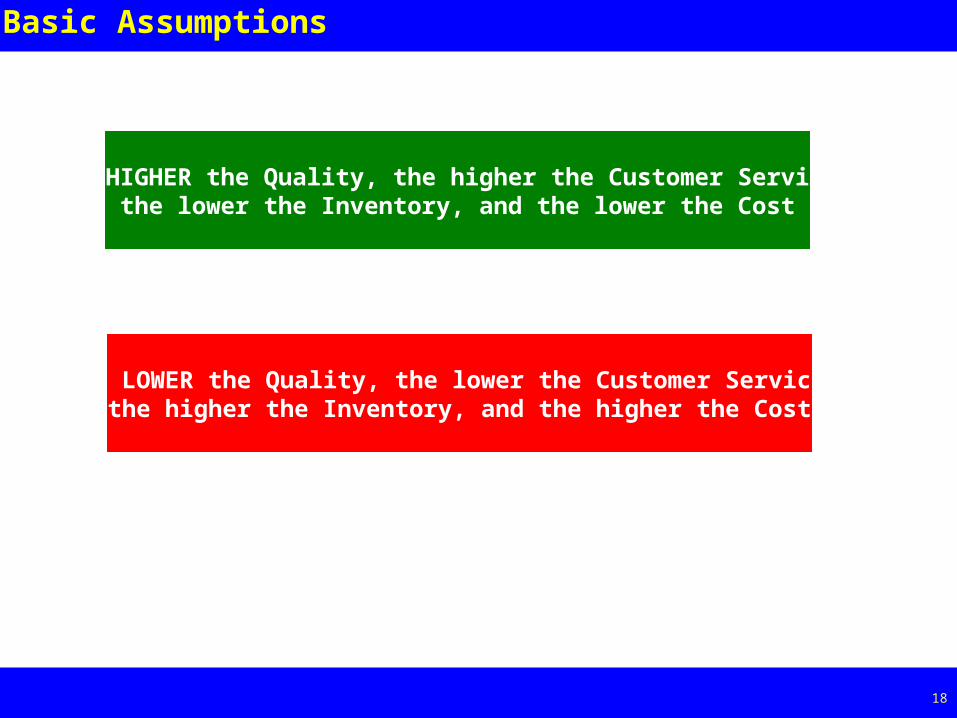
Basic Assumptions
The HIGHER the Quality, the higher the Customer Service, the lower the Inventory, and the lower the Cost
The LOWER the Quality, the lower the Customer Service, the higher the Inventory, and the higher the Cost
Page 19 19
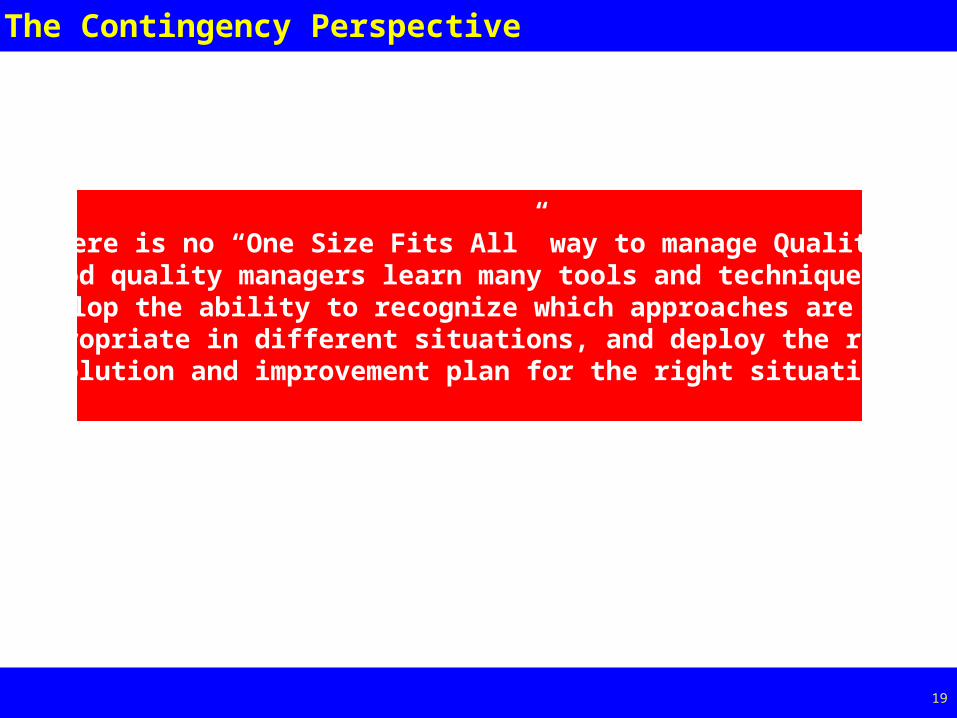
The Contingency Perspective
There is no “One Size Fits All” way to manage Quality.Good quality managers learn many tools and techniques,
develop the ability to recognize which approaches are mostappropriate in different situations, and deploy the rightsolution and improvement plan for the right situation
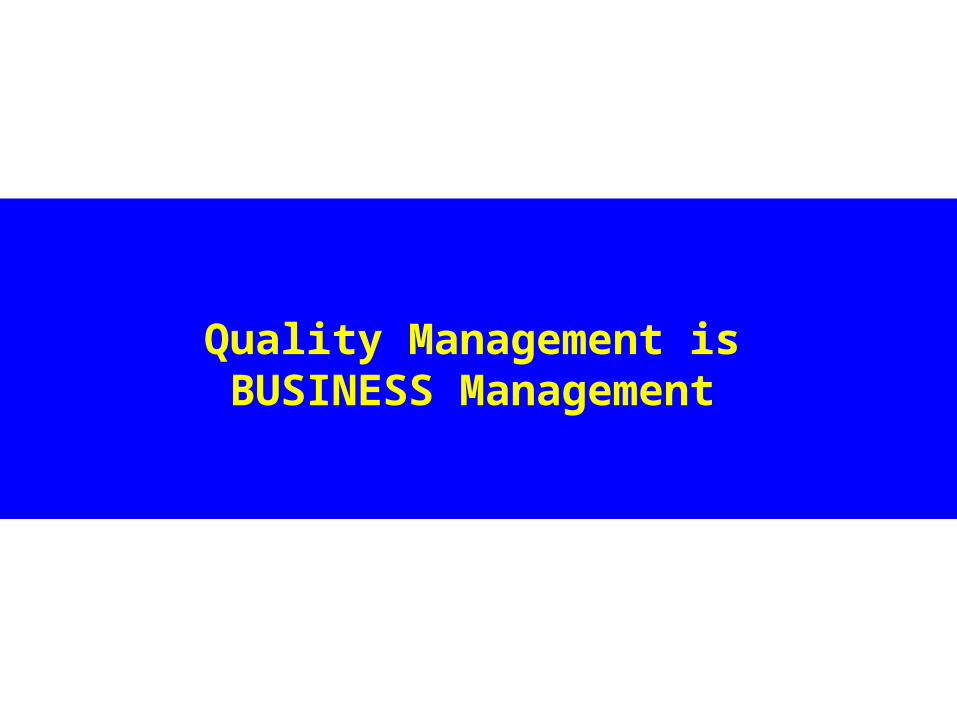
Quality Management isBUSINESS Management
Page 21 21
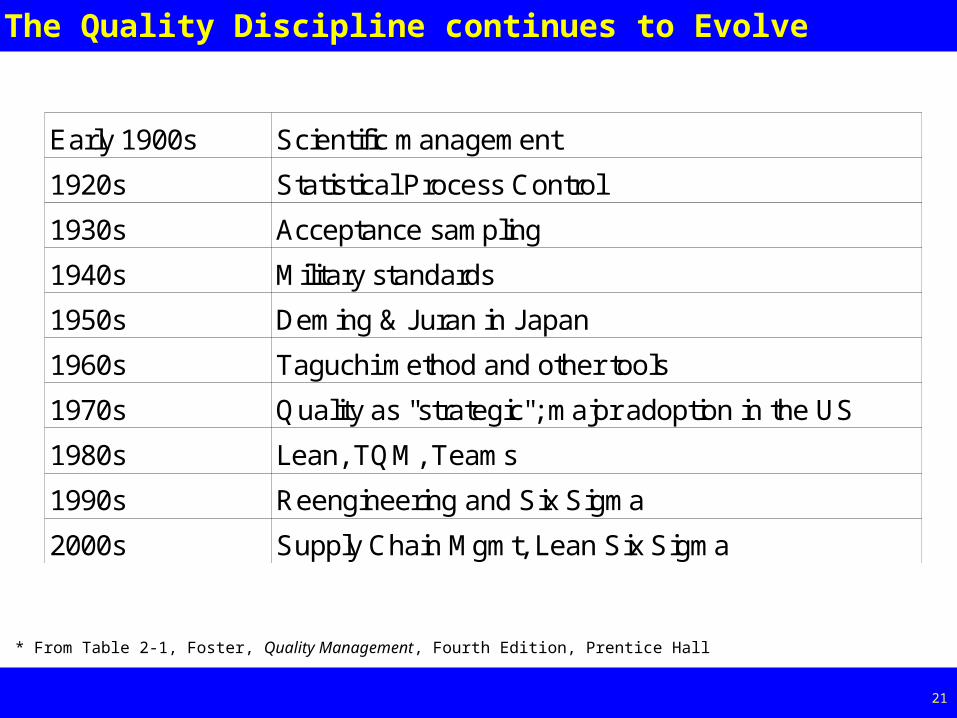
The Quality Discipline continues to Evolve
* From Table 2-1, Foster, Quality Management, Fourth Edition, Prentice Hall
Early 1900s Scientific management
1920s Statistical Process Control
1930s Acceptance sampling
1940s Military standards
1950s Deming & Juran in Japan
1960s Taguchi method and other tools
1970s Quality as "strategic"; major adoption in the US
1980s Lean, TQM, Teams
1990s Reengineering and Six Sigma
2000s Supply Chain Mgmt, Lean Six Sigma
Page 22 22
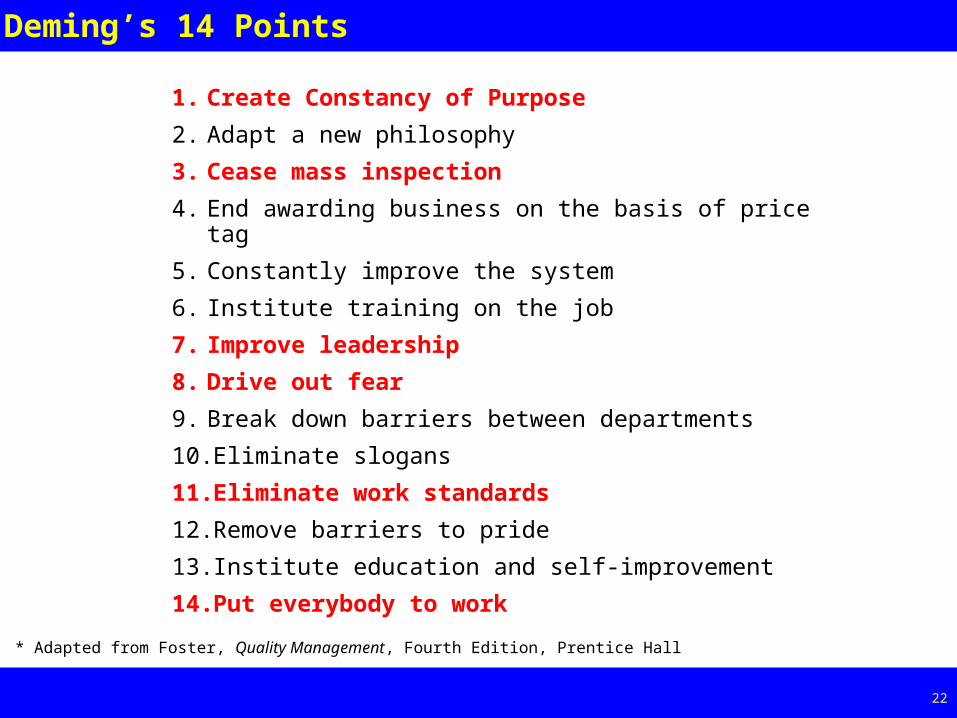
Deming’s 14 Points
1. Create Constancy of Purpose
2. Adapt a new philosophy
3. Cease mass inspection
4. End awarding business on the basis of price tag
5. Constantly improve the system
6. Institute training on the job
7. Improve leadership
8. Drive out fear
9. Break down barriers between departments
10.Eliminate slogans
11.Eliminate work standards
12.Remove barriers to pride
13. Institute education and self-improvement
14.Put everybody to work
* Adapted from Foster, Quality Management, Fourth Edition, Prentice Hall
Page 23 23
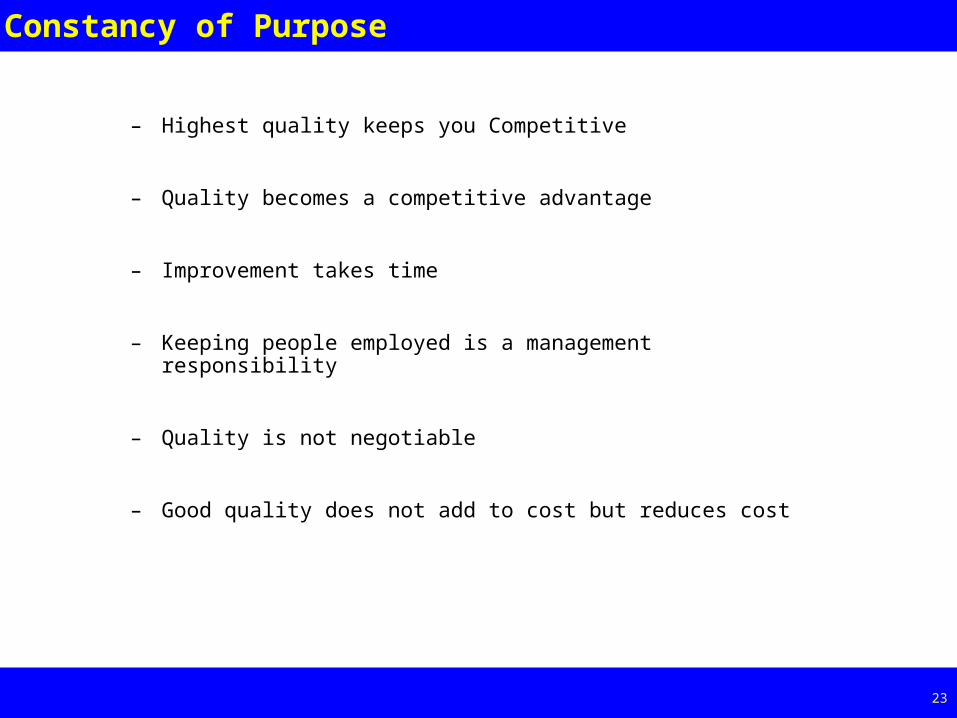
Constancy of Purpose
– Highest quality keeps you Competitive
– Quality becomes a competitive advantage
– Improvement takes time
– Keeping people employed is a management responsibility
– Quality is not negotiable
– Good quality does not add to cost but reduces cost
Page 24 24
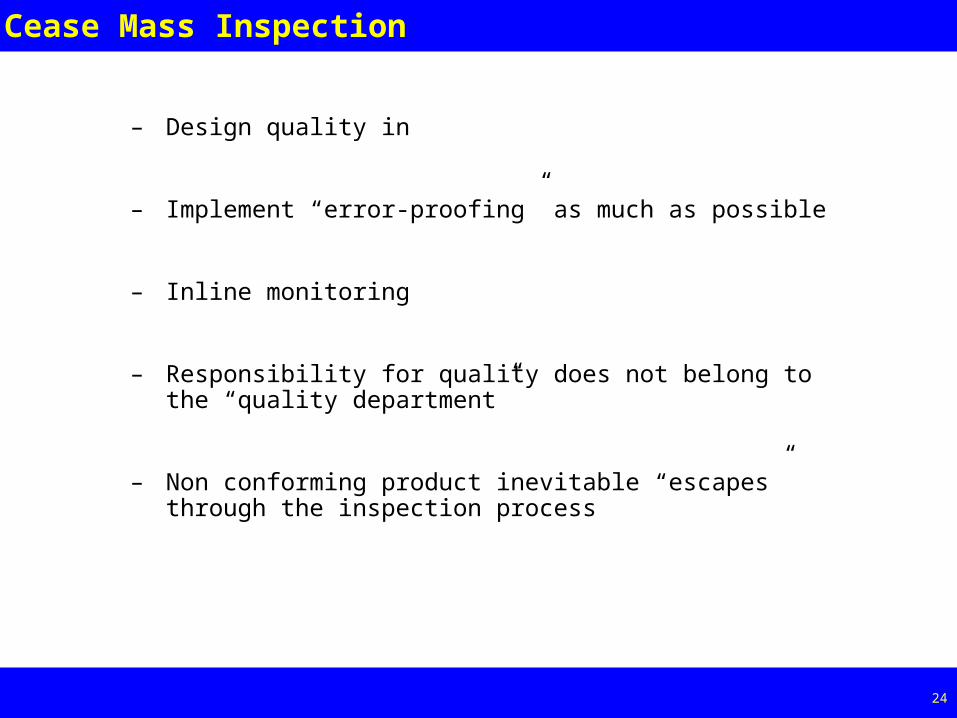
Cease Mass Inspection
– Design quality in
– Implement “error-proofing” as much as possible
– Inline monitoring
– Responsibility for quality does not belong to the “quality department”
– Non conforming product inevitable “escapes” through the inspection process
Page 25 25
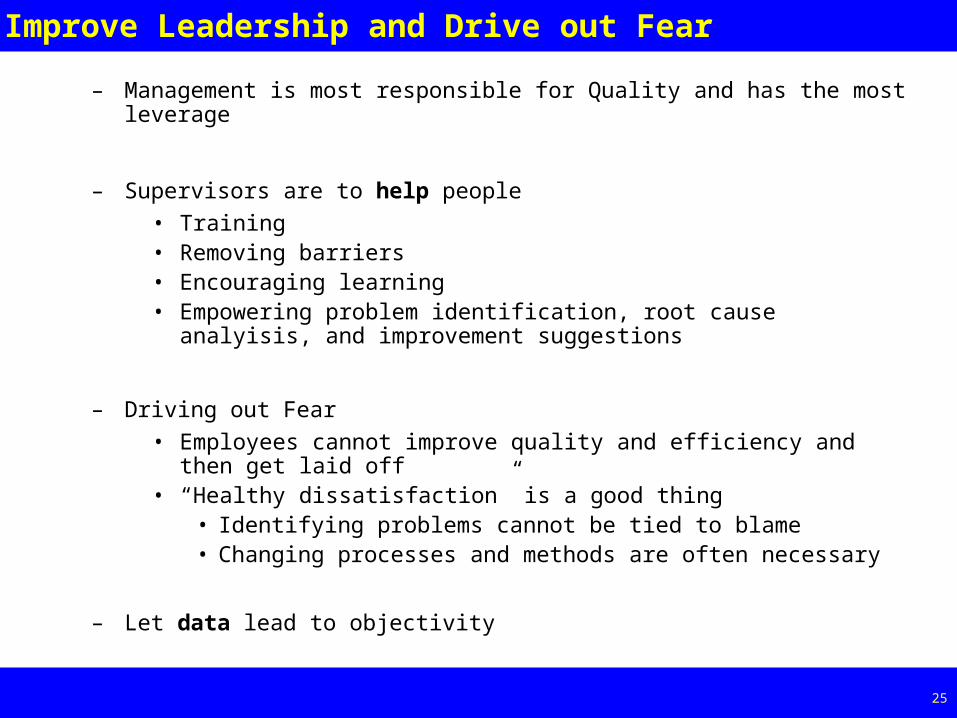
Improve Leadership and Drive out Fear
– Management is most responsible for Quality and has the most leverage
– Supervisors are to help people
• Training• Removing barriers• Encouraging learning• Empowering problem identification, root cause analyisis, and
improvement suggestions
– Driving out Fear
• Employees cannot improve quality and efficiency and then get laid off
• “Healthy dissatisfaction” is a good thing• Identifying problems cannot be tied to blame• Changing processes and methods are often necessary
– Let data lead to objectivity
Page 26 26
Eliminate Work Standards
– Remove the temptation to purposely produce low quality goods
– Establish metrics that span the entire process, rather than individual steps or machines
– Avoid conflicting objectives
• Output vs. Units scrapped• Output vs. Throughput• Cost vs. Inventory
– Teams (hourly workers and Managers together) are still responsible for output and quality
Page 27 27
Quality Improvement Planning (Juran)
– “Plan your work and work your plan”
– Manage a portfolio of improvement initiatives, balancing continuous improvement with breakthrough changes (Evolutionary & Revolutionary)
– Plan and execute discrete projects for improvement
• Business case• Project plans• Deliverables and milestones• Measurable business results
Page 28 28
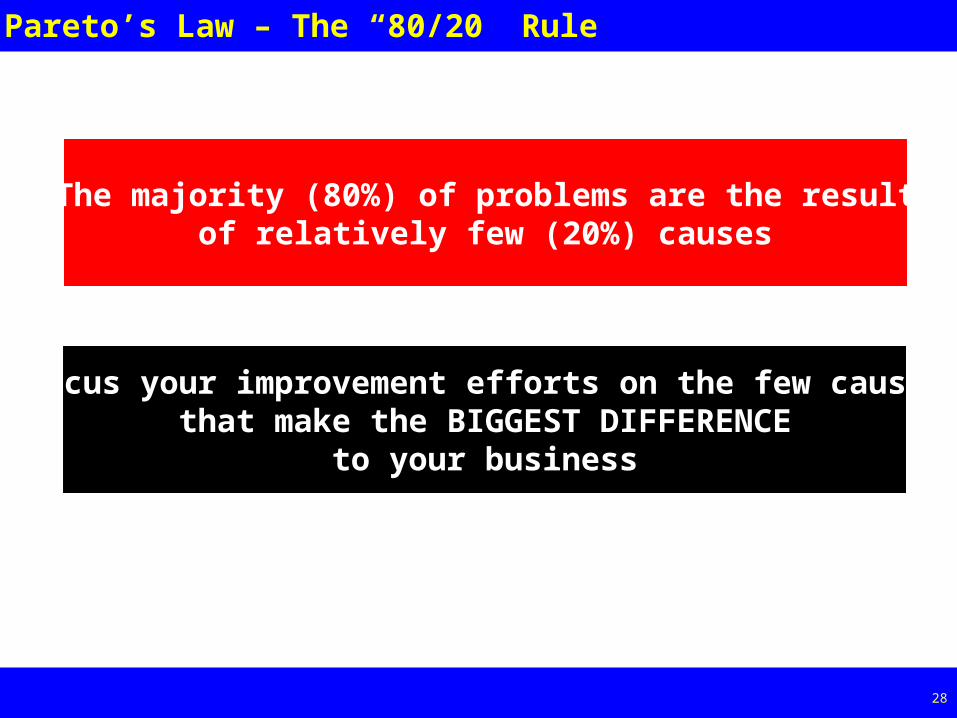
Pareto’s Law – The “80/20” Rule
The majority (80%) of problems are the resultof relatively few (20%) causes
Focus your improvement efforts on the few causesthat make the BIGGEST DIFFERENCE
to your business
Page 29 29
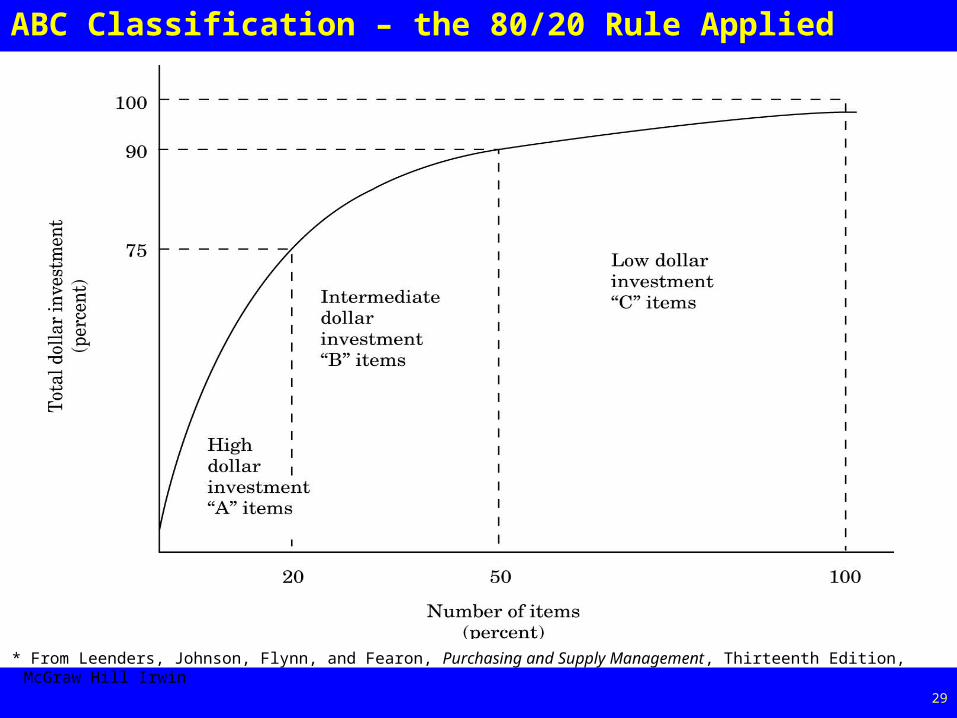
ABC Classification – the 80/20 Rule Applied
* From Leenders, Johnson, Flynn, and Fearon, Purchasing and Supply Management, Thirteenth Edition, McGraw Hill Irwin
Page 30 30
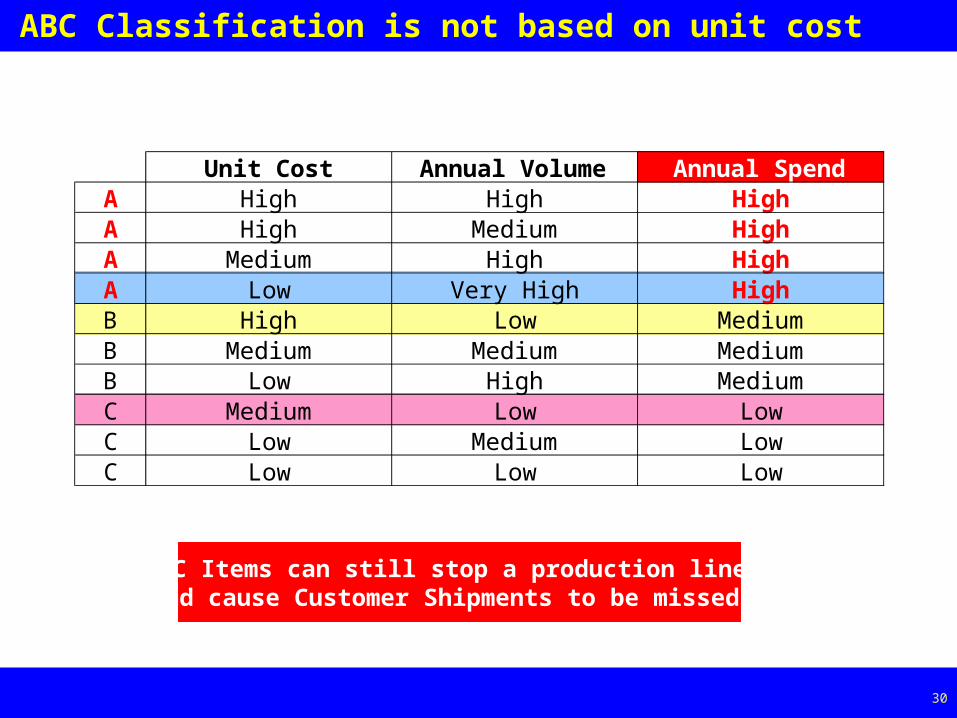
ABC Classification is not based on unit cost
Unit Cost Annual Volume Annual SpendA High High HighA High Medium HighA Medium High HighA Low Very High HighB High Low MediumB Medium Medium MediumB Low High MediumC Medium Low LowC Low Medium LowC Low Low Low
C Items can still stop a production lineand cause Customer Shipments to be missed!
Page 31 31
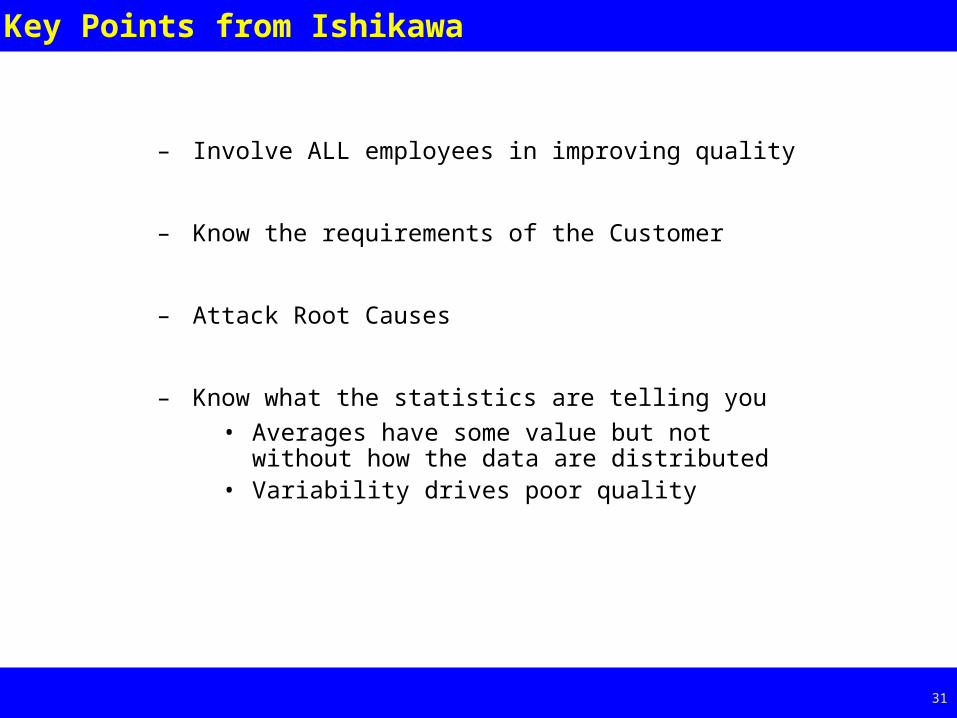
Key Points from Ishikawa
– Involve ALL employees in improving quality
– Know the requirements of the Customer
– Attack Root Causes
– Know what the statistics are telling you
• Averages have some value but not without how the data are distributed
• Variability drives poor quality
Page 32 32
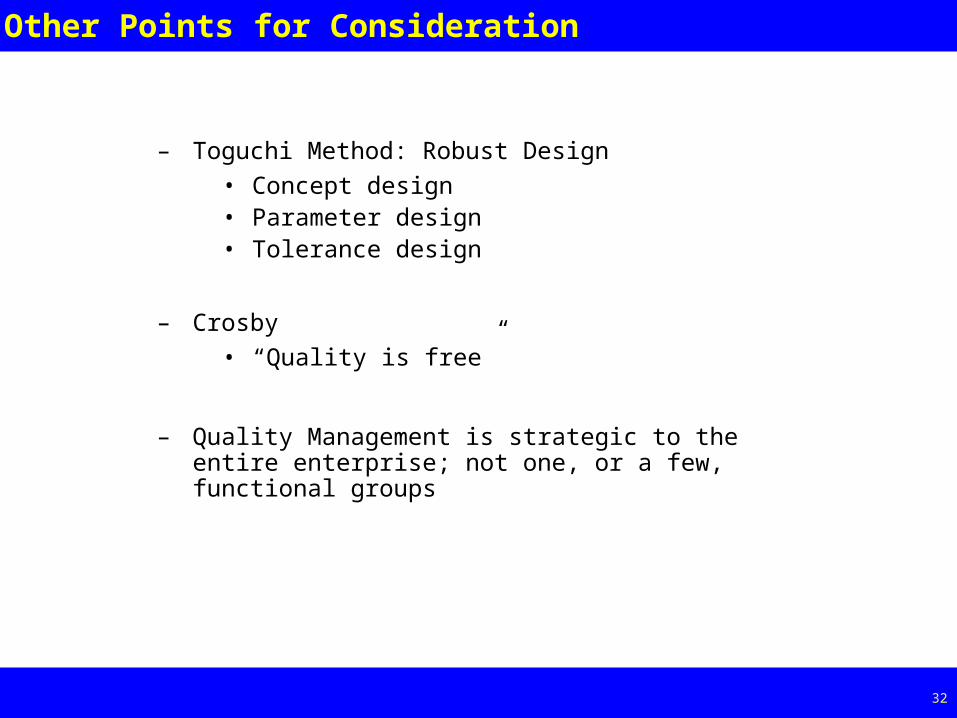
Other Points for Consideration
– Toguchi Method: Robust Design
• Concept design• Parameter design• Tolerance design
– Crosby
• “Quality is free”
– Quality Management is strategic to the entire enterprise; not one, or a few, functional groups
Page 33 33
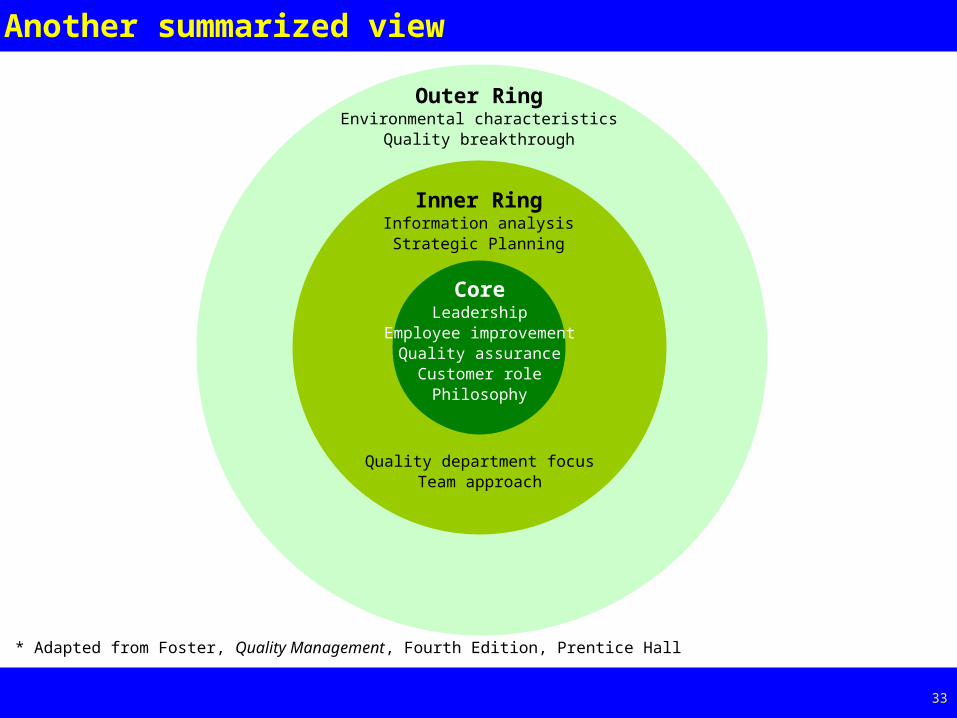
Another summarized view
* Adapted from Foster, Quality Management, Fourth Edition, Prentice Hall
Outer RingEnvironmental characteristics
Quality breakthrough
Inner RingInformation analysisStrategic Planning
CoreLeadership
Employee improvementQuality assurance
Customer rolePhilosophy
Quality department focusTeam approach
Related Documents