Total Quality Management

Total Quality Management. 2 A philosophy that involves everyone in an organization in a continual effort to improve quality and achieve customer satisfaction.
Dec 25, 2015
Welcome message from author
This document is posted to help you gain knowledge. Please leave a comment to let me know what you think about it! Share it to your friends and learn new things together.
Transcript

Total Quality Management

2
Total Quality ManagementA philosophy that involves everyone in an organization in a continual effort to improve quality and achieve customer satisfaction.
◦ Continuous improving◦ Involvement of everyone◦ Customer satisfaction
T
Q
M

3
Find out what the customer wants?
Design a product or service that meets or exceeds customer wants
Design processes that facilitates doing the job right the first time
Keep track of results Extend these concepts to suppliers
The TQM Approach

4
Elements of TQM
Continual improvement: Kaizen Competitive benchmarking Employee empowerment Team approach Decisions based on facts Knowledge of tools Supplier quality Quality at the source: The philosophy of
making each worker responsible for the quality of his or her work.

5
Lack of:◦Company-wide definition of quality◦Strategic plan for change Resistance to a change
◦Customer focus◦Real employee empowerment◦Strong motivation◦Time to devote to quality initiatives
◦Leadership
Obstacles to Implementing TQM

6
Six Sigma
Six Sigma is the measure of quality that strives for near perfection.
It is a disciplined, data-driven methodology focused on eliminating defects.
Six Sigma is a reference to a statistical
measuring system, equivalent to just 3.4 defects per every million opportunities
Conceptually◦ Program designed to reduce defects◦ Requires the use of certain tools and techniques

Intense competitive pressures – especially from rapid globalization.
Greater consumer demand for high quality products and services, little tolerance for failures of any type.
Top management (and stockholder) recognition of the high costs of poor quality.
The availability and accessibility of large data bases and the increasing ability to explore, understand, and use the data.
WHY SIX SIGMA?

Defects per Million % AccuracyOpportunities (DPMO)
One Sigma 691,500 30.85%Two Sigma 308,500 69.15%Three Sigma 66,810 93.32%Four Sigma 6,210 99.38%Five Sigma 233 99.977%Six Sigma 3.4 99.9997%Seven Sigma 0.020 99.999998
Six sigma and % accuracy
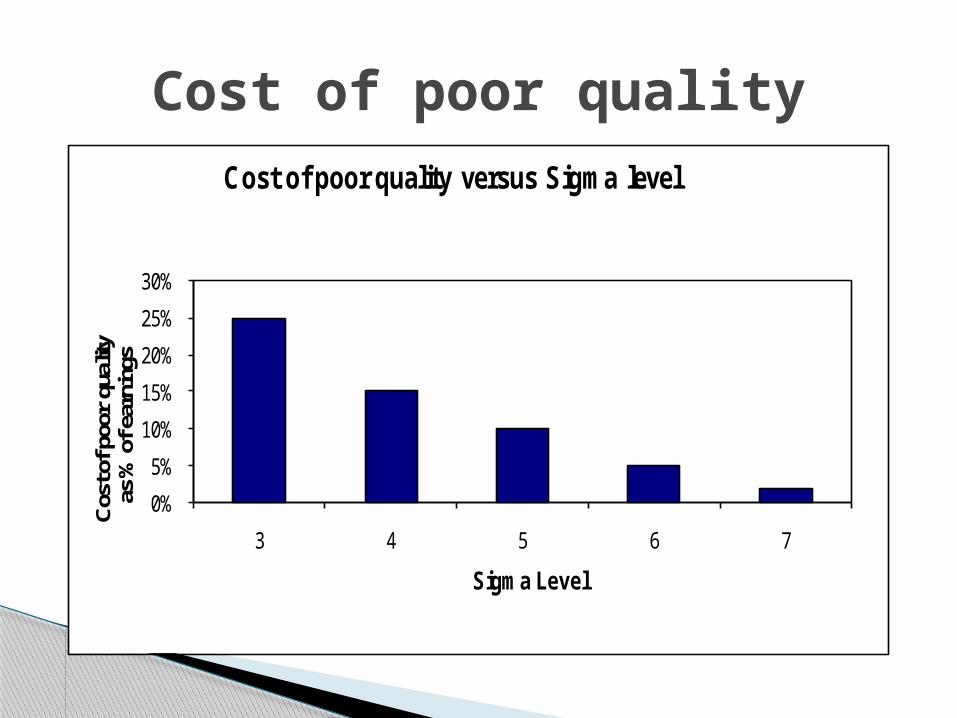
Cost of poor quality
0%
5%
10%
15%
20%
25%
30%
3 4 5 6 7
Cos
t of p
oor
qual
ityas
% o
f ear
ning
s
Sigma Level
Cost of poor quality versus Sigma level

Motorola is known for its cool cell phones, but the company's more lasting contribution to the world is the quality-improvement process called Six Sigma.
In 1986 an engineer named Bill Smith, sold then-Chief Executive Robert Galvin on a plan to strive for error-free products 99.9997% of the time. It is the origin of ‘Six Sigma’.
Inventor of Six Sigma

Motorola saved $17 Billion from 1986 to 2004, reflecting hundreds of individual successes in all Motorola business areas including: ◦ Sales and Marketing ◦ Product design ◦ Manufacturing ◦ Customer service ◦ Transactional processes ◦ Supply chain management
Six Sigma at Motorola
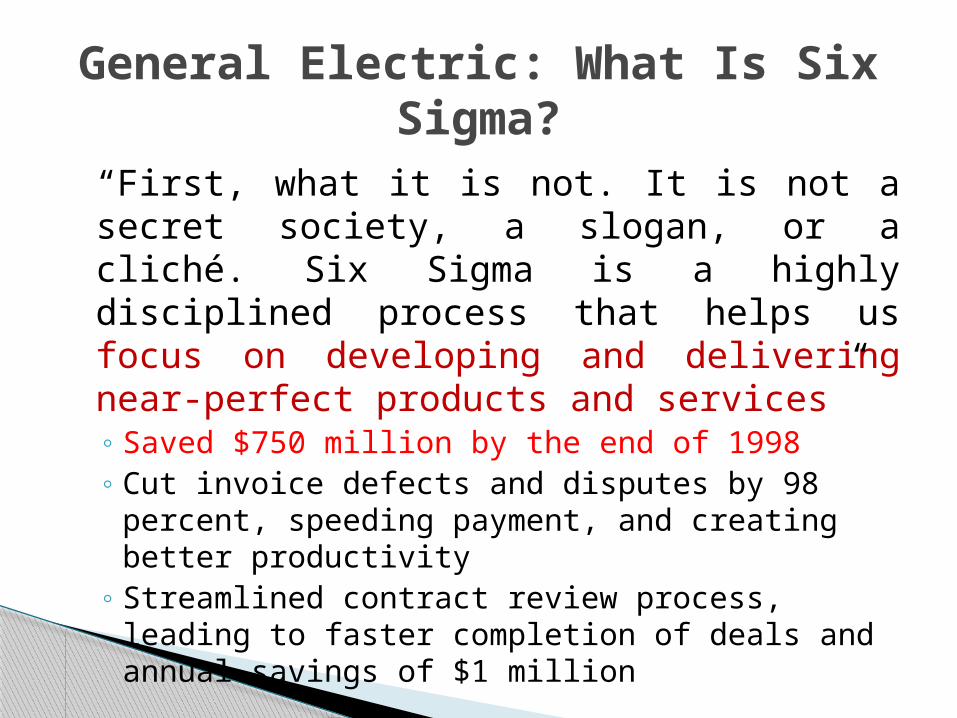
“First, what it is not. It is not a secret society, a slogan, or a cliché. Six Sigma is a highly disciplined process that helps us focus on developing and delivering near-perfect products and services”◦ Saved $750 million by the end of 1998 ◦ Cut invoice defects and disputes by 98 percent,
speeding payment, and creating better productivity
◦ Streamlined contract review process, leading to faster completion of deals and annual savings of $1 million
General Electric: What Is Six Sigma?

13
Six Sigma Programs
Six Sigma programs ◦ Improve quality◦ Save time◦ Cut costs
Employed in ◦ Design◦ Production◦ Service◦ Inventory management◦ Delivery

Six Sigma Methodology (DMAIC)
Define
Measure
Analyse
Control
Improve

15
DMAIC Steps 1. Define
Identify projects that are measurable Define projects including the demands of
the customer and the content of the internal process.
Develop team charter Define process map
1. Define 2. Measure 3. Analyze 4. Improve 5. Control
16
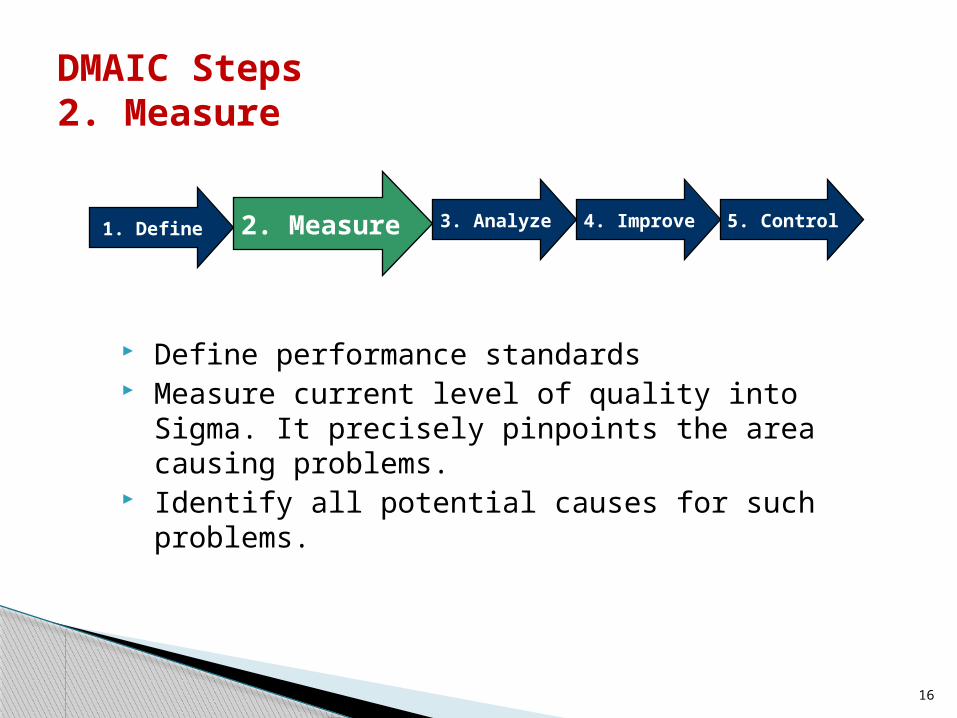
DMAIC Steps 2. Measure
Define performance standards Measure current level of quality into Sigma. It
precisely pinpoints the area causing problems. Identify all potential causes for such problems.
5.0Control
2. Measure1. Define 3. Analyze 4. Improve 5. Control

17
DMAIC Steps 3. Analyse
Establish process capability Define performance objectives Identify variation sources
3.0 Analyze
Tools for analysis Process Mapping Failure Mode & Effect Analysis Statistical Tests Design of Experiments Control charts Quality Function Deployment (QFD)
3. Analyse1. Define 2. Measure 4. Improve 5. Control

18
DMAIC Steps 4. Improve
Screen potential causes Discover variable relationships among causes
and effects Establish operating tolerances Pursue a method to resolve and ultimately
eliminate problems. It is also a phase to explore the solution how to change, fix and modify the process.
Carryout a trial run for a planned period of time to ensure the revisions and improvements implemented in the process result in achieving the targeted values.
4. Improve1. Define 2. Measure 3. Analyse 5. Control
19
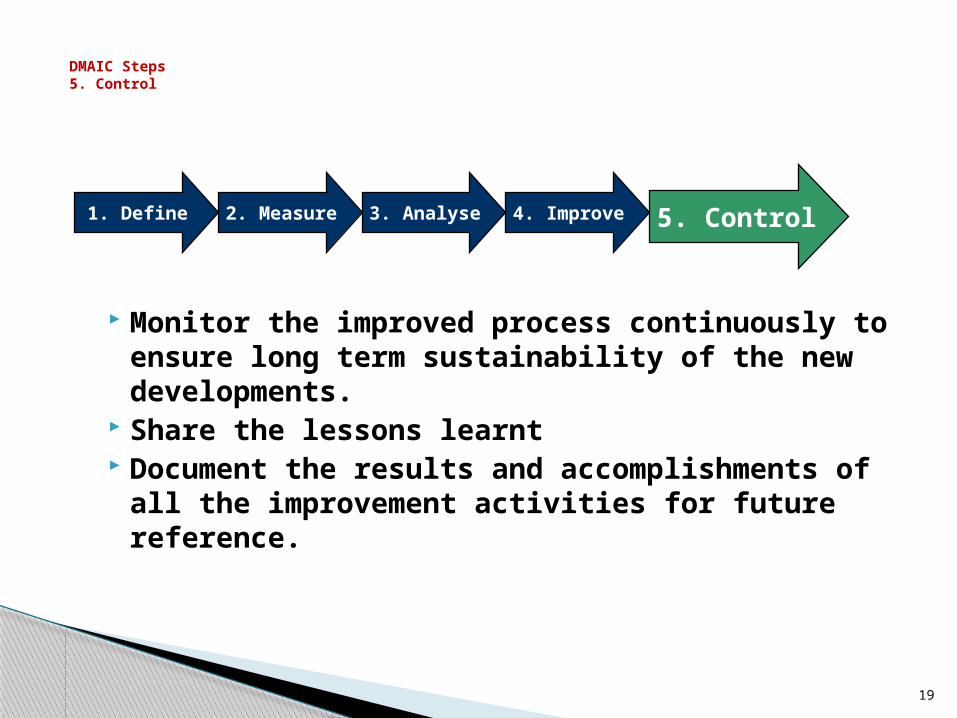
DMAIC Steps 5. Control
Monitor the improved process continuously to ensure long term sustainability of the new developments.
Share the lessons learnt Document the results and accomplishments of
all the improvement activities for future reference.
5. Control1. Define 2. Measure 3. Analyse 4. Improve

20
Basic Quality Tools
Flowcharts Check sheets Histograms Pareto Charts Scatter diagrams Control charts Cause-and-effect diagrams Run charts

Flowcharts

Check Sheet

23
Histograms A bar chart of the frequency of outcomes

Pareto Chart P
erc
en
t fr
om
each
cau
se
Causes of poor quality
Mac
hine
cal
ibra
tion
s
Def
ective
par
ts
Wro
ng d
imen
sion
s
Poor
Des
ign
Ope
rato
r er
rors
Def
ective
mat
eria
ls
Surfac
e ab
rasi
ons
0
10
20
30
40
50
60
70(64)
(13)(10)
(6)(3) (2) (2)
25
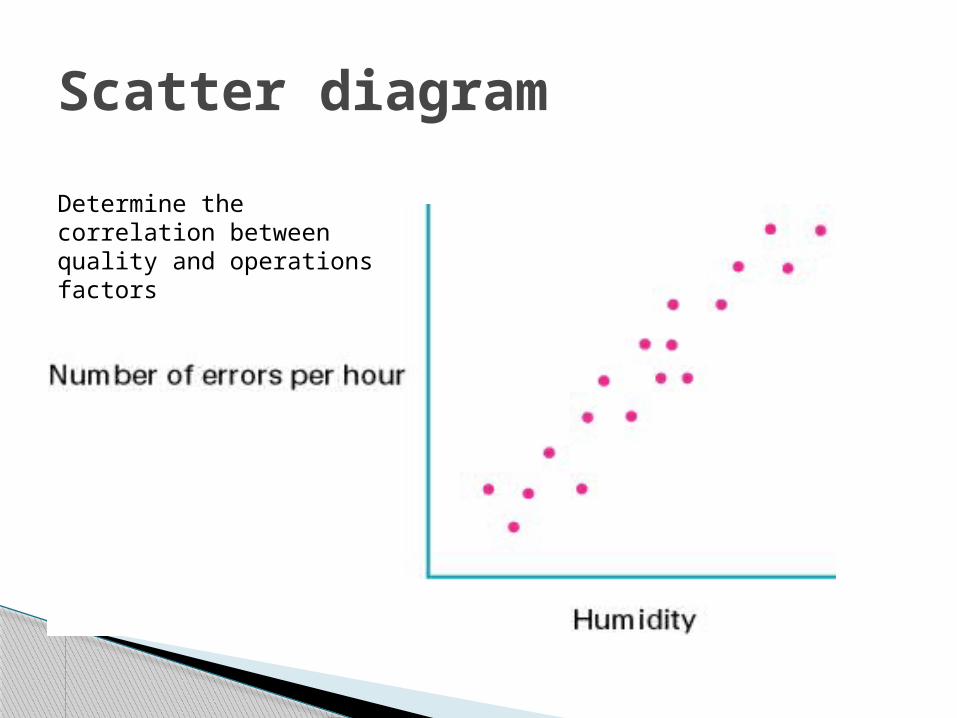
Scatter diagram
Determine the correlation between quality and operations factors

Control Chart
970
980
990
1000
1010
1020
0 1 2 3 4 5 6 7 8 9 10 11 12 13 14 15
UCL
LCL

27
Cause-and-Effect Diagram orFishbone diagram

Run Chart
Time (Hours )
0.440.460.480.50.520.540.560.58
1 2 3 4 5 6 7 8 9 10 11 12
Time (Hours)
D
iam
ete
r
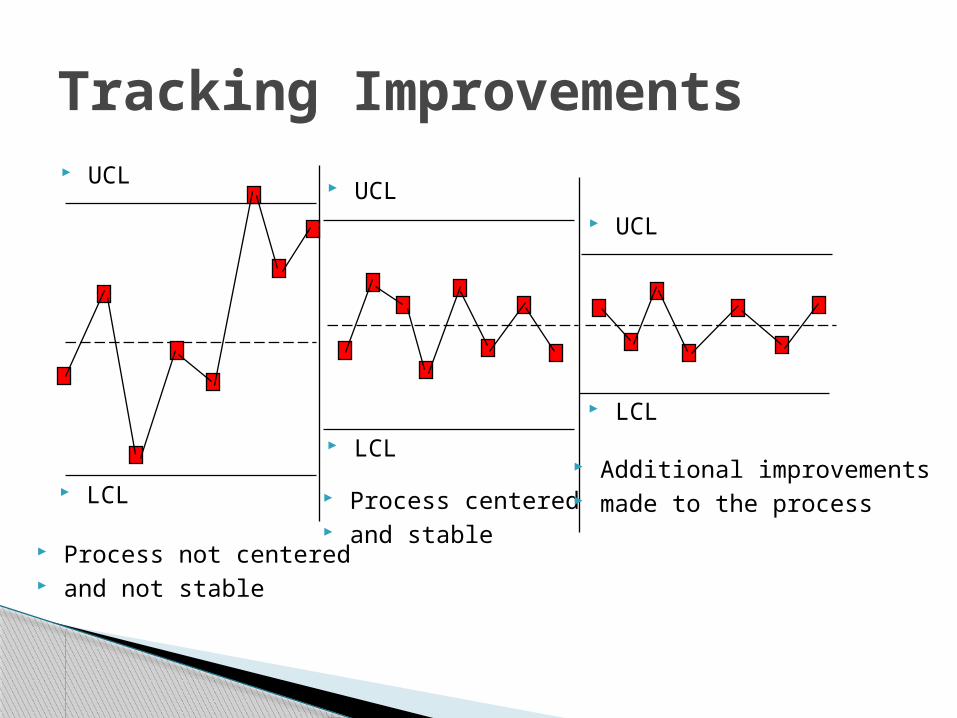
Tracking Improvements UCL
LCL
LCL LCL
UCL
UCL
Process not centered and not stable
Process centered and stable
Additional improvements made to the process

30
Methods for Generating Ideas
Brainstorming
generate a free flow of idea in a group of people
Quality circles
Group of workers who find ways of improving Interviewing: Benchmarking: Measure against best 5W2H:
what, why, where, when, who, how, how much
31
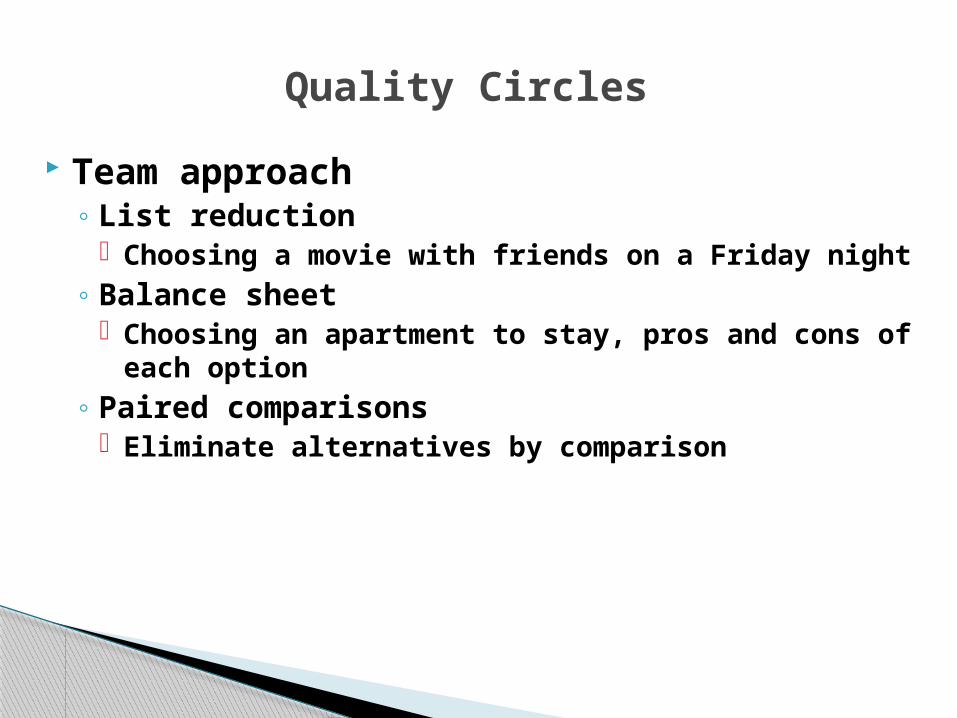
Team approach◦ List reduction
Choosing a movie with friends on a Friday night◦ Balance sheet
Choosing an apartment to stay, pros and cons of each option
◦ Paired comparisons Eliminate alternatives by comparison
Quality Circles

32
Identify a critical process that needs improving
Identify an organization that excels in this process◦Not necessarily from the same industry
Contact that organization◦Confidentiality is important
Analyze the data Improve the critical processBenchmarking numbers is much more
common than benchmarking processes
Benchmarking Processes

THANK YOU
Related Documents