-. -...- “S t bbb TOTAL 2ROCES.S ENGINEERING DESIGN MANUAL Revision : o Page No : TEP/DP/EXP/SUR INDEX Date : 2,85 0 . c NlAliHhrJl~= S6UM StlhlKq. J 1. DSIGN CONDITIONS 2* VEJjSEL!5 (vapour-liquid separators) J Horizonral . . Verrical 3. COLUMNS J * Tray . Packed / 4- HEAT EXCHANGERS . Shell + tube . Air coolers 5. PUMPS ‘II, / . Cenrrif ugal Reciprocating l 6. DRIVERS v/ Gas turbines Electric drivers / 7, COMPREssoRs / 8. EXPANDERS J 9-, FLARE SYSTEMS 10. PIPES VALVES + FlTTINCS J . I Line sizing . Piping classes . . ‘c I 11. PIPELINES J * Pressure and temperafure drops 12. PACKAGE UNITS 4 : Dehydrarion Ref rigeratlon 13. UTILITIES - . . . Plare exchangers . Furnaces . Steam Turbines 4 / . Water tiitrogen 14, COMPUTER. PROGRAMS 15. DATA 16. PROC E5S CALCULATION StiEETk 17. PROCESS DATA SHEETS . Air . Drainage P through valves and fittings Conrrol valves - sizing and selection Gas sweerening

Total Process Engineering Manual
Oct 26, 2014
Welcome message from author
This document is posted to help you gain knowledge. Please leave a comment to let me know what you think about it! Share it to your friends and learn new things together.
Transcript

-. -...- “S t
bbb TOTAL 2ROCES.S ENGINEERING DESIGN MANUAL Revision : o Page No :
TEP/DP/EXP/SUR INDEX Date : 2,85 0
. c NlAliHhrJl~= S6UM StlhlKq.
J 1. DSIGN CONDITIONS
2* VEJjSEL!5 (vapour-liquid separators)
J Horizonral . . Verrical
3. COLUMNS
J * Tray . Packed
/ 4- HEAT EXCHANGERS
. Shell + tube . Air coolers
5. PUMPS ‘II,
/ . Cenrrif ugal Reciprocating
l
6. DRIVERS v/
Gas turbines Electric drivers
/ 7, COMPREssoRs
/ 8. EXPANDERS
J 9-, FLARE SYSTEMS
10. PIPES VALVES + FlTTINCS
J . I Line sizing . Piping classes . .
‘c
I 11. PIPELINES
J * Pressure and temperafure drops
12. PACKAGE UNITS
4 : Dehydrarion Ref rigeratlon
13. UTILITIES -
.
.
. Plare exchangers
. Furnaces
. Steam Turbines
4 / . Water tiitrogen
14, COMPUTER. PROGRAMS
15. DATA
16. PROC E5S CALCULATION StiEETk
17. PROCESS DATA SHEETS
. Air
. Drainage
P through valves and fittings Conrrol valves - sizing and selection
Gas sweerening

-

.
.

TOTAL / TEPIDPIEXPISUR
PROCESS ENGINEERING DESIGN MANUAL Revision :
Date : 2J85
.
1. DESIGN CONDITIONS
I Page No :
i

TOTAL PROCESS ENGINEERING DESIGN MANUAL Revision : 0 Page No :
TEP/DP/EXP/SUR DFICN CONDITIONS Date :2/8S L-1
1. APPLICABILITY
The fol
studies.
owing design criteria are applicable for both feasibility studies and pre-project
. The design pressure of a vessel shall be taken as of rhe following ;
Operating pressure Design pressure barg barg
o- 10 MOP - 1 bar
IO- 50 MOP + 10 %
so - 100 MOP + 5 barg
> 100 * MOP + 5 36
i Note : Pnin = 3.2 Sara - - I
.* 1MOP = *Maximum ?rocess Operating i
Pressure
I
. Vessels subject to vacuum during operation shall be designed for the maximum external I operating pressure plus a margin of 0.15 bar.
If the Internal pressure is 0.35 bara or less the vessel will be designed for full vacuum. I
. Design pressure for pump discharges shall be calculated by taking 120 % of the normal
pumpA P when operating at design conditions. I
3.0 DFClIGN TEMPERATURES I:
. Design vessel temperatures shall be as follows : I
Maximum design temperature = max. operating Temp + 15 “C
iMinimum design temperature = min. operating Temp - 5 “C
or minimum ambient temperature.
. Consideration for the minimum design temperature must take into account any
depressurisation of the vessel that may occur during emergency or shut down situations.
(See section on flaring). .
4,OMATERIALOFCONSTRUCTION
. Details of the required material of construction for various temperatures are given In
Taole 1.
. Details on corrosion allowances and wall thickness are given in the vessel design section.

TOTAL TEP/DP/EXP/SUR
I PROCESS ENGINEERINb LJC~IUIU JVIMIWUM~
DESIGN CONDITIONS
.- .
-- ____-------
‘I’ hg:“- - h $
I
“-G” 3 cz--
I u _L
uu” ; - __---------
..-L&,,,--I------
: c
.
:
.
*-m .
;
: .
--.
I
.
:i
,,o.*a.v.. . -
Date : 2435 1.2
.
--A-----
_-- - - -em
--- -----
--------
: .------ ,7
8
--------L-m
n
%
2
_---w----e

-! I
f
.
i
4
I 1 I
I
rOTAL I-EP/DP/EXP/SUR
PageNo: I 1
PROCESS ENGINEERING DESIGN MANUAL Revision :
Date : 2/85
.
2, VESSELS

TOTAL PROCESS ENGINEERING DESIGN MANUAL
TEP/DP/EXP/SUR VAPOUR - LIQUID SEPARATORS
APPLICABILITY
Revision : 0 Page NO :
Date WI5 2.1
Virtually all process schemes use phase separation of some description. The design and.sizing
of a separator with acceptable accuracy is required for both the feasibility and pre-project
phases.
Consideration is given in this section to the specification of vertical and horizontal
separators for vapour-liquid and vapour-liquid-liquid separation. Details are also given
concerning vessel internals.
Separation of solids from gas or liquids is not covered in this design guide. Generally a
vendor will be consulted for details of a proprietory designed vessel. I
SWARATOR APPLICATIONS AND CONSIDERATIONS
2.1. 2 PHASE SEPARATORS (usualy vertical unless stated) I
. Comoressor and Fuel Gas KO drums
Efficient separation of liquid from vapour required. Always consider a mist
eliminator. Provide sufficient surge time (1 to 2 minutes) between the HLL and
tripping the compressor.
. Relief System KO drum - See section 9.0 Flare Systems
. Unit Feed KO drums
bd Required upstream of acid gas absorbers, glycol confactors and dessicant b-
dehydrators. Can be incorporated into base of tower for weight and space saving. I Always use demister pads.
. Production separators (Vert or horizontal)
L lquld separation from gas not as critical as compressor KO drum unless a - compressor is located immediately downstream of separator. Always consider
start-up, shut-down and process slugs when designing.
2-2. 3 PHASE SEPARATORS
. 3 phase production separators are generally horizontal. If good liquid-vapour de I
entrainment is required demisters are usually stated. Oil separation from the
water phase must be sufficient SO as not to overload water treatment units. I
Chemical additives (demulsifiers, anti-foam, pour point depressants) may be added
to aid separation. I
TEP
3.
w
4.

jMc-- PROCESS ENGINEERING DESIGN MANUAL -
TEP/DP/EW/SUR VAPOUR - LIQUID SEPARATORS
I
-’
0
I
i
I
‘- 3. HORIZONTAL OR VERTICAL DESIGN
I Provided sufficient L/D ratio is selected a horizontal separator is more efficient than a
vertical for the same flow area.
. Vapour velocity in a horizontal drum can exceed the liquid settiing velocity provided
L/D > 1. For vertical drums the velocity cannot.
. Horizontal drums are more effective and geometrically more practical for a heavy
liquid phase removal than venical drums.
. A rising liquid level in a vertical drum does not alter the vapour flow area.
Consequently vertical drums are preferred for compressor and fuel gas KO drums.
I . Vertical drums utilise a smaller plot area and are easier to instrument with alarms and
shutdown controls. For floating installations are preferred as less “sloshing” occurs.
. For high volume flowrates a split flow horizontal drum is preferable as smaller drum
diameters can be used. The preferred split flow arrangement is a single centre entry
nozzle with two end exists. Head exits can be used where plot space is limited.
. Each design case must be evaluated separately but in general the following can be used
as a guideline :
- Vertical drums Compressor KO drums Degassing boots
Fuel gas KO drums Absorber feed KO drums
Floating installations
c
- Horizontal drums Production separators HP Ref lux drums 3-phase separation Flare KO drums
. Try to avoid vessels with wall thickness greater than 100 mm as these require special
fabrication and can prove expensive.
Revision : 0
I Date : Y85 I
4. CALCULATION THEORY AND EQUATIONS (for use in calculation sheets)
(Valid only for pure gravity settlers with no internals to enhance separation)
4.1. LIQUID-VAPOUR SETTLING VELOCITY
0 Vs = K [F]” P;;: 1 :Jzi;;z;r;lity kg/m3
K = correlating parameter m/s
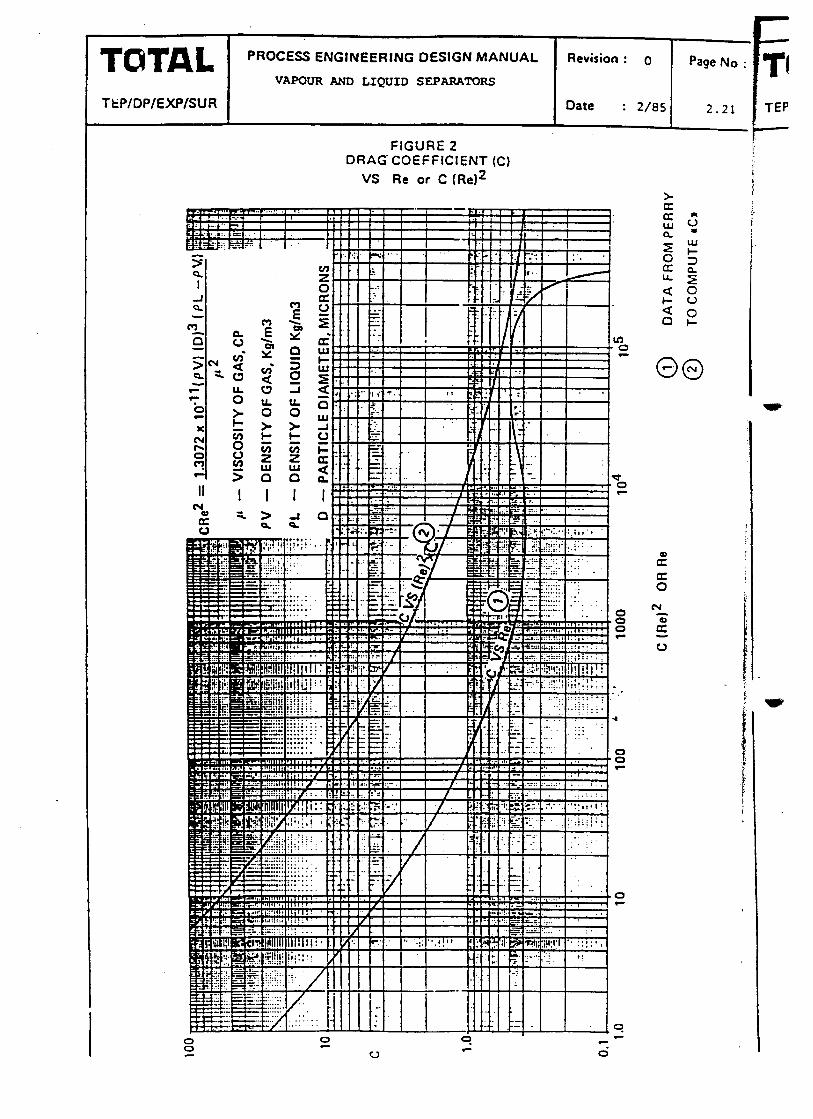
0 2. K = D - panicle diameter -microns
C - drag coefficient
0 3. Vs = c,- vapour viscosity - centipoise

TOTAL PROCESS ENGINEERING DESIGN MANUAL Revision : 0 Page No :
VAPOUR - LIQUID SEPARATORS f TEP/DP TEP/DP/EXP/SUR Date a/s5 2.3 ..J
(see p: . For medium and low pressure- with gases of viscosity less than 0.01 cp Figure 1
can be used to estimate Vs.
. For higher pressures (> 50 bar) or viscosities in excess of 0.01 cp it is necessary to
calculate Vs. The drag coefficient C is calculated using Figure 2 (curve 2) where :
Equation 3 is then used to calculate Vs.
4.2. LIQUID-LIQUID SETTLING VELOCITY
(based on Stokes law of terminal settling)
The following equation can be used for calculating the settling velocity of water in
oil or the upward ‘!settling” of oil in water. The important fact is to use the viscosity
of the continuous phase i.e : for oil settling upwards through water use the water
viscosity, for water settling in oil use the oil viscosity.
ut = terminal velocity m/s
fi
= gravitation accel m/s2
= density heavy fluid kg/m3 4
P L = density light fluid kg/m3
P c= viscosity (continuous) kg/m-s \-
Setting the particle size to I25 microns and using more useful units gives : I
0 5. Ut = 0.513 (p,;-- ) ‘~~~~~ntipoise I
. The above equation is valid for REYNOLDS no of 0.1 - 0.3 I
. If calculated settling velocity is > 250 mm/min use 250 max
I 4.3. VESSEL VOLUMES
. Partial volumes of a horizontal cylinder can be calculated using rhe partial I
volume charts in Figure 3 or estimated using the following equations :
(for vessels with a diameter < 1.2 m ignore head volumes) I
I

PROCESS ENGlNEERlNG DESIGN MANUAL Revision : 0 Page NO :
. VAPOUR - LIQUID SEPARATORS
; TEP/DP/EXP/SL’R Date ?/85 *
. .
- (see page 2.13 for sketch) AL - D2 Cos-1 D - 2h
1
4 ,~,-@-~,-hi’,2 2”
t HORIZONTAL CYLINDER Vc = AL.L m3
in radians
0
n
Y
r
I
1 ’
2 DISHED HEAD Vdh = 0.21543 h2 (1.5 D - h) m3
2 ELLIPTICAL HEADS Vel = 0.52194 h2 (1.5 D - h) m3 (most common)
2 HEMISPHERICAL HEADS Vhh = 1.047 h2 (1.5 D - h) m3 (gives extra vol)
. . VOLUMEUPTOBAFFLE
for depth h = 0.52194 h: (1.5D-h) + AL-B
(elliptical heads) 2
. These formula are accurate enough for general design and are easily programmed
on to a calculator for time saving.
. More accurate formula are available, see ref list, but are often too complicated
to be useful for multiple calculations.
. For greater accuracy the length L should be the tan-tan length and not the
flowpath length between nozzles. This is especially true with large vessels and a
tight design.
4.4. CALCULATION PROCEDURE VERTICAL VESSEL (vapour-liquid separation)
A guide for filling in the attached calculation sheet.
. Decide if Figure 1 can be applied i.e P < 50 bara,,u < 0.01 cp
. If applicable use the 500 micron curve to evaluate settling velocity (this assumes
a mist eliminator will be installed) or 150 micron with no mist eliminator. It is
recommended to install a mist eliminator for most applications. If not calculate
Vs using equ 3.
. Derate the calculated settling velocity by 85 % design margin to give a
maximum allowable vapour velocity.
. Calculate drum internal diameter and round to nearest 50 mm. (note further
adjustment of ID : OD can be made to suit standard head dimensions).
. Check if wall thickness is less than 100 mm (See 4.8). I

TOTAL PROCESS ENGINEERING. DESIGN MANUAL Revision : 0 Page No :
TEP/DP/EXP/SUR VAF’OUR - LIQUID SEPARATORS
Date : 2fsr 2.5
1 i
hl
h2
h3
h4
h6
h7
h8
I Lu
l?.
-c, L
. calculate vessel height based on following criteria :
hl - max (15 8 of b or 400 mm)
h2 - 100 mm if mesh selected
150 mm for Compressor KO
h3 - max (50 % of !J or 600 mm)
If no mesh use hl + h2 + h3 = 60 % 0 or 800 mm
h4 - 400 mm + d/2 : d = inlet nozzle @
h5 - calculate based on l-2 minutes residence time at
maximum liquid inflow - min 200 mm
h6 - base on following hold up times : (min 350)
- reflux drums 4 min
- product drums 5 min with pump
3 min no pump
- heater feed 8 min
- HP sep. to LP sep. 4 min.
h7 - 1-2 min residence time - minimum 150 mm
h8 - 150 mm for bottom connected LC
300 mm for side connected LC
I 4
I.
I
I
I
‘*F
I
I
I
I
1
I 1*
I !
I I
I I
Note : For compressor suction drums that are normally dry set HLL at 450 mm
above tan line and use bottom connected LC. This will reduce vessel I I * height if required. No specific HLL-LLL hold up time required:
I I
.
I I

-, TOTAL r PROCESS ENGINEERJNG DESIGN MANUAL Revision : 0 Page No :
TEP/~P/EXP/SUR
VAPOUR - LIQUID SEPARATORS Date .a83 2.6
4.5. CALCULATION PROCEDURE HORIZONTAL VESSEL (Vapour-liquid)
A guide on how to fill in the attached calculation sheet. ,
1. Calculate settling velocity Vs for par&al size 350, , use Fig. I or equ. 3.
2. Derate this by F = 0.85 and calculate required vapour velocity V m/s
Vm = F x Vs x (L/D) m/s use L/D of 3 to 4 max (3 initial esr)
3. Evaluate required vapour cross sectional area, Av
4. Assume drum is 70 % full i.e h/D = :7 and evaluate drum 0 to give required Av
(to nearest 50 mm). For “drq’ vessels de h/D = .35
5. For required liquid surge volume, calculate vol at HLL, if insufficient adjust D or
L (note if L/D changes significantly recheck Av using new Vm).
6. Set position of LLL in drum and confirm required surge vol between HLL-LLL. If
volume is insufficient increase 0, L or h. Include volumes in heads.
7. When setting LLL height take into account any LSLL, LSL alarms and vortex
breakers which may set minimum value usable. Usually 300-350 mm.
8. Rationalise all heights and dimensions to nearest 10 mm.
NOTES :
. For high volumetric flows of gas with small liquid volumes consider using split
flow arrangement. Design is as above but with half vapour volume flow.
. Normal design is with top entry, exit nozzles. However if space is limiting
(primarily offshore) head mounted nozzles can be used to increase flowpath.
. L is designated as the flow path length i.e distance between inlet and outlet
nozzle. 1’ is the tangent-tangent lengh. For 1st estimates 1’ = L + 1.5 pi + 1.5 D2
pi = inlet nozzle diameter 02 = outlet nozzle diameter
. “Normal” liquid levels are taken as midway between the high and low levels.

rOTAL PROCESS ENGINEERING DESlGN MANUAL Revision : 0 Page NO :
TEPIDPIEXPISUR VAPOUR - LIQUID SEPARATORS
Date : 2/85 2-7
4-6, CALCULATION PROCLDURE HORIZONTAL VESSEL 3 PHASE (See Figure 4)
. Sufficient residence time to allow separation of the oil-water mixture as well as !
1 the oil surge and vapour flow areas must be provided.
1. Proceed with steps 1 to 4 as for a two phase separation. Use L/D = 3 (lst j
estimate) and evaluate L.
2. Provision now has to be made to accomodate bath oil and water surge volumes. I Use Tan-Tan length L’ and not nozz-nozz distance L.
3. Calculate LLL required to give approx 4 mins oil surge capacity (minimum). I
Inspection will reveal whether sufficient height exists below LLL to include the
interface levels. If not, adjust the vessel bar L to give sufficient room. /
Note : If the water cut is very small, consideration may be given to using a
water boot instead of a baffle arrangement see step 10. I
4. Having determined HLL and LLL now set both position and height of baffle.
Calculate terminal settling velocity of water droplet (equ 5 sect 4.2) at both HLL I and LLL. Volumetric flow of liquid is in both cases the oil plus the water.
Calculate fall distance of a droplet across length of the drum. Baffle height and I
position can now be set noting :
- the baffle should be at least 75 mm below the LLL I
- the baffle should be at least 2/3 down the length of the drum from the inlet
- in some cases the water droplets will settle to the floor in a short
The baffle should still be set at a minimum of 2/3 along the vessel.
distance.
5. Set the HI1 at baffle height - 75 mm. The LIL according to height determined ab
vortex breaker + LSLL use a minimum of 300-350 mm.
6. Check if an oil droplet will rise through the water layer (from drum floor) to LIL
before reaching water outlet. Use area at LIL with normal oil + water flowrates.
(This criteria is very rarely governing but must be checked). .*
7. Calculate water surge time Vol HIL - Voig LIL, and residence time Vol NIL I -
XJ.8 outlet. Remember to use only one head volume, and length of drum upto
baffle. LMtnimum acceptable times are 4-5 mins. If calculated times are very long I
consider using a water boot arrangement.
8. Rationalise all dimensions and “tidy” levels to standard values if possible i.e : I
150 mm, 200, 250, 300 etc. This allows use of standard displacers.
9. Recalculate all residence times based on “tidied” levels (if required).
Note : In calculating the final residence times make sure that the vessel tan-
tan length is used and not the nozzle to nozzle distance L.
- TC TEP/f
/
1
t
i
*Ip
-

- I
* i 1 TEP/DP/EW/SUR
dTOTAL VAPOUR - LIQUID SEPARATORS /
PROCESS ENGlNEERlNG DESlGN MANUAL
10. Boot calculation- (See Fig. 5)
1s
I
Sf !
5. I
). I
le
II
a
I . e.
4 -.
d I
I
:. I
di L
I i.
_I
0
g I
: I
I
-I
Rwision : 0 Page NO :
Date S/85 2.8
. If the water volumetric flow is so small as to not warrant a separate baffled . settling compartement as detailed above a water boot should be used instead.
To design proceed as follows :
1. Proceed as previous upto step 3.
2. Calculate settling distance of water droplet when vessel is operating at LLL.
Water droplet should reach floor of drum before oil outlet. Remember that
the oil exit nozzle will be raised above the floor as a standpipe. Adjust drum
0 or L to achieve settling.
3. Check that settling is also possible when operating at HLL, droplet to fall
below drawoff nozzle level.
4. Size water drawoff boot 0 (try to use standard pipe diameters). Calculate
rising velocity of the oil in water, set downward velocity of water in boot at
90 ,% of this and evaluate boot 0. Boot length by inspection (use standard
displacers).
Note : Boot 0 must be less than 35 % of vessel 0
When heavy walled vessels are used a remote boot may be more
economical to prevent large cuts in the main vessel.
4.7. NOZZLE SIZING (see section 10.0 also)
Inlet nozzle
. Size based on normal volumetric flow + 10 % (liquid + vapour flow
. Limit inlet velocity to 7 - 13 m/s
. Round nozzle diameter up or down to nearest standard size
Gas outlet Liquid outlet
. Size on normal flow . Normal flow + 10 %
. Velocity limit 15-30 m/s . Velocity limit l-3 m/s HC
2-4 m/s water . Manholes : 450 mm or 60G . Min. diameter = 2” (avoid plugging)
4.8. VESSEL WALL THICKNESS
Calculate vessel wail thickness using the ASME VIII div. I formula. The wall
thickness should be calculated immediatiy after D is known to confirm if
t < 100 mm.

QTAL PROCESS ENGINEERING DESIGN MANUAL Revision : 0 Page No :
TEP/DP/EXP/SUR VAPOUR - LIQUID SEPARATORS Date *Z/85 2.9
I I I I
C = corrosion allowance mm
- use 3 mm unless stated
otherwise by EXP/TRT
use 1 for seamless shells .85 otherwise
s = max. allowable stress bar
use 1220 bar for CS plate
1000 bar for SS plate
for t < 100 mm : no fabrication problems
100 < t < 150 mm : vendor advice may be needed
t > 150 mm : Major fabrication problems
In order to meet standard vessel head sizes and wall thicknesses the following ranges should be
observed :
Vessel diameter : 250 - 1250 mm in increments of 50 mm i.e. 250, 300, 350...
1300 - 4000 mm in increments of 100 mm i.e. 1300, 1400, 1500...
Standard wall : 1 - 30 mm in increments of 1 mm i.e. 1, 2, 3, B...
-D = diameter mm t Z wall thickness mm
t = PD +c P ZSE - 1.2P
= design pressure barg
E = joint efficiency
thicknesses 30 - 60 mm in increments of 2 mm i.e. 30, 32, 34, 36...
60 - 140 mm in increments of 5 mm i.e. 65, 70, 75, 80...
4.9. VESSEL WEIGHT
Vessel weights either horizontal or vertical can be estimated using Fig. 5. This figure j
is for the steel shell including manholes, nozzles, fittings etc but not the removable I
/ I internals or support skid. The heads can be estimated by using weight of 2 heads = ,,
(m) x wall thickness (mm) x 20 kg.
5. VESSEL INTERN&
5.1. MIST ELI,MINATORS
. tMist eliminators or mesh pads are located under the vapour outlet nozzles of aI1
compressor suction drums and fuel gas KO drums. For production separators it is
always gaod practice to install an exist mesh pad.
. For dirty or and high viscosity liquids the efficiency falls to approx. 75 %. Consult
vendor for futher data. .
5- -1
5.:
6.0 R
6
6
6

‘TOTAL TEPIDP/EXP/SUR
.L
PROCESS ENGlNEERlNG DESIGN MANUAL Revision : 0 Page NO :
VAPOUR - LIQUID SEPARATORS Date ?I= 2-10
A -
. Mesh is usually made from 304.55. YORK DATA as follows :
-
)e
Types of pad : York no kg/m3 Thickness Residual* mm ’ entrainment PPM
General purpose 431 144 100 1.0 - 1.2
High efficiency 421 192 100 -55 - .61
326 115 100 -17 - 0.19
Dirty service 931 80 150 1.6 - 1.8
644 150 .8 - .87
. The engineer should specify type, diameter and thickness of pad required on
the vessel data sheet.
. For particle sizes of 5 microns or less use two pads spaced 300 mm apart eg :
. giycol contactor.
5.2. INLET INTERNALS
Inlet internals can be specified to aid feed distribution and promote vapour-liquid
separation. Generally for pre-project stage details are not required.
I 5.3. LIQUID PHASE INTERNALS
I re i IIP
-)r c
. Vortex breakers should be detailed for each oil/condensate and produced water
outlet where the oulet flow direction is vertical.
. Vendors will sometimes specify internal packs of tilted plates or baffles or other
arrangements to promote phase separation.
. Sand jetting facilities should be provided for on services where there is a risk of
silting or sediment build up in the vessel. Generally jetting facilities are not
required on gas-condensate systems.
I 6.0 REFERENCES AND USEFUL LITERATURE all /
is I
6.1. LUDWIG VOL I CHAPTER 4
I 6-2. PERRY CHAPTER 6
ult
I i
6.3. Program calculates partial volumes Pierre Koch
OGJ Dec. 3 1983

Operating data :
Pressure (operating) bata = l-04-
Temperature (operating) “C = 34
Gas ,MW = 51-b
Gas flow rate Wg kgfhr = 7 ‘?.qO
Gas density T, P kg/m3 = 2-i
Acrual volume flow Qg m3/s = 1
Liquid description : CQ3E 0.L
Liquid flow rate kg/hr = 1~4 4co
Liquid density (T,P) kg/m3 = BIO
Actual volume flow m3/min = 2.23
Particle size microns = Iso-
3
rs
h6
,Mesh pad .Ye : J . Estimate Vs using Figure 1 and 500 micron line h’ II
No : . If P < 50 bar and /^ < 0.01 use Fig. 1 and 150 microns it h8
. If P > 50 bar or ,+ > 0.01 use calculation for Vs
1. Vawur-liquid settling velocitv : from Fig 1 vs = I-6 m/s 7. w -
or calculated C = ; vs = m/s .
,
2. Derating % = 85 maximum velocity Vm 5 \-36 m/s
3. Actual volumetric Drum flow area = 0-s m2
gas flow = I m3/s Calculated drum D = too0 mm *
2 uapu arCn k ..Y bpCCII.A~ 5 II*
SELECTED DIAMETER = 2500 mm ha * -
a+5+3 -64 L\9..3 a3CrA.d = c.q&
4.. Required liquid hold-up times, l ;. HIA- --LLL 8. V
h5 : HLA - HLL = 2. min = i-b m3 = 400 mm height t
h6 : HLL - LLL = 5 min = It*15 m3 = z-r50 mm L
h7 : LLL - LLA = 2. min = 4-4 m3 = 900 mm D
5. ,Mesh pad : Q
e /no thickness = too mm
Sheet 1 of 2 .-
PROCESS, CALCULATION S&ET -I m
m-4-7 TOTAL ITEM : DEqAss’~4 r50aT
TEfKxF/MP / EXP/ SUA VERTICAL VAL’OUR-LIQUID SEPARATOR NO : D 123+
BY CHK OATE JOB TITLE EXAr?td JOB Ho E.XhHtLf REV -___-~

‘(\ . f r 1. 5 eight calculation . 0 ?
= 2500 mm
hl : I5 % of 0 or 400 mm (Use max)
h2 : mesh pad
h3 : 50 % of P or 600 mm
With mesh : hl + h2 + h3 .
No mesh : hl + h2 + h3 : 60 % 0 or 800
h4 : 400 mm + d/2 : d = inlet notz 6
h5 : From step 4 or 200 mm
h6 : From step 4 or 350 mm
h7 : From step 4 or 150 mm
h8 : 150 mm for bottom LC
300 mm for side LC
For “dry” vessel
h6 + h7 + h8
mm
mm
mm
mm
mm
mm
mm
mm
mm
550
900
2250
so0
(So = mm
= mm
TOTAL VESSEL HT TAN/TAN = SSSO mm
7. Wall thickness
. DESIGN PRESSURE p= 2-5 barg Diameter D = 2500 mm
. CORROSION ALLOWANCE C = 3 mm
,Max stress :
5 = 1220 bar CS I
1000 bar f5 s= I -2”yo
Joint efficiency t.85) E = o.%S
PxD =ZxSxE-1.2P
+c
= 6-8 mm = 9 mm I tmin = D/800 + C + 3 mm
8. Vessel weight Gig. 6)
f= 7’ mm Shell weight = i=os>o kg
L= 6-q m (5-9-I) Head weight = 450 kg
D=2-5 m (t x D x 20)
I TOTAL WElCHT = TsoO kg -
I Sheet 2 of 2
I m-0 PROCESS CALCULATION kiEET :
TOTAL ITEY : pqcc=4 0Qo-r VERTICAL VAPOUR-LIQUID SEPARATO
f-moP/MP/ EXPIQJR NO : w a.3+
@iY CHK QATE JO9 TITLE E’XCTPZQ~ JOEI N- : tZICh-WwC PEV

CALCULATION SHEET FOR HORIZONTAL 2 PHASE
I- TAN/TAN (L’) 6530 -c*
L= 6000 mm 4
-1 a
D= Zooo
Head type 2:l elliptical/k l
Indicate on sketch if demister mesh required
l Delete as applicable
Operating data :
Operating pressure bara = 20
Operating temperature ‘C = r8
Gas molecular w+ = -*cc
cgas flow rate Kg/hr = (3 950
Gas density T, P Kg/m3= t%O
Qg acttial vol flow m3/s = O-Z??
Gas viscosity cP = 0.0toBS
1. Vapour-liquid settling velocity : from Fig. 1
EQUIPMENT N” : v zo\o
DESCRIPTION :
Liquid nature : ~ti
Liquid flowrate Kg/hr = 121 650
Liquid density T,P Kg/m3= XS.0
QL actual vol flow m3/min = 2-65
Particle size microns = (50
or calculated c= ; vs = m/S
2. Max. vapour velocity
L/D T 3
Vm=VsxFxL Vm= O*SVC m/s E
3. Actual vapour volumetric flow Qg = 0.2TI m3/s AV = 9g = 0*4X m2 Vm .
5. Dr -
Fc
w elec
Vapoc % To- Total Liquic
t
I
cala Selec
” L/D ( Flow1
a) Ta
HLL b) VC LLI. V
9 b‘c
CalC~
NOT
6i
liH0 TUTAL ml50
PROCESS CALCULATION SHEET
CALCULAnON FOR HORIZONTAL ITEM : EXm-lk~
‘EP/DOe/olP/ EXP/QJR . OHfUE NO :
I 1 I - _ -- I< - r 1nFI &I= .

4 . Nozzle sizing vel limits : m/s inlet 7-13, Exit 15-30, liquid 1-3 f
pi : inlet flow = o-32\ m3/s NozzleID= 8 ” Actual VCI = 16.8 m/s
(+ 10 %I 0.35
62 : Gas exit = O-Z% m3/s NozzleID= 6 n Actual vel = t5 m/s
6 Liquid outlet = O+ m3/s NozzleID= 6 ” Actual VCI = 2*1 m/s
5. Drum sizing
For trial 1 tres = 4 mins
- elected h/D Vapour area Av % Total area Vig. 3) Total area Ar Liquid area Al
Calculatd drum 6 Selected drum P D -
L/D (3 - 4) Flowpath length L
a) Tan/Tan length L’
i HLL height b) VOL Q kLL LLL height
; vo1’3 LLL
VW AVOL ;__ d-e. ,
’ Calculated tres i
I NOTES :
vol required = 4 x QL = to*& m3
m2
m2 m2
mm mm
mm I srso I
I SELECTED DRUM : DIAMETER b 2000 mm x 65%~ mm tan/tan
a)
b)
I$/tan length L ’ = L + 1.5 x Pi + 1.5 92 I nore this correction if D < 1.2 m and use L for volume talcs. For trial 1 use L
and ignore heads).
if VOL HLL is less than required surge increase D, L or h/D or reduce tres (by inspection).
RR0 PROCESS CALCULATION SHEET
- TOTAL mm-/
CALCULATION FOR HORIZONTAL lfEY :
=vDDP/MP/ ExP/suFI 2 PHASE NO : fX&l+WLC
r l a* ’ 1 =“(( ’ DATE Jo8 TITLE : JOB N* : REV

6. Wall thickness
. DESIGN PRESSURE
. CORROSION ALLOWANCE
f = PxD +c 2SE- 1.2P
8. Vessel weight (Fig. 6)
t = 2s
L = 6.53
D= 2
mm
m
m
P= k-q barg Max stress CS = 1220 bar C =’ 3 mm SS = 1000 bar
s= I220
Joint efficiency E = 0 ~85
= 2s mm
Shell weight = LO 800 kg
Head weight = \ 000 kg
(t x D x 20)
TOTAL WEIGHT= I?, 000 kg
C A
Wg Del
Qs
Par
II
II
‘I
‘I
mmn . t mocEss CALCULATION SHEET
TOTAL ;
m-mu CALCULATION FOR HORIZONTAL
ITEM :
2PHASE EWPLC TEP/DOelMf / UP/ SJR
NO :
I I I I .^_ -.-. - *nm u. . Ilh=”

L TANRAN LENGTH L’ - Soeo
PLOW PATH LENGTH Lr 4%oo I
I
0 1 pt. +y2 - 0 . Amend sketch if boot
required instead of baffle Indicate on sketch if mesh required
Heads : 2 : 1 elliptical
EQUIPEMENT No : 0 Se\0
A B 3400
Operating data :
Operating pressure bara = 4-0 CONDENSATE !
Operating temperature ‘C = 50 pc -. WI QL
GAS MW
I-
PC Wg flowrate kg/hr = 4saqt 1x5 i- Yln-:y,r c - -;- .-:
Density Q T,P
Qg Vol flow P
i
Kg/m3 = 35.0 W-ATER CUT
m3/& = 1tq : 0~~3Lq5 pw x o.ocn cQ
QW Parricie size microns = tso
PW
I
1. Vapour-liouid settling velocity : from Fig. 1
or calculate2 c ,=
i. ,. mv 2. Maximum vapour Vm=VsxFx&
velocity L/D = 3 D -\Y+. F’ ,,
t
3. Liauid-liquid settling
I
Oil in water u, = 0.513 f--/c
El Pd
Water in oil
I
ut = 0.513 p-/c H PC I
;
w I .
Flowrate Kg/hr = ‘3tooo
Density T,P Kg/m3= 32%.4
Vol flow T,P m3/min = 0*‘i1
Viscosity cp = 0.75
Flowrate Kg/hr = QSsS
Density T,P Kg/m3= 988
Vol flow T,P m3/min = o-168
Viscosity cp = 0-S
vs = 0.135 m/s
vs = dS
Vm= O-rcrc6 m/s
mm/min .‘. &oil = 2lJ mm/min
mm/min -*. Utwater = \7+5 mm/min
-I SI;u PROCESS CALCULATION SHEET I
TOTAL -’ mm CALCULATION FOR HORIZONTAL ITEM :
3 PHASE C%4w+d NO :

4. Nozzle sizing: vei limits m/s : inlet 7-13, Exit 15-30, liquid 1-3 m3/s : nozzle id : 1
actual vel ,M/S
1. Inlet flow :
(+ 10 %) o*oss L” (IO0 -1 ci*% 2. Gas exit : o-036 6. 6.4 3. HC outlet : 0 ,012 3” (w-1 2.6 4. Water outlet :
0 * 002B 3” 0.G , A
5. Vessel sizinq
For trial 1 use hold up time oil (HLL-111) = 4 mins - 2-W n’
OIL SECTION
Selected h/D Calculated (Qg/Vm) Av as % AT (Fig. 3) Total area Liquid area
Calculated fJ Selecred 0
Av m2
AT m2 AL m2
mm D mm
L/D (3 - 4) Flowpath length a) Tan/Tan length
HLL height VOL at HLL
LLL height VOL at LLL AVOL
L 1’
hl
h2
mm ‘mm
m 11: m3 mm m3 m3
Calculated tres min
I 1 650 I 1 1000 19 1250
- 1srt500
Notes or comments :
.
a) tan-tan 1engthL’ = L + 1.5 x (61 + 62) mm - Ignore if D < 1.2 m . . ‘. . .
PROCESS’ CALCULATION SHEET 2 -I
TOTAL CALCULATION FOR HORIZONTAL ITEY :
3 PHkFE lridA4Pd ~/orPfDw/uP/sm MO :
erl I i34K DATE \ JOB TITLE : JOB Ma . SIFV i

% ATER SECTION
Trial 1 B = 2/3 x L = 3450 mm (rounded)
+ 1 I
I;
I.
I,
I I I
Total liquid vol flowrate I Qw + QL m3/min I 0.88
Baf fie distance B 1 3460 Liquid area at HLL AL :? 1 o-s34 Horizontti vcl at HLL Vl mm/min 1 ‘OS5 Ut water (step 3) mm/min I I??-S Vertical fall from HLL I
= B x Ut/V mm I s- Final settled h = HLL - vert fall mm I 2=
I Liquid area at LLL AL m2 1 0443 Horizontal vel at LLL 1 V2 mm/min I ZW Ut water (step 3) mm/min I WI5 Vert fail from LLL
= B x UGJV2 mm ; 290
Settled baffle height h3 mm 1 400 Selected HIL level h4 mm I 320 (adjust h3 and B if necessary)
f Check oil rise : I Horizontal vel at LLL v2 mm/min I *to Ut oil (step 3) mm/min I -w Vert rise avec dist B I
= B x U+/V2 mm 1 400 = mm outlet height I
1 h5 selected LIL level mm 1 ZTO
I h6 selected outlet height mm I bo
ql water vol at HIL (upto baffle) m3 1 I-O! i
q2 water vol at LIL (upto baffle) ’ m3 1042
I $3 water vol at NIL (upto baffle) m3 1 oar
1 q4 water vol at outlet ( ” 1 m3 I Oti
I q surqe = vol (ql - q2) m3 1 0.3
I surge time q/Qw mins 1 2.3
I residence time q3-q4/QW mins 1 2-h
1 calculated oil residence time (upto baffle) i
Vol (NLL - NIL)/QL mins
I I 1 I I I I
I I I
I I i I
I I I
1 I I
t I
I I I I
I I I
I I
I I I I I
t
I 1 I I
I I I
i
I I I
/ I I I i I
1
I I I I I I
I I
I I
I I I I i I
I
i
I
1
t I I I
t I
I I I I I I I I I I I
I I I I I I I I I I I I I I I
I I I I I I I I I I
mm2 . PROCESS’ CAiXULATlON SHEET 3 -
TOTAL mQ3 CALCULATION FOR HORIZONTAL ITEY :
3 PHASE Elc4tiPti Ep/DoQ/Dw/ExP/sufl NO :
BV CMK DATE JOB TITLE : JOB Ho : REV

6. Wall thickness
. DESIGN PRESSURE P = u-7 barg Max stress
. CORROSION ALLOWANCE C=3 mm
t = PxD +c 2SE- 1.2P
8. Vessel weight (Fig. 6)
t= 35 mm i=S m
D = 1.5 m
=
Joint efficiency
35 mm
# , : ,:. I ..
?26/0
Shell weight =)&>-kg
Head weight = LOSo kg
(t x D x 20)
TOTAL WEIGHT =
, ’
CS = 1220 bar
55 = 1000 bar
s= I220
E= .8<
b
. ILATION SHEET 4
CALCULATION FOR HORlZONTAL ITEM :
Ad., c
3 L’HASE E% qv\. -
PI-IMP/ EXP/ SaJSUR NO :
--
PROCESS CALCU
v PYY OATE 9 TITLE : JO8 N’ : 1 REV rb
TEP/DI

TAL PROCESS ENGINEERING DESIGN MANUAL I VAPOURANDLI:QUTDSEPAR&~RS
I Revision : 0 Page tuo :
T&P/DP/ExP/SUR Date : 2/85 2.20
FIGURE 1
VS - LIQUID SETTLING VELOCITY nd
TkP/DP/EXP/SUR
PROCESS ENGINEERING DESIGN MANUAL Revision : 0 Page NO :
VAPOUR AND LIQUID SEPARATORS
Date : 2/85 2.21
FIGURE 2 DRAG-COEFFICIENT (Cl
VS Re or C (Re$
O@
N
z a
0

Page NO :
TEP/DP/EXP/SUR 1 I
FIGURE 3 ..____ RELATIONSHIP BETWEEN CHORDAL HEIGHT
AND CIRCULAR SEGMENTAL AREA 4
0 a w 0
0 5 10 15 20 25 -- --
PERCENTAGE OF ClRCLE DIAMETER

rOTAL TEP/DP/EXP/SUR
PRWESS ENGINEERING DESIGN MANUAL
VAPOUR FND LIQUID SEPA!!TORS
Revision : 0 Page No :
Date : 2/8S 2.23
FIGURE 4
3 PHASE SEPARATOR
ALL DIMENSION SHOWN ARE MINIMUM RECOMENDED MIN
UY 300 m m min
HIL
------- ,M)- +&y 1,
100 -I-lm 150 fg
OIL RESIDENCE TIME - Volume between NLL-NIL upto baffle only
use residence time of 3-6 minutes for design
OIL SURGE TIME - Volume between HLL and LLL.across full length of vessel
use 4-5 minutes if feeding to another column/vessel
5 minutes if pumping to storage
3 minutes if flowing to storage (no pump)
8 minutes if sole charge to fired heater
WATER RESIDENCE TIME - Volume between NIL and outlet
Use 4 minutes minimum
WATER SURGE TIME - Volume between HIL and LIL
Use 4-5 minutes minimum
TE

‘age No :
2.23
essel
,Y, “‘VO TAL
TEp/Dp/EXO/SUR
PRbCESS ENGINEERING DESIGN MANUAL Revision : 0 Page NO :
VAPOUFt AND LIQU,ID SEPARATORS Date : 2/85 2.24
fIE 2.400 t-200 _.~
1.900
1.600
1.400
12UO
1.ooo
900
600
700
600
so0
T iFI o i I
- I IAH! 1 oddlmlokl+c c 08 nNl sdcns Jwt" I I IIlrlll I I IL
s 6 7 8 910 12 1416162024683025404560
FIGURE 6 Vessel weight estimation
u t of two heads = B(m)xt(mm)xZOKg
From hydrocarbon processing August 1981
t FEED
t Thickness mm
L t’ ’ min of 1 l/2 x nozzle 0
GAS OUTLET
t L
HLL
S~TANDPIPE OIL EXIT NOZZLE
WATERDRAIN
FIGURE 5
3 PHASE SEPARATOR WITH WATER BOOT

TABLE 2 .
FOR GAUGING HORIZONT+L CYLXNDRICAL TANKS - FLAT ENDS . -
Cjod - Pct.ccntagc of Total Diayctcr - IdC - PcrccnLa8c of Total Capa of Tank t
of Tank
.
0.1 0.2 0.4 0.6 0.8 1.0 1.t 1.4 1.6 1.8 L.0
, L.2 (..4 /,.6 a.!. 8 3.0 3.2 3.4 3.6 3.8 ’ 4.0 4.2 4.4 6.6
. 4.8 5.0
-* 5.2
.
0.0053 0.0152 0.04L9 0.0788 0: 1tlL 0.1691
.O.LLL3 o.reoo 0. Ml9 0.4077 0.4773 6.5501 0.6~63 0.7061 0.7086 0.874L 0.9GLS ’ 0533 I . 1.1470 1. L43L 1. 3418 1.44L? 1. 5461 1.6515 1. 759d 1. e693 1.8914 2.0756
.~.2116 L. x97 L.-I497 2:57 15 L. 6951. L.&L11 2.9493 3.0771’ 3.2082 3.3408
7.6 . 3.4744 ; :. 7..8 ‘3. blot,
;’ ; 8:C! 3.7460 :’ 8) 8.L 3.8865 .
.li
./ c.4 8.6 4. X76 6.16’36
8.8 9.0 9.L 9.4 9.6 Y.8 10.0 10.2 10.4 10.6 10.8 11.0 1 l.L 11.4 11.6 11.8 IL.0 1L.L lL.4 Id.6 I/..8 13.0 13.2 13.4 S3.6 13.8 14.0 14.2 14.4 !4.6 14.8 15.0 15.L 15.4 15.6 15.8 16.0 16.C 16.~ 1C.C lb.6 17.0 Ii.2 17.d
4.3131 17.6 11.851 4.456L 17.8 1~. 046 4.6045 18.D 12. L40. 4.75L5 18. L IL.437 4.9015 18.4 . IL. 633 5.05L3 18.6. 1L. 831 5.2040 18. 0 5.3580 19.0 5.51LL 19. L 5.6690 19.4 5.0258 - 19.6 5.9848 19. 0 6. 1445 l ’ LO. 0
6.3060 6.4665 6.63~0 6. *i970 6.9630 7.1305 7 .t990 7.4680 7.6390 .7.811G 7.9840 8.1580 8.3330 8.5090 (3.6360 8. e645 9.0440 9. EL40 9.4050 9.5880 9.7710 9.3560 JO. 142 10. 32-i 10.515 10:;03 10.893 ll.O& 11.273 Jl.-I65 11.657
LO. 2 LO. 4 /,o. 6 LO. 8 Ll. 0 Ll. L Ll. 4 ~1.6 21.8 LZ.0 Lt. L ‘2.4 LL.~ LL. 8 L3 0 23. L L3.4 ~3.6 23.8 24.0 L4.L L*i. 4 ~4.6 L/r. 8 LS. 0 /.5. 5 26. i; Lb. 5 L7.0 it. 5 iE. G
13.030 l3.‘Li9 13.4L9 13.630 13.832 14.035 14.L38 14.444 14.649 14.854 15. o;jo 15.267 15.375 15.663 15.89L 16. 101 16.31~ 16.5~4 16. ‘137 16.9~9 I?. J6i 17.376
l 17.590 17.806 18. OLL’ 18. L40 18.457
L8. 5 L3.49 L9.0 24.07 L9..5 L4.65 30.0. LS.L3 30: 5’ 25.81 31‘0 d6.40 31.5 ~6.99 3.:..0 L7.5E 31.. 5 L8. 18 33.0 ~8.78 33.5 d9.30 34.0 L?. 98 34.5 30.58 35.0 31.19 35.5 31.00 36. 0 3d.41 36.5 33. OL 371. 0’ 33.63 37.5 34. LS 38.0 34.67 38. 5 35.4s 39.0 . .36. 11 39.5 36; 7’ 40. o- 37.35 40.5 3i. 9t 4J.G’ 58. 6C 41.5 39.2:
;g-; 3?. 8t 43: 0. 40.4’.
41.1; 43.5. 41.74 a14.0 42.31 44.5 43.0
10.675 * 45.0 43. 61 18.891 4’5. 5 44.2; 19.110 ~6.0 44.3 19.330 46.5 45.51 l?.S.sl 47.0 46. 11 LC. iOh 47.5 46.8 1.3.061 -:a. 0 17.4: r: 1. LLZ 4b. 5 ~8. C’ ~1.785 43.0 48. 7. LL.‘JS3 * 49.5 49.3 ZL. 923 50.0 50. f
I
.--.-.-.-em-- c’-yr-7’
------_-_-.-.--_---- 1*.:1 a*#.::, ., I(‘, .-. ;.,*r:, F. C!:r::,Ic' , /- ;;*. - DF’C 1'1 -.I_.----v.I -.-.-* --. LCI. is;:0 * Cl CL1 I;Y.lrli \Y, i 2 2 4 ': fTj ;t- .,* r G5/.9.~~~ -.-- ..-..-.-.--.--I-__..._...----.-... N '/ -,7.-y --IL.-Y-. ..-I#--.D - l~c),'~j.:'r.!-. -v--y----

Aker Engineering plc
8G
65
60
I
-_..i ..
I
I I
--- t ,
,
_.-__
c D : I
.-- : - 1. I-+ 1
., ..--. -..-- -- __-_- - --- 1 -_ - _ - ..-. 1.--.. ) I_ I
I - . - - - . - . - - __-- -
I ,
I
I ___-_ _ _ - - . . __ __.- , . . _ . r . . . - -
--
- : -_.-
, .--.- ..-.- -
-._- ‘; , ---.----
7f ., .--_ I
-I--- i ! I
I _-. -.-- I
-- .._
I
I -._._ 1 - I i -- -- I
_A---.
._- -- J- ._.. - _ _ _
I
---I I --I--
l -----
---.: /“--
__
I I I --+---i--- I I
I I +- -. i I I I
I. .A.- i
_ _. _ _
-.
-.- ---
-.- -
7 -.
0 5 10 /5 20 &‘;s’ 30 35 40 46 50 55 60 65 7b 75 60 85 so 95 Ioc
PL-&?CENTACL- OF C/h?CLE D/AMETE~

‘TOTAL PROCESS ENGINEERING DESIGN MANUAL Revision : O Page NO :
TEP/DP/EXP/SUE TRAY COLUMNS
Date : 2,85 3.1
1. APPLICABILITY
.
It is not expected that a hand calculation of a tray distillation or absbrbtion column be
performed by the engineer. For the purpose of a feasibility or pre-projecr srudy any require0
rigorous column sizing would be performed using SSI PROCESS simulator, or similar.
Should, however, a quick estimation of tower diameter and height be required one of the
most common methods of hand calculation for valve trays is the “GLITSCH METHOD”. An
example of the procedure for this method is given in Section 3.
,4 detailed mechanical design of a tray column is beyond the scope of this guide. For details
on glycol towers see package units.
2. DESCRIPTION AND NOTES
2.1. TRAYS
There are basically three types of tray used in distillation columns ; sieve, bubble cap
and valve trays. Each type has specific applications and flexibilities dependant on the
process criteria. Some of the major aspects are detailed as follows :
Bubble caps
Operation :
Capacity :
Efficiency :
Application :
Tray spacing :
Vapour passes through “risers” into the bubble cap then bubbles intc
the surrounding liquid on the tray. Bubbling action effects liquid-
vapour contact. The liquid exits the tray via outlet weir ant
downcomer arrangement to the tray below.
,Moderately high efficiency (minimum 50 %) is maintained at varying
rates due to weir maintaining liquid head.
For many years was the most common type of tray-consequentI>
many published tray efficiencies are available from vendor sources.
Note : most expensive type of tray.
All major services excepts coking, polymer formation or other higt .
fouling conditions. Ideal for use in low flow conditions where tra)
must remain flooded to maintain a vapour seal.
IS” is normal. Consider 24” to 36” for vacuum conditions.

1 . .,
TV ‘@
TdTAL- pROCESS ENGlNEERlNG DESIGN MANUAL Revision : 0. Page No :
TRAY COLUMNS TEP/DP/EXP/SUR Date 2/sr 3.2
r Sieve trays
Operation :
Capacity :
Efficiency :
Application :
Tray spacing :
With downcomers Without downcomers
Vapour rises through i/S” to I” Vapour rises through holes in
holes and bubbles through and bubbles through liquid.
liquid. liquid flows across tray Liquid head forces liquid
over weir via downcomer to countercurrent through same
tray below. holes to tray below. Flow is
generally random and does not
form continuous streams from
each hole.
As high as or higher than bubble cap trays for design rates or
down to 60 % of design. At lower rates efficiency falls and
performance is poor. Generally unacceptable to operate below 60
% capacity.
As high as bubble caps a< design capacity. Efficiency becomes
unacceptable below 60 % design capacity. Not suitable for
variable load columns.
Systems where high capacity near design rates are to be
maintained in continuous service. Handles suspended solid
particles well, flushing them down to tray below. Can be problem
to run with salting-out systems where trays run hot and dry, holes
may plug. Not recommended for oil + gas service due to poor
flexibility.
15” average, 9” to 12” accep 12” average, 9” to 18” accep
table. Use 20” KO 30” for table. Use 18” to 30” for
vacuum. vacuum.
Valve rravs/ballasr cao
Generally the same aspects as for sieve trays. Most valve trays are speciaiist
proprletry design for specific operation problems and capacities. Specialist vendors
include Clitsch, Koch (flexitray), Nutter, Union Carbide. Best choice of tray for
distillation application.
Tray layouts
Not only may the type of bubble cap/valve/sieve hole be specified for a particular
design but also the tray hydraulics C. liquid path. Common arrangements are shown
in Figure 1.

^ “ -
rOTAL PROCESS ENGINEERING DESIGN MANUAL Revision : o Page No :
TEP/DP/EXJ’/SUR TRAY COLUMNS
Dale : 2185 3.3
Trav efficiencies
General tray efficiencies to use : t
Absorbers Strioping
Hydrocarbon oils + vapour 35-50 % Hydrocarbon oils + vapour 5C-8C b
Amine units 15-20 % (Amine towers usually have 23 actual
Distillation columns GO-80 % trays)
2.2. CONDENSERS
. Condensers are usually installed on the overhead of fractionation towers to
recover liquid product and provide internal tower reflux. Design of condensers is
covered in shell + tube exchanger section. 1
. Basically two types of overhead condenser exist, partial and total. When using a
total condenser the heat load is equal to the latent heat of the saturated overhead
vapour. The resultant, bubble point liquid is split with some returning as reflux and
the remaining portion as distillate product.
For a partial condenser the vapour withdrawn from the accumulator is In
equilibrrum with the returning reflux and consequently the condenser is acting as
an “external” additional tray. The vapour is normally withdrawn under pressure
control with all or part of the liquid returning as reflux to the column.
2.3. REBOILERS
. Generally three types of reboiler exist for light hydrocarbon fractionators.
internal reboiler thermosyphons
external “kettle” type
external “heat exchanger” type furnace, electrical
In most cases the “heat exchanger” type is preferred for efficiency.
. The heat exchanger should be located 2-3 m below the exist nozzle from the
column so that sufficient head is available for thermal circulation.
. Reboilers may be heated by direct fire, electrical coil, steam, closed heating
medium or process fluid exchange.
. Values of ti overall (incl. fouling factor) for various types of reboiler and desrgr
methods are given in the heat exchanger design guides.

TEP/DP/EXP/SUR
3. CALCULATIONS
TRAY COLUMNS Date : 2f85 3.4
See following pages : 3.5 to 3.11
4. REFERENCES AND USEFUL LITERATURE
4.1. Distillation
Part I : Distillation Process Performance
Part 2 :
LUDWIG VOL II - CHAPTER 8
Hydrocarbons Absorption + stripping
Parr 3 : Mechanical Designs for Performance
4.2. Absorption and fractionation fundementals CAMPBELL VOL I - CHAPTER 13
4.3. Gas liquid systems PERRY - CHAPTER 18
4.4. Thermosyphon reboiler piping design W.F. ABBOTT MOBIL 1
- Hydrocarbon Pr. March 1982
siq---- PROCESS ENGINEERING DESIGN MANUAL Revision : 0 Page No :
TRAY TYPES BY LlQUlO PATHS
FIG. 1

No :
3.4
HS
TRAY CALCULATlON DATA SHEET
Column item: ?> Zo(6
Tray number: 8
I. VAPOR TO TRAY
Number-of passes: 2
kg/h / MW ) kmol/h 1 k PC
I I
I I
m = 13-n ‘C
T,. = t, + 273 =. 2.86.1+ K
308.7 K T, = tc + 273 =
T, = 1-1 L 0.522 Tc
P = 23-6 ATM. abs
PC = 4842 ATM. abs
P, = p t 0~S-f PC
Then Z = O-637 \
Vapor density
Dv = 12.03x kfw x P (atm) = 12.03 x 31.4 x 27.6 z x TV (‘K)
5: I- - i- ‘-
3.63;LI x 286.(3 -.
= 53.806 =
t , - * .., ,
Vapor actual rate
c, = kg/h = 16%%0 =
Dv 53.806
kg/m3
m3/h
Sheet 1 of 4
RIU PROCESS CALCULATION SHEET
TOTAL ITEY :
mE0 TRAY COLUMNS t%4fvu TEP/DU’/DtPf EXPf SUR
NO :
&BY CHK DATE 1 JO8 TITLE : JOB N* : REV
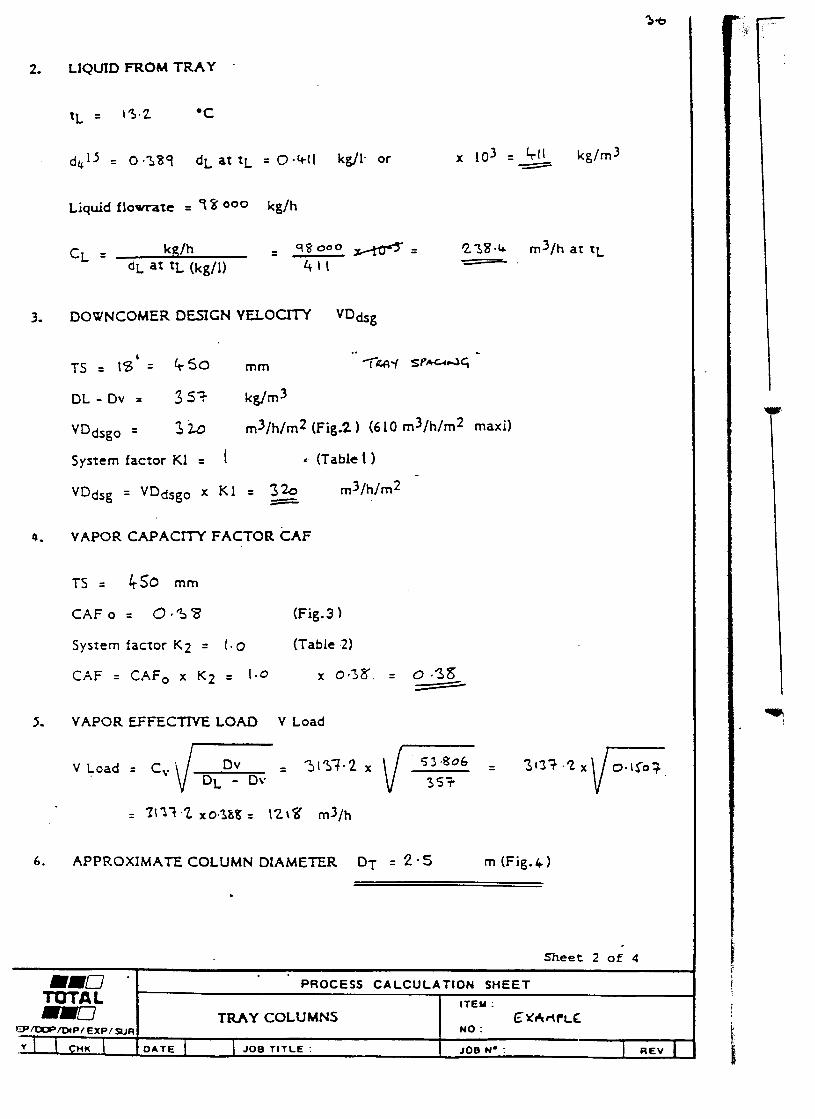
2. LIQUID FROM TRAY
tL = 13.2 l C
d@lj = Oe38q dL at tL = O-411 kg/l- or
Liquid flowate = 7 b ooo kg/h
CL = kg/h = 98000 @ =
dL at tL (kg/l) 41i
3. DOWNCOMER DESIGN VElOcrrY “hsg
x IO3 =t” kg/m3
238.4 m3/h at tL -.
. . TS = 1%’ = 650 mm Tiiy SPerJc, -
DL - Dv = 3.9 kg/m3
VDdsgo = 3io mJ/h/mz (Fig.2 ) (610 mJ/h/mZ maxi)
System factor Kl = 1 d (Tabie \ )
“Ddsg = “Ddsgo x KI = 32 mJ/h/m 2
4, VAPOR CAPACW FACTOR CAF
TS = 4SO mm
CAF o = 0*‘58 (Fig. 3 1
System factor K2 = l.0 (Table ,2)
CAF = CAF, x K2 = 1.0 x 0.38. = 0 a38 -
5. VAPOR EFFECTIVE LOAD V Load
6. APPROXIMATE COLUMN DIAMETER DT = 2.5 m (Fig.41
.
Sheet 2 of 4
mu0 * . .
PROCESS CALCULATION SHEET TOTAL no ITEY :
TRAY COLUMNS EXA4CLC ~~fllwf EXPf SUA NO : 7 CHU DATE JO8 TITLE : Jo8 N* : REV

3.2.
a. H
COLUMN HEKHTESTIMATION
Ql
: See design details on vertical vapour-liquid separators.
Minimum distance for,Hl will. be one tray spacing. Minimum distance between
inlet nozzle and to tray 300 m.
Selected HI = 600 mm
HZ : tray spacing x (number of actual trays - 1)
No actual trays = theoretical trays/ 7
for ?
see section 2.1 = 56%
Actual trays = l6 fzs-rr ti&-rC
b. H2:
Note : if the column diameter changes over the length, the transition piece will be
h, = r z(01 - 02) long and HZ will increase by this amount 2
Selected HZ = 6 ?SO mm
Sheet 3 of 4
mm2 PROCESS’ CALCULATION SHEET
TOTAL ITEM :
mHl TRAYCOLUMNS EZ(G4QLE EP~WP/DIPIEXP/~SUR
NO :
BY CHU DATE JO8 TITLE : JO8 No REV /

c. H3:
H3 = hl + h2
hl = tray spacing x 2 = Qao *m .
h2 - see vertical separator sizing = h6 + h7 + h8
h6 = hold up time volume
For production flowing to :
. another column t = 15 min
. storage 2
I a furnace 10
. another unit 5
. reboiler/heat exch. 5 .
h6 = 2000 h7 = coo h8 = ‘500
H3 = hl + h2 = 3-0 mm
Selected H3 = 3Wo mm
TOTAL COLUMN HEIGHT = Hl + HZ + Ii3 = 6750 mm
Sheet 4 of 4
roTAL
P/DoefuP/uP/mm
PROCESS CALCULATION SHEET
TRAY COLU: ;Us ITEM : cuT+fLc
MO:
Ser
,X0:
Flo
IV0
He
Set
SE
ii
F
tv
t-
s

PROCESS ENGINEERING DESIGN MANUAL Revision : Page .No
TEP/DP/EXP/SUR TRAY COLUMNS
TABLE 1
Date : 2/85 3.9
SYSTEM FACTORS l
jewiCe System Factor
\ion foaming, regular systems . . . . . . . . . . . . . -- . . . . . . ..I.~.................~.........~...~.... 1.00
Fluorine systems, e.g., BF3, Freon . . . . . . . . . . . . . ..-.......-..........-.-................... 0.9
Moderate foaming, e.g., oil absorbers, amine and glycol regenerators...... .85
*eavy foaming, e.g., amine and glycol absorbers . . . . . ..-.......I-.................. .73
Severe foaming, e.g., MEK units . . . . . . . . . . . . . . . . . . . . . . . . . . . . ..-.....................-...... .60
Foam-stable systems, e.g., caustic regenerators . . . . . ..-......-.-............-....... -30
I 1
TABLE 2
SYSTEM FACTORS
Service System Factor
Non foaming, regular systems .............................................................. 1.00
Fluorine systems, e.g., BF3, Freon ........................................................ 0.9
Moderate foaming, e.g., oil absorbers, amine and glycol regenerators ...... .85
Heavy foaming, e.g., amine and glycol absorbers ................................... -73
Severe foaming, e.g., MEK units ........................................................... -60
Foam-stable systems, e.g., caustic regenerators ..................................... -60
TABLE 3
Column diameter mm 1Minimum recommended Tray spacing : 75 mm
0 < 1 200 450
1 200 < 0 < 2 500 600
2 500 < 0 < 4 200 700
0 > 4 200 ’ 950

TOTAL PROCESS ENGINEERING DESIGN MANUAL Revision : 0 Page No :
TRAY COLITIS
TEP/DP/EXP/SUR
CAF,
c
I -
-
-
-
-
-
-
-
-
Fiq. 7 FLOOD CAPLCITV OF IALLAST TRAYi

No :
10
-
-
-
PROCESS ENGlNEERtNG DESIGN MANUAL newwon : w rage No :-
- -
-Ep/DP/EXP/SUR
TRAY ~~LwQIS Date : 2/85 3.11
Fl9. tauLAsr TR*v DIAMETER (FOR APPROXIMATION PURPOSES ONLY)
” LO40 m’*m
.
3000-
BASE TS = coo - FF I IO\
2500 -
lrl’,b Ll0Ul0
- 100
- 750
- 700
- 650
- 600
- Is0
- so0
- AS0
- A00
- as0
- 100
- 2so
- 200
- 'SO
c 100
- so
-0

OTAL PROCESS ENGINEERdNG DESIGN MANUAL Revision : 0 Page NO :
TEP/DP/EXP/SUR PACKED TOWERS
Date : 2m 3.12
1. APPLICABILITY
FEASIBILITY STUDY : PRE-PROJECT
Under normal circumstences the design of a packed tower would be detailed by a vendo
based on process data supplied by the engineer. The detailed design of packed towers i
complex and requires specific information regarding both packing type and size and mas
transfer data for the fluids contacted.
For the purpose of this design guide details are given on the general arrangement of packet
towers, various types of packing and loading and pressure drop correlations.
The determination of the height of a packed tower should be evaluated by a vendor o
determined by the engineer if required using methods outlined in design literature (set
references). A detailed description. is beyond the scope of this guide and is normall:
unnecessary for feasibility and pre-project level.
2. PACKED TOWER DESCRIPTION + NOTES
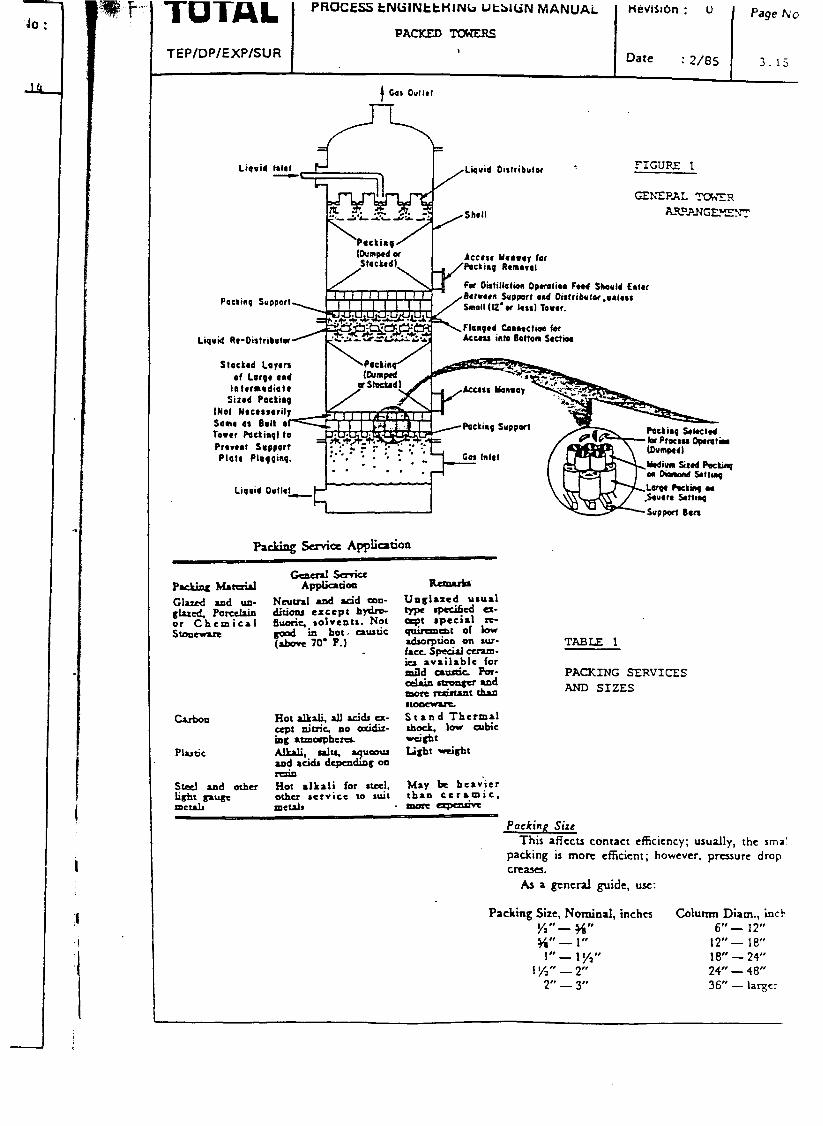
A general arrangement of a packed tower is shown in Figure 1.
Packing
The correct selection of a tower packing will normally be made by the vendor based on th
required process, flowrates and pressure drops stated. Details on packing are given in :
Table 1 - Packing service applications.
NOTES AND GUIDELINES
. Carbon steel towers may be lined for corrosive service with rubber, plastic or brie
depending on the nature of the fluids being processed and the temperatures encountered.
. Towers are generally loaded by dumping the packing rather than stacking. Stacking is mor
expensive and gives inferior liquid distribution but smaller pressure drop. Certain packin
types will be stacked at vendor request.
Pat
15-
co1
GOI
wit
tov
, Lit
ant
In
do
en
Fc
pa
i)
II
‘*lu I\
V

! Nc
3.i
‘enc
‘en
m;
ack
for
! (5
mal
In tl
brrc
td.
mor
ckin
TEP./DP/EXP/SUR I
PACKEDTOWERS
&AL / PROCESS ENGINEERING DESIGN MANUAL
1
Packing heights per support plate/grid should not exceed 12’ (3.6 m) for Raschig rings of
15-21)’ (4.5 - 6 m) for other packing types. Individual bed heights are normally limited to t;
column diameters or 6 m maximum.
Good liquid distribution over the packing is necessary to promote adequate phase contact
within the bed. The streams of liquid should enter the bed on 3” - 6” square centres for small
towers with D < 36”. For larger towers the number of streams should not be less than (D/6)2.
Liquid redistributors should be installed after approx. 3 tower diameters for Raschig rings
and 5-10 diameters for other packing types. Redistributors are not generally required for
stacked packing as the downward liquid flow is vertical.
In order to reduce ceramic and&carbon packing breakage occuring during flow surges hold-
down or floating bed limiters are installed on top of the packing. The limiter must be heavy
enough to hold down the bed and be able to resettle as the bed moves.
For ,plastic or metal packing the bed limiter is bolted in place and does not rest on the
packing.
Packed towers are not recommended for dirty service fluids nor for glycol dehydration.
Packed tower should be considered in preference to tray towers for :
i) small columns with 0 < i ft
ii) acids or corrosive liquids
iii) highly foaming liquids
iv) low hold up times
v) low pressure drop requirement

4. REFERENCES A&D USEFUL LITERATURE
4.1 Applied Process Design for chemical +
Petrochemical plants - VOL II pp 129-239
LUDWIG
4.2 Design Information for Packed Towers NORTON Co.
Bulletin. DC- IL
4.3 Tower Packings
Packed Tower Internals
Hy-Pack
Bulletin TP-78 *I
Interlox saddles
TA-80R ”
MY-40 1,
CI-78
. 4.4 Design Techniques for sizing - John S;- ECKERT
Packed Towers Chem. Eng. Process Sept. 1961 VOL 57
4.5 No mystery in packed bed Design John S. ECKERT
Oil and Gas Journal Aug. 24 1970
4.6 Calculator Program for Designing
Packed Towers
V.I. PANCUSKA
Chem. Eng. May 5 1980
4.7 Packed column Design on a Pocket
Calculator
T.J. HIXSON
Chem. Eng. Feb. 6 1984
4.8 Packed Columns Perry Chemical Eng. Handbook
pp 18.19 + 18.47
., . . . .I
f&CESS ENGINEERJNG DESIGN MANUAL Revision : Page No : 0
TEP/DP/EXP/SUR fRAY COLUMNS Date : 9r/a5 3 11
dc ,F-. TOTAL 1 PROCESS tNGINttHINb UtSlCiN MANUAL
I nevlrron : u
I Page &‘o
Liquid hh( -rJ
TEP/DP/EXP/SUR Date : 2185 3.15
FIGURE 1
Pockirq Support
Liquid RvDirMibrtaf Flonq0d towrc~ioa for
in!0 BoUon frctim
Stocked Layers of Lorq8 and
(a trrmrdiai0 Simd Pockiaq
(Not Nrcers#ril Sam 0, Balk 0 ~kctinq Suppor( aq--=- P0cLirq Sohct0d
br Procwa opfi(ti loumM0
Packing Suvia Appliation
Puk& h&Ad Glazed and un- Ncuual axd acid mu- glaed. Ponxhin Or Chemical
didofu except hybP
stasennz %WJ~ 0olvcntr. Not
m hoc, ausuc (&me 70’ P.)
ucnurb
Uoglsxcd usual rypspeikda- aept rpcci81 re- qnircnlmt of bow acLsorpcion on sur- face. special ccnm- icr available for mild curtie Par- zzy*
a1oDcwuc.
St an d Thcrmrl rho& low cubic weigh
light weight
TABLE 1
PACKING SERVICES AND SIZES
Packing Sire This affects contact efiicicncy; usually, the rma’
packing is more efficient; however, pressure drop
ClY.aSU.
As a gmeral guide, use:
Packing Size. Nominal, inches Column Diam., inch ** - 34”
$# _ 1” 6 I, - 12”
12” - 18” 1 ,, - 1%” 18” - 24”
1%” - 2” 24” - 48“ 2 ,, - 3” 36” - larger

TOTAL PROCESS ENGINEERING DESIGN MANUAL Revision : 0 Paw No :
PACKED -RS
TEP/DP/EXP/SUR Date : 2/85 3.16
3.0 i Design Techniques for Sizing Packed Towers Reproduced from NORTON 'resign Information for Packed Towers ' Bulletin DC-11
100 . . ..- _ .
GBEWLEDPRESSUREDAOCI’ .
002 0.04 06 0.1 02 0.4 0.6 1.0 2.0 4.0 6.0
t-/E--
Packing Factors (DUMPED PACKING)
Nominal Packing Size (Inches) Packing Type Mat’l.
‘/r lt6 ‘A Va ‘A loril 1% 11/i 2or12 3 3’/ior#3
Hy-PakTU Metal 43 18 15
Super Intalox’ Saddles Ceramic 60 30
sutydfdlrl:,lox Plastic 33 21 16
Pall Rings Plastic 97 52 ( 40 24 16
Pail Rings Metal I 70 48 33 20 16
lntalox*Saddles I Ceramic 725 330 200 145 92 52 40 22
Raschig Rings Ceramic ’ 1600 1000 580 380 255 155 125 95 65 37
Raschig Rings 5/32” metal 700 390 300 170 155 115
Raschlg Rings ‘/6’ metal 410 290 220 137 -----I 110 83 57 32
8erl Saddles’ Ceramic 900 240 1 170 110 65 45
P8Ckllle fWtO’t% det.“lW,ed rtt,, J” JWrJtJl SfltJ”l In M’ 1.0. t-r. ‘OJtJ by LJ”J
--
7 L 1. Tc
tr a1 ba
1
2. * P J
IC (a d h J
n c s c C
i t I I ‘ I
I
I
/
i
3

1 TEP/DP/EXP/SUR ‘I TOTAL PROCESS ENGlNEERlNG DESlGN MANUAL Revision : 0 Page No :
PACKED T-95
Date : z/es 3.17
1. To design a packed Wr. fiat it is necessary to know tha JmOUnt Of lipuld or gJs IO ba handI& JtId from thas determme the liquid-gas nuo (L/G). The Oensrt~es of bath liauid and ftas should be known and the term --- K f - L is ,I akulatad. tncn the JblOSY. x = - -
L v- G R 2. After alculatlng the value of X consult the gcnerahred
pesurc drop correlation l oove. It knfl be noteo mat there are a series of marked parameters rangmg from 0.05 to 1.5 jnchcs of water pressure drop per foot of Pachcd death (4 to 125 mm of rater pressure amp per meter of packed dCDth). Normally. a packed twer should be deslgoed to 00emte at J mammum economrcal pressure Omp. The du:gn l ngt- ner must determme the but balance between hagher apical uwestment vs. lower ooentmg costs for low pm- sure drop twen. and low apttrl mvestment vl. hrgher opentmg cysts for tmven oocrrhng at htgher pressure amp. Ordinanlyy. packed towers are not ownted aowe 1.0 men of water prawn dmp per foot of packed depth (83 mm of water pressure drop 0er meter of packed depth). Htgher pressure drops are poiuble wfren mstfumentatfon IS such as to matntmn a constant prarun amp. Most ab sorben and regenerators are bes~gned for lw pressure drop ooeratron. l.c.. somewhere ktwcen 020 and 0.60 inches of water prcuure dmp per foot of packed depth (17 and 50 mm of water pressure drop per meter of packed depth). Atmospheric or pressure disMaUons art dcugnd for prurun dmps of 0.50 to 1.0 mcha of water pressure amp per foot of pcked depth (42 mm to 63 mm of water pressure amp per meter of packed depth). Vacuum dlStil- labons run the complete nnge of pressure drop and are-
. dependent on what is t0 De accomphshed and whether me va&um is solefy for impmved seoantlon or whether It ts to reduce tempenture of repantron to trnorove pdua qualiiy. The ducgner should keep in mmd that the pressure dmo parameters shown on the generalized pressure am0 car- rdauon are m Inches of rater (mm of water). Therefore. when oargnmg columns operatrng mth other lioutds. SW oal consldentron should be grnn. apeaally *men the specific gnnty of the liquid is substantially ICSS than that of water. For example. an rbsoorbcr handhng a hyOrour0On wrth a specffic gravrty of 0.5 wtll uhtbrt the propen~es of a t0wer rrth a hold-up volume corresponding to a pmsure drop l poroxrmatefy 80% greater man that for whfch It uas dacgne4.
. After havmg determined the value of X as me abscfssa fn Step 1. and selected an aperatmg pressore drop m Step 2. the value of the ordmate. Y. may be determuwd by the use of the genmlrxed pressure dmo cornWon. Locate the value of me l bsassa on thrs chart: move vertralfy untff the pmper pressure drop prrameter 8s contacted: then move honxontalfy fmm thts pomc to the left hand edge of the chart and read the value of me ordmate. Make the value 4ual to thus group of vanaWe: -
y- CG’FVO-’
- EG?--RI
1. Then G =
The value of all variables 6 known except for the WsCoslty of the Ilqutd. the packmg factor f and the gas t-ate c. The viscosity of the hqu~d can be detemlned from htenture. experiment or l pproxrmatton. The packmg factors Of alI SUes of packmg are gtven tn the table on page 4. grOad(y Speaking. packings smaller than 1 rnth SlZe Jre Intended for tuweo one foot or smaller tn diameter. packrngr 1 mch Or 1% mch m saze for tower over one foot to three feet (0.3 to 0.9 meters) rn drameter and 2 or 3 inch PaCkrngS are used for towen three or more feet (0.9 mere-l In okam-
I l ter. The destgner should select the omoer srze of PJChW. ! and therefore the pt-ooer pacfung factor rn trhr lust
I
CaICUlatlOn.
5. NOW thal ail vanaCMes have assigned values. G may be CJkulattd and the tyaamecer of the tower aetermlneo Oy
I
using the equation:
WhcrcAZ c’iotal Ibs./sec.
c Ibs./tq. tt.mc. JS aetemvn~ from Step 4.
Thcs establishes the dlrmeter of the torcr rhl~h; when filled wth the -clung sekcted ana oDerated at oeragn kqudana gas rates. rnll develoo the seecua Dressure amp
6. The Qepth of the bed requfred -ill be deoenoent “00” the, l ppmach to total mass transfer reaurreo with 1OOy mass, transfer rncow8uiiy nqumng a bea of rnfmrte deptn.8 Therefore tow-a0 are ahays desqned to 00erate at I~SS. than total mass transfer. In gas J0~0rpt10n Dmbkms. the, bed is usually alculated from the mass transfer CD-. effioenti
I N
)(r;J = t-i A I’ A YLM
because the drive IS from the gas to me hqurd phase. Or if a sttipping operatton 8s mvolvea then me mars tmnS. fer co-cffioent becomes:
N Kra =
HAAXU because the Qnve IS imm the liaufd to the gaS phase. The defin8bons of me terms for the r0ovc cquatfons for X.4 and Kra are as follows: Kd = Mass transfer CD-•ffioent lb. mola/ft.S Hr. Atm. k. = Mass tmnsfer co4fioent lb. moru/ft.J Mr. N = Lb. rnolc~ tnnsferred/Hr. H = Packed depth of tower paclung. ft. A = Tolm truss suxronal area. ft.2 P = System pmure. atmospheres Y, = Gas phase mole fracbon. component I Ye’ = Gas phase mole tractton of component i rn
ecyutlibnum rnth kqutd bulk phase mole fractfon of ccfmpanent i. XI
X, = Liquid phase mole fnctton, cOmPonent I X,’ = Liquid phase mole fnctton of component I rn
equilibrium rcth gas bulk phase mole fnctlon of camponent i. Y,
For cwnterturrent gas-liquid flow
AyLy = ’ (YieY;‘)2-(Yi-Y,‘)1
La [ (Vi ‘Yi32 / (vu *Yi’)l 1 where the subscripts 1 and. 2 refer to the top and bottom of the cOfumn rapectrvely. The equatfon of AX” IS l nafogouS to the equation for AYL. gfven above. La and Kra data are l vadable for most l bsorptron ana stnppng ooentmnr. 8eausa the data on absorption of CO, wth caustic soda solutfon are So complete for me various packmgs. it is not at all unusual to use the data as a ntto mformahon source for aesrgn wrth other packmgs and other rites than those for whrch dwrct rnformatron l xrst.s. Distillrtton umts are generally desrgnea an the basts of HEW (hcrght equrvalent to a thcoretfal plate).’ Hundreds of 01st1b Won l xDenmental studfa have caused US to conclude mat the pmpMws of a system have little to do wth the HETP value. pmviOtd that good dfstnbutfon IS marntarncd and the packed bed IS operated wth pressure amPs of at kast 0.20 mches of water pressure drop per foot of packed depth (17 mm of water prasure drop per meter of oackecl depth). Mass tnnlfer taking place rn packed beds. where any ~uO~tant~al amount Of pressure drop exrstS. wfll occur predommatcty IS a result of turbulent contact of gas and IWJI~ nther than as a offfustonal operatfon governed by film resistances at the mterlace. Once the total bed depth has been detcrmlned. the death of rnd~~dual beUs must be estabhshed. Gcneralty. ~nd~~dual bed defxh 1s held to l tght column etameters or 20 ft.. l nhougn under CeRam conditions 30 ft. Oeos are Mnnrssrblc. Prooer to-3 mternals are re~uwed to real~re me full poccn- bal of the pachmg rn any l pphcatron. (See cng8nnrrng manual TAbOR.)
I

TEP/DP/EXP/SUR
, PROCESS ENGINEERING DESIGN MANUAL Revision :
I Date : Z/85
Page No :
il, HEAT EXCHANGERS

TOTAL PROCESS ENGINEERtNG OESlGN MANUAL Revision : o Page No :
TEP/DPIEXP/SUR SHELL AND TUBE EXCHANGERS Date .: yss 4.1
1. APPLICABILITY
It is not expected that a hand calculation of shell and tube exchangers be performed by the
engineer. For the purpose of a feasibility or pre-project study any required rigo,rou!
calculation would be performed using computer programs HTRI or HTFS.
A quick estimation of heat exchange area, sheil diameter and tube length should be done by
hand calculation. An example of the procedure is given in Section 3.
A detailed mechanical design is beyond the scope of this guide.
2, DESCRIPTION AND NOTES
2.1. DESCRIPTION
The flow of fluids inside the exchanger varies according to requirements and can be
single or multi-pass on either tube or shell side. Figure 1 shows the types of tubu,,.
heat exchanger manufactured to TEMA standards ;
The following types are frequently found :
- Exchangers (Heaters) - Condensers
- Reboilers (Thermosyphon or forced circulation)
- Evaporators (Kettle) - Chillers (using refrigerants)
2.2. SELECTION OF SHELL OR TUBE SIDE FOR THE FLUIDS
a. Tube side :
- &Most of time highest pressure fluid - Cooling water, steam
- Fouling or corrosive fluid
- Sea water (it is always recommanded to install the sea water on tube side)
b. Shell side :
- Fluid with the highest viscosity
- Evaporation (refrigerants in chiller)
- Most of time lowest pressure fluid
- Condensation
- Least fouling fluid
2.3. SELECTION OF TUBES
. Standard length : 12’, 16’, 20’ but longer tube lengths are possible (upto 40’)
. Diameter commonly used : 3/4”, I”
. Pitch commonly used : triangular or square. External tube cleaning is possible
with squarepitch only.
2.4. TUBE SIDE VELOCITIES
. The tube. side velocity for most materials and services should be held between . about 1.3 to 2.5 m/s.
. Below I to 1.2 m/s fouling will be excessive, much above 2.3 m/s erosior. can
become a problem.
Tf -

jge No
ZI by tt-
rigqrol
done b
1 can b
tubui,
de)
possible
berween
PROCESS ENGlNEERfNG DESIGN MANUAL I Revision : 0 I Page No :
TEP/DP/EXP/SUR SHELL AND TUBE EXCHANGERS
Date : 2f85 4.2
2.5. CHARACTERISTICS OF TUBES
BWG = BIRMINGHAM WIRE GAGE
’ External ’ I
I
AREA (m2/m) diameter
Internal 1 SECTION ! i WEICh
I (
f BWC, in et mm) 1
I THI;C$..lESS ; , diameter
I I km) 1 (cm2) i External 1 Internal f (kg’m
l/2 in I 14 1 I (12.7 mm) I 16 I
f * I 18 I
I 10 I I (19%‘: Zrn) 1 :t j I
I I 16 I
1 I I8 I
1 in I 10 I I (25.4 mm) I 12 I
! I 14 I I 16 I
I I
I. i l8 I
11/4 in I 10 I I (31.75 mm) 1 it I
! I 16 I I I 18 I
I ll/tin I 10 1 1 (38.1 mm) 1 :t 1
I 16 I I 18 I
2.10 1.65 1.24
3.40 2.77 2.10 1.65 1.24
3.40 2.77 2.10 1.65 1.24
3.40 2.77 2.10 1.65 1.24
3.40 2.77 2.10 1.65 1.24
1 0.848 1 0.565 I I 0.0399 I I 0.0266 I I 0.6OC I 0.940 I 0.694 I I 0.0295 I 0.49C I 1.021 I 0.819 I I 0.0321 I 0.384
f 1.224 ! 1.177 t I 0.0598 1 I 0.0384 I I 1.436 I 1.351 I 1.434 I 1 0.0424 I 1.216 I 1.483 I 1.727 1 1 0.0466 I 0.96: i 1.575 I 1.656
I 1.859 I 1.986 I 2.118 I 2.210
I 2-2v1 1 2.494 I 2.616 I 2.743 I 2.845
1.948 2.154
2.714 3.098 3.523 3,836 4.122
4.885 5.375 5.909 6.357
I ) 0.0798
f
I
I 0.0997
0.0495 0.0520
0.0584 0.0624 0.0665 0.0694 0.0720
0.0783 0.0822 0.862
0.0894
0.774 0.597
2.024 1.696 1.324 1.057 0.811
2.604 2.158 1.682 1.34c
I 2.921 ; 6.701 1 I 0.0918 I 1.024
1 3.124 1 7.665 1 0.1197 1 0.0981 f 3.18’ I 3.251 I 8.300 I I 0.1021 I 2.63; I 3.378 I 8.962 I I 0.1061 I 2.035 I 3.480 I 9.512 I I 0.1093 I 1.62: I 3.556 I 9.931 1 ! 0.1171 I 1.237
2.6. TEMPERATUREAPPROACHANDPINCH
. minimum temperature approach 5 “C.
. minimum pinch for condenser or chiller 3 “C.
2.7. DESIGN MARGIN
. 10 % on area is recommended.
2.8. PRESSURE DROP
. Allowable n P varies with the total system pressure and the phase of fluid.
. Liquid pressure drops of 0.7 to 1.0 bar per exchanger are common. Th
equivalent gas drop is about 0.2 to 0.5 bar.
. Some exchangers have low pressure losses and as reboiler and condenser (les
than 0.1 bar) especially those in vacuum system.
-

TOTAL PROCESS ENGINEERING DESIGN MANUAL Revision : o Page No :
TEP/DP/EXP/SUR SHELL AND TUBE EXCHANGERS Date : 2/85 4.3
2.9. CHOICE OF HEAT EXCHANGER TYPE (Figure 1)
a. Front end stationary head types
. Type A : Used for frequent tube side cleaning due to the ease of dismantling
the cover.
. Type B : Cheaper than Type A but the dismantling of the bonnet is morf
difficult. To be used for clean products.
. Type C : Cheaper than Type A for low pressure. The price increases quick11
with the pressure. This type is practically never used.
. Type D : Special for high pressure P > 200 bar.
b. Shell types
. Type E : In general the most commonly used.
. Type F : . Advantage : Fluids flow at perfect counter current (F = I).
. Disadvantage : - leakage between the longitudial baffle and shel.
-decreases in value.
- mechanical problems from expansion.
- low pressure drop eg : < 1 bar (risk of damage
of the longitudinal baffle).
This type will be used only to avoid a great number of Type E shells in series.
. Type G & H : Used for low AP = 50 mbar as for thermosyphon reboiler.
Vertical baffles are not installed for these types and due to thal
the length of the shell must be limited.
. Type J : Used for high flow or high A P for Type E and also sometimes or
condensates to avoid the use of vapor belt.
. Type K : Used for vapor separation is required ie chiller, some reboilers...
c. Rear end, head types
. Types L, M and N : Fixed tube sheet, used for clean fluid on shell side and fol
low AT < 30 “C. If A T > 30 ‘C use other head types or install an expansior
joint cn the shell.
Type L and N will be used for dirty fluid on tube side. For the other cases the
type M will be used it is the cheapest.
. Type P : Generally not used.
. Type 5: Used very frequently, no restrictions.
. Type T : For frequent dismantling, expensive, shell diameter larger than typt
5 for same number of tubes generally not used.
. Type U : For clean fluids on tubeside no other resrrictions, low cost.
. Type ‘7.’ : Generally not used.
d. Conclusion
The most frequently used types are : BES, BEW, AES, BEM, divided flow, BEU.

-
Page No :
imantlint
is more
s quick11
IL
and shell
’ damage
ies.
-.
e to thal
times on
rs...
e and for
expansion
cases the
than type
TEP/DP/EXP/SUR
w
A
B
C
N
-
D
-
PROCESS ENGINEERING DESIGN MANUAL I Rdvision : 0
I ~-Page-Nay-r
I SHEU AND TUBE EXCHANGERS \
Date : 2/85 4.4.
~~~~ ,.xchonger nommtclatura
FIGURE 1
sONNO IINWL COVER1
CHANNEL INTKiML WlTti TUI SlitIT AND RWVA8lt COVtl
-k .+ C+t*NNEL tNTCCPA1 wITI4 TUf WFn AND PEMOVAIlE COVE
SPKIAL WCti mESURE CLOSL
E
F
G
H
J
K
ONE PUS MU
w-----i TWO PAS WELL
WITM 1OtGllUMNU Mffl.E
D--,----,- DoualESNl FlOw
/I MVIDED flOW
1 aoss FLOW
, _
1 -
I
-.
BEU.

ITEM : 1 I I VALUE NOTES : i
i 1 0.5 s IC
G f Indicate temperatures’ I DUTY Q (2) 1 kcal/hr
HOT FLUID 1 Inlet temperature T 1 “C @>b Outlet temperature T2 I ‘C I “-3
I COLD FLUID 1 Inlet temperature t 1 t “C I rS Outlet temperature t2 I “C I 26
Tl - t2
T2 - tl
LMTD (1)
t2 - tl
Ti - rl
Tl-T2 .
p - t2- tl Ti-tl
R=Tl-T2 t2 - tl
I I I
i I i I
F = LMTD correction factor (2)
I Fig. 2
I
Number of shell passes (3) I , Fig. 2
Number of tube passes k I i HEAT TRANSFER COEFF. U 1 kcal/hr I
I m2 ‘C I - 4oo I including fouling I I factor i
I I I
I HEAT TRANSFER AREA I
1; -I I I
A=2 I m2 1 C?S I lr=o*q5 I
U.F.LMTD I I I I
ESTIMATED TUBE LENGTH 1 FT I :c ( -0,)
I ‘Sfq’ u +a* p’dh
1 ESTIMATED SHELL DIAM
I ins
I , id f3.4 - i cso t-k5
t
ESTIMATED WEIGHT Bundle\ tonnes I 2.76 I I EZCA*o~Cf- Yw? I ficr, I
I Shell I tonnes I 5. IS I I
l Total 1 tonnes 1 s . I
I I
PROCESS CALCULATION SHEET
TUTAL ITEM : 6cz pL‘sc;c-; SHELL AND TUE3E HUT EXCHANGER
NO : EPl~mlP/ EXPlSUA E: ~23C
CM% I DATE 14lU \ JOB TITLE : Fr3 Cih4cA~ JOE N= . E y.\.wL: REV IY

/I TOTAL TEP/DP/EXP/SUR r,
PROCESS ENGINEERING DESlGN MANUAL
SHELL AND TUBE EXCHANGERS
(I) Use following formula
L,MTJ-J = (T2 - ti) - (Ti - t2) Ln T2 - tl
Tl-t2
LMTD = (Tl - t2) - (T2 - tl)
Ln Tl - t2 T2 - tl
ifT2-tl>Tl-t2
if Tl- t2 > TZ - tl
Remark : If the heat exchange curves are not linear the LMTD should be determined step
by step with the linearisation of the curves and with the ponderation of the
partial LMTD by the panial duty on each linear step.
(2) For total condensing
In this case calculate the heat transfer area for each zone, the T*irn of these areas is the
surface for the exchanger.
(3) See LMTD correction factor (Figures 2) .
the number of shell and tubes passes should be chosen in order to have 1 < F < 0.8
If F < 0.8 add shells (2 exchangers in series)
(4)-See Section 5 shell and tube heat transfer.
4. ESTIMATION OF SHELL DIAMETER
With the heat transfer area, selected tubes size, pitch, tubes length it is possible to
determine the number of tubes and with tabje 1 or 2 hereafter the approximate shell
diameter.
Take maximum shell diameter about 60 inches.
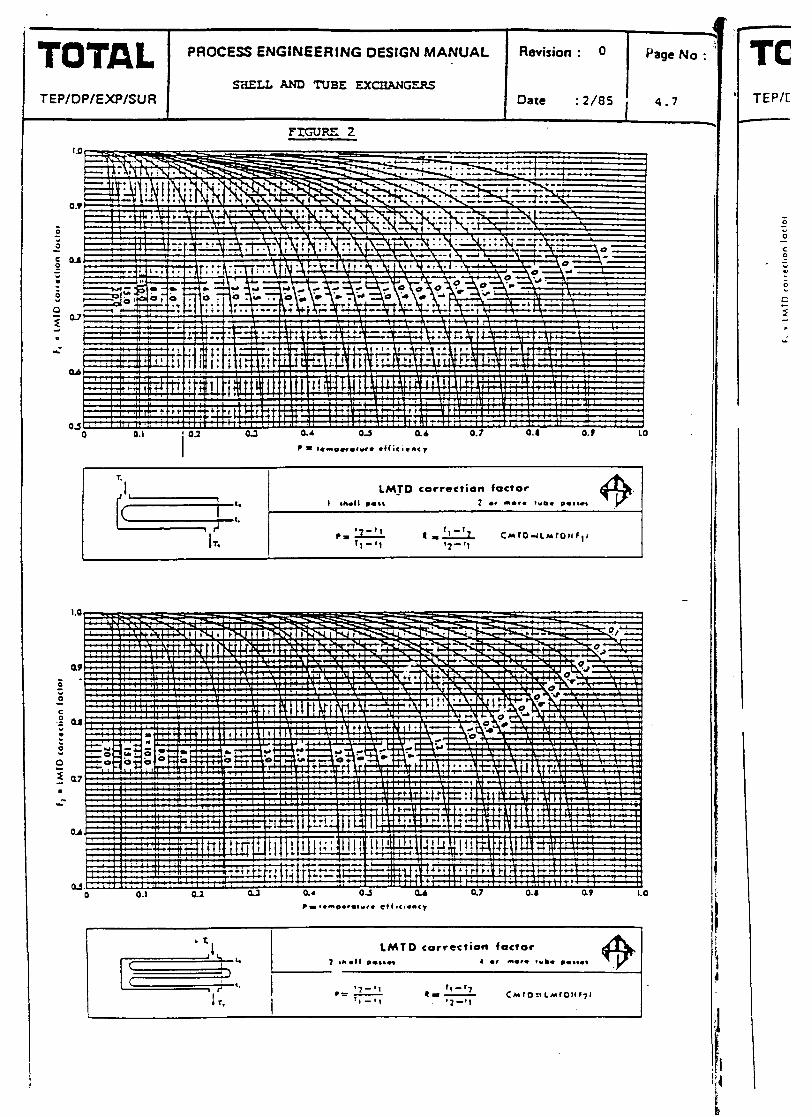
TOTAL PROCESS ENGINEERING DESIGN MANUAL
TEP/DP/EXP/SUA S-dELL AND TUBE EXCIihN~
&vision : Cl Page No :
Date : 2/8S I
4.7
FTc;uRE 2
LMfD correction factor
TC TEPK
z ; 2 c 0 _ - = Y : 0 I
C
3 L ,:

TOTAL TEP/DP/EXP/SUR
_.
PROCESS ENGINEERING DESIGN MANUAL R&riotl : 0 Page No :
SHELL AND TUBE =mmNGERs Date : 2/8S 4.8

roTAL PROCESS ENGINEERING DESIGN MANUAL Revision : 0 Page NO
EP/DP/EXP/SUR SHELL AND TUBE EXCHANGERS
Dhte : 2/85 4.9
SHELL PITCJI 0 I’ I PITCH A I’ I
I - I
NUMBER OF PASSE5 TUBE SIDE ; NUMBER OF PASSES TUBE SIDE !
I I
8. 32 26 20 36 32 21
IG 32 32 40 60 >6 67
I2 82 76 61 90 12 76
13 I/b 9) 90 12 I09 IO4 90
IJ II4 137 124 II6 164 JJO 137
17 l/4 IAS I66 15: 211 200 113
19 l/4 236 220 204 274 2% 211
21 114 276 270 246 320 306 279
23 114 323 31: 30: 3x3 375 3JO
23 107 39r 370 b7I r>t bl9
27 IO 460 632 JM s3u *a7 .
29 SJI 324 480 - 630 _ 603 JS6
31 633 616 169 765 726 677
33 7&O 712 615 1JJ 130 772
3s t23 a12 770 967 937 812
37 921 901 110 1074 I047 1014
39 I021 IOlk 913 1206 1173 1129
42 1202 II61 II47 lb06 J3lJ 1310
45 1435 IYI I 1367 1639 I61 I I%3
Cl I62G 1398 lJ>J 1172 It4J 1766
>I I911 1190 1148 2212 2113 2092
>6 221 I 2214 2167 2J68 254) 2446
60 2387 2356 2JlO 2987 294J 2127
T SHELL i
t I
TUBES 1’ I
PITCH 0 I’ II4
Bi in incMs NUMBER bF PASSES TUBE SIDE
-i-
f 4 NUMBEF. OF PASSES TUBE SIDE
I I, I
PJTCJI A 1’ J/4
2 c
I 7
-I
& 20
IO 30
12 b?
11 Ilk 61
IJ 111 a;
17 l/4 113
19 II4 lb1
21 l/b 170
23 I/C 207
25 248
27 2X7
29 349
31 190
13 CJa
35 326
J7 J77
39 643
c2 746
45 a94
*a 1029
>2 I216
56 1420
60 1639
I6 I6
30 26
bJ bl
33 II
12 76
101 102
139 I37
I66 IJI
197 I97
2b6 222
287 267
339 320
390 36)
432 bJl
313 40
337 5s5
637 611
729 109
175 8>3
IOIG 975
!I96 : I It.7
lb00
ICI5
20
37
57
67
96
129
170
199
246
294
349
396
472
J31
610
674
766
900
1018
I Ita
lUO>
1638
IIP9
I6 I6
30 26
51 47
61 57
92 16
127 I17
160 JJO
II9 I79
232 215
281 257
s35 302
376 539
4>6 431
J20 467
192 J61
664 631
735 698
IO13 912
II61 109x
1375 1321
160) I>49
IX>1 1797
TABLE 1
MAXIMUM TUBES NUMBER PER SHELL
TABLE 2
WAXIMUY lW8U NUUBER PER SHELL
gH1
API
inc
*-
:a:

TOTAL TEP/DP/EXP/SUR
-
PROCESS ENGINEERING DESIGN MANUAL Revision : 0
SELL AND TUBE EXCHANGERS Date : 2/8S
.
,- ‘WELL AND TUBE OVERALL HEAT TRANSFER
(including fouling factors) & Hearlnl/cwlrng
kcal/hzmzoC x 0.2047 = BTU&ft20F x 1.162 = W/InLOK
c. Vawrlzatmn (reboilerr)
I
waler/gas I - 3s brr
vartr/gas 3s - 70 bars
vattrlgas 70 - 100 bars
x am/gas over 100 bars
Vattrlnrtural gwlrnt
VatcrIMEA
ra1tr/air
vattrlvactr
culgrc (< 35 bard
cd/gas UQUI 70 bars)
CdC3 chiIlcr
P4tcrlli(hl Ii-C. rUCOuty < 0.5 CpO
vrttr/amagc H.C 0.5 cpo < viscosity < 1 cpo
vartr/he~*y ILLC rucosrty > I cpo
Oil/oil
Dowthtrmlgu
5cc~mfligh: H.C. VPcosrly < 0.3 CPo
~tamlamrgc H.C. 0-s c&lo < riscorcty < 1 CPO
Sttun/htary KC. rrrcosity > I Cpo
Page No :
4,IO
170 - 230
230 - 39c
390 - xc
JO0 - 700 - 340 - 440
630 - 730
70 - 120
mcl - 1 occ
240 - 340
270 - 360
290 - 440
290 - 73t
250 - 610
50 - 500
300 - 450
20-200
30-300
s40 - 1 100
2:,-2x,
soo- loo0
230 - )oc
30 - 300
sltamlvattr 700 - 1 700
Laghc H.CJwatcr 420 - Lb0
Fracuonata orcrbtadvattr 340 - 390
S~c4m/oil 340 - J40
CUOllN/WJlCf 320 - 630
Htrry H.C.lrarer I90 - 370
Hydrocarbon Irghthtam ’
Hydrocarbens C4-Cllrwam
Vrth hot oil
440 - 900
360 - 720
440 - >90
Set frgurts 3 and 4 hercrlttr.
7. REFERENCLS AND USEFUL LlTERATURE
4.1.
4.2.
4.3.
4.4.
4 3.
4.6.
4.7.
4.8.
4.9.
TEMA (smaaras of tub&r cxchangtr marw.facrwerr assouatron)
KERN
LUDII’IC VOLUME 3 second cdrtron
CAMPBELL VOLUME 1
NCPSA Chapter g
PERRY
HTRI Program
HTFS Program
OUICK CALCULATION OF HEAT EXCHANGER vElCHT Process Engl-rmg
January 1910

TOTAL PROCESS ENGINEERING DESIGN MANUAL Revision : 0 Page NO :
SHELL AND TUBE EXCF??GERS
TEP/DP/EXP/SUR Date : 2/85 4.11
FIGURE 3
TYPE AES WEIGHT ESTIMATE

TOTAL TEP/DP/EXP/SUR
PROCESS ENGINEERING DESIGN MANUAL Revision : 0 Page No :
SELLI AND TUBE EXCHRNERS
Date : 2/85 4.12 I
FIGURE 4 I
TYPE BEU t WEIGHT ESTIMATE
&se : 3l4” BWG 14 PITCH : I-0 TUBES LENGTH 16’
?-
- Q
f 2 c) . . 3 f c -
I
I I I I

TOTAL PROCESS ENGINEERING DESIGN MANUAL Revision : O Page No :
AIR COOLERS TEP/DP/EXP/SUR Date : Z/85 4.13
1. APPLICABILITY
-
For both the feasibility and preproject study it would generally be required to state tb
required duty of the air cooler, the overall dimensions and weight and an estimate E
required fan power.
A calculation procedure sufficient for a preliminary estimate is given in section 3.0.
2. DESCRIPTIQN AND GUIDELINE NOTES
Water or Air Coolinq ?
. Air cooling offshore is sometimes prohibited due to the modular layout of the platf I
This may require installation of the air cooler too remote from the associate’
equipment. Use dosed loop water cooling.
. Air cooling is cheaper, simple and flexible vjhen compared to water cooling. The cost ant
nuisance of water treating is eliminated if air coolers are used.
. In warm climates air cooling will not be as effective as water which will produce i
cooler product stream. Air cooling is approx 50-70 % as effective as water.
‘Forced on induced draft ?
Forced draft pushes the air at low&t available temperature (highest P
) hence lowei
power requirement.
Accessability to motor and driver are better on forced. Structural and main-rain. !
costs lower.
Possibility with forced draft of hot air recirculating into suction of fan thereby reducing
efficiency.
Induced draft gives better 2ur distribution due to lower inlet velocity with less chance o:
recirculating of hot air.
Induced draft Foolers can be easily installed above piperacks or other equipment
Protection is given by induced draft coolers from effects of rain, wind snow on finnec
tubes. Important if fluid in tubes is sensitive to sudden temp change also freezing oj
tubes can occur in cold climates or heavy snowfall.
I’ i
1

TOTAL TEP/DP/EXP/SUR
-
PROCESS ENGINEERING DESIGN MANUAL
SHELL AND TUBE EXCHANGERS
Revision : 0
Date ,;u85
Page No :
4.14
Finned tube elements (see Table 2)
. 1” OD tubing is most common with 0.5” to 0.625” fins. Fin spacing 7 to 11 pir inch.
Extended surface area is 7 to 20 times bare area. .
. Standard tube lengths from 6 ft to 50 ft (2 m to 15 m). Longer tube designs are less
costly than short ones.
. Bundle depth may vary from 3 rows to 30 rows of tubes. 4 or 6 rows is common for
smaller units. Use 4 as first estimate.
. Fin material most commonly AL. Adequate upto 400 “C operating. Use steel for higher
temperatures.
Fans and motors
. Fans are axial-flow large volume low DP devices. Use total fan efficiency 65 %. Driver
-- efficiency 95 %.
. Fan D equal to or slightly less than bundle width. Normally 2 fans preferred. Fans have 4
to 6 blades. Max fan diameter 14’-16’.
. Distance between fan + bundle O-4-0.5 of fan diameter. Ratio of fan ring area to bundle
area must not be less than 0.4. -
. Fans may be electric, steam, hydraulic or gasoline driven. Individual driver site usually
limited to 50 hp, (40 kw), 380 V.
. Face velocity of air across a bundle is 300-700 ft/min (l-5-3.6 ms-l).
. A 10 % change in air flow rate results in -35 % change in power used.
Temperature control
. For dose control of process outlet temperature auto-variable pitch fans, top louvers or
variable speed motors are required.
. Variable pitch fans more efficient than louvers.
. Louvers can be manually adjusted for winter or mght time operation.
. For process fluids that freeze or gel ai temperatures above the winter ambient a
recirculation system is necessary to maintain air temp entering the tube bundle.
. General approach temp to ambienr air is 20-25 “C. Absolute min is lo-12 “C.
Note : Air coolers are noisy. Keep fan speed as low as possible and consider relative layout
carefully.

w
TOTAL PROCESS ENGINEERING DESIGN MANUAL Revision : 0 Page NO
AIR COOLERS TEP/DP/EXP/SUR aate : Z/85 4.1
4.0 REFERENCES AND USEFUL LITERATURE
4.1. Air cooled hear exchangers PERRY pp 11.23 > 11.25
4.2. Air cooled heat exchangers LUDWIG pp 177 z 193
4.3. Air cooled heat exchangers GPSA chapter 9
4.4. Aerial coolers CAMPBELL pp 207-209
4.5. Design of air coolers - A R. BOWN
Procedure for estimation Chem. Eng, Mar 27 1978, p
4.6. Estimate air cooler size
HP 41CV program
N. SHAIKH
Chem. Eng, Dee 12 1983, p
GPER/
Duiy
Fluid i
Fluid c Fluid i:
Air am
overal
%E @ased
-
STEP
l.Oprll rows
?r)- , -L
f’ - 4.Y =c
5./\tal
6. EXIT
7. Aver
D rm .
8. Bare
9. Bare
10. Tu
11. Tu ,’
30
14. To
14. Nu
15. Fa
16. PO
17. Es.
4.1
Notes :

OPERATING CONDITIONS AND NATURE OF FLUID : - H-b-~ 46 WQ
DuiY iQ= i 2% 10‘ kcaI/hr 4
Fluid inlet temperature IT1 = j too- ‘C I
IT2= i 50
b Fluid outlet temperature ‘C i FLUID Tf = TI _ T2 = So ‘C
i Fluid inlet pressure IP= J 10 bar abs J
1 Air ambiant temperature I tl = I 30 ‘C I INLET Ti= l-1 - tI = -$o l c
j! Overall heat transfer coeff. iU= I kcaI/hr m2 ‘C J ‘(see Table # and/or attached
i work sheet) I 200 iI (Based on bare tube area) ,
I NOTES
i
STEP
l.Optimum number of tube . I rows
? 3 =Ot air/& m
, f’-T2/Tl-tl
4.Y =& airjT1 - tl
5.arair = Y x (Tl - tl) ‘I
6. Exit air temp t2 =A tair + tl
; 7. Average differential temp. (1
. Arm ,At;ir
i 8. Bare tube surface A b&
/, 9. Bare tube area/row Fa=AjN
I’ 10. Tube length
’ 11. Tubes/row TR = Fa/Lx0.08 ‘.
I- ‘3ooler width W=TRx0.0635
Lo. Total fan power =Fax0.795
:’ 14. Number of fans
15. Fan diameter
I 16. Power/fan Fp/NF
17. Estimated weight
1 4.88 (36.4X9.35 N)xWxL
Notes
1
IN= I %
IR= 1 0.8
I 1 0*314
lY= I o-35
IAtair i 26.5
I t2 = 1 54.5 -
I I
1 tm = 1 30.6
I I
IA= 1 326
I I
IFa= I 41
IL= I 7.5
lTR=l 68
I w 1 4.3
I Fp I ‘)2*4
I NF I 2
I FD I 3-S
t PF 1 16.2
] M 1 I? 500
I I
I (curve N” 4,)
I (curve N” 4)
‘C I
I (curve N” 5)
‘C I
‘C I
I’
‘C I
m2 :
m2 j
F,; 1 3, 4, 5, 6, 7.5 or 9 m are common
I (1” OD tubing)
m I
kW I
I max. fan diam = 4.6 m
M I
kW I
kg 1 (including m’otors)
I
Curve numbers refer to Process Design Manual Chap. 4.
I MnlT PROCESS CALCULATION SHEET
TOTAL mmll
ITEM: AIR COOLER E YAMG-
1’ -IDop/Mp/ fExP/ ram NO :
3Y CHK DATE JOB TITLE : JOB N* : REV 1

1.
2.
3.
4.
LIQUID COOLING
LIQUID VISCOSITY AT Tl + T2 =
GLOBAL HEAT TRANSFER COEFFICIENT : U = (Read curve no 1)
GAS COOLING
MOLECULAR MASS : MW =
GLOBAL HEAT TRANSFER COEFFICIENT : U = (Read curve no 2)
TOTAL CONDENSATION
Tl-T2 = “C
GLOBAL HEAT TRANSFER COEFFICIENT : U = (Rest curve no 3)
PARTIAL CONDENSATION
4.1. WITHOUT LIQUID AT INLET
inlet gas flowrate WGl =
outlet gas flowrate WC2 =
outlet liq flowrate WL2 =
Tl -T2 =
GAS MOLECULAR WEIGHT AT Tl + T2 = ,-
HEAT TRANSFER COEFF. UC = (Read curve no 3)
HEAT TRANSFER COEFF. Ug = (Read curve nO.2)
GLOBAL HEAT TRANSFER COEFF.
CP
kcal/hr m2 “C
kcaI/hr m2 “C
kcal/hr m2 ‘C
kghr
kg/h
kg/hr
“C
kcal/hr m2 “C
kcal/hr m2 “C
u= WL2 WC1
x Uc = WG2 x ug WC1
= kcal/hr m2 “C
SELECTED GLOBAL HEAT TRANSFER COEFF. : U
Curves refer to PDM Chptr. 4.
kcal/hr m2 “C
m-0 PROCESS CAiCULATlON SHEET
TOTAL AIR COOLERS ITEM :
I-EAT TRANSFER COEFFICIENT P/mIMP/ EXP/ SJA NO :
\ I CHI( OATE JO8 TITLE JO8 N* : REV

I
4.2. WITH LIQUID AT INLET
inlet liquid flow rate WLl =
outlet liquid flow rate WL2 =
LIQUID MOLECULAR WEIGHT AT Tl +2T2 =
LIQUID SPECIFIC HEAT AT Tl +2T2 CPI =
QL=(,)xCPlx(Tl-12) =
inlet gas flow rate. WC1 =
outlet gas flow rate WC2 =
GAS MOLECULAR WEIGHT AT Tl + T2 =
GAS SPECIFIC HEAT AT Tl ;T2 CPg =
. QG = (WC1 + WC2) 2
xCPgx(Tl-TZ) - =
CONDENSATION HEAT
Qc=Q-QL-QC =
LIQUID VISCOSITY AT Tl +2T2 =
LIQUID HEAT TRANSFER COEFF. U = (Read curve no 2)
GAS HEAT TRANSFER COEFF. (Read curve no 2)
ug =
CONDENSATION HEAT TRANSFER COEFF. UC = (Read curve no 3)
GLOBAL HEAT TRANSFER COEFF.
u= *
u = + +
ut u3 (4
SELECTEDGLOBALHEAT TRANSFER COEFF. : u =
kghr
kg/hr .
kcaI/kg ‘C
kcal/hr
kghr
kg/hr
kcaJ/kg “C
kcal/hr
kcal/hr
cpg
kcal/hr m2 “C
kcal/hr m2 “C
kcal/hr m2 “C
kcal/hr m2 “C
kcal/hr m2 “C
I BREl PROCESS CALCULATION SHEET
TOTAL AIR COOLERS ITEM : / WT TRANSFER COEFFICIENT
EPmcPfDlP/ EXP/ SUCI NO :
1 CHK I DATE JOB TITLE : Jot3 N’ : REV

c
PROCESS ENGINEERING DESJGN MANUAL Revision : 0 Page No :
‘DP/EXP/SUR AIR COOLERS
Date : 2/85 4,2Q
cF.vE 1 -COOLING HYOROCAA8ON LIOUIOS
I HIGH AI?
LOW FOULING FACTOR
03 01 0.4 0.5 0.6 0.70.8 1 2 3 4 5 6 7 8910
u Ln -cca1/hr.m2 -c
CURVE 2 - COOLING CASES
/ I I I I I I I I I I I
t i i PRESSURE BAR ASS.
L 1 ,I-
1 2 3 4 5 6 78910 20 30 40 50 60 70

-~
TOTAL PROCESS ENGINEERING DESIGN MANUAL Revision : 0 Page NO :
AIR COOL==
TEP/DP/EXP/SUR Date : 2(85 4.21
I
800
700
600
500
200
IS0
/ PRESSURE BAR ABS
I I I I I
2 3 4 5 10 20 JO 40 1 50 70
BTLJ/hzft20F x 4.885 = kcal/hm2 c. *
we=2 TABLE 1 BTu/hrft2”F-
Fintube data for l-in. 00 tubes T+c*l owrdl kwu-drr e~F4urm F.m h..,)lt CI Fins/inch y, in. h * $6 in. LT 10
APF, rq ft/ft 3.00 S.SB
AU. sq +t/if IA.5 21.4
Tube Pitch I
2 inA 2% In J 2% In A 2% 10 3
APSF (3 rows) 68.4 60.6 09 1 80 4
(4 rows) 91.2 00 0 118.8 107.2
(5 rows1 114.0 101.0 148.5 134.0
(6 rows) 136.8 121.2 178.2 160.8
k .I. rrbm - I--
‘“- C. k--t.
,.-.-c-e- u, “. Ub u. bw--cJ--
t~,-O.wll................. II+? I 1-t amcrr we
(~,-awa.. .,-a I “O-L, sGY)--r
,,,.OWl,............... -1 1-. 30-m - -se”
(.,9o.wzl............... h%J 93-4

TOTAL TEP/DP/EXP/SUR
-
AIR COOLERS /
PROCESS ENGINEERING DESIGN MANUAL
CURVE 4
Revision : 0 Page No :
Date : 2/05 4.22
Y=
0.4
02
a.2
0.1 I I
500 600 700 800 OVERALL HEAT TRANSFER (ban tutu)
CilJIr
11 .I1
0.7
0.C
0.5
0.4 .A 9
0.3
1 I I I I 0.2
I I I I I

TOTAL PROCESS ENGINEERING DESfGN MANUAL - . :
TEP/DP/EXP/SUA PLATE TYPE EXCHANGERS j I;;rnz2,,“, , pag;z’
1. APPLICABILITY
FEASIBILITY STUDY : PRE-PROJECT .
tinder normal circumstances, the design of plate type exchangers would be aetailed by a
vendor based on process data supplied by the engineer.
Two types of plate exchangers could be used :
. Plate fin excfiangers ;
. Plate exchangers.
For the purpose of this design guide, only a quick description and some characteristics are
given.
For plate fin exchangers, the size could be done only by a vendor.
For plate exchangers, the size could be estimated if some vendor (ALFA-LAVAL, APV,
VICARB) information are available.
An estimation of the heat transfer area could be done if the heat transfer coefficient is
known using the same formula as for shell and tube heat exchanger with a LhZTD correction
factor = 1. The heat transfer coefficient is difficult to estimate ; it depends on many factors
as flow rate of different C;uids, pressure drop, plate spacing, ect...
2. DESCRIPTION AND NOTE5
2-l PLATE FIN EXCHANGERS
These exchangers consist of stacked corrugated sheets (fins) separated by flat plates and
an outer frame with openings for the inlet and outlet of fluids. This core is immersed in a
liquid salt bath to braze all the separate parts together.
Flow in adjacent fluid passages can be cocurrent, counter current, or crossflow and
several fluids can be exchanging heat at the same time.
In case of the inlet fluid is a two phases flow a drum is required to separate the two
phases in order to have a good distribution. \;a -- aPi d-w---- ycq+alrc’ FL”” b c4-.hw
only with clean fluids.

OTAL PROCESS. ENGINEERING DESIGN MANUAL Revision : O Page No :
PLATETYPEEXCHANGERS
-“/DP/EXP/SUf? Date ,usi 4.24
Figure 1 shows the principle of construction of a platefin exchanger. A large amount of
surface can be accomodated in a small volume (1,000 mZ/m3).
IMaximum design pressure : 54 barg (some recent models claim 80 barg)
Temperature range : - 195 “C to + 65 “C
Size max. : 1,220 mm x 6 096 mm x 1 340 mm
Temperature approach : 2 “C
Applicability : LNG, LPG recovery, . . .
Pressure drop as for shell and tube heat exchangers.
2.2 PLATE EXCHANGERS
Plate exchangers are an assembly of metal plates separated by gaskets to give a small
clearance between each plate. The two fluids pass in opposite directions each through
every alternate plate. Refer to figure 2.
The exchanger is easily dismantled for deaning if required. A good overall heat transfer
coefficient is obtained and small temperature differences can be used.
The plates can be made from exotic materials such as titanium which are resistant to
corrosion and are used for sea water coolers. They are very compact exchangers and
occupy a small floor area.
Maximum pressure : 10 - 20 bars
Maximum temperhture : 250 ‘C’
(Need special gaskets)
Overall heat transfer coefficient
Water/water : 2 000 - 5 000 Kcal/hr m2 “C
Maximum surface : about 1 500 m2
Maximum flow : 2 500 m3/hr
Applicability : Sea water - service water, water-TEG, TEG-TEC, .-.
. Pressure drops : allowable pressure drops vary according to the tocal system
pressure and the service of the fluids.
- for sea water - service water : 0.5 to 2 bar (high A P increase the overall heat .
transfer coefficient),
- for water-TEC or TEG-TEC the dP could be very low such as 10 to 20 mbar.
REFERENCEAND USEFULLITERATURE
Vendors information.

TOTAL TEP/DP/EXP/SUR
PROCESS ENGlNEERlNG DESIGN MANUAL Revision : 0
pm’r~ EXCHANGERS
Date : 2/85
PLATE FIN ESCSA!!GZfTS
Page No :
4.25
FIGURE 1

TOTAL TEP/DP/EXP/SUR
PROCESS ENGINEERING DESIGN MANUAL
PIATE ExctIANGuzs
Revision : 0
Date : 2/85
Page No :
4,26
DETAILS OF PLATE TYPE EXCHANGER
1 2940 9 7) 2525 s Ii IWO5 II 10 loo-165
: 3515 19 6i 3100 10 2 3605 11 !O 160-265 -- -- .-
3 4055 13 lj IWO 11 1,; 3605 11 10 260-340
1 AJ65 I. 6i 4070 13 .i x05 11 IO 33sao
5 6660 22 6 6AAS 21 2 3960 13 0 roe-700 .-
.

. r
TOTAL PROCESS ENGINEEA!NG DESIGN MANUAL Revisidn : 0 Page NO :
FURNACES
TEP/DP/EXP/SUR Date : 2/85 4.27
1. APPLICABILITY
It is not expected that a hand calculation of furnaces be performed by the engineer. it is
normally done by a manufacturer based on process data supplied by the engineer.
Furnaces are used to transfer heat directly to the process fluid and generally have a large
duty and produce high process temperatures-
2. DESCRIPTION
2.1. A furnace consists of the following :
. A combustion chamber lined with refractory and burners
. Tubes which are located within the combustion chamber and where heat is
transferred to the process fluid by radiation
. Tubes which are located externals to the combusion chamber in a convection zone
which is also lined with refractory.
. Stack for disposal of flare gas.
. Air supply system by fan or induced draft.
. Instruments and controls.
2.2. TYPES OF FURNACE
22.1. Cabin furnace
. This is a rectangular furnace and contains tubes which can be horizontal or
vertical. The burners are situated in the walls or floor, and the convection
zone is located above the furnace.
. Flue gases discharge to a stack either directly or are driven by an induced
draft fan.
. Burners are normally arranged in rows on two walls and are spaced so as to
provide a radiation zone of constant temperature and avoid flame
impingement on the tubes. An alternative arrangement is bxners located
in the floor of the furnace as shown in Figure 1.
. The connection bank contains rows of tubes across which the flue gas
leaving the furnace is obliged to pass.
. A small negative pressure is maintained to prevent hot gas leakage.
. There is a pressure loss’ ilr the flue gas system and this has to be made up
either by use of a fan discharging to a short stack or by natural bou).mcy
creating draft in a tall stack.

PROCESS ENGINEERING DESIGN MANUAL Revision : 0 Page No :
FURf’JACES 7P/DP/EXP/SUR Date SW35 4.28
2.2-Z. Cylindrical furnace (see Figure 1)
. These furnaces are vertical and contain radiation and convection zones or
solely a radiation zone.
. The burners are located in the bottom and the radiation zone tubes can be
vertical or helicoIdal. The convection bank is located above the radiation
zone and contains rows of horizontal tubes.
. Generally the stack is vertically above the convection bank with no fan.
2.3. BURNERS
. Two types of burner are used in furnaces, induced air or natural draft burners
and forced draft burners.
2.3.1. Induced air burners
These can burn gas or fuel oil simultaneously or independently. Excess air
required is 15 % to 20 % for gas and 30 % to 40 % for liquids. If fuel oil is
burned 0.3 kg/kg oil of steam is required for atomising. (Excess air indicates
that above the stiochiometric ratio)
2.3.2. Pressure burners
The air for pressure burners is supplied by fan. It is therefore capable of
control and the burner can operated with less excess air 5 to 15 %.
EXCESS AIR
. Determine the excess air recommended by the burner manufacturer and the type of
burner air system proposed. See § 2.3.
. From this determine the kg of flue gas per kg of fuel fired remembering that air
contains 21 95 Vol of oxygen.
STACK GAS TEMPERATURE
This is controlled by 2 factors :
. The process fluid inlet temperature will determine the temperature of the gas leaving
the convection bank.
. Condensation is to be avoider. if sulphur is present in the fuel the stack temperature is
raised to avoid the possibility of production of corrosive sulphurous acid. This would
result in a minimum exit temperature of about 120 “C.

c
TOTAL 1 PROCESS ENGINEERING DESIGN MANUAL I
Revision 0
TEP/DP/EXP/SUR FURNACES
Date : 2/85 4.29
5. EFFICIENCY
1 = 100 - 100 losses x Hf Hf - Hc t
If Hc = flue gas enthalpy at exit
Hf = enthalpy of combustion (net calorific value + sensible heat in fuel and air) + heat
being by atomisation steam if required.
. Losses include radiation and unaccounted, e.g. unburned fuel (2 % is a good figure).
. For a furnace which is all radiant duty the efficiency is of the order of 50 to 55 96.
. A furnace with a convection bank will be from 75 to 85 % efficient.
6. PRESSURE LOSSES
Pressure is lost in :
. Burner air regulation : 3 - 15 mm-water . Ducting
. Convection bank : 5 - 15 mm water . Stack
: variable
: variable
Pressure IS galned by natural buoyancy of hot stack gas.
For a system using natural draft burners a low pressure loss is required across the burner and
the furnace operates under negative pressure.
7. FLUE GASES VELOCXTY
The flue gases should leave the stack at 10 - 20 m/s velocity to ensure safe dispersal.
8. CHOICE OF TYPE OF FURNACE
. Above a capacity of 60 x lo6 Kcal/hr the cylindral furnace gives construction problems
as the maximum diameter is about 10 - 11 m.
. A cabin furnace requires much more floor area than a cylindrical furnace the length can
be as much as 27 m. If the tubes are horizontal then a withdrawal space for tube
replacement will also be required. However for offshore applications the space
requirement tends not to favour the cabin furnace.
. With a cabin furnace It is possible to obtain a uniform heat release across the radiation
zone. The height can be about 15 m. .
. With a cylindrical furnace it is not possible to obtain a uniform heat above release across
the radiation zone. The height tin be about 25 m.
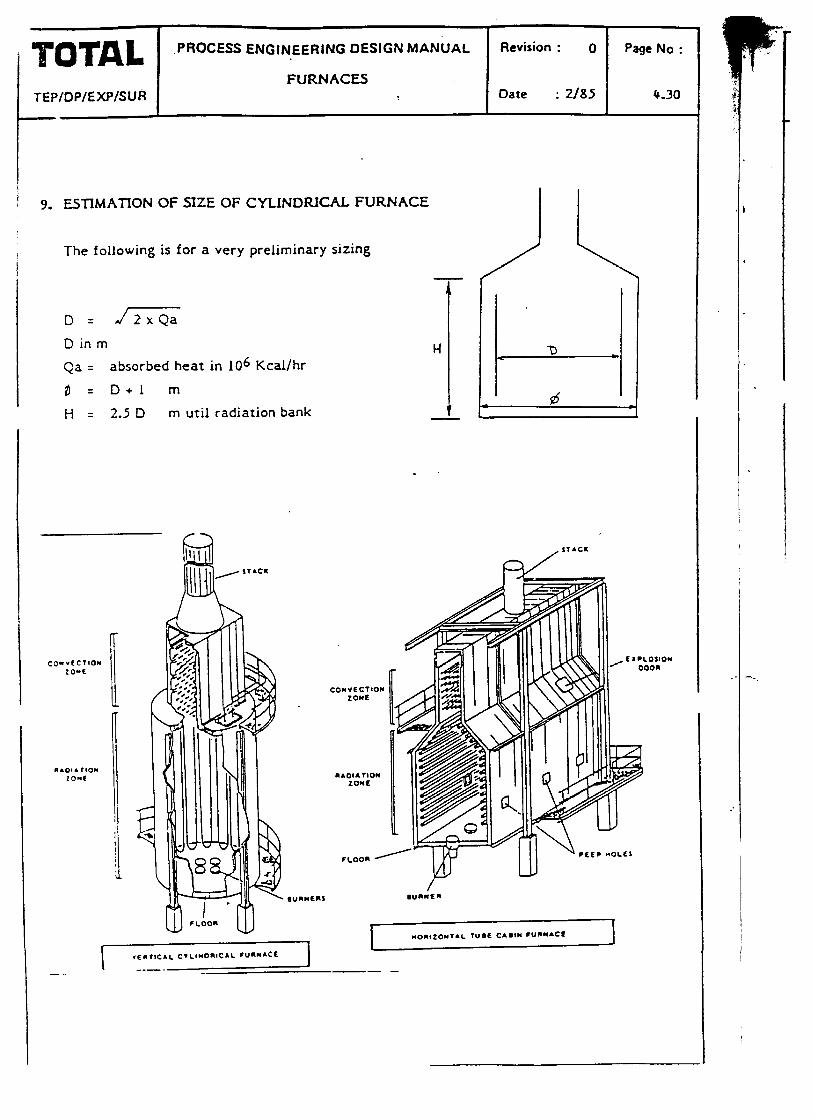
OTAL .PROCESS ENGINEERING DESIGN MANUAL Revision : 0 Page No :
FURNACES TEP/DP/EXP/SUR Oate : Z/85
9. ESTIMATION OF SIZE OF CYLINDRICAL FURNACE
The following is for a very preliminary sizing
D= G
D in m
Qa = absorbed heat in 106 Kcalfhr
0 = D+l m
H q 2.5 D m util radiation bank
COrrCCTlO*
IOUC
i
,

TOTAL PROCESS ENGINEERING DESIGN MANUAL Revision : Page No :
TEP/DP/EXP/SUf? Date : m5
.
I
.
1
I’
--_
.5, PUMPS

TOTAL PROCESS ENGINEERING DESIGN MANUAL Revision : 0 Page No :
TEP/DP/EXP/SUR PUMPS
Date. 2/85 5.1
I ’
I .O APPLICABILITY : Ii ‘I
For both the feasibility study and a pre-project study the engineer will be required to
evaluate a pump selection and fill in a data sheet with the basic information.
In order to provide the basis of a good cost and layout estimate it is important to understand
the type and’ number of pumps for the service’ in consideration, and the associated power
requirements.
2.0OFtCRIPTlONANDGUfDELINENOTES
TYPES OF PUMPS
. Generally there are three classes of pumps :
Centrifugal Rotary Reciprocating
1. Centrifugal I. Cam 1. Piston
’ 2. Propeller 2. Screw 2. Plunger
3. Mixed flow 3. Gear 3. Diaphram
4. Peripheral 4. Vane
5. Turbine 5. Lobe
. A pump selection chart is shown in Figure 1.
GENERAL USAGE
Centrifueal pumps (Process Pumps)
. kledium to high capacity for low to medium head requirements.
. Higher head requirements can be met by using multistage impellers.
. General service for all liquids, hydrocarbons, products, water, boiler feed.
. Simple, low cost, even flow, small floor space, quiet, easy maintainance.
I’ I
I
I
.I
I
I
I I
I I

OTAL PROCESS ENGINEERING DESIGN MANUAL
I
Revision : 0 Page No :
PUMPS 1 TEP/DP/EXP/SUR
Rotary Dumps
. Many proprietery designs available for specific services.
. Essentially can handle clean fluids only with small suspended solids if any. Can pump
liquids with dissolved gases or vapour phase.
. Can handle wide range of viscosities - upto 500 000 SSU at high pressures.
. Typical fluids pumped : mineral, vegetable, animal oils, grease, glucose, viscose, paints,
molasses, alcohol, mayonaise, soap, vinegar and tomato ketchup !
. Generally specialist pumps for specific requirements.
Reciprocating pumps
. Pumps produce virtually any discharge head upto limit of driver power and strength of
pistons and casings.
. Overall efficiency is higher than centrifugal pumps. Flexibility is limited.
. Piston pumps : can be single or double acting. Used for low pressure light duty or
intermittent services. Less expensive than plunger design but cannot handle gritty
fluids.
. Plunger pumps : high pressure, heavy duty or continuous service usage. Suitable for
gritty or foreign material. Expensive.
. Diaphram pump : driven parts are sealed from fluid by plastic or rubber diaphram. No
seals no leakage. Ideal for toxic or hazardous material. Can be pneumatically driven at
slow speeds for delecate fluids.
. Triplex pumps : commonly used for TEC circulation.
I REFERENCES AND USEFUL LITERATURE
4.1. LUDWIG VOL I CHAPTER 3
4.2. PERRY CHEM. ENC. HANDBOOK CHAPTER 6
4.3. CAMPBELL VOL II CHAPTER 14.
4.4. “Centrifugal pumps and system Hydraulics”
Ugor I. Karassik Chem. Engrng Ocr 4 1982
4.5.
4.6.
“New Program Speeds up Selection of a Pumping unit”
.M. Seaman Oil and Gas 3. Nov. 12 1979
“Rapid calculation of Centrifugal-pump hydraulics”
W. Blackwell Chem. Eng. Janv. 28 1980

TOTAL TEP/DP/EXP/SUR
PROCESS ENGINEERING DESIGN MANUAL Revision : 0 Page No :
PUMPS Date z/S3
5.3
1. FLUID CHARACTERISTICS
. Always quote at pumping temperature ie : normal suction T.
2. SUCTION PRESSURE
. Evaluate at pump suction flange
Ps = Pop + Static head - line loss
Pop = minimum vessel operating pressure bara. -
Static head : evaluate at LLL always take static head above pump centreline.
h2 (approx. 0.6 m). head (bar) = m x specific gravity/lo.197
Line loss : evaluate APline for bends, fittings, etc : for estimate use
0.1 bar/100 m.
3. NET POSITIVE SUCTION HEAD NPSHA
. NPSH, available is evaluated by the ,engineer. NPSHR required is stated by the vendor
always try to provide 0.6 - 1 m NPSH more than vendor states.
. Vapour correction is calculated by substracting the vapour pressure of the fluid beil,G
pumped from the calculated suction pressure. Convert this to m head. For a fluid at
bubble point the vapour pressure = Pop
head (m) = bar x lO.l97/SG.
INPSHA = static head - line loss + vapour correction
4. DISCHARGE PRESSURE
. Dellvery pressure - use maximum Pop of destination vessel
. Static head h3 - height of delivery point above pump or if a submerged discharge into a
vessel the height of the HLL.
. A P discharge line - calculate based on line length, fittings etc or use minimum of 0.5
bar. ’
. a P exchangers, heaters, etc - use allowable A P from equipment data sheets. Estimate
0.7 - 1.0 bar if not available.
! i TEPfC
6. F -
7. F -
I\
9. !
10.

PUMPS
1 TEP/DPI EXP/SUR Date P/85 5.4
I-
‘! 1 . A P orifices - for flow meters use 0.2 - 0.4 bar.
. A P control valves - use maximum valve of 0.7 bar, or 20 % df dynamic friction losses ., or 10 % of pumpAP.
. TOTAL DISCHARGE PRESSURE - sum of aIl abovea P values.
5. DIFFERENTIAL HEAD
. Discharge pressure - suction pressure convert to m head
6. FLOWRATE
. Normal flowrate is maximum long term operating flow
. Design flowrate is normal flowrate + design margin.
. Design margin
Use 10 % for feed pumps or transfer pumps
20 % for reflux pumps and boiler feed water pumps
7. POWER REQUIREMENTS ’
Note : although the term “horsepower” is still used power requirements are given in kW for
metric calculations.
. Hydraulic horsepower - theoretical fluid HP = flow x head/36 KW
. Brake-horsepower (BHP) - hydraulic HP/ p pump efficiency KW
. Operating load - electrical input to electric driver at normal pump operating load =
BHP/ nm motor efficiency K w
. Connected load - electrical power to motor at rated motor size Kw
. Note pump speeds are either 1 450 rpm or 2 900 rpm
8. MAXIMUM DISCHARGE PRESSURE (shut off pressure)
. Shut off pressure = max suction pressure (calculate at HLL and p maxi)
+ 120 % x normal pump AP
9. PUMP MINIMUM FLOW
. For an estimate use 30 % of normal flow.
10. PUMP WEIGHTS
. For an estimation purpose only Figure 4 can be used to determine the weights of a
centrifugal pump package.

Indicate pressure, elevations and system sketch
PUMP TYPE : c~rqaiCu<*c $.“i;& s ?.q- FLUID PUMPED : Liquid : c9dM Speed : 2z?oo rp
Pumping temperature T : 36 ‘C Viscosity at P, T : 3.2 cf’ Vapor pressure at T : l-04 bara Specific gravity 15 4 : 0 .eoe Density at P, T Specific gravity at P, T i
s22 kg/m3 Normal flow Q : 151 m3/h o-822 Design margin
Design flow (1) f 2-s %
189 m3/h
1 I I SUCTION PRESSURE I DISCHARGE PRESSURE i
I I , Min. Origin Pressure= bar al [ -03 I’ z[ Delivery pressure bara I i*ol I
Static head Q LLL = m 1 345-G._ I Static head <-&I bar 1 I a29.y i - (m x sg x O-0981) bar 1 o-251 I AP control valve(s)
I AP exchanger(s) bar I o*+ .I ‘,
- A P suction ,line bar! 0.10 bar I 0.30 I ,- , I I AP orifice(s) bar I - f I
PUMP SUCTION PRESSURE t \* ” I 2 F line loss bar I - bar I 0.4 1 I
1 I Other C&~-C> bar I 0.5
NET POSITIVE SUCTION HEAD I. I I I
Static heado LLL m I St!5 , TOT DISCHARGE PRESS bara 1 4.6 ’ t
- Line loss .z :L :, . <.r/ m + vapour pressure correction m
I l,a4 ’ I I - I DIFFERENTIAL PRESSURE t
I
I I I t
TOTAL AVAILABLE NPSH i m , i-91 I Suction Pressure bara ; .l*(e i I Discharge pressure bara I 4.6
I I MAXIMUM SUCTION PRESSURE I I PumpAP
I bar 1 3.42 (2); m I43
Vessel PSV setting baral 3.5 *I- . 8’ I. I t Static head at HLL : \( z$$s bar I O- S ‘I I I’
I I POWER REQUIREMENTS I net bara 14.0 1 t I ,
L I Brake Horse-Power = I x 2 kW I 322 3 I MAXIMUM DISCHARGE PRESSURE I (Fig 2 for
I I 1’ 377 I
I f
Max. suction pressure bara; 4.0 5l.q; Estimated motor size kW i 375 4 i Normal pump AP x I20 % bar I I I I
. I I
I Design operating load 4/fm kW 1 400 5 I
net bara I
I I (Fig 3 for ?rn)
I I I f
N&S: :, S;uA cr lo 000 as*93 I I I I Estimated weight kg IS’too 51 I I I
PROCESS CALdJLATlON SHEET ’
PUUP ITEM : PSOWCl PrtiP
I “0: 42030 4/O
i IT

TOTAL TEP.‘DP/EXP/SUR
PROCESS ENGINEERING DESIGN MANUAL
Date : 2/8S
Pegs No :
FIG. I SEWERAL 4m OF APPLICATIOW FOR OIFFFREHT PUUP TVPEL FLOW (M’tn~
FIG. 2 ESTIMATION OF CENTRIFUGAL PUMPS EFFICIENCY s
60
70
60
so
40
30
20
-
CAPACITY rn3/ h

TOTAL PROCESS ENGINEERING DESIGN MANUAL
P!JtlpS TEP/DP/EXP/SUR
FIGURE 3
ELECTRIC MOTORS. REC&4MENkl!3fE & EFFICIENCY (1)
AI DAgn Condiuoru
BHP -
0 - 0.3 0.51 - 0.75 0.75 - 1.00 1.01 - 2.00
2.01 - b-00
Probible Motor
Rating
HP
Il.01 - 6.00 T-112 6.01 - 1.00 IO 1.01 - 12.0 15
12.1 - 16.0 20 16.1 - 20.0 2S
20.1 - 26.1 26.2 - w.1 3b.9 - b1.S b3.6 - j2.2 52.3 - 65.2
30 a0 SO 60 IS
65.1 - 17.0 17.1 - 114
113 - 136 137 - 112 IX3 - 227
LOO 125 IS0 200 250
221 - 273 27b - )I: 319 - 364 365 - co9 610 - bSS 656 - )us
ma 1so COO bS0 SO0 600
Motor Efficienq pi of Full Lord
CW-rl lo EE
a1 12 82.5 67 13 71 7s 7: LO 75 79 10 81 13 80
7s 10 Xl.> 10 ‘/I X5 II tJ 86-S
:t 86:: 86 88
8b 19 91 13 19-J 91.J 86 I% 91 11 91 92.5 90 92-S 93.5
90.3 93 90
91 93 It 93 93
ii: 93
91.3 93 93-J 93 9b 9b.J
Power Fxtod21 % of FuU Lord
CAOACIW 100 -
10 :a Ib
t6 16
90 91 91 90 90
90 91
91.5 90 19
91 92 92 92 a9
93 93
t: 91 90
Notes2 (1) Applies to loftily enclosed motors only (i.e.. cxplorron proof) . 10 k aed in detcrmirution of KVA’r if dcrtrd.
GRy WEIGHT ESTIMATE FOR CENTRIFUGAL PUMP PACKAGE
HORSE POWER -
i
TOTAL PROCESS ENGINEERING DESIGN MANUAL Revision : Page No :
TEPIDP/EXP/SUR Date : 2f85
7, COMPRESSORS

TOTAL TEP/DP/EXP/SUR
1. APPLICABILITY
For both feasibility and pre-project studies the engineer will be required to evaluare 2 I
compressor selection, discharge temperature, power and complete a data sheet. .
To evaluate the discharge temperature and power it is more accurate to use SSI instead of
the manual method presented here.
2-
In order to estimate the basis of cost and layout it is important to understand the type of !
compressors for the service in consideration, and the associated power requirements. !
DESCRIPTIOil AND GUIDELINE NOTES
2.1. TYPES OF COMPRESSORS
The principal types used in the oil and gas processing industries are :
. reciprocating (volumetric) . centrifugal
. rotary (volumetric) . axial
A compressor selection chart is shown in Figure 1..
PROCESS ENGINEERING DESIGN MANUAL Revision : 0
COMPRESSORS Date : 2/85
--
Page No : ’
7.1 ..’
2.2. GENERAL USE
2.2.1. Reciprocating compressors
Reciprocating compressors are widely used in the oil and gas industry for small
to medium gas flows and high compression ratios. For example :
. Instrument and service air compressors
. Low capacity/high pressure gas compression for re-injection of field gas to !
maintain the gas lift capability.
2.2.2. Rotary compressors
The types of rotary compressors most frequently employed in the petroleum
industry are as follows :
. Lobe compressors (“ROOTS” type) . Screw compressors
. The reliability factor is generally higher than reciprocating machines. ’
. tVRoots” type compressors are used where a high flow rate with a relatively
low-pressure is required.
. Screw compressors are sometimes used in low flow gas service or for
insirument and service air for installations of small to medium size. /
TE
0 6.
2.2.3. Centrifugal compressors
. These Centrifugal compressors have become very popular offering more
power per unit weight and essentially vibration-free. Initial costs normally I
are less than rf:iprocating compressors but efficiency is less and utility
costs may be hi; -.r. Frequently used in the oil ar.d gas process industry. ,

c-
0:
1 .j
- .
w\ y r I TEP/DP/EXP/SUR
TOTAL 1 PROCESS ENGINEERING DESIGN MANUAL
e 2
i of
! of
ldl
f0
urn
ely
for
xe
JlY
ity
COMPRESSORS
2.2.4. Axial compressors
I Revision : 0
Date : 2l85
I - Page No :
L 73
These machines are particularly useful where p very high gas flow a
moderate pressure increase is required. Such applications remain relative1
rare in the industry, the exception being LNG plants.
23. DISCHARGE TEMPERATURE LIMITATION
. Discharge temperature is limited either for reasons of gas stability, ga
condensation or compressor (or upstream equipment) mechanical resistant
limit.
. For reciprocating compressor the maximum gas outlet temperature to be allowec
is usually between 160 to 190 ‘C.
. For centrifugal compressor used in gas and oil extraction industries the discharge
temperature is limited to 170/180 “C.
. Normally intercoolers are used to maintain temperatures within the above limits
2.4. DESIGN MARGINS
If the flow is constant, no margin, but if. the flow is coming, from a productiol
separator a margin of 10 % is recommended in order to take into account the
possible slugs at the inlet of these -production separators.
5. WEIGHT AND SIZE
For weight and size we recommend to ask the manufacturer as vendor catalogues detaj
only the size and weight of the compressor itself. As the compressor package also indudc
also the seal and lube oil console, control cabinet and sometimes the driver and gear box
The use of vendors catalogues could be misleading in estimating the installed weight.
Figure 4 could be used for a very preliminary estimation. It is established for the dr,
weight of a centrifugal compression package including :
. compressor skid (aeroderivative gas turbine + compressor)
. control room
. overhead tank (seal oil)
6. REFERENCES AND USEFUL LITERATURE
6.1. LUDWIG Volume 3 Chapter 12.
6.2. CAMPBELL Volume 2 Chapter 14
6.3. GPSA Chapter 5 1979
6.4. SSI Program

rOTAL PROCESS ENGINEERING DESIGN MANUAL Revision : o Page No :
rEP/DP/EXP/SUR- cokPYEsso3.s
Date :2/a 7.3
.--
S hX -h
i=T A- 4% --
.-.-
zu -!-
---
u m -2 -- C C
-------------------- -----------
I II
3 E
) ----------------- -------- B-w--
- -
X . -
E
2”
- - . - - e - - - -w - - - - - - - - - - - - - - - - - - - - -
I II
I .- E : __._._- --------------------------
- . - - - - - - - - m m - - - - - - - - - - - - - - - - - - - -
L
m - - - - e - - - - - - - - - - - - - - - - - - - - - - - - -
_______- ----------------------.-

. . > 7.G
OPERATlNC CONDITIONS
SUCTION PRESSURE Pl = 6 ;;; 2 DISCHARGE PRESSURE P2 = ‘Y-
SUCTION TEMP. Tl= 46 C =3lq K
SUCTION FLOW ’ W =~OOooO KG/H
ACTUAL VOL FLOW V = 12.400 M3/H
PRESSURE RATIO PZ/Pl = 2.33
MW= 32.34.
GAS DENSITY AT SUCTION = 7-73 KG/M3
STEP
1. GAS PROPERTIES
2. POLYTROPIC EFFlCIENCY
3. AVERAGE d = MCP/MCP-1.99
4. DISCHARGE TEMP
5. DETERMINE 2 AVG SUCT DISCH AVG
6. CALCULATE GAS HORSEPOWE
GHP=2*R+W4~*(T2-Tl)
MW l 3600 l (I- 1)
7. CALC SHAFT HORSEPOWER
PS = GHP * (1 - F/100) + l/7 m
8. ESTIMATE DRIVER POWER
ELECTRIC MOTOR PS + K GAS TURBINE PS l (1.14 + K)
9. ESTIMATED PACKAGE WEIGHT
COMPRESSOR-DRIVER-LUBE
PC = 44.11 BAR A TC = 241 K
If = O.%O
S= 1-l s
l-2 = 366 K = q3 ‘c.
TZ r cc6 ‘c OK /
Zl = 6*4&S I 22 . = 0.4508 Z = o-458
SEE FIG. 2
ESTIMATE T2 k-c)
REPEAT STEP 3-4 IF T2 IS DIFFERENT FROM ONE USED IN STEP 3
,
GHP = \c=iQ KW R = 8.314 KJ/KGMOLE
PS = \6S5 KW
F TM GHP<SOO K W 5.0 .96 800010 MW 7.5 -97
>lOMW 10 .98
PO = (403 PO =
KW KW
K = 1.15 K = 0.02 TO 0.04 WITH
GEARBOX
M = @do= KG (SEE FIG 4)
NOTES
NOTES :
PROCESS CALCULATION SHkET
CENTRIFUGAL OR AXIAL ITEM :. EK*PLc COMPRESSOR MO :

OPERATING CONDITIONS 7.5
SUCTION PRESSURE PI = 6 DISCHARGE PRESSURE P2 = I+
PRESSURE RATIO = g = 2.33
SUCTION TEMP Tl= 46 ‘C = 719 K
rMW = St.%-
SUCTION FLOW w = L co oco ACTUAL VOLUMETRIC
FLOW v = It400
kg/hr
m3/h
DENSITY AT SUCTION CONDITIONS = 7.33 kg/m3
STEP
1. GAS PROPERTIES
2. AVERAGE ‘d = MCp/MCp - 1.99
3. CALCULATE DISCHARGE TEMP
0
I-I = Tlx E-%-
4. DETERIL!INE OVERALL EFFICIENCY
5. CALCULATE GAS HORSEPOWER
GHP = RxWx I x (T2 - T1) ,MW x3600x I- 1
6. CALCULATE SHAFT HORSEPOWER
PS = GHP/f x 7 g
7. CALCULATE DRIVER POWER
Electrical (Motor PO = 1.15 x PS
8. ESTIMATED WEIGHT
NOTES :
T2 = 362
= 59
GHP = 23e&
PS =
30%
PO =3qso
i+-=o
K bar i
kW
kW
NOTES
Repeat 2 - 3 if T2 differ ‘5
from that used in STEP 2
See Fig 3
R = 8.314 klkgmole
f = 0.96 to r).97
.
PROCESS C,~.LCULATlON SHEET
ITEM : RECIPROCATING COMPRESSOR Exlu?‘_
NO :

TOTAL 1 PROCESS ENGINEERING DESIGN MANUAL I
Revision : 0 Page No :
TEP/DP/EXP/SUR
i
-w-w---- -------w-q
ROTART CWCnLsoRs
(VOLUYETRIC)
I
;
:
i
- :
I
I I
. 1
CL*lIIIfUQALfIYs I I
I An0 l LOVLRS
/
_ I
I
I I
I I
1m la00 10 om lwQ0
ACTUAL SUCIION f LOW ( u)w[
FIG. 1 CEWERAL RANGES OF APPLICATION FOR DIFFERENT CDYPRESSOR TYPES

”
PROCESS ENGINEERING DESIGN MANUAL Revision : 0
CWPRESSORS
TEP/DP/EXP/SUR Date : ~/es
0.79
Page No : c 7.a
r 1
DRY WEIGHT ESTIMATE FOR CENTRIFUGAL COMPRESSOk PACKAGE
--py .: : _..;‘I- .- i . . . . 1’._ .- :I__.:-..;--,.. _ : f; :-z.y -t ::: :-- z-- .-::..
- So -.=
. 7. ; -~*.++:B.~.. --.-.v 7,::
_._.-.

C
TOTAL PROCESS ENGINEERING DESIGN MANUAL Revision : be No :
TEP/DP/EXP/SUR Date : 2f8S
.
8, EXPANDERS

1. APPLICABILITY
. I ,
.TOTAL PROCESS ENGINEERING DESIGN MANUAL Revision : o
EXPANDERS
TEP/DP/EXP/SUR Date bf85
I
For-both the feasibility study and a pre-project study the engineer will be required to fill in 1
a process data sheet with the basic information and to estimate the expander horsepower.
Outlet conditions and horsepower estimation can be calculated accurately by computer. ;
iiand caks for pure component systems using a COLLIER diagram are OK.
2, DESCRIPTION AND GUIDELINE NOTES
. The turbo-expander is a mechanical device which is designed according to the laws of I j t
thermodynamics and aerodynamics. It removes energy from a process gas which results
in a drop in pressure and temperature of the gas. The energy removed is converter’ *-o
mechanical energy which is most often used to drive a single stage compressor. \,
- Turbo-expanders could be used for :
cryogenic pressure let down C2 recovery I /
. . /
. dew point control . ethylene processing, etc...
C3/C4 recovery I I . /
. Thermodynamical principal. See Figure 1.
. Expanders efficiency
The expander efficiency is the ratio of the actual energy removed to the maximum
theoretical energy on Figure I :
1 = HB HA
HBl HA
Expander efficiency depends on :
- maSs flow rate - discharge pressure
- inlet pressure - gas composition
- inlet temperature - speed
Generally a value of 80-85 % can be used for estimation purposes. See Figure 2.
. Liquid content at the outlet of the expander varies from 10 to 30 % (weight)
. inlet gas must be free of solid particles and water (ice formation is prohibited).
. ,Maximum horsepower of the manufactured turbo expanders is about 12 000 HP. This
figure should not however be considered as a limit.
. Turbo expanders can be used in series.
. Efficiency is affected by the variation of the design flow rate See Figure 3 ior an
estimation.

I AC , I I
I
I I 1
TOTAL PROCESS ENGINEERING DE%N MANUAL Revision : 0 EXPANDERS
Page NO :
TEP/DP/EXP/SlJR Date 2/85 8.2
3. REFERENCES AND USEFUL LITERATURE
CAMPBELL VOLUME II
Engineer’s guide to turbo expanders
Turbo expander applications in
natural gas processing
What you need to know about gas
expanders
Turbo expanders offer processors
a way to conserve energy
Use expander cycles for LPG
recovery
VENDOR DOCUMENTATION
.
HYDROCARBON PROCESSING APRIL 1970
Page 97...
JOURNAL OF PETROLEUM TECHNOLOGY
iMay 1976 Page 611 etc...
HYDROCARBON PROCESSING
February 1970 page 105...
THE OIL AND GAS JOURNAL
Jan. 23, 1978 page 63...
HYDROCARBON PROCESSING Dec. 1974
Page 89...
I.e. : ROTOFLOW, MAFI-TRENCH..;

PRESSURE FIGURE 1
PA
PB
. .
t
TOTAL PROCESS ENGINEERING DESIGN MANUAL Revision : (\ Page No :
EXPANDE-SS TEP/DP/EXP/SUR Date : 2/nS 8.3
“f3l “B “A ENTHALi’Y
PA inlet pressure TA Inlet temperature HA Inlet enthafpy
PB outlet prasure TB Outlet temperature HB Outlet enthalpy
TBl Outlet theoretical HB, Outlet theoretical enthalpy temperature
FIGURE 2
85
i:: 82 81 80 79 78
APROXIMATE PLANT FLOW RATE MMSCFD
FIGURE 3
ESTIMATED PERFORMANCE AS A FUNCTION OF DESIGN FLOW RATE
PERCENT OF DESIGN FLOW RATE

TOTAL TEP/DP/EXP/SUR
PROCESS ENGINEERING DESIGN MANUAL Revision :
Date : 2J82
.
9, FLARE SYSTEMS
Page ‘NO :
i

TOTAL PROCESS ENGINEERING DESIGN MANUAL Revision : O
TEP/DP/EXP/SUR FLARE SYSTEM Date . : 2,85
1. APPLICABILITY
For the feasibility and preproject studies , a detailed design of the flare system is not
needed. Required information for either study will include ;
I , . Evaluation of number and levels of flare system I 8 I
. Determination of maximum relieving (and hence flare design capacity)
. Flare KO drum Design I’
. Estimation of height of flare stack or boom length and type of tip required
. PSV sizing (not always required, depends on project). I I
For further more detailed specification and design requirements consult the CFP
DESIGN GUIDE ON FLARES-VENTS-RELIEF AND l3LOU’DOU’N SYSTEXS. I
2. DEFINITIONS (see section 3 in DESIGN GUIDE)
- Relief system :
- Blowdown system
- Flare system
- Vent system
- Design pressure
- Set pressure
- Accumulation
includes any pressure relief valve/rupture disc downstream piping
and liquid separator
includes any depressuring valve, downstream piping and separator
(normally the pressure relief and depressuring systems utilize
common piping and separator)
a system which ensures the combustion of hydrocarbons
the release of hydrocarbons to the atmosphere without
combustion
the pressure used to design the vessel and calculate the J
thickness (see section 1.0.)
the pressure at which a safety device is adjusted to open under
service conditions. Usu‘ally equal to the Design Pressure
maximum allowable increase in vessel pressure during discharge
through the safety device. Normal accumulation is 10 % but 20 %
is allowed for external fire due to hydrocarbon liquids. For HC gas
fires an accumulation of 5 96 is recommended.
3. FLARE SYSTEM ANALYSIS AND GUIDELINES
This section details how to determine the number and levels of tne required flare system for
a feasibility or preproject srudy and other guidelines.
. A sysrem of irems of f iipment and piping can be protected against overpressure most
economically by consir ~g it a~ a single unit when calculating the relieving capacity

’ ‘TOTAL r iI TEP/DP/EXP/SUR
:
PROCESS ENGlNEERlNG DESIGN MANUAL Revision : 0 Page NO :
FLARE SYSTEM Date :2/8S 9-2
. Block valves should not be present in the system so as to isolate ‘a unit from its
relieving point- Special cases may warrant a car-sealed open or locked valve. However
such arrangements should be avoided if possible .
. Interconnecting piping should be of adequate size and not subjecr 10 plugging. q-he
system should not be of such a size that two separate systems would be more
economical
. ln specifying the design pressure of the individual items and safety valve setting there
are two approaches
- Set the design pressure of each item independently. Then specify safety valve
settings to protect the weakest link in the group of items
- Study the items as a single system initially. This is preferable as it avoids having an
unexpected “weak link” limit the operating conditions.
. Consideration should be given to possible abnormal conditions viz :
- Light hydrocarbon systems can reach low temperatures during depressurization
- Heat exchange trains may be bypassed resulting in higher than normal downstream
temperatures
- Failure of cooling medium can cause excessive downstream temperatures
- Production separators may have a varying feed temperature, especially offshore.
. It is often required or beneficial to provide two or more separate piping systems from
the items of equipment to the flare system eg : high and low temperature headers.
Consideration should be given to the following
- Relief gases below 0°C must be kept apart from warm moist gases to prevent
formation of ice within the flarelines. This could cause a system plug up
- Segregated systems may be economically desirable to minimize the extent of low
temperature piping
- By segregatrng the flows from high and low pressure sources into two separate flare
systems greater use of the high pressure drops can be achieved without imposing
severe backpressures on the low pressure systems
- The molecular composltion of some streams may warrant their segregation from
other streams. e g moist CO2 or H2S is corrosive. It may be cheaper to fabricate a
second smaller vent system to handle these rather than fabricate the entire system
in corrosion resistant material.

TOTAL PROCESS ENGINEERING DESIGN MANUAL Revision : 0
TEP/DP/EXP/SUR FLARE SYSTEM
Date : 2/85 L
Page No :
9.3
Determination of the flare system and level can be summarized in the following step by stel
analysis.
1. Does the facility contain process areas with distinct pressure levels eg : HP compression
LP compression ; atmospheric separation ?
If so, consider two or more flare levels if sufficient limitation is imposed by the LF
section
2. Does gas exist at high pressure that on depressuring will fall to below 0 “C. If so, it must
be segregated from warm relief gas. If the temperature falls below - 29°C may have tc
consider low temperature steel headers
3. Identify any corrosive relief sources and consider if need to pipe up separately
4. Is a vent system required for tank breathers, regeneration vents etc...
5. Identify on the PFDW the set pressures of each PSV anticipated and consequently its
maximum allowable backpressure (MABP usually 10 % of set pressure). Locate the “weak
links” in the process i.e. : the low design pressure vessels. If only 1 or ,2 exist within the
system consider installing balanced relief valves (MABP = 40 % set) so as to incorporate
them into a higher pressure flare system, or even alter the design pressure of the weak
links to acheive the same. This may be more economical than specifying two flare levels.
Having determined the configuration of the flare system, it is necessary to size the main
headers only and the flareline itself. For this, an idea of the maximum relief load generated
will be required. For the studies a full “risk analysis” of upset conditions is not necessary
neither is a listing of every relief load and conditions.
The sizing case of the flare system can usually be judged by inspection. Invariably, the
largest vent flow will be a full flow relief off the first separator or compression drum or a
total electricai failure. This may be supplemented by a simultaneous depressurization of a
compressor or equipment loops resulting in a flare design flow higher than the normal plant
throughput. Generally fire generated loads do not dictate the sizing of the flare system, but
may influence the sizing of laterals and subheaders. A certain degree of experience will help
in identifying the possible one or two cases that will size the flare system without having to
perform a full plant risk analysis.
In some cases, the resulting flaring loads may be minimised by using ESD isolation valves or
automatic controls to start back-up equipment.
/ I /
I
I I I
I 1
!
I
I
I I
I
I
/ / / I
I

I FLARE SYSTEM . TEP/DP/EXP/SUR
I Date :2/85
I 9.4
TOTAL 1 PROCESS ENGINEERING DESIGN MANUAL I
Revision : 0 ( Page NJ
4. HEADER SIZING : STACK AND TIP CHOICE
In order to estimate the main flareline and header sizes based on backpressures, 3 pieces of . information are required :
- Design flowrate temperature ,MW
- Length of flareboom or height of stack
- Type of tip and stack to be used.
4-l. DESIGN FLOWRATE TEMPERATURE AND MW
This has already been determined from the previous section.
42 TYPE OF TIP + STACK TO BE USED (see section 10 in Flare Design Manual)
The choice of stack and tip type will obviously be dictated by the location of the
plant under design.
For onshore plants in remote areas it -is usually sufficient to use a remote vertical
stack with a conventional pipeflare tip. The height of the stack will be determined
by the radiation limitation on the designated sterile area round the stack. For non
occupied areas, this figure could be high as 5000 BTU/h.ftZ (15 700 W/m21 resulting
in a short stack height. For cases where high flaring loads still result in a tall stack,
a further reduction in height can be achieved by using a Coanda/Indair or similar
type high pressure sonic flare tip (see section 10 in FLARE DESIGN MANUAL for
discussion of each tip type).
Offshore the choice is somewhat more complex in choosing between a remote
vertical flare or similar, or an integral 45” mounted boom flare or even on board
vertical stack. The decision between these is more often than not governed by
economics, structural considerations and specif its pertainent to each platform
location eg : water depth. Generally, however sonic flare tips are used where
pressure levels allow (2-5 bars) at the tip entry in order to reduce stack/boom
lengths, by reducing radiation levels, and associated support structure weights.
4.3. FLAREBOOM - FLARE STACK SIZING
The flareboom or stack (hereafter termed flare) length is determined by the
maximum allowable thermal radiation tolerable on the platform or surrounding area.
A detailed calculation of this value for vertical or inclined flares on or offshore
under a variety of wind conditions and temperatures can be performed using the
computer program SUPERFLARE. For feasibility and preprojects, however an
estimate of radiation level can be determined using the method as detailed in
AP 521. See Appendix 1.

OESlGN MANUAL
TEP/DP/EXP/SUR FLARE SYSTEM
Recommended Radiation levels are given below :
Condition I Allowable I 1
I radiation I Exposure
I 6tu/h.ft2 I period I
’ :
I I
I I
I Areas where personnel may be I I located and expected to per- I I form their duties continuously I I i I I Areas where personnel may be i I located from which escape is I
; possible and shelter is
attainable
1000
2000
I I I I I Infinite I
I f I I I
I f 1 minute I ‘>
I I 1
I I
I I i I I I I
* )I
I I
i I
_I I
I Areas where personnel are not i 5000 t 0 I I permitted during operation I I I ”
I Areas where equipment is I 3000 i 5 seconds i located and personnei are not I I I normally present during ope- I (Emergency I 1 ration, but if present im- I flaring only) ; mediate shelter is available I I
I I
I I I I
I i
t I
I Helideck I 1000 I i I I I
The above figures are maximum allowable radiation intensities inclusive of solar
radiation ( 250 BTU/hr ft2).
It should be noted that the following recommended values of F - Fraction of heat
radiated and math numbers at the tin.
I a) Pioe flare
Low MW gas F = 0.2 :
Ethane F= 0.25 Velocities - max at design relief = 0.5 M I
Propane F = 0.3 - normal continuous = 0.2 M
I i
b) Indair/Coanda
All gases F = 0.1 IMach 1 I
c) ,ttardair F = 0.05 . :Mach 1
Having calculated the flare length based on radiation analysis and established both
the design flare fates and tip type the main header can now be sized. I

1
1
! ’
. I . .
.
I :
I
I i
I 1
I :
I
PROCESS ENGINEERING DESIGN MANUAL
TEP/DP/EXP/SUR
4.4. HEADER SIZING
The major criteria governing the sizing of the header Fe backpressure and gas
velocity. Flare headers must be both large enough to prevent excessive backpressure
on the plant safety valves and to limit gas velocity and noise to acceptable levels.
Sizing procedure
1) Identify “weak link” with respect to MABP on safety values. (this should have
been done when determining the levels of relief). This is the maximum upstream
pressure tolerable in the system.
2) Calculate the A P across the flare tip for the relief design flow. For sonic type
tips the backpressure will be 2.0 to 5.0 barg depending on load.
For pipeflare tips use : Flare tip 0.5 - 2.0 psi (0.034 - 0.14 bar)
Fluid seal 0.2 - 0.5 psi (0.014 - 0.034 bar)
Molecular seal 0.5 - 1.0 psi (0.034 - 0.07 bar)
3) Estimate the equivalent length of piping from the tip to the flare KO drum.
(Allow generous margins, flare headers are complex and rarely*straight).
4) Calculate the sonic velocity of the relief gas
V sonic K = CP/CV T=K
This will give a first estimate of required pipe id based on maximum relief flow.
The stack diameter should be one or two sizes less than the tip diameter. LIMIT
VELOCITY IN STACK TO 0.85 IM;AT DESlCN FLOW. Ifi I
5) Using the estimated D calculate the A P from tip to flare KO drum. The Conison
equation is recommended for isothermal flow :
6 =Pf + u; P2
(
fL -5 39.4 tin uz
>
x 10
V2 d + Ul
Where : 1 = upstream conditions f = moody friction factor
2 = downstream L = equivalent length m
P = pressure bar (a) d = pipe id inchs
lJ = veloclry m/s
V = specific vol m3/kg
This calculation requires a degree of trial and error as ul = f (p1)

TOTAL PROCESS ENGINEERING DESIGN MANUAL Revision : 0 Page No :
FLARE SYSTEM
TEP/DP/EXP/SUR Date : 2/85 9.7
6) Examine the PI (talc) at the relief drum and decide if the stack + header diamete
is adequate ie is PI (talc) drum approaching the maximum upstream pressure
allowable at the plant ? if so increase the diameter and repeat the AP talc.
7)Once satisfied with the drum-tip line proceed back up the flare header ant
calculate the next section of line diameter.
8) Continue along the headers, adjusting flowrates as necessary if sources disappear
until the “weak link” criteria has been satisfied.
9) If the project requires sub headers and laterals can be estimated from the main line
static backpressures calculated above.
EXAMPLE :
> ‘< l-2 b+
‘I
1. Flare design is based on vent flow from source (1)
2. Weak link in system is set by PSV at source (2)
3. System must be designed for a design flow from source (I) not giving 2
backp,ressure at point (3) of more than 1.2 barg.
4. Size line from tip to drum (L = 150 m) to give P drum 0,5 barg (say) size line
from drum to point (3) (L = 100 m) to give Pl < 1.2 barg.
5. Check that source (1) can flow from (1) to (3) with pressure drop available.
1
1
I
I
I
-

’ TOTAL PROCESS ENGINEERING DESIGN MANUAL Revision : 0 Page NO :
TEP/DP/EXP/SUR FLARE SYSTEM
Date : Z/85 9.8 I
I
I
I
‘I
i
I
I
I
I
1
I
I
I
I
NOTE : 1)
2)
. 3)
Laterals ---> sub headers ---> headers must increase in diameter
as the system progresses to the tip. ,
Max velocity in a line is (MACH 0.7 for short duration reliefs only.
When calculating A P for flare systems isothermal flow is
assumed for each section. For high source pressures with low ,MU’
a A T vs d P profile will yield more accurate results, i.e. adjust
temp at specific points in the system to account for A P
occured.
5. FLARE KO DRUM SIZING
A flare KO drum is provided to drop out and collect the liquid part of the flare vapours in
c\rder to :
- prevent liquid accumulation at the base of the flare boom or tower
- to minimize the risk of burning liquid (golden rain) emerging from the tip and falling on
personnel
- to recover and reclaim valuable product materials. I
5.1. DESIGN CONSIDERATIONS
- separate knock out drums are generally required for each level of flare system
installed i.e. . * an HP KO drum, LP KO drum, LLP drum
- cold vapour lines (i.e. < 0°C) can be introduced immediately upstream of inlet
line to a “warm” drum providing the resultant temperature in the drum does not
call below design. This precludes the need for two independant drums.
- FLARE KO DRUMS SHOULD BE HORIZONTAL AT ALL TIMES.
- Mist eliminators are not to be installed. Min design pressure of drum is
3.5 bar (g)
- Heating coils should be installed in flare KO drums to prevent freezing of
residual liquids. Typical is to maintain a T min = 4°C
- LIQUID DROPLET SIZE (per API 521)
Recommended particle sizes are :
VERTlCAL FLARE 150 (offshore)
INCLINED BOOM > 45” ‘150 ”
< 450 400 ”
REMOTE FLARES 600

TOTAL PROCESS ENGINEERING DESIGN MANUAL Revision : o Page No :
i TEP/DP/EXP/SUR
FLARE SYSTEM Dare : 2,85
9.9
5.2. DRUM SIZING
Based on the above design considerations the flare KO drum can be sized using the
method outlined in section 2.0. VESSEL DE.SIG,\I.
For a flare KO drum, the normal liquid level should be kept in the lower part of the
drum i.e. : utilise as much space as possible for the vapor-liquid de-entrainment. If a
large diameter drum results consider using a split flow arrangement with the exist
nozzles mounted on the head. This will maximise the L/D ratio and give a smaller
highter drum. This is especially useful offshore where weight + space are a major
concern.
An LCHH will normally be installed in the flare drum to initiate a plant shutdown ’ .
wellhead shut in offshore).
6.0. RELIEF DEVICE SIZING (For more detail see API 520, 521) -
6-l. GENERAL
- Safety valves are either termed balanced or conventional depending upon the
backpressure limitation
- Rupture discs are less robust than an equivalent safety valve and cannot be relied
on to function accurately. It is recommended that rupture discs are avoided
6.2. BACKPRESSURE
- Backpressure exists in two forms :
. flowing backpressure is the pressure on the discharge side of a PSV that is
blowing off to the relief system
. superimposed backpressure, or static backpressure is the pressure on the
discharge side of a PSV caused by another relief source in the system venting to
flare
- For conventional valves the ,Maximum Allowable Backpressure (MABP) for either
superimposed or flowing is 10 %. For balanced relief valves up to 40 % can be
allowed for without a reduction in the valve capacity.
6.3. LIQUID RELIEF
The formula for sizing liquid-relief valves is :
A = gpm
27.2 Kp. K,. K, ins
a
,

PROCESS ENGlNEERtNG DESIGN MANUAL
FLARE SYSTEM
4; TEP/DP/EXP/SUR Date : 2185 9.10 *
9 ,/-
I the ’ I
h
e
i:
I f
tc
?f
)e
Where :
A = Effective discharge area, ins2 .
gpm = Flowrate, U.S. gallons/min
c = Specific gravity at flowing temperature
Kp = Capacity correction factor (from figure 6.5)
Pd = Relieving pressure minus constant back pressure
K, = Capacity correction factor (from figure 6.4)
K, = Viscosity correction factor (from figure 6.3.)
6.4. VAPOR RELIEF
The formula for sizing vapor relief is :
W Ti! A=
c K pl Kb r- 1M
Where :
w = Relief flow, lbs/h i = Compressibility factor
T = Inlet vapor temperature, “R
c = Coefficient (from figure 6.1, 6.2)
K = Coefficient of discharge (0.975 unless vendor data available)
PI = Upstream pressure, psia. Set pressure 1.1 for blocked outlet, CV failure
or 1.2 for fire .plus 14.7 psia
Kb = Capacity correction factor (from figure 6.6)
M = Molecular weight of the vapour
6.5. RELIEF FOR GAS EXPANSION DUE TO FIRE
A= As & 0.1406 Tl.25
F’ = CK T0.65G6
A = effective discharge area of valve ins2 T = 1560-T
A, = exposed surface area of vessel ft2 T = temp. at relief
pressure .“R
6.6. STEAM RELIEF
U’ 1 A= ir\s
50 PI Ksh

TOTAL 1 PROCESS ENGINEERING DESIGN MANUAL I
Revision : 0 I
Page No :
I . FLARE SYSTEM
TEP/DP/EXP/SUR I
Date : 2/85 9.11
PI = Set pressure x 1.03. (ASIME Power)
or 1.1. (ASME Unfired vessels)
Ksh - superheat correction factor table 6. I.
6.7. STANDARD RELIEF VALVE ORIFICE SIZES
The following table may be used for estimating the relief.valve size based upon the
effective discharge areas calculated as in paragraphs 6.3. through 6.6.
Orif ice letter
D 0.110
E 0.196
F 0.307
G 0.503
H 0.785
J 1.287
K 1.838
L 2.853
M 3.600
N 4.340
P 6.379
Q 11.045
R 16.000
-r 26.000
Nozzle
Effective Area
sq. inches
Normal size
Designation
lD2
lE2
1 l/2 F2+
2C3’
2H3
253 or 3J4* ,
3K4 or 3K6
3L4 or 4L6
CM6
4N6
4P6
648
6R8 or 6R10
ST10
l Avoid using 2 l/2 inch outlet flanges (F and C orifices)
. ’ l * Avoid using 2 L/2 inch inlet flange (3 orifice)

TOTAL PROCESS ENGINEERING DEStGN MANUAL Revision : 0
FLARE SYSTEM TEP/DP/EXP/SlJR Date : 2f85
.
I Page No :
1 9.12
REFERENCES + LITERAIURE
.
7.1. DESIGN GUIDE Flares-Vents-Relief and Blowdown systems
CFP MAY 1984 - TEP/DP/EXP
7.2. API 520 AP1 i4c
API 521 API I4E .
7.3. Det Norske Veritas : T&hnical Notes fixed offshore installations
Norweigen Petroleum Directorate : Guidelines for safety evaluations of platforn
conceptual designs.
no 259 x7 301 124
311 350 MI 170 379
311 396 a3 409 416
A?2 411 UI 470 419
SlO Y6 574 597 bI9
617 670 697
0.99 0.91 0.97 0.96 0.95 0.94 0.93 0.92 a.91 0.90 0.19 011
447
452 465 47s 49J $12
z: 591
- -
II5 341 157 170 315
39s 405 41s 421 411
uo 445 4Sl
2
470 410 492 III S10
551 SI?
2: c17
665 690 7,)
415 440 466 425 4sO 47J 415 415 460 UJ 463 417 450 470 492
4% 47s 497 461 410 470 415 2: 475 490 SI? 4IO 49s 510
415 :z J20 496 510 R 513
si, it: z $70
570 NJ 597 I91 608 620 620 630 640
U? 653 660 670 Z
z 467 472 471
492 492 493 49s 497
iI 490 497
ii:
JO0 $05 510 JI6 J13
JSO $11
3;
610 611 65s 676 692
615 64s
ii: 704
701 719 713 742 751 761
173
iii 516 590
593 602 b10 625 6II
661 6II 710 721 743
757 710 7VJ
J9S
:F: JIO 510
110 JII 315 II6 590
91 5%
E (46
610 611 6X
:9
uo 705 7:s 744 759
771 795 II

TOTAL TEP/DP/EXP/SUR
. I . . .
PROCESS ENGINEERING DESIGN MANUAL Revision : 0 Page No :
FLP.RE ANQ RELIEF
Date :2/8S 9.13

TOTAL 1 PROCESS ENGINEERING DESIGN MANUAL
I FLARE AND RELIEF TiP/DP/EXP/SUR
Revision : 0 Page No :
Date : 2/85 9.14
0.6
0.4
R = REYNOLDS NUMBER
8ACK PRESSURE. PSG v. GIGE BACK PCIESJURE = sET PREUUaE ps,c I 100
~JOTF: The above curve rcprcxnts a compromise of the values recommcndcd by a number of rcl~cf.valve manufaclurcfr. This curve may k used when the mate of the valve is not known. When the make IS known. the manufacturer should bc consulted for the corrcct,on factor.
Figure 6.4 -v ariable or Constant Back-Pressure Siting
.Focror I(. for’ 25 Percenl Overpressure on
Balanced Btllowr Safety-Relief Valves
(Liquids Only)
I I I
0 s IO IS 20 25 30 35 rg 45 50 PERCENT OvERPRESSuRE
NOTE: The above curve show that up to and including 3 per cent overprcssurc. capacity is rllcc~cd by tbc change m lift. th change in orifice dinhrrre cocficicnt. and the change in over pressure. Above 2S prcenr. capacity is rffccrcd only by th change in overprenure. Valves operating at low ovcrprc~~ure~ tend IO ‘chatter”: Ihcrc fore. Overpras~rer of less than IO pcrccnl should be avotdcc
figure G 5 .C opacity Correction Foctorr Due to Over
pressure for Relief and Safety-Retie Valves ir. Liquid Service
--. -

TOTAL f PROCESS ENGINEERING DESIGN MANUAL I
Revision : 0 I
Page No :
I ,
FLARE AfJD RELIEF TEP/DP/EXP/SUR
I Date : 2/85 I 9.15
0.80
0.60
’ , I,. I
0.50. . 0 5 IO I5 20 2s 30 35 40 4s 50
BACK PRESSURE, PSlG x ,oo % GAGE BACK PREWJRE = SET PRESSURE ps,c
.
ore: The above curies represent a compromise of the valuer recommended by a number of relief valve manufacturers and may urcd when the make of valve or the actual critical-flow pressure point for the vapor or gas is unknown. When the make is
mown the manufacturer should be consulted for the correcrion faCfOr. TheA curves are for set pressures of SO pounds per square inch gage and above. They arc limited IO back pressure below critvzal-
)w pressure for a given set pressure. For subcritical-tlow back pressures bclo~ SO pounds per square inch gage. the manufacturer IUS~ be consulted for the values of Ke
igvre d.6a-VariobIe or Constant Back-Pressure Sizing Factor K. for Bolonccd Beii~ws Safety-Relief Valves (Vo-
pars and Gases)
0.8
0.6
0.4
0.2
I
0 1 4 ’
,.
0 IO 20 30 40 SO 60 70 80 90 100
Q/O ABSOLUTE BACK PRESSURE = - BACK PRESSURE, PSIA
SET PRESSURE + OVERPRESSURE. PSIA ’ loo =” loo
F igurt C*6LC onstonc Bock Pressure Sixing FOCIO~ K+. For Conventional Safety-Relief Valves (Vapors ond Cares
Only)

APPENDIX A
SAMPLE CALCULATIONS FOR SIZING A FLARE STACK
A.1 General Tb~r apPendi ptocnac ca~mplcr 01 Ihe Iwo methods
IoI win# 1 the ctark baud on Ihe tlltc~~ of IadibIion. The IWO melhods arc the “simple” apptoach prtunlcd in Section 4 rnd Ihc mole tpcc~fic apptorch usin) Brauc~owki rnd Sommtr’e melhod. HeiRhI and lo. cation should alu, be contidcrcd. bated on tar dir- pruon il Ihc flame I) eatinguishcd (ICC 4 4.1.4).
A.2 Exrmple 1: Sltlng I Flare Slack Ualng Ihe Simple Approach
In Iha r~amplc. Ihe basic dalr MC aa lullows~ The matercal llowtn~ II hydrwtbon vapor, 7he flow MC. W. IS IUU.WU pounds per hour (12.6 kilo~lrmc per c(c. ond). The wcagc molcculw wqhl ol Ihc rrpoo”. M. it 46 I. The llovint ~emptrr~ure. r, II 760 dcgwes Rm~hc (300 F) 1422 ktlrinc (I49 C)]. The hcaI of combuwon is 2I.w) ttrilish Ihrrmal uniIt pee pwnd (5 x IO’ kilujoulcs pc, kilqtam). Tbc ratio 01 the spccilic herIt m the gas. h. is I, I. The llowinl pte$su~e II Ihe llare lap is I4 1 podnds pet yurrc mch rbsalulc (101 ,I kiloprurls abroluIc). Ihc dcqn wind vclocily is 20 mdtr pe, hour (ZY 5 ICCI per ucond) (52.2 kilome- Ic,s pc, hour (rpptuaimalrly ll 9 mc~e,c pa wcond)]
A.2.l CALCULATION OF FLARE OlAUETEtt
The Msch numbo is dcwminrd II follu~ (UC I 4 3 I. Ilcm I).
Math
In “WI,,C um~r. Ihl, ~rantlr~cc IO:
Mach - (II bl)(lO”@ G “F
For hlrth - 0 2. Ihc ll.,c dwnrItr I, c.lculalcd ., lot Iowl:
o.2 - (It.6i)(‘o”~ (1.1)(46.1) I26 JT
d’ - 0.2U9 d - 0.46 ~CICI (Inside diamcIo)
For Mach - 0.5. the flare dinmeler is calculaIcd II fol. low:
d’ - O.lJY7 d - 0.95 fool (inside diwnclcr)
In metric unw. this ~rrnsla~ec IO:
d’ - 0 0~25 d - 0.29 meIer (inside diameter)
A.P.2 CALCULATION OF FLAME LENOTH
Tbc heal IibetaIcd. Q. In British Ihrrmal units pef hour (kilowalls). II calculrIed as fallows (we Fiauw 6A and 66):
Q-(100,~)(21,5oU) - 2.15 x IO’ BrtiIish Ihr#mll units pa hour
In mwic unilt. lhis ~~rntlatcc IO:
Q - (I2 6)(50 x IO’) - 6 3 x IO LilowaIIt
From Figures 6A and 6D. lhc ft~mc IcngIh. L. II I70 fern (52 mclcrc) (see Finwe A.1).
A.2.2 CALCUtAllON OF FLAME DISfORflON CAUSED BY WIND VELOCITY (SIMPLE CALCULATION)
The vrpor flow ,aIc I, dewmined II follows:
- 333.9 rc~ual cubic feel per wcond
In mewic unils. lhis t~rnslrtcs IO:
flow - (I2 b)(g) (g)
- 9 46 BCIUI cubic rne~ct, per tccond
WIND--.
I Q I- ----rL,,, r --------I)-----
-4 Fbutr A-l-Obnm4bnrl Mrrmur lot siring I FAIR suck
The llwnr dlrionion uusrd by wind wlociIy II c~ltu-
“‘i%$
Ilied us lollowr (ICC Figure 7): - Ill9 feet per second
$‘~
In melric unii~. thls wrn~lair~ IO:
fhc fl~rr tip CIII rclaily. U,. may be delrrmined I( lollow (ICC A.3.2 lot ~no~hrr melhod ol calculaainl
4):
Mow u,- yyjl
-i
For Mach - 0.2.
u’-$eig
- 56 9 McCoy pa second
FOI Moth - 0.5.
u’-d& 4
- 411 ICCI per second
!i P ID 2. -. ‘:
. . . .
s 0
w
77 lo t;; 5
oz . .

zy .- 0.12 ZAy - (O.S3)(52)
- 11.6 nw,era
IAl - (0.72) (II)
- 37.4 “,LlC”
XAy - (0 51)( 170)
- 90.1 ICCI
IA, - (0.72)(170)
- I21 4 ICC1
AZ.4 CALCULAllOH OF REOUIRED FLARE STACK HEIOHT
For the basis of the calculalionr in rhlc section. r&r lo 4.4.1.3. Rtfcc IO Figure A-l for dimcnrional refer.
. cnces. lhc dcrign buis is II follows: The fraction of hcrr
rathated. F. is 0.3. The hemI libcrrtcd (we A.2.2), Q. As 2.15 * IO’ British rhcwnrl uoirc per hour (6.3 x Id kilurrlts) The marlmum rllorrblc radiation. K. II 150 kcl (4J.7 mclcn) from Ihe flwc slack Is 2000 Britl#h thermal units per hour per square fool (6.3 kilowtta per squam mclcr).
In rqurtion (I) from Secllon 4, wsume t - 1.0. The disrwxc from the flame unlcr IO the Srrdc.kvcl boundary (that is. the object being considered). D. ir lhcn crlculaled II lollow
In melric unils, thir Irrnslalo lo:
- 48.9 melcn
The physkal rrrrngcmcnl shown in Figure A.1 ir ihe buir of the followinS calculations.
Al Mach - 0.2. the flare srrck hcilhr. II. is CIIN. lad .s fulluw
II' - II * HAy R’-R-H&
'261 - S9.J ICCI
C& - 1443 feel
(fee A.2.1.)
R’ - I50 - H(144.3) - 7a 14
0’.R”4 II” 160’ - 7e’ 4 tI*l
tl” - 21.600 - 6084 - 19,Slb
II’ - I40 feet
t/ - I40 - H(60) - I IO IceI
In mcltic unilt. thir lrrnrtrlcl IO:
II’- H t HAy it'-R-HAS
CAy - 18.2 mclcra
&lz - 44.2 mclen
(See A.I.1.)
R’ - al- H(44.0) - 23.7 mclcrs
D’-R”t It” 48.9' - 23.7' 4 ti”
H” - 2191.2 - X4.7 - 1829.5
H' - 42.8 mclcn
II - 42.8 - H(I8 2) - 33.1 mtltrr
AI Mach - 0 5. If ii calculated 11 follow:
tl’ - II + CIAy R’-R-HAS
EAy - 90.1 Ied
IAs - I22 4 feel *
(kc A.2.1.)
R’- HO- H(l22) - 89 feel
D’ I R” + ,,‘I
MOJ - 69’ i II”
H"-25.600-7921 - 17.679
If’ - I12 feel
ti - Ill - H(PO) - all feel
In mcrric units. this rranslaro IO:
II’ - It + Hby R’-R-Hbr
CAy - 2; 6 mcltrr
Lb - 11 4 nILlen
(kc A 1.1 )
R' - 45.7 - H(lI 4) - 27 0 mclrrs
D’- R”4 II” 4a 9’ - I7.d t n” II-‘- 1391.2 - 119
- lf162.2
II’ - 40 8 mcten
I/ - 40.1 - H(27.6) - 11 melcri

’ il
Table of Contents
1 INTRODUCTION ....................................... 1 .
2 BASIS OF THE STUDY ................................. 2 2.1 GAS COMPOSITIONS ............................... 2 2.2 COLD VENT ........ 2.3 H2S CONCENTRATION MONITORING .................................................
;
3 RESULTS _....._........__....-..-........*...--..... 4
4 DISCUSSIONS _.._.....-.-.._._...-.--...-.......--... 5
5 OPERATING EXPERIENCE ............................... 8
6 CONCLUSIONS AND RECOMMMDATIONS ................... 9
i

1 INTRODUCTION
The Welton Gathering Centre process plant is provided with an incinerator for disposal of excess associated gases and relief gases. During upsets on the incinerator e.g. fan failure or a plant initiated trip, the incinerator is isolated and the gases are disposed of through a cold vent via a bursting disc arrangement (see Fig 1).
The gases routed to th e cold vent contain high levels of HZS and adequate dilution of this component with air is therefore required during dispersion for safe disposal. The option of replacing the existing incinerator with a new and larger one, means that the cold vent would still be required. Dispersion calculations were therefore carried out by Group Environmental Services (GES), London to confirm that safe disposal of the vented gases could be achieved.
Detail6 of the atmospheric dispersion study and results are presented below. The following areas are covered :-
- basis of the study - results of the dispersion modelling. - discussions of results - operating experience with the cold vent - conclusions and recommendations
li I /
I i i !
1;
1 /
i
1:
I
I,
i
I
II

j/
I
1
I
1,
Ii
Ii
I! f /
II ’
\! !
-I I I 1
2 BASIS OF THK STUDY
The dispersion calculations were performed by Group Environmental Services (GES) in London. The basis of these calculations 1 is given in the sections following.
,
2.1 GAS COWOSITIONS
The composition of the gases that could be vented to the atmosphere can be wide ranging because :-
- the Welton G.C. receives crude from a number of wells at varying flows and varying H2S content. Hence the amount and composition of the gases normally produced varies;
- the relief gas composition which could superimpose on normal flows vary depending on the relief scenario. Accurate prediction of the relief flow and composition is not always possible.
Therefore for the dispersion calculations reported here, a number of vented gas data compositions were prepared from two sources (Table 1) :-
* . 1) TLC Oriainal Desian C!mDosltuul - these were extracted
from the Incinerator Work Pack 18, Vol. 1. They were based on the design wellfluid (C-site) and still represent the sourest gases that could be obtained from Gathering Plant HP/relief header. Calculations for the following cases were carried out -
a) Case 1 - Highest gas and HZS flows, Gas I; b) Case 2 - Lowest H2S concentration, Gas A; c) Case 3 - Lowest H2S flou6, Gas E and d) Case 4 - Lowest total flow, Gas B.
II) a preu revised s&ign ca6e~ - these are based on the Welton Upgrading design material balance and represent condition6 in the plant when production from C site is diluted by production from the less Bour wells (A and B sites). The combined.HP, LP and acid gas stream compositions were used for the dispersion calculations. The following ca6es were considered :-
a) Case 1 - based on the total of normal flows in the gas headers; b) Case 2 - startup flow based on 300 BOPD; c) Case 3 - similar to Case 2 but with twice the H2S concentration. This can be considered as starting up
2

with production from C-site. d) Case 4 - based on normal flows superimposed with fire relief flow in the gas headers.
2.2 COLD VENT
The cold vent is a 16 inch pipe erected vertically with a 6 inch top section acting as a nozzle. Detail dimensions of the cold vent as used in this dispersion study are shown in Fig 2.
Process gas is normally isolated from the cold vent by means of four bursting discs - two in use in series and two spare, as shown in Fig 1. Should these rupture, a common alarm signal is produced in the control room and the incinerator is tripped which in turn causes a general plant shutdown. Thus the duration and quantities. of the emissions is minimised.
2.3 HZS CONCENTRATION MONITORING
The following locations were selected for monitoring the HZS concentration during dispersion of gases from the cold vent :-
a) At positions in the plant above grade which could be manned, of which the following were selected :-
Crude stripper tower - 14.9 m Amine contactor - 13.6 m Crude tanks - 9.O'm Incinerator - 12.5 m
b) At grade level at various locations within the Welton Gathering Centre perimeter fence, car park and workshop areas.
c) At farm houses in the near vicinity and in particular, the Barfields farm.
The co-ordinates for these receptors are shown in Table 1.
i t ‘.
!I ‘: ,
:I !I .’
;s r j
I 1
: I : 1

3 RESULTS
Details of the results are given in a GES memo, Ref. 2 ; an extract of the results is given in this section'. The results of H2S concentrations at various locations are quoted in mg/m3. To convert these figures to ppmv then the quoted figures should be multiplied by a factor of 0.7121.
Tables 2 - 9 show the maximum ground level concentrations for a range of weather condition6 and the cases specified. The wind has been arbitrarily set to SW, so the location of the point of the maximum ground level concentration is of no significance, but the distance from source is of use.
Table 10 - 17 shows concentration at the seven sites specified for the same range of weather conditions and the same eight cases. However, in these tables, the wind direction has been deliberately chosen to place the specified site directly downwind of the vent. Thus each concentration represents the worst possible condition at each site.
The result presented in the Tables 2 - 17 are the 3 minute average concentrations at the receptors. To extrapolate the 3 minute average concentration to longer time average concentrations, the following can be applied :- ,
cx = Cp * ( 3 / TX ) **0.2
where Cx is concentration average for time TX Cp is the 3 minute average concentration TX is the new tim,e for average concentrations.
Thus, for a 15 minute average concentrations, the 3 minute average concentrations have to be multiplied by a factor oi 0.72. Similarly, for an 8 hour average concentration, the factor is 0.36. -:
For time average concentrations of less than 3 minute, the above correlation does not apply. However as a guide, a similar approximation to that made for odour nuisance investigations (where the 5 second average concentrations are relevant) can be used. Thus, to convert the 3 minute averages to 5 second averages, the results in weather category A should be multiplied by 10, and the remaining weather categories should be multiplied by 5.

4 DISCUSSIONS
This Section diScU66e6 the interpretation of the results given in the above section. It must be stressed that the interpretation of the results and inferences made here concerning the H2S level with respect to safety, occupational health and nuisance6 are mainly those of the author. Advice from Group Safety and Occupational Health was obtained verbally and is incorporated.
The following observations are made on the results :-
a) The odour threshold for H2S is d.00066 mg/m3 for 5 sec. average time. Tables 2 - 9 shows that the 3 minute average ground level concentrations (1/5th of 5 second averages for most weather categories) exceed the odour threshold. The use of the cold vent would thus result in odorous emission which would be perceived at fairly remote locations e.g. the Barfields farm, when the wind is blowing in that direction.
It is noted that there are no evidence that odorous emissions due to H2S at low level are a health hazard, but complaints relating the two may still be received.
b) The cold vent facility is provided with two bursting disc installed back to back in the duty line with a parallel spare set provided. Should these rupture, an alarm signal is produced and the incinerator.is shutdown. The latter also causes a general plant shutdown thereby minimising the amounts of emissions. The release of H2S containing gases through the cold vent is therefore restricted to the HP/Relief header depressuring,or the depressuring of the separators in the HP gas blowthrough scenario. It is not possible to quantify these periods.
c) Tables 10 - 17 show the 3 min average concentrations at the seven particular receptors specified; in all cases the odour threshold is exceeded.
If the concentrations are adjusted to give 8 hr. time interval averages by multiplying by a factor of 0.36 then in some case6 the Long Term Exposure Limit of 14 mg/m3 is exceeded. This occurs mainly at elevated receptors and in particular the crude stripper and the amine contactor/regenerator.
If the 3 min average concentration is converted to give the 15 min average value by multiplying by 0.72, then the Short Term Exposure Limit of 21 mg/m3 is also exceeded at the same receptors.
5

,
It is concluded that if cold venting were proposed as a normal operation then it would not be acceptable to BP or to environmental authorities. However, it is noted that the original design intentions were that the discharge would be of limited duration and of low probability.
d) In assessing the safety implications of the discharge, the instantaneous level of HZS perceived is relevant. It is noted that the closest approximation of this is the 3 min average concentrations which shows that at elevated levels, and in particular the top of the amine contactor/regenerator towers, concentrations in excess of 42 mg/m3 are predicted. At these levels, the HZS would cause eye and respiratory tract irritation. This is unpleasant and would be a signal for evacuating the area.
It is noted that if the 5 sec. average concentration (5 times the 3 min average concentrations in most cases) are considered, then levels in excess of 140 mg/m3 are predicted. These could cause a loss of the sense of smell and result in a loss of signal for evacuating from the affected areas. However, the levels are below 700 mg/m3 which would cause a loss of consciousness within 15 mins of exposure. It should also be noted that such duration for exposures are unlikely as explained in b) above. '
It must be noted that the effects of H2S depends on a number of variables and above limits are only for guidance. It is noted that people who are regularly exposed to even very low concentrations eventually become unable to detect the gas by smell.
e) The models used for the dispersion calculations lose their validity at distances less than 10 metres of the source. In this area, it is also noted that the mechanism for dispersion is different and low flow emissions have greater impact on the resultant ground level concentrations especially if the gaseous emissions are denser than air as in this particular case. Within this 10 meter area of the Gathering Centre is the location of the pig receivers and wax traps which may well be manned in event of the cold vent operating.
_ f) Analysis of the results given in Tables 2 - 10 shows that the dilutions resulting from cold vent dispersion increase as the flow of the emission decrease (see Fig 3) but is generally less affected by the concentration of the pollutant in the emissions. Low flOW6 would result during plant startup when plant upsets generally arise and
6

reduction of H2S content in the gas header by starting up using less sour wells would reduce the impact of cold venting during this period.
g) The concentrations of the hydrocarbons at the various receptors after dispersion has not been calculated; this can be roughly estimated from the dilutions imparted on the pollutant during dispersion. Estimated hydrocarbon concentration for two receptors ha6 been calculated for Original Design Case 1 and shown below.
i) Amine contactor, maximum H2S concentration is 50.7 mg/m3 which corresponds to a dilution of 249. Therefore, max concentration of hydrocarbon is 0.40 %.
ii) Incinerator, maximum H2S concentration is 1.9 mg/m3 which corresponds to a dilution of 6636. Therefore, max concentration of hydrocarbon is 0.02 %.
It will be seen that in both case6 the concentration6 predicted are below the Lower Flammability Level assumed 2 % (methane) for this purpose.
7

’ i P
5 OPRRATING RXPERIENCE
During commissioning of the Welton Gathering Centre plant problems were experienced with the use of graphite burst& discs which ruptured at low bursting pressure. These may have been due to fatigue caused by pulsation of gases in the HP/relief header. This was resolved by reducing pulsation from the burner and the installation of a bursting disc of composite material which has proved reliable.
After commissioning, the cold vent ha6 operated several times mainly as a result of instrument failure on the incinerator. However the production through the plant was below 50 % of the full capacity. With the recent modification6 to the incinerator, it has been possible to increase the flow through the Gathering Centre. This increase has resulted in the header pressures being close to the bursting disc pressure. This could increase the frequency of operation of the cold vent resulting from surge6 through the plant.
If the existing incinerator is replaced by a new incinerator in the next Phase of the Welton Upgrading then the design of the incinerator and the setting of the bursting disc should be such that frequency of rupture due to surges is' eliminated.

6 CONCLUSIONS AND RECOHWQiDATIONS
a) The study has concentrated on the dispersion of HZS based on a number of the Original Design and the Welton Upgrading gas compositions. It has been predicted that emissions would be odorous at ground level at short and long distances from the cold vent.
b) At elevated areas, for example, the top of the amine contactor/regenerator towers, the predicted levels of HZS are higher than the Short Term Exposure limit. It is therefore recommended that access to the elevated areas close to the cold vent be restricted. Adequate warnings should be displayed at access points of the elevated areas and DA sets must be immediately available.
c) The cold vent is located close to the incinerator and the pig receiving areas. These areas are likely to- be manned during operation of the cold vent. An audible alarm which is activated from a bursting disc failure has.therefore been installed to provide warning to personnel. Regular testing should establish that this alarm, located near incinerator control panel, provides adequate alarm near the pig I receiving area.
d) The plant licence was based on utilising the cold vent on failure of incinerator. The result6 of this study show that the emissions would be odorous and high concentrations of HZS are predicted at elevated areas'near the cold vent. It is therefore important that if operations are changed such that the design intention of utilising the cold vent is changed, then appropriate BP,authorities should be consulted.
e) Due to the higher GOR's and plant surges, it is possible that increased pressures close to the bursting disc pressures are experienced as a result of the higher gas flows. This would increase the frequency of operation of the cold vent and represents a further constraint to the maximum allowable plant throughput.
f) For the Welton Upgrading work, a number of options for. provision of additional gas disposal capacity are being investigated. Due to the potential hazardous nature of the cold vent emissions, it is recommended that preference should be given to solutions which remove the need to use a cold vent. Such a route is provided if a ground flare is selected to burnbgases on incinerator failure.
1’1 r1L
/i
9

g) In view of the complex nature of the safety and health hazard of HZS, it is recommended that an interpretation of
- the GES dispersion results reported here should be obtained from HTH, Dyce. Any changes perceived from the original intentions of the using the cold vent should be similarly addressed. s
c.t. J. Caven-Atack A.A. Croll M. Broadribb J.A. Lewis E.A. Mullin/R.W. Bride= 1058/97
10

iij z ..---- -w-v.- ------ ..--. ..~ -._
--1--1-
. ,.YnJ WI, IuwaIY, IU n -.---.- - ---
w(DLI11111, nn, Iall1 I nnn “U I’( (Iv.,** r
un -----_ A-_. -
, O’I’U nllnpl nil onwt 0 - . . ---.---.-.--_._ .-. . . I- . -,
Nl n3naMddv

I 0-n = &Do/ f*D. = s* sort+”
I IO-q-t-Be PaoPo sc0 Q-1 sficy h4 A ISSUE OATE tlESCRIPIlON DRN. CKD. ENC. :“N”t’
*ROJECl wb TITLE w bxuoba UC-Jr =ack Pr;loak
SCAlE f-s (WPS)
@ Kaldair Limited DflG. No. E -c

I ----.
I
‘n
.- -- ,--
Figure 3
[
r-
*
2 0
t ‘A >
(swosnou) SZH ~0 stdounila

TOTAL PROCESS ENGlNEERlNG DESIGN MANUAL Revision : PageNo:
TEP/DP/EXP/SUR Date : 2/8 4
.
.
10, ?IPES VALVES + FITTINGS

TOl”Ah _ PROCESS ENGINEERING OESIGN MANUAL
PROCESS AND UTILITY LINE SXZING
TEP/DP/EXP/SUR
1. APPLICABILITY
2.
3.
4.
. For a feasibility study a quick estimate of the line size will be required. <
. For a pre-project study a better estimate of the line size will be required.
. The purpose of this guide is to size only the lines in the process unit.
. For the both the fe’asibiiity and pre-project studies abaques AFTP can be used :
. “Pour le calcul des pertes de charges des liquides dans les conduites”
. “Pour le calcul des pertes de charges des gaz dans les conduites”
. The line sizing depends on the service :
. Flare lines, pipeline and riser sizing are not included on this chapter.
LIQUID LINES SIZING CRITERIA
See Table 1.
VAPOR AND STEAM LINES SIZING CRITERIA
See Table 2.
TWO PHASE FLOW LINE SIZING CRITERIA
The P
V2 criteria a stated for vapor lines to be followed with :
= PP m= W WI, WV
in kg/m3
P’ F
w = WI + WV = total flow rate in kg/hr
WI = liquid flow rate in kg/hr
WV = vapor flow rate in kg/hr
pl = liquid density in kg/m3
P’ = vapor density in kg/m3
and V = Vm = W
m.v $3600 m/s
f 4.
0i = internal diameter of the line in m. .
om and Vm are respectively the apparent density and velocity of the fluid.

io : I
-1 ,’
IUIHL r~uc;tss tNWNEERING DESlGN MANUAL
TEP/DP/EXP/SUR PROCESS AND UTILITY LINE SIZING
Revision : 0
I
Page No
Date
. The flow regime to be checked on the figure 1 for horizontal lines and on the figure 2
for vertical lines.
. For horizontal lines slug and plug flow regimes should be avoided. l
. For vertical lines slug flow regime should be avoided.
Remark : Flow chart Fig. 1 and 2 are based on author’s experimental results.
5. PRESSURE DROP CALCULATIONS
5.1. MONOPHASIS FLUID (GAS OR LIQUID)
5.1.1. “ABAQUES AFTP” could be used with the correction of the line diameter
such as indicated on these ABAQUES.
5.1.2. Method using MOODY or “regular” Fanning friction factors.
a. Calculate Reynolds number
Re = @i,Pv =
r”, 0i = line internal diameter in mm
Pe = fluid dynamic viscosity in Cpo
P = fluid density in kg/m3 Re is a dimensionless number
v = velocity in m/s
b. Determine the.relative roughness : See Figure 3 4 E = D
c. Determine f = friction factor : See Figure 4 -+ f =
i 2 d. ,.P=fxlOCx PV f v bar/100 m
T 2gx10.2= 4%
5.2. TWO PHASE FLUID
Many correlations exist to calculate the pressure drop for two phases flow,
depending of the vertical or horizontal line, ratio of vapor/liquid and pressure anc
temperature conditions. That is out of scope of this guide and we mention only some
authors : POETTMAN/CARPENTER FLANIGAN
EATON . BEGGS/BRILL
LOCKHART/MARTINELLE TAITEL/DUCKLER
quick methods for an estimation are as follows :

p ,\ ? t TOTAL .
-:,L,-.R ,.1p., PRO&S ENGINEERiN’C&SIGN MANUAL ‘Revision : 0 Page IJo :
I PROCESS AND UTILITY LINE SIZING
TEPIDP/EXf’/SUR I Date : 2/8 10.3
X2.1. “ABAQUE AFTP” for gas could be used with the correction of the lir
diameter. Takin as defined in 5 4 and the liquid viscosity as the fluid viscosity
5.2.2. Method using MOODY or “regular” fanning friction factors. ’
It is the same method as on 5 5.1.2. withy =pm and V = Vm as defined on g
and the fluid viscosity taken as the liquid viscosity.
5.2-j. A more detailed method using the Lockhart cvartinelli method
section I1 .O PIPELINES.
6. NOTES
. Tubes dimensions are standard and an example is given on Table 3.
is g iven i
. With “ABAQUE AFTP” the correction for the internal diametar must be done and a
estimation of the line thickness could be done with the following formula used mainly fc
high pressure. ’
e = thickness mm Y = coefficient having values for ferritic steels
P = Design pressure bar g 0e = external diameter inch
s = allowable stress bar c = corrosion allowance mm
E = longitudial weld joint factor
5, E and Y are not always available so the following formular could be used for 7
estimation.
e= P&f +c K
e = thickness in mm c = corrosion allowance in mm
P = design pressure in bar g K = 43 for carbon steel and low temperature
carbon steel
0e = external diameter in inch 54 for 3.5 % Ni and stainless steel
For smail diameters upto about 10” use the thickness given by the schedule on Table 3.
. For A P do not forget to take into account the change in elevation for liquid and tw
phase flow.
1
L

I’ ” TOTAL 1 PROCESS ENGINEERING DESIGN MANUAL Revision : 0 I PMICESS AND UTILITY I I
Page NO :
TEP/DP/EXP/SUR LINE SIZING
1 Date : 2/05 10.4
-
-------------------_---- .
- - - - - - - - m - m - Y) - - - - - - - - VI
22 22
ir 00 *Q) ?- . m ?- . . . . . -4 -II aa c; .*a
00 00 Y- c- ------------
33-------q -1-
?- Ov\ wo v\ . . . . . wo -rr\ -rr\ 3m 4 $6
---------
E 2
3; -----------------------
.-
-I- :
!
, -
: /
-
.-
,-
-
-

TABLE 2
1 I
/
I MAXIMUM V2 J
’ MAXIMUM i I A P bar/km I VAPpR AND STEAM LINES 1 Pv=ysd;:;;:it;$;3 , vELz;lTy 1 1
/ I I NORMAL ; MAXI ,
I I I 1 VAPOR LINES . P < 20 bar g I
I . 20 <P < 50 bar g . , . 50 < P < 80 bar g
I I
. P > 80 bar g I
I - Discontinuous operation eg: compressor , I anti-surge I . - P < 50 b& g - I . 50 < P < 80 bar g
I . P > 80 bar g
I : compressor suction compressor discharge
6 000 7 500 10 000 I5 000
IO 000 15 000 25 000
I I 1 , ) AP must be considered
I I 1
f 1 i and be compatible with
I , ) the corresponding service
i T;ore compatible with a
I I I I I .
I 42 I 42
I 30 I 30
0.25 0.5
I , STEAM LINES I I - P<lObarg . Short line L < 200 m 0.5
f . Long line L > 200 m 0.15
/
- lO<P<30barg .ShortlineL<200m 1.2 * Long line L > 200 m 0.25
,’ - P > 30 bar g . Short line L < 200 m 1.2 . Long line L > 200 m 0.35
I I I I I
1.0 I 0.25
2.3 I 1.0
“2.3 ! 1.0

I*
I I
I
I
I
‘TOTAL PROCESS ENGINEERING DESIGN MANUAL
TEP/DP/EXP/SUR PROCESSANDUTILKYLINESIZING
/ Revision : 0
Date : 2185
Page NO
10.6 :/
/
7. REFERENCESANDUSEFULLITERATURE
. LUDWIG
.
l -
. Flow of fluids CRANE
. “Gas liquid flow in pipelines I Research results” by A.E. DUKLER May 1969
Pup1 by A.G.A., API and Union’of HOUSTON
. “Gas liquid flow in pipeline II - Design manual” by 0. BAKER, H.W.
BRAINERD, C.O. COLDREN, FLANIGAN and J.K. WELCHEN, October 1970,
published by A.G.A. and API
. “Proposed correlation of data for isothermal two phase, two component flow in
pipelines” LOCKHART, R.W. and R.C. MARTINELLI (1949)
. BEGCS , H.D., and BRILL, J.P. Manual for “Two phase flow in pipes” 1975 university of
TULSA I
. ABAQUES AFTP: . “Pour le calcul des pertes de charges des liquides dans les a
conduites”
. “Pour le calcul des penes de charges des gaz dans les
conduites”
. PEPITE PROGRAM
. “CHEMICAL PROCESS DESIGN ON A PROCRA.MMABLE CALCULATOR”
W. WAYNE BLACKWEIL, B.S. Page 22
. “Two phase pressure drop computed” - Mafik Soliman, Hyd. Processing April 84
I

7 I- TE TEP/DP/EXP/SUR
0. 8Ucer. OII nd Gas Jour- : rt81k NW. 10. 1956, p. 156.) )
i I
I . .
I
I I 1
/
!
0.4 Q6Od LO 2 .A i
0x
OSHINOWO - CHARLES TWO PHASE FLOW MAP FOR VERTICAL UPWARO FLOW - FIGURE 2
00.0
i
Qs - Vapor flow rate. Ft3 /See -
Gl - . Liquid flow rate. Ff3 /See
0 - Pipe inside diameter. inches
p 1- Liquid densicy. Lh/Ft 3 .
u 1 -Liquid surfra tension, dyne/cm p 1: Liquid viscosity centipoiro
I I I I I illli I I I I111111 I ’ I 1.0
BUBBLE QUIET SLUG OISFERSEO SLUG FROTHY SLUG FROTH ANNULAR

TOTAL 1 , PROCESS ENGINEERING DEStGN MANUAL PRDCESS AND UTILITY
TEP/DP/EXP/SUR I - SIZING
Hevtslon : 0 40: (
7
-f
IOUf- : i6.) ,
. .
f .
Page No :
10 -0 I Date ’ : 2185
Figure 3 - Relative roughness of pipe
.
Pipe Diameter. in Feet -D
bIJ6 pa3s g .mo4
z .aa a
.oalos
.CCICJO~ .umi .aJaM
.ooGQo6t 1 11 1lllllll
DOOOOS~ 1 I I III I I I Ill”” I I,,
2 3 4 56 8 10 to 30 40X160 EOlOO 200 300 Pipe Dtamekr, in Inches - d

f , TEPIDPIEiPISUR ,
L= SXZXNG
“y’?-“$q,.
Revision : O
Date : 2/85
Page No : II 10.9
FRICTION FACTORS FOR CYLINDRICAL PI PE

‘I- TOTAL 1 PROCESS ENCilNtttilNlA IJtblCiN MHNUHL nc.,o~“II . ”
(1
I
rage NO :
I PEbocEsS A?lD UTILITY TEP/DP/EXP/SUR LINE SIZING
I- I Date : 2/h
I IO. 10
TABLE I.1
I NBE DIXENSIONS IN :w
NORKAL THICKNESS WI-I-Ii TOLERANCE -iW.
. I s’ 17. I4 1.:) I 2.11 mom I 1 _i ! 1.1 I i s.m 1
f i 1 1 ; II.% 2.11 2.77 3.71 I I 1 b.?S I X.77 3.3) j 1.0
.. ,,a- a2.16 2.77 3.n r.u 1 ! Las I.% l .a> *.70 I
I Ill- l .26 2.77 1.U LO1 _ i 7.M Au >.0t IO.10
I SO.JI 1.77 J.91 s.n I
1.71 J.9? 5.n II.07
21' 71.0? 3.06 J.14 7.01 I V.J2 &lb ?.OI lb.01
Notes : 1) For schedule 10 0 < 14' 4re nor used normally 2) me follovrnq diameters are not common : l/8', 3/a-. I l/4-, 2 l/2-, 3 112',5- 3) For 00 > 30' line drametcrs increase in 2‘ incrcmnts

TOTAL (._
TEP/DP/EXP/SUR
4
: : ,~, v. . , , _,, _ 1
PROCESS ENGINEERING DESIGN MANUAL Revision : 0 Page No : ’
PIPING CLASS . Z/85
Date . 10.11 ,
I. APPLICABILITY
The purpose of this chapter is to determine the piping class used as shcwn on a PID line
when the piping material class document does not exist. This is generally the case for , ,
feasibility and pre-project studies. I
2. CLASS NUMB&RING PRINCIPLES (From DD-SP-TCS- 112 “PIPING MATERIALS CLASSES”) 1
2.1. GENERATION OF NU,MBER I
The class number shall consist of a capital letter representing the ANSI series and 3
two-digit number representing the main material entering into the composition of *
material used for the valve bodies, tubes, fittings and flanges of the network in I.
question. I
Example :
Ear . . l .
Series 150 . . . . . . . . . . . l : . . . . . . . . . . . . Carbon steel
The tables below give the letters and numbers to be used for numbering piping
classes.
2.2. LETTERS representing the series of the class
Series I 125 I 150 I 250 I 300 I 400 I 600 I 900 I1500 2500 Trying
I I I I I I I I I I
Symbol lA~BlC;D~EiFtCIH~J~ Y
2.3. NUMBERS representing the main material of the class
oito20 : Carbon steels (ordinary, galvanized, normalized, etc...)
21 to 45 : Alloy steels
46 to 70 : Stainless steels
71 to85 : Special alloys (Monel, Hastelloy, etc...)
86 to 99 : Other materials (Cast-iron, copper, copper alloy, etc...)
Glass
Plastic, cement-asbestos fiber, etc...
‘
I

I nd a
4 kin ’
TEP/DP/EXP/SUR PIPING CLASS
Date : 2/85 10.12
3. PRESSURE TEMPERATUREi RATINGS
The following ANNEX C is extracted from ANSI B 16-5 1977 (AMERICAN NATIONAL
STANDARD STiEL PIPE FLANGES AND FLANGED FITTINGS).
For pressure temperature ratings higher than series 2500 the following is used 5000 PSI,
10000 PSI, . . . (used mainly for well tubing and wellhead).
FIG. C
Prasruro-tcmperoturc ratings for steel flonger ond flanged fittings from ANSI B16.5- 1977
.28.9 to 37 B -20 to 100 275
--_ 027 E E 525
ra2 520
900 so E 510
950 538 ::
375 loo0 325 iii
“3U 649
195 1200 155 1250
z:
704 1300 ‘A2 14s 110
760 t:g E “62 5-z 1% 310 515 1450 240 400
851 15W :: 45 105 30
:: 170 205 70 120 200
NOTES.

1. APPLICABILITY I’
The purpose of this chapter is to determine the types of valves used for designation on tht
PID. t 1’
. valves are used for two mains functions, isolation and control. I
The following is only a guide line for selection of types of valves which must follow thf
piping material class document when it exists. I
2. BLOCK VALVES
I The main types are : . ball . gate
. Plug . butterfly I ’
ToT’AL’ PROdESS ENGINEERING DESIGN MANUAL Revision : 0 Page No : , I
SELECTION OF TYPES OF VALVES TEP/DP/EXP/SUR Date : Z/85 10.13
1’ ! 1
-4 I I I
2.1. BALL VALVE
I Ball valves can be full bore or reduced bore.
I
2.1.1. Full bore uses I
. flare system : upstream and downstream of PSV, rupture disc, flare line if
required. I
. downstream pig launcher and upstream pig receiver. I I
. vents and drains on’hydrocarbon equipments.
piping valves on instruments for hydrocarbon. I .
. for block valves an hydrocarbon lines if the pressure drop is critical.
. utility except water for diameter larger than 2”.
2.1.2. Reduced bore uses
. Block on hydrocarbon service without solid particles. I
2.2. PLUG VALVE USES . I
Plug valves have the same use as reduced bore ball valves when used for high pressure
(600 * 1. Plug valves can be assimilated to reduced ball valves, generally, plug valves,
are smaller and lighter of the two.
I
I

0: I
I’
I tht I’
I
e if I
TOTAL TEP/DP/EXP/SUR
t’HUCkSS tNtiINtERING DESIGN MANUAL
SELECTION OF TYPES OF VALVES
Revision : 0
Date : 2l8S
Page NO :
10.14
t3. GATE VALVE USES
l
. Gate valves can be used as ball valves except for downstream of pig launcher ant a
upstream of pig receivers. The vertical physical space required by a gate vdve is
greater than a ball valve.
. Tight shut off for ball or plug valves is superior to that of a gate.
. For hydrocarbon service with solid particles presentor as wing valves on well
heads.
. For quick closure purposes.
. On utility lines for low diameters < 2”
2.4. BUTTERFLY VALVE USES
. On water lines for service, utility or sea water, generally for diameters larger
than 2”.
3. CONTROL VALVES ,
The .main types are :. globe
. butterfly .
. special
3.1. GLOBE VALVE USED
. Control valve used in most of cases except at very high P as defined by
instrument group, or on water networks, and compressor suction lines for
throttling purposes.
3.2, BUTTERFLY VALVE USED
. On water networks
. Throttling at compressor suction
3.3. SPECIAL VALVES USED
Special valves are defined by instrument group :
. for very high A P the angle valve could be used
. for compreSsor anti-surge cage valves could be used.
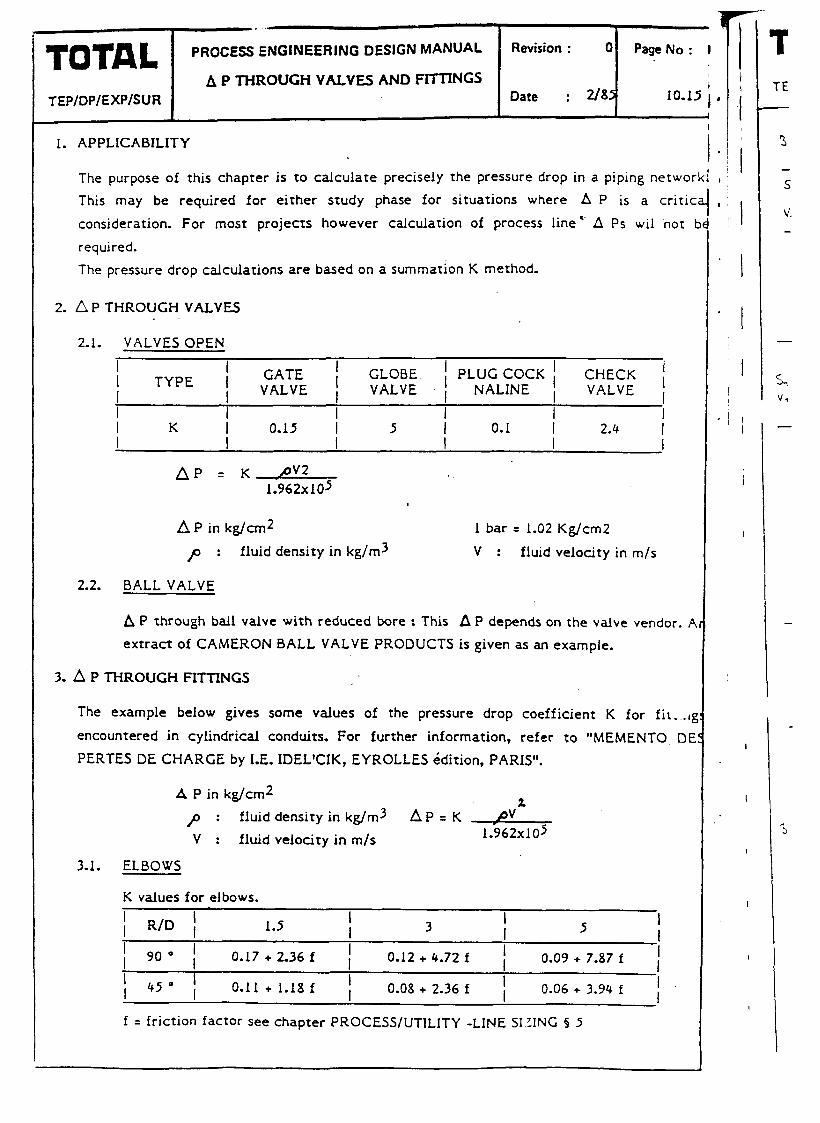
TOTAL - .’ PROCESS ENGINEERING DESIGN MANUAL Revision : 0 Page No : I
A P THROUGH VALVES AND FITTINGS
TEP/DP/EXP/SUR Date : 2m
1. APPLICABILITY
The purpose of this chapter is to calculate precisely the pressure drop in a piping
This may be required for either study phase for situations where A P is a critic
consideration. For most projects however calculation of process line ‘- A Ps wil not
required.
The pressure drop calculations are based on a summation K method.
2. A P THROUGH VALVES .
2.1. VALVES OPEN
I
I TYPE I
GATE VALVE I
GLOBE I
CHECK
! I
VALVE , PLUG COCK 1
NALINE VALVE i
1 K I
0.15 I
5 f 0.1 I I
2.4 I I I I
A P = K .PV2 1.962x10⁵
A P in kg/cm2 1 bar = 1.02 Kg/cm2
P : fluid density in kg/m3 v : fluid velocity in m/s
2.2. BALL VALVE
A P through ball valve with reduced bore : This A P depends on the valve vendor. 1
extract of CAMERON BALL VALVE PRODUCTS is given as an example.
3. A P THROUGH FITTINGS
The example below gives some values of the pressure drop coefficient K for fit. ..,
encountered in cylindrical conduits. For further information, refer to “MEMENTO DE
PERTES DE CHARGE by I.E. IDEL’CIK, EYROLLES edition, PARIS”.
A P in kg/cm2
P : fluid density in kg/m3 AP=K .@”
v : fluid velocity in m/s 1.962x10⁵
3.1. ELBOWS
K values for elbows.
I I R/D I 1.5 I 3
I 5
I
f 90” 1
0.17 + 2.36 f 1
0.12 + 4.72 f f
0.09 + 7.87 f I
I I , 4s” , 0.11 + 1.18 f 1 0.08 + 2.36 f 1 0.06 + 3.94 f ;
f q friction factor see chapter PROCESS/UTILITY -LINE SI,ZING § 5

TOTAL TEP/DP/EXP/SUR
AP 'I%Rm- VALVES AND FITTINGS Date : 2/85 lcl,ld
10 20 30 40 60 loo I*0 180
0.47 0.45 0.43 0.41 0.40 0.42 0.45 030 0.45 0.41 0.36 u.33 0.30 0.35 0.41 0.50 0.42 0.35 0.30 0.26 0.23 0.30 0.40 030 0.39 0.32 0.25 0.22 0.18 0.27 0.X 0,SO Of7 0.27 0.20 0.16 0.1s 0.25 0.31 O.SO 0.27 p.18 0.13 0.11 0.12 0.23 0.36 030

TOTAL TEP/DP/EXP/SUR
PROCESS ENGINEERING DESIGN MANUAL Revision : 0 Pabe No :
A P THROUGH VALVES AND FITTINGS 9
Date : 2/85 10.17 A
s, +5a > s,
T TE

I
’ I ‘I TOTAL I PROCESS ENGINEERING DESIGN MANUAL
TEPIDPIEXPISUR
---
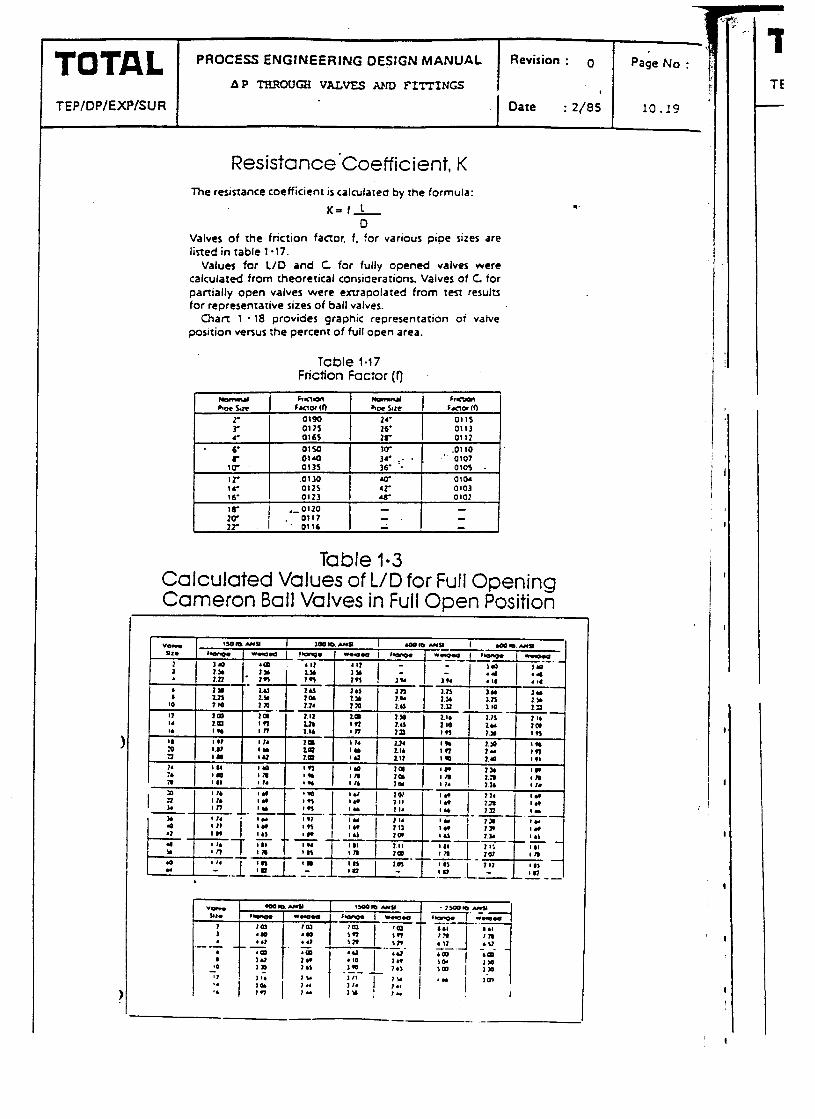
.i
TOTAL * PROCESS ENGINEERING DESIGN MANUAL Revision : 0 Page No : !
AP THROUGH VJUVES AND FITTING.5 TE
TEP/DP/EXP/SUR I I Date : 2/8s
I 10 -19
Resistance’Coefficient, K The resistance coefficient is calculated by the formula:
K-fL 0
Valves of the friction factor. f. for various pipe sizes are listed in table l-17.
Values for L/D and C for fully opened valves were calculated from theoretical considerations. Valves of C. for partially open valves were extrapolared from ten result for representative sizes of ball valves.
Chart 1 * 18 provides graphic represenration of valve position versus the percent of full open area.
Table I-17 Friction Factor (r]
tw-ald hcla FrLprn hoesa FUl~(f-l I-I *DC slrc Fanor tn
; 0190
1 14’ 0115
017s . 0113 .- 0164 :: 0112
6' OISO lo- .OllO c 0140 34. _- . ) .' 0107
1r 013s 36' '. 010s .
lz- 0110 UT 0104 1‘. 0125
I 0103
16' 0123 z 0!02
:c .-0110
. 0117 - 22- 0116 L
Table I-3 Calculated Values of L/D for Full Opening Cameron Ball Valves in Full Open Position

I
‘I
I
I
TOTAL pflUl;tS CNbINCCnINla UCSIWY IVI~IUUAC. ..“.,~,“,I . v l “3” a.” .
AP T’HROUQI VALVES Brad FITpINc;s
Date : 2/8-s 10 -20 TEP/DP/EXP/SUR
Table l-5 Calculated Values of L/D for
Reduced Opening Cameron Ball Valves in Full Open Position l
Table I-6 Calculokd Values of L/D for
Venturi Opening Cameron Ball Valves in Full Open Position
I I

t f
TOTAL . PROCESS ENGINEERING DESIGN MANUAL Revision : 0 PageNo: l 1
CONTROL VALVE SIZING !
TEP/DP/EXP/SUR Date : Z/85 10.21 ,,
1.
2.
APPLICABILITY
The purpose of this chapter is to give some formulae to estimate the size and the number o- ’
control valves installed for one given service, and to estimate the capability of the contra ,
valves in case of revamping. The final sizing should be done by instrument people. .i .
CONTROL VALVES CHARACTERISTICS
These are determined principally by the design of the valve trim. The three fundamental 1
characteristics available are quick opening, linear, and equal percentage.
2.1. QUICK OPENING ; L , 1
As the name implies, this type provides a, large opening as the plug is first lifted f roar ,
the seat with lesser flow increase as the stem opens further. The most common . . application if for simple on-off control with no throttling of flow required.
2.2.
Linear trim provides equal increases in stem travel. Thus the flow rate is linear witr
plug position throughout its travel. I *
2.3. EQUAL PERCENTAGE . Provides equal percentage increases in rate of flow for equal increments of stem
I . travel. The characteristics provide a very small opening for plug travel near the seat
and very large increase toward the fully open position. As a result, a wid
rangeability of flow rate is achieved.
3. CONTROL VALVE RANGEABILITY
. For an estimation only it is common practice to select a valve in which the valve openini
at maximum flow is smalier than or ‘equal to 95 per cent.
. For normal flow the. valve opening should be at least 60 per cent while for minimum I :
flow, if applicable, the opening should be larger than LO per cent. If the minimum fl iS; ,
close to or smaller than 10 per cent, a smaller valve should be installed in parallel wit i
the ‘main valve.
. For a flow rate the valve opening depends on the valve characteristics and it is given b 1 1
4. . .
FORMULAE 1~
vendor in their catalogue.
the gas (see hereafter).
I’
The valve area is characterized by the coefficient Cv (except for FISHER which use Cg for1
The Cv coefficient is the number of U.S. gallons of water flowing during one minut
through a restriction and the pressure drop through this restriction equal 1 PSI.
The following formulae are simplified and to be used only for an estimation of the Cv. Sam,
corrections may be necessary for the installation of reducers around the control valve. If so
the formulae given by manufacturers in their car-logues will be used for a better C-
Calculation.
e
‘7
V
i

, tntak i
L b I
roll- ,
motj ;
I’ L a uitt
. I
ring .
I lum :
iY’ ,
TOTAL TEPIDP/EXP/SUR
“ . - , . -
PROCESS ENGINEERING DESIGN MANUAL
dONTROL VALVE SIZING 1.
Ravision : 0 .
Date :2/u
Page NO :
10.27
4.1. LIQUID
I A - Sub critical flow I B - Critical flow
Pv<PZandPl -PZ<Cf?A Ps I bl -PZ>Cf<.*Ps I I I
Cv = 1.16 Q J
sg PI - P2
sg 1.16 Q
CC J A Ps
Cf = critical flow coefficient (given by manufacturers and depends on tf
type of valve and the action of valve by increase of variable) cf < 1
Pv = fluid vapor pressure in bar
PI = upstream pressure in bar
P2 = downstream pressure in bar
APS = Pl - (0.96 - 0.28 1
C)Pv
or to simplify, if Pv < 0.5 Pl, APS = Pl - Pv
PC = fluid critical pressure in bar
Q = flow rate in m3/hr at upstream conditions
sg = specific gravity at flowing temp. (water = 1 at 15°C)
4.2. GAS AND STEAM
A - Sub critical flow
PI - P2<0.SCr2Pl
I I 0 - Critical flow I I PI-P2>,0JCf2Pl

TOTAL PROCESS ENGINEERING DESIGN MAhiUAL Revision : 0 Page No : c
CONTROt VALVE SIUNC
TEP/DP/EXP/SUR Dare : 2/u 1 O-23
SATURATED STEAM I
cv = 72.4 W
J (Pl - P2) (PI + P2) I I
SUPER HEATED STEA&M I
.
cv _ 72.4 (1 + 0.00126 Tos) W i cv= 83.7 (1 + 0.00126 Tos) W
&PI - P2) (PI + P2) f
Cf PI
Cg, PI, P2, Q same definition and unit as 5 4.1.
G = relative density (air = 1.0)
T = upstream gas temperature OK = 273 + “C
z = upstream compressibility factor
W = steam weight in t/hr
Tos = steam superheat in “C
4.3. TWO PHASE FLOW
For sizing, maximum A P = P 1 - P2 = 0.5 Cf2 P 1
A - Without liquid vaporization I B - With liquid vaporlzatlon I
cv = 51.8 W 36.6 W
JP (dl + d2) J APdl
Cg, PI, P2 same definition and unit as 5 4.1.
w = total fluid flow in t/hr
dl = upstream mixture density in kg/m3
d= w x 103
EL+ Wlv dll dlv
WI1 = upstream liquid flow in kg/hr
dll = upstream liquid density in kg/m3
Wlv = upstream vapor flow in kg/hr
dlv = upstream vapor density in kg/m3
--
I
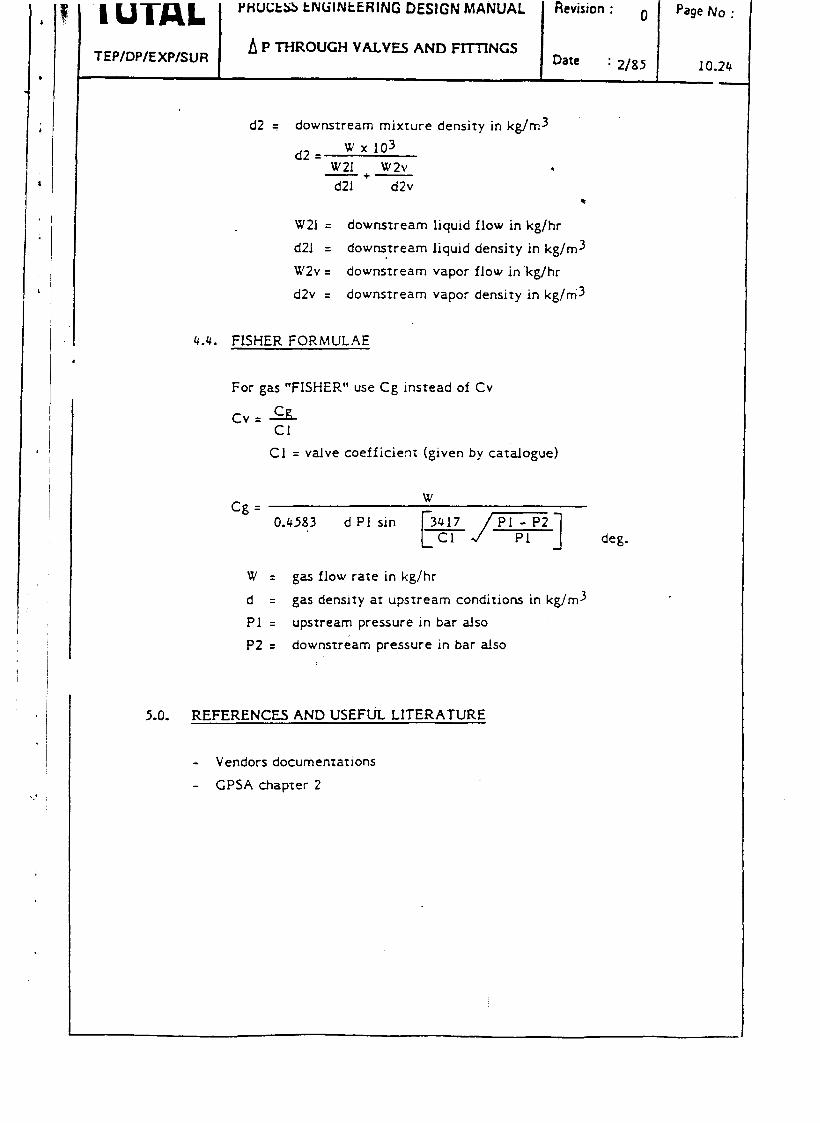
“1 UTAL PHUCtSS tNbINtERING DESIGN MANUAL Revision : O Page NO :
TEP/DP/EXP/SUR A P THROUGH VALVES AND FITTINGS
,Date : 2/85 10.24
d2 G downstream mixture density in kg/m3
d2 = w x 103 w21 w2v . -+- d21 d2v
It
w21 = downstream liquid flow in kgjhr
d21 = downstream liquid density in kg/m3
W2v = downstream vapor flow in -kg/hr
d2v = downstream vapor density in kg/m3
4.4. FISHER FORMULAE
For gas “FISHER” use Cg instead of Cv
cv= cg Cl
Cl = valve coefficient (given by catalogue)
cg = 0.4583 d PI sin
fw ./T] deg.
w = gas flow rate in kg/hr
d = gas density at upstream conditions in kg/m3
Pl = upstream pressure in bar also
P2 = downstream pressure in bar also
5.0. REFERENCES AND USEFUL LITERATURE
- Vendors documentations
- GPSA chapter 2

--
,
I -/
TOTAL PROCESS ENGfNEERlNG DESIGN MANUAL Revision : Page No :
TEP/DP/EXP/SUR Date : Z/85
.
+-
11, PIPELINES

‘-2
TOTAL TEP/DP/EXPlSUR
APPLICABILITY 1.
2.
For both feasibility and preproject studies, long pipeline A P and AT calculations will
normally be performed using PETITE or RESEAU- It may be necessary,however to make an
estimate by hand. Details are given below on how to proceed on this.
PIPELINE PRESSURE DROP FORMULAE
PIPELINES
. Revision : 0
Oate : 2/85 L
Page No.
11.1 TEP
sf these
2.1. GAS TRANSMISSION
There exist many methods of calculating AP for gas transmission lines. Some o
are : American Gas Association Formula Weymouth
Panhandle ‘.4’ and ‘0’ Darcy
Colebrook
Below is given the Panhandle ‘A’ for use :
CO.4604 x
1
1.8539
X TxL x 5 m x 0.301s
d 2.6182 E;
X 1
Where Pl = Upstream pressure bar (a)
P2 = Downstream pressure bar (a) G = Specific gravity of gas
TS = Base temperature K (271 K or 298 K)
ps = Base pressure bara(1.01325 bar) T = Gas flowing temp K
Lm = Pipeline length km
q = Flowrate at Ts, Ps base m3/d (at Ts, Ps) d = PIPELINE DIAMETER cm z = Average gas compressibility
E = Efficiency (0.92 for a clean line)
The formula does not take into account the pipeline profile which, if significant, can be added to the A P calculated if required.
2.2. LIQUID FLOW IN PIPELINES
Use Darcy equation :
P = 6.254 F ,M2 bar/km
P D5
= Mass flow kg/h F = Moody friction factor
= Density kg/m3 E = Absolute roughness cm
D = line id cm (see page 10-S and 10.9)
CP = pressure drop b.r!km = viscosity CP

vi11
an
TOTAL PIPELINES
Revision : 0 Page No. :
TEPIDPIEXPISUR Date : 2/8S 11.2
.
Re = 35.368 x M F = 64/Re for Re < 2030
x D F = (S/Re)lZ [
+ l/(A+B) 3/z 1 “I2 *iOr Re > 2000 16
with : A = 2.457 [
Ln 1
(7/Re)-9 + (0.27 E/D) 1 -------
B= (37530/Re)l6
l BE CAREFUL when using friction factor charts as confusion arises
between MOODY F and FANNING F” : F’ = l/4 F
2.3. TWO PHASE HORIZONTAL
Estimating 2-phase flow A P by hand for long pipelines is not recommended, as
the flow characteristics and equilibrium will alter along its length. However an
estimate of A P can be hand calculated providing the phase regime is fairly
stable.
Given below is a calculation method based on LOCKHEAKT-MARTINELLI-
BAKER method. This method can be used for both longpipelines (stable regime)
or process lines.
METHOD ,
*’
AP 2 PHASE =
OP HORIZ +
AP VERT
1. Evaluate flow regime and adjust Pipeline 0 if required
2. Calculate APC
3. Calculate APL
4. Calculate ( APL/A PC)“’
5. Calculate AP 2 PHASE
factor.... Pz H
6. Calculate APvert factor (vertical section of pipe)
For convenience pipe ids are in cm
viscosity is in cp.
.(-.

.
r
OPERATING DATA
FLOWRATE Wg DENSITY Dg VISCOSITY “is
FL0 WING TEMP
PIPELINE DIAMETER D cm = .b.cI, PIPELINE LENGTH L m = 103J
INTERNAL AREA A m2 = 2.13 Vertical change A h m = - :LO o
LIQUID
kg/h = IOQOO3 kg/m3 = 1 E
CP = O.Ol’LA
“C = 3L
FL0 WRATE WI kg/h = :;o 3co DENSITY 01 kg/m3 zp 1 So VISCOSITY Vl cp J f SURF TEN St dynes/cm r i:
STEP I I NOTES I
; I. DETERMINE FLOW REGIME t
6x = 210.3 .!!! ’ /Dxi x VII/~ = 3ci.63 1 I
wg D12/3 St I I I I
I BY = 7.087 x w -7----F Ax DlxDg r
REGIME FROM BAKER CHART I
3;s7c:;f L ire P”JC IO.7 i
I 2. CALCULATE Apgas I I Re = 35.368 x Wg
1 Vg x D
I Fricilon factor (:vloody)
I APL 6.254 x f x Wg2 s ;
1 Dg x DJ
1 3. CALCULATE ApLIQ I I Re= 35.368 x WI
VI x D
1 APL=6.254xfxw12 \-. I DI x 05
I I APL =-&ar/km I I I
11.3 I
PROCESS CALCULATION SHEET Sheet I of 2 I
- TWO PHASE PVELINES ITEM :
P’ooPmIP/EXP/SUR A P CALCULATION NO.
I I CJiK DATE JOB TlTLt E LJ\V I ii ;- JOB HO. REV 1
I-- l I
I I I- I
/
j-
I ( I I
/ I-
I 1t -
LIY -

‘ya
I
- .
3 . I I.
c
1 I.4
I I II
I 4. AVERAGE VELOCITY I
v, = I V, = :?- cc in/s I I I I. I
5. CALCULATE X RATIO
) 6. CALCULATE LOADING FACTOR WS I
I ws = WI x 0.205 ) wsJ??,‘O I i I 7 I I I
7. CALCULATE PH FACTOR FOR HORIZON-t-AL FLOW
TYPE OF FL&’ i
-- PH
BUBBLE
STRATIFIED I
:w
SLUG
------t-- - -a-- -- --- WAVE I I+,.~.
I
rt : In FH + 01111 lntix - LVVJ
vt pc
IA Pa , ,‘.tSt Ftl VC= IpcD’ aul ht.-
FLOW TYPE = &Pi C: .j I
PH
FLOW TYPE = WAVE f I APa-,= t
bar/km 1
‘I I 8. CALCULATE PH FACTOR FOR VERTICAL SECTION I
I
VERTICAL i FRN . IC.2 V21D Vinmh.Om Cm f
SECTION i x0 . 0.19 (X) (FRNl”“” n PH, = I.510
t l- x . x0 in oi~pcrvd fbr eq~. (0 SC’ Pn .w. I I
I 1 I
I 9. CALCULATE TOTAL TWO PHASEAP
f I Horizontal : PH = I.888 AP2” 4,~~ x PH2 q 1.3AQ bar/km 1 I _. Vertical : PH,,= I.~\0 aPzv =~PG x PH$ = o.?i? bar/km 1
I TOTAL &P = (bp2H x L +Apzv x h)/lOOO = 1.5-i’ bar I I I
PROCESS CALCULATION SHEET Sheet 2 of 2
TWO PHASE PIPELINES ITEM
TEP~OOP:DIP’EXP’SUR P CALCULATION NO
IY CHK 1 DATL JobTlTLt TM\.+< I08 NO REV

TOTAL TEPIDPIEXPISUR
PIPELINES
Revision : 0
Date: 2/85 I
-
.
Page No.
Il.5 ,
3. TEMPERATURE PROFILE
For detailed and accurate AT and AP calculations in 2 phase lines buried, subsea or in air
the program PEPITE should be used. The hand calculation method presented on pages I 1.6,
11.7 is accurate to within 10 % for both gas and liquid lines. The procedure is easily adapted
to a small programmable calculator and increases in reliability the greater the number of
segments used.
The following should be remembered when designing pipelines,
For long pipelines assuming isothermal flow can result in overdesign in pipeline sit i
-
AP.
If the pipeline is constant with regard to material, insulation and burial depth along its
route a fixed thermal conductivity (k) can be assumed. I
For gas pipehnes the internal film resistivity is neghgible - ignore it.
For all steel pipelines the resistivity of the metal is also negligible.
Small pipelines (< 20”) have a large heat flow compared to the specific heat of the
flowing medium. Consequently the gas will reach ground/sea temp in a relatively short 1
length. For large pipelines the converse is true and a long distance is required to reach
ambient ‘
For oil and small gas pipelines the asymptotic temperature Ta is that of the surrounding ,
medium. For large diameter gas lines, Ta depends largely on the Joule-Thompson effect.
The attached calculation sheet can be used for hot lines in cold surroundings or vice ’
versa, :
I
For subsea pipelines, epoxy wrapped, concrete coated resting on the bed an overall heat
transfer coeff of U = IO - 15 kcal/hm2’C is a good estimate for calculation purposes. 6 b
( *b D
h
PI P2
. AP Tl
1
I----
l
I-
I
I 1.
. I
I
j
I
L
j 2.
I I
- I3.5 I
. I
I I-- l 4. I
. I I-- i Re I Set I-
L TO.
If PcJDPfC
5-r-r

1 air ’ / ; Total pipeline length m = ?3BOO
1.6, No of segments =& Length per segment m = 1oeoe
>ted i
, *: Total elevation change + m = 4 103 rOf i D Pipeline diameter Ls = 30
= o.-Gt / Pipeline diameter m I h Burial depth to centre m = r-t> / *
PI Inlet pressure bara = A0 Exit pressure bara = 50
I . aF2 Total pipeline bar = IO
Tl initial Temperature ‘C = LB
11.6
Covering Medium :
Tg Temperature “C = I3 k Therm. cond. kcal/hm”C = I. /,q
LIQUID FL0 W .
Volumetric floum3/h = Density (av) kg/m3 e = M Mass flow kg/h Cp Specific heat kcal/kg ‘C 1
GAS FLOW
Volumetric flow m3/d (std)= 00 O*CJ Molecular mass = 15 ,M Mass flowrate kg/h = -locJ;.s Cp Specific heat kcal/kg’C = 0.6
1 FLUID JOULE THOMSON COEFFICIENT = rc “F/1000 psi ( x 0.00805) = C.L;“C/bar
(see fig. I, page 11.8)
I I I I
I STEP
I VALUE I NOTES
I ~(&~
I I I 1. Calculate heat transfer factor s 1 I Coverinq k Y 0.f -l- 17
I x = 2h/D x + (x2 - 101 /:
= 3.33 f Soil kcalThmC I 1.49
I s= 2kn /ln [ = 5 kcal/hm’C I Air 0.022 . I
I 1 I Water 0.508 I Sand dry 0.30 I
i I I Sand wet 1.49 I I
I I I ) 2. Calculate heat flow ratio per unit I
I leqth ‘a I I I
a = s/MCp (liquid or gas) I a =113-q ,o-c.n- 1 I I ‘, I I
I I I i I 3. Calculate Asymptotic temperatureTa I
f - ..*
1 Ta I I
Ta =Tg - (1 AP + L\ y/jCp)/aL =41\ ‘C i L is segment length
I /
1 j= 426.5 w I
/ . 1
kcal I
I I I I 4. Calculate downstream ternp -1-2 I
I I
I I
f T2 = (Tl - Ta)e-aL + Ta
I T2 =Li-k”c I I I
I . . I I I I Repeat steps 3 + 4 for each segment ) See sheet 2 for stepwise spreadsheet I . I I
I I I
I PROCESS CALCULATION SHEET Sheet 1 of 2 ---
/ / BURIED PIPELINE AT CALCULATION ITEM
I TEP~DI~~I~IP,ExP~u~I NO.
Br CHK OATL I JO8 TJrLf ;-%AflPl C 106 NO RfV -

r 11.7 t;
ITERATIVE CALCULATION LOG FOR A BURIED PIPELINE AT.
e I
1 SEGMENT N’ l I I I I I I I
I LENGTH I ELEVATION [ PI I Tl 1 Ta I T2 l P2 I
I I I I I I I I I I
m I +m 1 bar al I -
“C I “C I ‘C l bar al I I I I I I I I
I I I
*. :
*’
. ,
I
I ( !
I : ’
I
1
I PROCESS CALCULATlON SHEET Sheet Z of 2 J 1
ETJ BURIED PIPELINE A,T CALCULATION IrEM:
TEPtDOPmIPIEXPc5UR NO. :
9r CHK OATE ~08r;r~f. LxnrWt JO1 No. : IREVI
TEPK
4. L
4
4.
4.
4.
4
4
k
S
U
c
c
S
E
C
-
lo -
i :
I
B

[ Y,i,’ 4 - -.
f OTAL TEPlDPlEXPlSUR
4. LITERATURE AND USEFUL INFORMATIONS
4.1. LUDWIG VOL I chapter 2
4.2. CAMPBEL VOL I ChaDter 12
4.3.
4.4.
4.5.
4.6.
KATZ, HANDBOOK OF GAS ENGINEERING chapter 7
CRANE MANUAL
“Equations predict buried pipeline temperatures” G.King 043 March 16, 1981
“Two phase A P computed” R. Soliman Hydrocarbon ProcessinK Aoril 1954
k kcal/h.m. “C x o $j’l -3
1
I i ,
Soil 1.19 concrete 0.65 - 1.19
Wet soil 1.49 sand (dry) 0.30
Ground -> air 2.98 sand (wet) 1.49
Ground -> water 29.8 Air 0.022
’ Steel 38:7 (2bd Water 0.510
Epoxy coating 0.67 (0 .,,I?
Coal tar 0.22
PIPELINES
Date : 2181
.
t 6-s I h2
Joule-Thomson coefficient* Specific heats’ -*w-m > -1-m -m--w
1n 7


GLOBAL ENGINEERING LIMITED
SHEO No.- .
JOB Na..
iLlEN PROJECT
XJBJECT

--- --- - __.- -. ..._ ___.___ - . - _ . . . . . . -... - . .-.- ._ .._ ._ _
. . GLOBAL ENGINEERING LIMITED
SHEET No.-
LIEN7 PROJECT
UBJECT
:ALC’D BY @ CHK’D BY - APP’D BY DATE ~%u,cJ~ : ;
,
. -A
,
! . .
i

. .
SHEET No.-
JOB No..&
CHK’D BY
7 4
- ,
c

,. - ‘!
.,f
jr
TOTAL PROCESS ENGINEERING DESlGN MANUAL Revision : Page No :
i TEP/DP/EXP/SUR Date : 2/85
-
.
ly-
12. PACKAGE UNITS

TOTAL TEP/DP/EXP/SUR
c
1.
2.
PROCESS ENGINEERING DESIGN MANUAL
DEHYDRATION
J
APPLICABILITY
For many studies undertaken there will be a requiremenr for a gas or liquid dehydration ur n . in order to reduce the water content of the export phase to acceptable Limits for pipelir- 1.
transportation. Generally this design will be undertaken by a specialist vendor. However tl- .
engineer should be aware of some of the options available for dehydration schemes, some of ,
the dos and donts of design and also how to undertake the basis sizing of the most commc
unit (TEG). The majority of this section is concerned with gas dehydration using tri-erhylen;
glycol contact, this being the most widely used.
GENERAL DEHYDRATION NOTES L
(English units are used throughout this section for convenience) I
. Gas is normally dehydrated to 6 to 10 lb of HZ0 per MMSCF in order to prevent hydrat .
formation in gas transmission lines, and reduce corrosion. Unless the gas is dehydrate
liquid water may accumulate at low points and reduce the flow capacity of the line.
. iMethods of dehydration in usage are :
1. Adsorption (Alumina, silica gel, mole sieve)
2. Absorption (di- or tri-ethylene glycol)
3. Direct cooling
4. Compression followed by cooling
5. Chemical reacrion (for method injection see 4.0)
The last three methods have minor usage and are discussed elsewhere in literature.
A ,ummary of the advantages and disadvantages of various absorption liquids is gib,n iI .
Table 1.
. Tri-ethylene glycol is the preferred (most widely used) absorption liquid. ExampIt .
flowsheets of di- and tri-ethylene glycol are given in Fig. 1 & 2.
. In order to limit the overhead glycol losses zi max practical operating temp of 38 “C (10( *
“F) is used. A maximum of 50 “C (50 ‘F) is recommended to prevent problems due to the ’
glycol viscosity.
. Glycol losses are usually in the order to 0.012 gal/M,MCF (0.0016 m3/MMm3) due to
vapourisation 2nd in the overheads. Total losses due to leakage, vapourisation, solubilit) ,
,
run around 0.025 gal/lM,MCF (0.0033 m3/MMm3). i
. Concentrations of TEG upto 99.1 % can be acheived without the use of stripping gas. For
higher purities gas will be required. I
TEP
3.

eNo:
!
)n UT * [
pelir- .
er rt ; .
meof ;
mmc
iyleni
4
I drat *
rate
,n ir
nplt .
10( ’
‘he ’
O’ I
) ’
I
#
I
TOTAL 1 : -.
PROCESS ENGlNEERING DESIGN MANUAL
TEP/DP/EXP/SUR
DEHYDRATION
3.
Glycol foams in the presence of light hydrocarbons, t his can be minimised by good feet
prescrubbing and addition of anti-foam agents. t
Actual gas exit dew points are usually lo-15 ‘F (5.5 - 3 “,C) above the theoretical
equilibrum dew point. Take this into account when setting the specification.
The number of trays (or packing height) is usually small (4 trays) an excess of either is
always prov:ded in the design. Recommended efficiencies are 25 % for bubble caps 33
l/3 % for value trays. Use 24” tray spacing.
Regenerator temperatures should not be above 400 “F (204 “Cl at atmospheric pressure
in order to prevent glycol degredation. Limit heat flux to 5000 - 7000 BTU/hrftZ, aim
for 6000. Provide at least 2000 BTU/gall pump capacity.
To prevent hydrocarbon condensation in the glycol feed maintain the inlet temperature
at lo-15 ‘F (5.5 - 8 “Cl above the gas exit.
Regenerator still column should run at 220 “F (104 ‘C) at top to prevent loss of glycol
but maximise water rejection.
Clycol circulation rates should be between 2-4 gall/lb HZ0 removed 3 IS a good number.
PRELIMINARY SIZING CALCULATIONS
An exact sizing of a TEC unit will normally be performed by the vendor on request. The
CFP inhouse program “GLYCOL” also exists for estimating vessel sizes, circulation rates
and utility consumptions. These are based on data from the BS+B design guide. The
following hand method can be used however to estimate the required size :
1. Determine water content of inlet gas to contactor at required temp and pressure Fig. 7
lbs/MMSCF, kgfiMMm3.
2. Calculate total water maSs in feed gas to contactor
3. Repeat calculation for exit gas using required exit dew point (add 10 “F) contingency).
Calculate dew point depression “F, “C.
4. Calculate amount of water to be removed in contactor.
5. Use 3 galls TEL/lb HZ0 evaluate glycol circulation rate.
6. Use Fig. 3 to determine required TEG concentration. %
Use Fig. 4 to determine required stripping gas rate
7. Use 2000 BTU/gall TEG circulated to determine reboiler capacity.
Revision : 0
f
Date 2185
Page No :
12.2

TOTAL i’
PROCESS ENGINEERING DESIGN MANUAL Revision : 0 -Page No
DEHYDRATION 8
TEP/DP/EXP/SUR Date : 2185 12.3
3. Use Fig. 6 to determine number of trays required in contactor
and Fig. I to determine contactor diameter. t
9. Evaluate contactor height (see section 2 vessels) include integral KC pot in base c
tower. Hence estimate weight of contactor.
A more detailed sizing method can be found in CAMPBELL VOL II.
4. METHANOL INJECTION (HYDRATE INHIBITIOl\i)
In order to prevent hydrate formation ,is gas transmission lines the product is normall\r
dehydrated in a TEG or mole sieve unit as defined in previous sections. On some oc ior
however (wellhead to plant) this is not possible due to the location of the source. If th,.
minimum pipeline temperature is below to hydrate point the inhibition of water is requires
This is acheived by injection of inhibitors to depress the hydrate and freezing points.
. Common inhibitors are methanol, DEG, TEG. Recovery of inhibitors. at the receivin
plant is normal, the liquid being then recycled. Economics of methanol recovery are no
favourable. i
. Methanol is adequate for any temperature. DEC not good below - 10 “C due to viscositv /
limitations. Above - 10 “C better as lower vapourtsatlon losses.
. Predict injection rate for hydrate depression ds follows : I
w= d:M 100 w = Ki + d M
weight % inhibitor
d = ‘C hydrate depression 1 M = Mel wt of inhibitor
Ki = 1297 for Me OH I
2220 for DEG, TEG I.
. To use above equation : 1. Predict hydrate formation temp at max. press in line Tl 1
2. Estimate min flowing temperature in line T2
3. d = Tl-T2
. The amount of inhibitor injected must be sufficient to depress the hydrate point a
calculated above and also provide for vapour and liquid phase losses due to vapourisatio- I
+ dissolving. Adjust injection rate accordingly. For glycol use 0.0035 m3/Mm3 (O-Z- i
Ib/MMSCF), vapourisation. For methanol use vapour pressure charts (CAMPBELL pot’
159). 1
,
I
c
T TEF
-
5.
6..
L

w NO
-I
i I
i
. i i
3ase c j
rmalJ\’
ior
If th,:
quirec
:eivin
.re no
i
icositb : I
- Tl I
int w
satio- ’
(0.2, ‘i
-L PDI’
I
L 4
I
-,
,iOTAL 1 PROCESS ENGINEERING DESIGN MANUAL I
L Revision : 0
I
Page No :
DEHYDRATION Date : 2/85 12.4
5. SOLID BED DEHYDRATION .
Solid bed dehydration is used when lower residual water conc$ntrations are required rhar
can be acheived by glycol units. This is generally around the - 40 “C mark or 1 ppm resldua:
water. Solid bed dehydration can be used for less srringenr desifgn requirements providing
the cost is competative when compared to TEC.
INOTES :
. LNG facilities always used molecular sieve dehydration to acheive 1 ppm H20 or less.
. Available dessicant medium : KgH20/100 Kg bed
Bauxite 4-6 cheapest
Alumina 4-7
Gels 7-v
.Mole&ar Sieve 9-12 most expensive
. Beds can be severely degredated by heavy oils, amines, glycols corrosion inhibitors
salts and liquids. It is essential to have a good feed filter or scrubber prior to entering
the dessicant bed.
. Bed life is usually 2-4 years depending on contamination.
. Gas flow through the bed is generally downwards. Regeneration gas flows upwards. Thir
ensures the water is stripped from the media without having to pass all the way through
the bed.
Figures 8 and 9 show a typical molecular sieve arrangement.
. Regeneration temperature is usually 175 “C - 230 ‘C. Too high temp destroys th<
media, too low results in poor regeneration.
. Table 1 gives a summary of operating and regeneration practices.
6. USEFUL REFERENCES AND LITERATURE
6.1. CAMPBELL VOL II CHAPTERS 17 AND 18
6.2. HANDBOOK OF NATURAL GAS ENGINEERING KATZ et al. Chapter 16
6.3. PERRY
6.4. GAS DEHYDRATION “Fire tuning existing field installations”
D. CRAMER - World Oil - Jan 1981
.6.5. “Cutting glycol Cost5 I” C. SIMMONS 0 + CJ Sept 21 1981
“Cutting glycol costs II” Sept 28 1981
6.6. “Correlation eases! absorber-equilibrum line tales for TEG natural ga!
dehydration”W. BEHR 0 + VJNOV 7 1983

TOTAL 1 PROCESS ENGINEERING DESIGN MANUAL
TEP/DP/EXP/SUR
Revision : * Page NC
Date : z/es 12.5 A
PER CENY UYCOL ST WEIGuY
w--e
----
Fig. 1 Flow sheet for dicthylenc glycol dehydrotmn plant.
(Cam&d/ and Iavrmce,
Fig. 2 Aor *heat for nictttylm~ glycd dehydrocior, plod.
(Campbd/ and Laur.nc*.
.

-
--
-
- 1.
Id
u
- I.
rd.
IIINI?!'3 TEG CONCLVXATION
- ._ -L--L---W*, co, ,, .e...- ..I I Y , . .- I ..__ _-.--..~~~
F&l. 3 - ---------I- -, -.A .,rrs, is
,
I I Id..4 .I I A

r TOTAL TEP/DP/EXP/SUR
PROCESS ENGINEERING DESIGN MANUAL
--- . . “.-- _..._ .._ :‘::--:.I-: -- . .._
‘.-.::;.iI<;
‘;2i::;l:-7 . .
i
FIG. 5 SIZING OF ABSORBERS FLOWING PRESibRi:-PSIG

_.
I
I 1
P
/
.-.. : . Y”-- .- C’ .._-. -_‘. \ .y:. 3, . . - -Sk ’ : f:!::. g -7 : : -... ( ! -_. .-. 7 , ! ..- >
, I
!
. . :-- i . ..I.: v .:
. . . . . . . .._ F I ..,.- ‘I- I j x-- !
’ “I TOTAL 1 PROCESS ENGINEERING DESIGN MANUAL
I
nevtslon : u
I
rdge NO :
TEP/DP/EXP/SUR
DEhYDRATION
Date : z/t35 1’ E L.
I
01 I I
01234S678
CLYCOL TO WATER CIRCULATION RATE GALTEWLEHfo
w
,
,
,
J 40 -10 0 20 bo 40 loo
Lo
lo
A)
11
‘RAYS OR PACKING f ICUAE 6
REOUIRED FOR
.
c
C’LYCOL DEHV ORATORS

ToTAt TEP/oP/EX~/SUR
-__
PROCESS ENGINEERING DESIGN MANUAL i I Revision : O Page No
DEHYDRATION
I Date : 2/85 12.9 I
T 7-E
-
1.
GAS TO et OnlEo
OnTEn I"
1osOnCtlow
F14JU a Basic CharacccrLsclcs Of ?iolccular Sieves.
r I
DRY GA1
I nECTCLIWC
RECYCLED GAS CO~P~EssOw
.
2.
3.

No PROCESS ENGINEERING DESIGN MANUAL
GASSWEETENINC 1. APPLICABILITY
Page No :
12.10
Generally natural gas, or associated gas contain acid components, mainly carbon dioxide
(CO2) hydrogen sulfide (COS), carbon disulfide (CS2) and mercapians.
To obtain a commercial product, gaseous or liquefied, the gas nfeeds to be created to
eliminate these sour components for safety or process reasons. An other aspect of gas
sweetening is linked with the development of the CO2 injection to improve oil recovery. In
this case CO2 is extracted by a selective process. This section details different methods
available for gas sweetening and lists their advantages and disadvantages. GuidelInes are
given on which system to select for specific services.
A detailed sizing method is beyond the scope of this section, but can be found in the
referenced Ii terature is required.
2. UNIT
The specification of treated gas can be given in grains/100 SCF for H2S or sulfur content
1 grain/ 100 SCF = 16 ppm volume
3. GAS SWEETENING PROCESSES
Various processes are available :
- chemical absorption - solld bed adsorption
- physical absorption - cryogenic fractionation
- chemical conversion using catalyst
the absorption process is the most utilised
3.1. CHEMICAL ABSORPTION
In this type of process, the chemical solvent absorbe the acid components present in
the feed gas by chemical reaction and releases them by heating at low pressure.
The main chemical solvents are :
- The Alkanolamines Aqueous 56 normally
used (wt)
. MEA (Monoethanolam Ine) 15-20
. DCA (RI (Diglycolamlne), (FLUOR ECONAMINE) up to 65
. &IDEA (Methyldiethanolamlne) 1x30
. DIPA (Diisopropanolamine), (ADIP) 30-40
- or alkaline salt solutions as potassium carbonare K2CO3 25-40

Alkanolamines cannot be used undiluted because :
. close to solid state at ambient conditions It‘
. low stability at high temperature (heating is needed to extract the absorbed ac :
gases) with generation of highly corrosive products by decomposition.
Table 1 shows the advantages and a&advantages of these processes.
3.1.1. MEA PROCESS (see figure 1)
MEA solution wds the first solvent used and is still widely used. Generally a
15 56 weight solution is utilized.
a) Advantages
- high reactivity - low solvent cost
- good chemical stability - pubicly available (no licensing fees)
b) Disadvantages
- irreversible degradation into corrosion products by sulfur components
such as COS, CS2
- irreversible degradation for the solvent by oxygen (Direct contact witl.
air must be avoided) I - ineffectiveness for removing mercaptans
- high utility requirements - high vaporisation losses
- need of reclaimer to purify the circulating solution
- no selectivity for absorption between H2S and CO2
c) Fields of utilization
- general use : MEA can be utilized for gases containing from 60 ppm to 1
15 % volume acid gases without COS, CS2, mercaptans and with acid . .
gas partial pressure up to 100 PSIA currently maximum capacity for a 1
MEA unit is around 250 X106 SCFD.
3.1.2. DEA PROCESS I
The second most widely used gas treating process with a tendancy to replace
the MEA process and some improved processes exist, I
Flow diagram very similar to MEA process without reclaimer.
-

le NO
12.11
‘I t 1
i 3 ac
1 j
ally a
7ents
witl.
I
I
I
n to I
acid . .
0-l
I
lace I
Date : 2,~; pag~~~~ zPFPTf!k 1 PROCESS ENGINEERING DESIGN MANUAL Hevtston : 0 cAs SwEETEN1NC a) Advantages
- no degradation by COS and CS2 (hydrolysed into CO2/H2S)
- a significant amount of the light mercaptanr present on the feed gar
is absorbed
- a good chemical stability - no need for a reclaimer
- a very low absorption of hydrocarbons - reduced vaporisation
- publicly available losses
b) Disadvantages
- lower reactivity compared to MEA and thus higher circulation rater
for the conventional system (Not applicable to SNEA-DEA process)
- an irreversible degradation of the solvent by oxygen
- higher utilities requirements
- no selectivity for absorption between H2S and CO2
c) Fields of utilization
The DEA process is used to treat gases containing H2S, CO2 and alsc
COS, CS2, RSH (up to a total acid gas confent of 20 % volume)
H2S content of the treated gas lower than the normal specificatior
requirements (4 ppm volume) can be acheived. The CO2 content of the
treated gas can be as low as to 100 ppm volume. Performance of the
process depends on the CO2/H2S ratio in the feed gas.
d) Imoroved processes
1. Split flow (see figure 2)
For sour gases with high acid gas conrent (above 25 % mole), DEA
flow rate can be reduced. Investment cost increases significantly
(more equipment, conlplex columns, increased regenerator height).
2. SNEA - DE.4 orocess
SNEA company has developed a process using a higher concentratior
of DEA (above 30 % weight).
The process licenser claim to give in one step, for gases containing
0 to 35 % of H2S and 0 to 35 % of CO2, a treated gas matching the
most stringent H2S specification (4 ppm by volume).

TOTAL PROCESS ENGINEERING DESIGN MANUAL Revision : 0
TEPIDPiEXPISJ R GASSWCETENINC
Date : Z/81 I
12.13 ‘;
3.1.3.DICLYCOLA~IINE (DGA) PRXESS (FLUOR ECOSri.ilISE)
The DGX process has a limited number of units comepared wlfh LIE?, an I
DEA. I
Although in rhe public domaine, the process was developed by FLUOR and i
refered KO as the FLUOR EC\3NA&IINE process advantages and disadvantage:
to compare with .11E.\ are :
a) Advantages
- low solution circulation rate due to the concentration (same abs tio
capacity as MEA)
- low utilities consumption
b) Disadvantages
- needs cooling of rhe solutron during the absorption pnase
- high solubility hydrocarbons and aromatics are dissolved
- high solvent cost.
cl Criteria of selectron
Like &MEA, DCA reacts both with CO2 and CS2 and a reclaimer is
required. The process is applicable to gases with acid gas content from I
1.5 to 30 5% volume and C02/H2S ratios between 300/l and 0.1/l at
operating pressures above 15 PSIC. I
3.1.4.DlPA PROCESS
This process has been developed by SHELL under the ADIP trademark name. I
It is characterized by the selective absorption of H2 in presence of Co2.
I
3.1.5.MDEA PROCESS ,.
As with DIPA, ‘IDEA is characterized by its selectivity for Hz5 in presence
of co2. 6 i
!VDEA processes are proposed by process licensers : I
- SNEA (D)
- UNION CARBIDE’: UCARSOL
1 TE

e No
12.13
I) TOTAL 1 PROCESS ENGINEERING DESIGN MANUAL
I
Revision :
PageNo: I
4 an
er is
fron
‘1 at
and i
Irage! ’ I
I’ tio t.
‘! I ‘I
1:
I ame.
I . .
encc (
Date : 2185 12.14 T
3.1.6.HOT POTASSIUM CARBONATE PROCESS (see figure 3)
An activator specific to each process licenser is added to increase the
reactivity of the solution t
L BENFIELD (amine and other activators)
- CATACARB (amine and other activators)
- CIAMMARCO-VETROCOKE (arsenic and others activators)
The main characteristic of the process is that the absorber and the
regenerator operate at the same temperature (1 IO/l lS°C)
.
a) Advantages
- no degradation by COS and CS2 which are hydrolysed
- good-chemical stability - no need for a reclaimer
- no reaction with air - low heat requirements (isothermal)
- low hydrocarbon absorption - selective CO2 absorption
(ClAMMARCO)
b) Disadvantages
- licensing fees required - high water content of treated gas
- low reactivity with H2S - no mercaptan absorption
c) Fields of utilization
Applicable mainly on gas with high CO2 content. Low H2S absorptior
makes it difficult to achieve specification of 4 ppm volume.
Generally a two stage process will be used
- K2CO3 for CO2 removal - amine for H2S removal
This dual system (amine / K2CO3) can be in some instances more
attractive cost wise than an amine process.
3.1.7.CONSTRUCTION MATERIALS
Carbon steel generally utilized in the chemical absorption units
Regenerator can have a strainless steel cladding and trays. Reboiler tube:
can be stainless, but still subject to corrosion. Monel is an alternative b;
cost1 1, copper alloys shall be avoided.

TOTAL PROCESS ENGINEERING DESIGN MANUAL Revision : O page NO :
CASSWEETENINC; TEP/DP/EXP/SUR Dare : 2/85 12.15
Generally solutions treating gas with high CO2/H2S ratlo ~111 be more
- developed by NORTON CHEMICAL PROCESS can be applied to gase:
with large acid gas content.
- has been applied for sweetemng of gases conraining up to 65 % of CO;
and 9 % of H2S at pressure ranging from 25 to 100 bars abs.
- treated gas specification can reach 0,02 % CO2 and 1 ppm H2S. Wher
used to absorb selectively H2S or CO2 it can also dehydrate.
- other sulfur compounds (COS, mercaptans) are also eliminated.
corrosive. ,I I t
When the CO2IH2.S ratio is high, stainless steel will be preferred for the ,:
following equipment : amine/amine exchanger tubes, expansion value im
intern&, regenerator trays and reboiler tubes.
3.2. PHYSICAL ABSORPTION I
In this type of process, the solvent extracts the acid components by simple physical ; I.
contact and releases them by simple expansion at low pressure.
High pressure and low temperature favour the physical absorption. Table 2 lists the ,
advantages and disadvantages of physical solvents. These processes are applicable
especially in the case of high acid gas partial pressure: (above 5 bars also). I
Nor suitable for sweetening at low or medium pressure (10 bars abs) gases containing
large amount of heavy hydrocarbons. Can be considered for a selective absorption. ,
The main processes are :
I
3.2.1. WATER WASH
Can be used as prrmary treatment. For absorbers water wash can be realized 1
by addition of trays in the top section.
Because of its low efficiency, water wash should be used mainly on gases a’ IAitc,
a large amount of H2S. Corrosion prcblems for this process should be
considered carefully. I I
3.2.2. SELEXOL PROCESS (see figure 4) I’ I

norf
rTOTAL 1 PROCESS ENGlNEERlNG DESlGN MANUAL Revision :
I
.ing
I
I
:ed i
be i I
I’ I
I
ical I
the ,
:ble ;
TEP/DP/EXP/SUR
LASSWEETENING Date :2/M 12-16
3.2.3. FLUOR SOLVENT .
- developed by FLUOR, propylene carbonate is used as the solvenr
- primarly intended for the removal of CO2 from gas containing up to 50 %
volume residual CO2 content around 1 % volume in treated gas.
- CO2 solubility is higher than that obtained with MEA or potassium
carbonate.
- can be used to treat gas containing H2S and CO2. H2S content would
require a finishing treatment douwstream to obtain 6 ppm of H2S. COS and
mercaptans also absorbed.
- requires an extensive use frotating equipment.
3.2.4. PURISOL PROCESS
- proposed by LURCI uses n-methyl-2-pyr-rolidone as solvent
- as the solubility of H2S is higher than CO2 can be considered as a selective
process to remove H2S even in case of low H2S/C02 ratio.
3.2.5. RECTISOL PROCESS
- developed by LURGI, uses a refrigerated solution of methanol as solvent.
High selectivity for C02, primarly used on synthesis gas or on precooled
gas (cooling by an external refrigerant cycle for example).
- major disadvantage of the process, when not integrated in a plant already
equipped with refrigeration cycles, needs refrigeration and methanol
injection.
3.2.6. ESTASOLVAN
Developed by F. UHDE CMBH uses tri-n-butylphosphate as solvent. Selective
process for H2S extraction. If CO2 specifications on the treated gas are
stringent, additional unit downstream will be required.
3.3. PHYSIC0 - CHE.MICAL PROCESSES
3.3.1. SULFINOL
- this process has been developed by SHELL
- ir. loIves a physical solvent (sulfolane) and a chemically reactive agent
(DIPA alkanolaminel in aqueous solution.

TOTAL ’ PROCESS ENGINEERING DESIGN MANUAL Revision : 0 Page No .
GAS SWEETENINC TEP/DP/EXP/SUR Date :2/85 12.17
Suifolane permits deep absorption of CO2 and H2.S. Amine facillrares rht I
extractron of the acid gases from solvent during regenerarion t 1 i - performances for selective and non selective H2S absorption depencs or 1
operating conditions /
- process also permits extraction of mercaprans and other sulfur compound: ‘;
(COSL As for physical absorption, absdrption of heavy hydrocarbon:
occurs (mainly aromatics). Does not dehydrate rhe treated gas. Comparea *
to amine processes, SULFINOL shows a low foaming tendency
- SULFINOL solution freezes at about -2°C.
3.4. SOLID BED PROCESS
3.4.1. MOLECULAR SIEVES
- not widely used for gas sweerening
- can be used as a finishing treatment to remove mercaptanf
- absorption in molecular sieves is parricularly well adapted for LPC as
finishing treatment to obtan the sulfur content specifications of propane
and butane
- good absorption capacity for H2S low for C02. They remove water
preferentially
- sieve life is reduced for gases with high CO2 and H2S content I
3.4.2. IRON SPONGE PROCESS I
- could be also classified as absorption process or as a conversion process
(H2S is converted to sulfur) I
- mainly applied to gas with low H2S content
- discontinuous process, iron oxide has to be regenerated or replaced. I
Spontaneous combustion of the fouled product occurs with air.
4. CRITERIA FOR SELECTION OF ABSORPTION PROCESSES I
- there is no multipurpose process for gas sweetening, each case is specific and shall be
studied accordir3gly I
- final selection is done on the basis of economical criterial from short list of processes
which seem appropriate to satisfy the treated gas specifications I
TEPf
i
4
5. R

re No -
h2.17
ias or
ound:
.rbon:
parea -
G as
Ipane
dater
I
/ I
xess
I
Iced. I
I
II be I
fsses
I
I
I
“TOTAL 1 0 I
lEP/DP/EXP/SUR GAS SWEETENING
Date : 218s 12.18
chemical processes are characterized by their ability to absorb acid gases with a low
influence of the gas pressure. They require a large heat quantity for regeneration
physical processes performances are more dependant on gas pressure. At high
pressure with high acid gas partial pressure, the absorpyion is berter than for
chemical processes
selection criteria listed herebelow can be used for preselection of sweetening
processes but shall not be considered as definitive.
4.1. CO2 ABSORPTION (NO H2S IN THE GAS) (see figure 5)
4.2. SIMULTANEOUS ABSORPTION OF CO2 AND H2S (see figure 6)
4.3.
4.4.
H2S ABSORPTION (NO CO2 IN THE GAS) (see figure 7)
This is not a frequent situation with natural gases.
H2S SELECTIVE ABSORPTION (H2S AND CO2 IN THE GAS) (see figure 8)
Physical soivents ark particularly well adapted in this case.
Among the chemical processes, only MDEA and DIPA seem to be adapted for this
service.
5. REFERENCES AND USEFUL LITERATURE
(1)
(2)
Natural gas production transmission and processing
F.W. COLE, D.L. KATZ, L.S. REID, C.H. HINTON
Gas conditioning and processing (volume 4) gas and liquid sweetening by
ROBERT N. MADDOX edited by JOHN M. CAMPBELL.

TOTAL ( PROCESS ENGlNEEd;NG DESIGN MANUAL Revision : 0
Date : 2/9sJ I Ca.s SWEETENING
TEP/DP/EXP/SUR
UEA PROCESS
FLOW OIAGRAU
SWEET GAS
A
- 5 1
r--
= 20
=I. r-’
0
STILL.
= 20
‘-7
0 0. I / L..P . _
.
I r El
i 05( STEAM
h )
El
REFLux PUMP
.-
FLASH TAN*
L
RICH MEA/ LEAN YEA STILL EXCMAnGEA PEBOILER

? No
TEP/DP/EXP/SUR Datk : 2/85 12.2c-l
SOlJR
cG--
SPLIT STREAM I,
.~MINE PROCESS


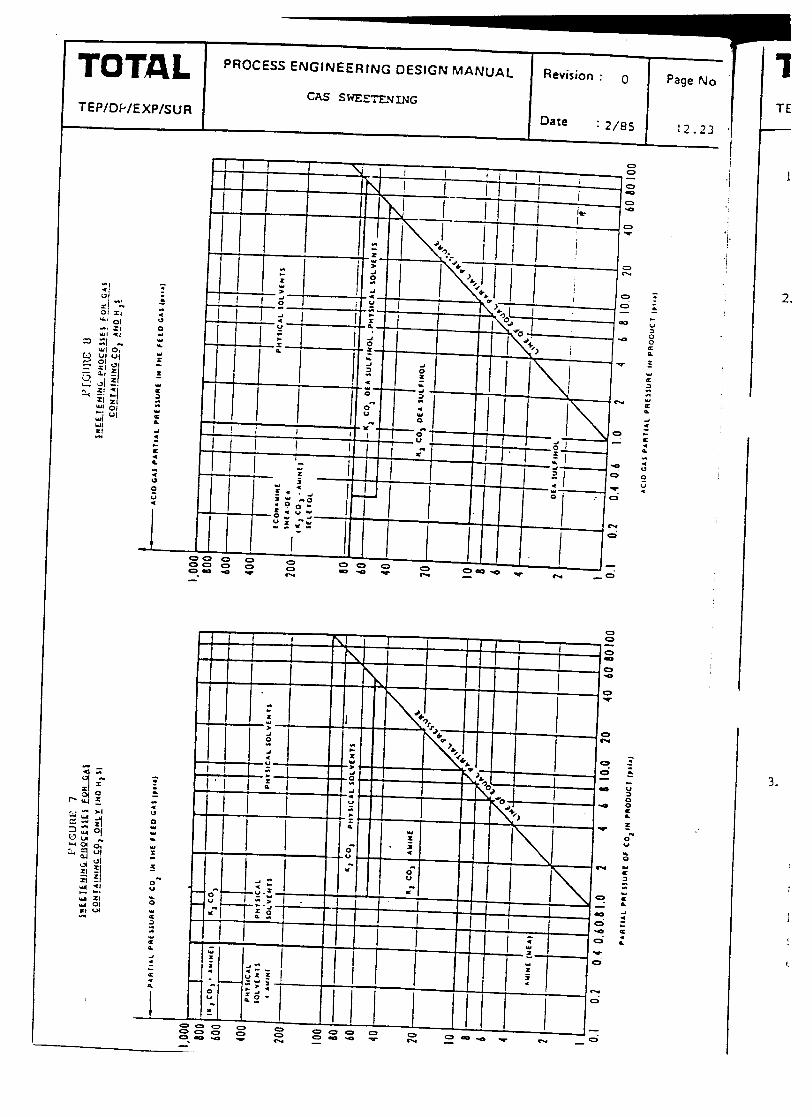


t ?
TEP/DP/EXP/SUR
PROCESS ENGINEERING DESIGN MANUAL . . : ) r;“rnz a8j beNo: iJ
13, UTILITIES

T ‘TOTBb: i PR’OCESS ENGINEERING DESIGN MANUAL Revision : 0 page No :
UTILITIES TEP/DP/EXP/SUR Date : 2/85 13.1
1. APPLICABILITY
For both feasibility and pre-project studies the engineer will be required to make ar
estimate of utility requirements both in consumptions and equipment rgquired.
This section details a few guidelines and notes on the following utilities :
WATER TREAT,‘vlENT
UTILITY liND INSTRUbIENT t\lR
INERT GAS GENERATORS
WATER SYSTE.LlS
FUELS
2. WATER TREATMENT
The following details the common used effluent water treatment equipment given in order
of effluent quality :
API gravity settler
. Usually the first line of clean up. Simply a settling tank with a top skimmer to remove
any floating oil or debris and a bottom skimmer to remove sludge.
. Effluent quality around 150 microns globules and 150 ppm oil.
. Large bulky items, cannot be used offshore. Either circular or rectangular in design.
. Simple, cheap very common in onshore use. ,
Tilted Plate Separator (TPS), Corrugated Plate Interceptor (CPI) ,
. Widely used both offshore and onshore.
. Uses plate packs, usually at 4s” mounted in a tank and relies on gravity settling between,
oil + water within the spaces between the plates.
. Effluent quality down to 60 micron oil globules and 50-200 ppm. I
. Can have problems with hrgh solids content if upstream settling tank is not installed. ! 8
. TPS units are u;ually used as the first treatment stage offshore.
Flotation units -
. Uses induced or dissolved air flotation to remove any residual solids/oil in the effluent.
Works in reverse to a gravity settler (small air bubbles trap debris and float to top of 1
ank).

PROCESS ENGlNEERlNG DESIGN MANUAL I
Revision : 0 I
Page No :
c
TEP/DP/EXP/SUR
UTILITIES Date ?/85 13.2
. Effluent quality better than 40 ppm. Vendors usually guarantee < 30 ppm.
. Can be used both offshore and onshore. Usually installed downstream of a TPS unit or
API separator. f
Filtration (Use for Water injection systems only)
. Filtration units either uses media beds (sand, anthracite, garnet, walnut shells) to
achieve water quality or filters (fibre socks, mesh, stainless steel cage).
. Usually not required for effluent water treatment unless very low residual solids
content enforced by local effluent standards.
. IMore commonly used for water re-injection where high quality, low solids level is
required. Can achieve l-2 ppm in certain beds, IO-15 ppm is more common.
. Units are generally compact but heavy due to media bed weight.
. Good pre-filtration is required to prevent fouling up of main bed units.
Effluent standards
Listed below are maximum residual oil content in effluent water for dumping to sea :
NORTH SEA 40 iv-n
INDONESIA + MIDDLE EAST 30 wm
CHINA 20 wm
LOCAL ESTUARY (river) 5 ppm (European standard)
Process drains, produced water, deck (site) drains (see figure 1)
. Produced water may need degassing before treatment. If the amount of dissolved gas is
small it may be possible to handle it in the TPS unit.
. Deck or site drains normally flow to a separate sump tank before de-oiling. If the deck
dralnage is small or produced water flow is small can combine both streams through one
TPS unit.
. Process drains are normally manually initiated and pass directly to the return oil stop
tank. These drains are generally water free.
. Always try to use gravity feed between units. Pumping can cause emulsions and make
oil-water separation harder. Similarly avoid fast flowing lines and turbulent pipe
arrangements.

TOTAL ( &ES ENGINEERING DESIGN MANUAL Revision : 0 Page NO
UTILITIES TEP/DP/EXP/SUR Date : 2185 13.3
3. UTILITY AND INSTRUMENT AIR (see-figure 2)
Compressed air is used on plants for instrumenr control, turbine and engine start-up an
utility services eg : pneumatic tools, cleaning, etc. : t
. For turbine/engine start-up 17-25 bar supply will be required.
. For general instrument and utility air, compressor discharge around 9 bar is adequate.
. Consumption : use 0.6 scfm (0.017 m3/min) for each air pilot (= valve)
(instrument air) 0.8 scfm (0.022 m3/min) for valve positioner
generally 1 m3/h per valve unit will do as first estimate.
Add 25% to compressor capacity for design.
. Utility air : consumption is intermittent and difficult to estimate at early project stage-
Add 75-100 scfm (130-170 m3/h) to compressor capacity for initial estimate.
. All plants should have 100% instrument air standby capacity.
. Utility and instrument air can be supplied from same compressor or separate one!
depending on capacity requirement.
. Instrument air must be dried before use. Dew point of air is dependant on minimum air
temperature in location of unit. Generally dessicant bed driers are used giving dew point
as low as -60°C.
. Size air receivers to give lo- 15 minutes of instrument air assuming the compressor gee
down. Pressure in the instrument air receiver should not fall below 80 psig (5.5 bar g)
during this period.
. For long air transmission headers in cold climates intermediate KO puts may be required.
. An estimate of compressor and dryer weights and power are given in figure 3.
4. INERT GAS GENERATdRS (N2, CO21
Inert gas is required in all plants for purging and inerting of equipment. For small*
requirements N2 bottles can be used in racks, this however is not feasible for large units ant
so gas generators must be supplied. The main types of generator in use are : . -
- cryogenic distillation of air
- oxygen absorbtion on sieve ’ - gas combustion
. For purging purposes estimate capacity based on 3 times the volume of the largest vesse’ i
11 be purged in one hour.
I

I
TEp/DP/EXP/SUR UTILITIES
Date : 2/85 13.4
. Cryogenic distillation is used only for large volume requirements, specifically LNC
plants. Not used offshore. .
. Gas combustion produces a N2, CO2 mixture for inerting and purging purposes. Not used
much these days except for onshore large volumes. c
. Pressure swing absorbtion is the must common used method for N2 generation. Skid
mounted units are sometimes supplied with dedicated air compressor, or can use
existing plant air compressor for supply. Air consumption ‘is 4-5 times inert gas
production rate, residual 02 in gas is l-2%-3%.
. Details and weights of common units are given in figures 4 and 5.
5. WATER SYSTEMS
Seawater
Used for cooling purposes both onshore and offshore. Can also be used as wash water,
sanitation water and feed to potable water units.
Seawater is also used for fire water systems but is usually ‘a separate system. The
seawater cooling circuit is normally connected to the fire water ring for emergency
supply only.
Always coarse filter the seawater before circulating to the plant. This removes any
debris or marine life.
Treat with chlorine at l-2 ppm concentration - maintain a residual Cl’ level in the
water exit at 0.3-0.5 ppm.
Seawater exit temperatures to outfall canals or drain caissons should not be above 4O’C
to prevent corrosion.
Once through water systems are preferred for small cooling duties with only 3-4
exchangers. For large duties and number of units where the cost of corrosion proofing is
prohibitive consider using a closed loop cooling medium system. Common used is
25% TEG in water.
For cooling medium/seawater exchangers consider using titanium or similar plate
exchangers. These are especially ideal- offshore due to reduced weight and space
requirements.

TOTAL PROCESS ENGINEERING DESIGN MANUAL Revision : 0
TEP/DP/EXP/SUR UTILITIES
Date
Potable water
Depending on location of plant potable water can be made in sit% or supplied by tanker
for srorage, or taken direct from a mains supply.
For onshore plants most common method of water supply is evaporative distillation.
Problem with these units is size and weight are high and residual TDS (Total Dissolved
Solids) is 5-10 ppm. This results is a bland distilled water which is not pleasant to drink.
Increasingly popular now are Reverse Osmosis units (RO) which are lighter and need less
maintenance than evaporative units. Water quality is 400-500 TDS (World Health
Organization TDS for drinking water is 500-1000) operating costs of RO un’ is
1.5 times that of evaporative distillation.
Power consumptions : for a 100 gph (0.38 m3/h) unit.
Evaporative Distillation unit (EO) 3.5 kw
Reverse Osmosis NO) . 5 kw
Vapor Compression unit (VC) 15 kw
. Most common unit offshore at present is the VC unit which is very reliable and easy to
operate. Unit operates at IOO’C and is more susceptible to corrosion.
. RO units are relatively new, operate at ambient temperature and has few mechanical
parts for servicing. Average membrane life is 3 years.
. Consumption : estimate on 50-60 gallons per day per man (0.2 rn3).
Storage : allow IO- I5 days for offshore units
10 days for onshore remote areas
. Potable water can be dosed with hypochlorite at 0.4-0.5 ppm to inhibit bacterial growth.
Waste water and sewage
. Before discharging to river, sea, or underground sewage + waste water must be treated
to meet local health regulations prevalant to the area of siting.
I
I
.l
I’
. Limits are imposed on BOD (Biological Oxygen Demand), COD (Chemical Oxygen I
Demand), coliform bacteria count and TDS.
Example limits are : bacteria < 200 per 100 ml I !
TDS < 150 ppm
BOD < 100 mg/l I CI- residual > 0.5 mg/l < 1.0 mg/l
I I

-5 --
tker ’
Ion.
ved
<.
ess
Jth
is
I
I’
I
to I
xl I
I /
1 7.
1,
ed I’
en I
TOTAL PROCESS ENGINEERING DESIGN MANUAL Revision : 0 ’ Page No :
UTILITIES
TEP/DP/EXP/SUR Date Z/85 13.6
. Sewage is treated by physical artrition, airation and chlorine dosing to 30-40 ppm rav,
sewage.
. Provide 15-29 hr retention time for enzymic action to reduce BOD.
- AUOW 30-50 gall/day per person (0.15 m3) for sewage, show%r, laundry ano kitchen
wastes. Use upper limit for hot unsociable climates.
6. FUELS
Diesel
. Used for emergency generators, Pumps motors and air compressors, cranes, and
alternative fuel for turbines.
. For emergency equipment provide individual day tanks sized on providing fuel for 24 hr
operation.
. [Main diesel tank (for feed to day tanks) should hold IO-12 days supply. This is dependant
on location of plant and normal supply periods.
. Diesel should be filtered to - 5 ‘&iicrons. Can be centrifuged to remove residual water
and smaller particles. This is especially recommended offshore where longer storage
times, supply boat debris, seawater contact and poor supply quality can lead to
operation problems.
. For storage use atmospheric venting tanks with vacuum-PSV vent. Use crane
pedestrals, platform legs or inter-deck space for offshore storage.
Gas
. Fuel gas is supplied as normal fuel to generators, turbines and any gas driven motors.
. Always pass FG through a scrubber before use. Filter gas supply to turbines to
10 microns (generally turbine manufacturer will state quality required and may include
his own filters) - do not rely on this and provide separate treatment anyway. ’
. it\aintain FG temperature at least 15°C above dew point. Minimum temperature of gas
IO be 5°C.
. Common supply pressures are 15-20 bar (some jet engines need 35 bar).
. Size fuel gas supply on maximum design duty of all users operating. Allow + 10%
margin.
. FG used for flare purge and pilots, etc., does not need to be filtered to 10 microns - use
gas straight off scrubber overheads.

TOTAL TEP/DP/EXP/SUR
I PROCESS ENGINEERING DESIGN MANUAL
UTILITIES
I F ‘recess water and deck diain water treatment
1 Compressed Air System r

lge NC TOTAL TEP/DP/EXP/SUR
PROCESS ENGINEERING DESIGN MANUAL. Revision : 0
UTILITIES I Date ’ : 2/85
f ICURE 3
EST,MATE OF WEIGHT AND POWER FOR INSTRUMENT A4R UNITS
1600 .:.-. :- ::. -. J:.-.:; _:..
3 ..:-..-
., .:l ; y.; r . . _- ‘: 1 ..z 2:. r /:. * :
“-.
_ , -. - . . - -
~~~~~~~~~~~~~~-;;~~~ .. I : ;:.. : .-: .:.. .:
:-..---;.” ‘- : ; ; -‘& . ..- ~~--~, ::, :
,2;--::, ,. z;zi:---‘;
II.-...= -5 ;=;-:.:..E:. ._‘.Y= :.-
i “-i :ci;ci.:‘;i<jf: ;.;&zzc=tr::...;: :..
yzI-=:.= z-.‘-‘::-+yr:.-:...- - ,
-r’-
.! : .i I .ij.l:. . . ..m------.---- -.
. ..-....-.-..---.. -. . .
1.. ::‘
.-.--::: -_.. - ..---.-..:.- ..__...-. .---
.=;;.ry:T.=.- .~:::;:::L::~-.~:.:~ ,. ~. .,: i
I.-.. -‘i- _--- 1 :y&
200 300 do0 so0 600
CAPACITY Nm3/h (0’C + 1 bwrl
Layout plan
_ . . - - . . . . ..-... -_.- ~-::,-::r:--:li’.-;i:.~::. : .
Page No :
L 13.8
-0
700 600, 900 1000

0, lcsidurl wnltnl in ptodoct
c Ptocz,s ptcctutr bat
0, residual wolcol la ptodltd
Technical data
Small plank Rudy.fotoptnlion plant8 in one unil Fully fwdoo. md pctformmu.lcslrd. No ituullttioo vott No wditq watt tcquitrd.
_-_------ -
Type Mu 0,Y dtsiwlioo mnmnl
~yu~uc’ ptyc j;S bu *
~J;$o$FI ptcstutr 6 bar ” PtJvct
ill produL-4 pnyy catuumplion qunur) WtUUlllpllO” , .pptor LW ,pptol. LW
---- -- q qfh _---. ---. . . . ..- -- --- .--_..
DwNl@ i’ I: I
ii
II.5 IS II
1 10 9 14 _._-__ ----_-._ .-. .-_- ---.--_-- OS II
DWN SO :
1: :: SO lo :; I9
0 ~---‘--G -. . I . __ __ .- _- . . . -. _ . _ . - _-
II ho IfI DH’N W
: E :i 8% 41
II) 4k -_______ ____.__ --.. . ..__. -- . . ..-.._____. _.-
05 II0 70 DH’N 110 I K 2 WI 71
3 II0 w UO lb ---.- .-.._ ---.---
Laqc plants: Rudyktaprntion plmu from fuoclion.tzsttd unik ,.tinlmd ilUU”JllOO WOtt
TYQc Mu 0,Y drriyvtiun
;,,;uo$td ptrrw~;S bat t;;u$c~ ptcs;u&,brt Caol~ VIICI “l’h CO”lC”l, N, ptodua ptc,tutx in ptoducl qurnlity consumption quanut, wntump~wn 4 S bat b bar
~A!!2 rppro.. LW Y.!z! ql,W”h IW
--- -- ---.- .-.. .- ..--- -. - _-. 05
DH’N 400 I :z I:! Ct I70 IW I: ii
I NO 111 Sal loo IS II --- . . . ---------A-
05 410 III 11 DWN 700 : $10 ii :I ;:
610 E II0 ml II ii -- ----.... -- . ..-._ - .--.-.-.- 0% 910 190 IKKJ 510
DHH 1600 : Ill0 410 1440 510 :: :: Ill0 . 450 lwl 610 (I 41 11
--- _.._-._. .-.-.. _ _ __.__ -. I .-_

i.
15, DATA
TOTAL PROCESS kNWNkkHlNG DESIGN MANUAL Hcvtsron : Page No :
*-- .r
TEP/DP/EXP/SUR Date : 2185 I
.
P
. .

TO?‘AL PROCESS ENGINEERING DESIGN MANUAL -: ..-
TEP/DP/EXP/SUR I
DATA SECTION
2 General data 3-9 Conversion tables
10
II-14 15 16
PSEUDO CRITICALS AND OIL PROPERTIES t
17 18
Figs. 1-3 4 5
.6 7 8
Physical properties of hydrocarbons Compressibility factors of natural gas Pseudo critical pressure VS. MW Critical constants for gases and fluids Critical temperature VS. normal boiling point Characterised boiling points of petroleum Fractions Molecular mass, BP, and densities of fractions
19 20 21
22 23 24 25
26
DENSITY 10 II
Relative density of petroleum fractions VS T Relative density of petroleum fractions VS MABP
12 13
VISCOSITY Viscosities of hydrocarbon gases Viscosities of hydrocarbon liquids
‘ASTM viscosity chart .;
VAPOUR PRESSURES
27 2s 29
30 31 32 33
14 15 16 17
Low temperature vapour pressures : ,High temperature vapour pressures True vapour pressures of petroleum products and oil Hydrate formation pressures
SPECIFIC HEATS 18 Specific heats of hydrocarbon vapours at 1 ATM 19 Heat capacity correction factors- . 20 Specific heat capacity ratios at I ATlM 21 Specific heat capacity of hydrocarbon liquids
34 35 22
23 24
THERMAL CONDUCTIVITY Thermal conductivity of natural gases Thermal conductivity ratio for gases Thermal conductivity of hydrocarbon liquids
36 37 38 39
40
41
42 43
25 26 27
LATENT HEATS OF VAPOURISATlON Latent heats of various liquids Latent heats of hydrocarbons Heat of combusion of liquid petroleum fractions
44 45
46 47
48
28 29 30 31 32 33 34 35 36
SURFACE TENSIONS - MISCELLANEOUS Surface tensions of hydrocarbons Dew points of natural gases Solubility of natural gas in water and brine Solubility of methane in water Solubility of natural gas in water
i Solubility of water in hydrocarbons Temperature drops for expanding gas Temperature drops for expanding gas Physical properties of gas trearing chemicals Physical properties of water Physical properties of air
Date
,
L
.

0 :
-I
,
,
~‘HuL;~S~ tNUlNttHlNG DESiGN MANUAL
TEP/DP/EXP/SUR
:i
-iUIAL Revision : Page No :
Date : 15- lo
.
P

TEP/DP/EXP/SUR
The relation of Degrees Baumb or h.P.1. to Specific Grawry IJ expressed by the following formulas:
For liguds lighter than water:
Degrees Baumk = -!$- - 130.
G= 140 130 + Degrees Baumi
Degrees A.P.I. = y - 131.5.
C= 141.5
131.5 + Degrees A.P.I.
For lrqolds heavier than water:
Degrees Eauma = 145 - F.
C= 145 145 - Degrees BaumC
G = Specific Gravity = ratio of the weight of a given volume of oil at 60” Fahrenheit to the weight of the same volume of water et 60” Fahrenheir
To determine the resulting gravity by mixing oils of dif- ferent gravltla:
D= mdt + ndz
mtn
D = Density or Spktic Gravity of mixture m = Volume proportion of oil of dl density n = Volume proponion of oil of dz denrity
dt = Specific Gravity or denrity of m oil Q = Specific Gravity or density of n oil
USEFUL NON I
‘C = 519 (“F - 32)
‘F = 9/S (“C) + 32
K= “C + 273.15 = S/9 R
“R = “F + 459.67 - 1.8 K
SI Rcftxa l d Multipliarfm Fsctm
Rda symtd IO” terr
JO’ Pm a IV M IP %? k
10’ hato h IO’ dea dr IO- dai d 10-a centi C I IO-’ milli al IF miau u IO-’ ran0 0 lo-” lo-” ZiO ; lo-‘* ItlO I
I Accduaum of grrviry = 9.61 mfr2 32.17 tr/d
I I I
j MASSE
:.
qnmmc
8.
. mmc
1 ne mCtnqu
nton IUJ
001bm) --
I-g Ion IL f3
‘40 Ibm)
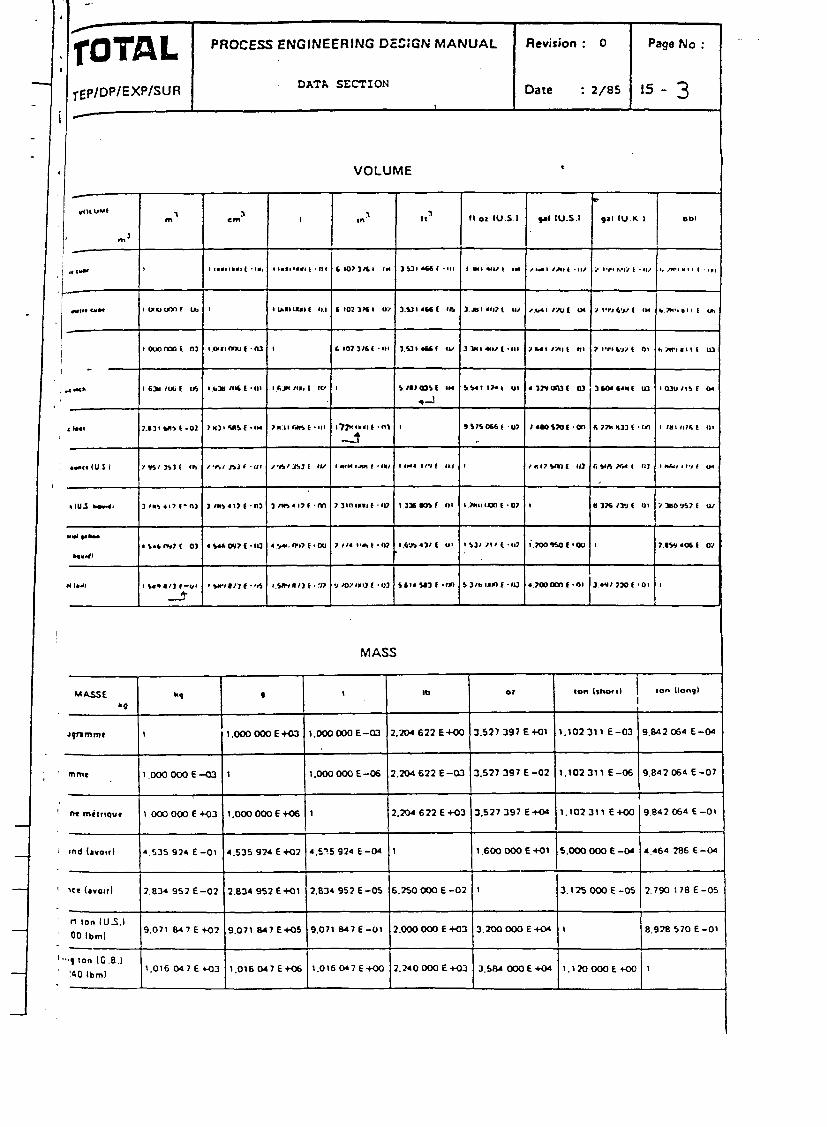
/
PROCESS ENGINEERING roTAL DESiGN MANUAL Revision : 0 P8g8 No :
DATA SECTION Date : 2/85 15 - 3
1 ocx3000E+03
2.834 952 E-02
n ton IUS.)
00 lbml 9.071 &(7 E+oI
--I--
'"'q Ion It .8.)
‘40 Ibml l.O16Op7E+O3
MASS
son (short1 I ton wm9l I 1
.OOO CXX EMI3 1,000 000 E-03 2.2O4 622 E+OO 3.527 397 E to1 ~
l.OOO OOO E-06 2.204 622 E -03 3.527 397 E -02
.OOOOOOE+06 1 2.204 622 E ~33 3.527 397 E+O4
I.535 924 E +Q2 4.5?5 924 E -04 1 1.600 000 E +Ol
2.834 952 E +Ol 2.834 952 E-M 6.2SO 00 E -02 1
I
3.071 847E+OS 9.071 647E-01 2.OOOOOUEfo3 3.200OOOE+04
l.o16047E+06 l.O16047E+OO 2.240OOOE+O3 3,584C0OE+O4
.102311 E-03 9.842064 E-O4
.102311 E-O6 9.842064 E-07
I.102311 EMO 9.842064 E-01
5.000 OMJ E -04 4.464 286 E-Or
3.12SOOOE-05 2.790 178E-O!
I a.928 570 E -0
l.ImmoE+oo 1

4
.
TOTAL PROCESS ENGINEERING DESIGN MANUAL Revision : 0 Page No : :
TEP/DP/EXP!SUR DATA SECXON Date : 2/85 15 - 4
L
o4RE.4
CCnllmttR orrC 1.000000E-04 I I I '.ooooooi-06 2.471 054 i-08
!
j ‘.55ow3E-01 j ’ 076391 E-03
t
! art ‘.ooo000E+o2 l.OOooOOEG i
I ’ / 2.4 71 on E -02
!
1.550003E-05 ’ I ‘.o76 3g’ E”03
Icn 4.046856E+03 4.~60%E+o7 4.046856E+Ol 1 6,272639E+05 4.3% 000 E foe
1
cqurrt tnch 6.451 600 E -04 6.4511 600 EM0 6.451 600
EG 1.5% 22s E -07 1 I I
6.944 444 E -03
rlprrt toor 9.290 304 E -02 9.290 304 E co2 9.290 304 E-w 2.2%6&o E-05 I.440 oca E+O2 1 -1
LENGTH e I
- .- 0
LONGIJEUR m cm u A tn :“I fC 111 mtlt m !I
nr1rt I l.OWoOOE+06 l.M)OOOOE+10 3.937OO8E+ol 3.280840E+00 6.213712Eeo4;
tnllmttre 1.omocaE-02 1 ‘.O@JO@JEW ‘.OOOOOOEW8 3.937008E-O’ 3.28084OE-02 6.213
.- I meron 1.0000ooE-06 l.OOOOOOE-O* 1
I I l.oOooOoE+04 3.937oOSE-05 3.280840E-06 6.213712E-10
I I- II L in c fC
,
~cptrom ‘.000000E-IO I.OOOOOOE-08 l.OOOWOE-or 1 3.937008E-09 3.280&40E-10 6.213 712E-14
I -
Ich (pow) 2.YOOOO E-02 2.54OOOQ E+Oo 2540000E+CM t.SoOOOOE+o0 1 8.33J 333 E-02 1.578 283 E-05
.‘I
JOC (pttd) 3B48000E-01 3,O480OOE+01 3.048OOOE+oS 3,0a8OOOE+o9 1.200OoOEWl 1 1.893 939 E-04
ldt (U.S. SCJ~IJC~) 1.609344 EM3 1,609 344 E+oS 1.609344 Ei09 1.609344 E+13 6.336OOoEW4 5.28ooOO E+03 1 I
LL
VELOCITY I
:’
r
,
-
M
-
kil0g
-
pm
pour -
P”’ -
PO”1 -

TOTAL PROCESS ENGINEERING DESIGN MANUAL Revision : 0
I------ ’ . ’ TEP.‘DP/EXP/SUR DATA SZCTION Date : 2/85 _.
. - i
I
-I
-I
’ i
VOLUMETRIC FLOW
m’lmn wm ilSIS * tl’/h Bblld
1.104 on E-01
DENSITY
MaSSE VOLUMlaUE
m“ kg hdm ’ dcm
s Ibh’ Iid
mund wr wb~c fco1 1.601 646 EW1 1.601 &(6 E-02 5.787 037 E-04 1 1.336 806 E-01
1.19B X4 EM2 1.1s aj4 E-01 4.329 0011 E-03 7.460~19E+CG . 1
I I

I TOTAL I TEP/DP/EXP/SUR
PROCESS ENGINEERING DESlGN MANUAL -yzr-jq; PRESSiRE .
.i
TOTAL

,C-01
I-01
TE?/DP/EXP/SUR
PROCESS ENGINEERING DESIGN MANUAL .y” - -
DATA SECTION
I I 1 Revision : 0 Page No :
Date : 2/85
VISCOSITY (Kinematic)
jCOSlTE CINEh4ATIOUEI .
m’l, CSI 11=.1, tr:/ll DIFFUSIVITE
ml= 6 ‘I L‘
1 l.ooooooEc06 1.076 391 E+Ol 3.a75 co8 E 44
rntinok#r 1.OGoOooE-06
I
1
I
1.076 391 E-05
I
3.875 ma E -32
,uarr foot prr vcond 9.290304 E-02 9.290 300 E +cM 1 3.600 OW E 43
-
uare fool per hour 2.580 640 E -05 2.560 640 E +Ol 2.777 778 E -04 1
-T- B’“I.T. hph
.365666t-0, 1,556565t-0

TOTAL TEP/DP/EXP/SUR
PROCESS ENGlNEERtNG DESIGN MANUAL
DATA SECTION Date : 2/85 15 - 8 i I
w
SPECIFIC HEAT CAPACITY
! THERhlAL CONDUCTIVITY
HEAT TRANSFER COEFFICIENT
c
- Brtrnh
ptr de1

Tom& 1 PROCESS ENGlNEERlNG DESIGN MANUAL Revision : 0 Page NO :
Date : 2/8S 15 - 9 TEP/DP/EXP/SUR DATA SZCTION
HEAT CAPACITY/ENTROPY
ENrROPlEl CAPACITE THERMIQUE
m: -z K-l cy.,
I . I
J/K l&d/K i BCd- F
I it
I 2.390 05’1 E-W i
1.706 071 E-03
I
I
.i.lW WOE+03 1 j
7.138 2ooi-00
I
5.861422 EMI l.ao 913 E-01 I
I
t
I
I
I
I
I
I .’
I
!
I
,.
POWER/HEATFLOWRATE
t of rrfriq.
’ *,mr ,w.u .“,,
I.”
15,665,f”O

TOTAL . . ..- PROCESS ENGINEERING DESIGN MANUAL
TEP/DP/EXP/SUR I
DATA SECTION
Revision : 0 Page No :
Date : 2/8S r '5 -I()
PSEUDO-CRITICALS AND OIL PROPERTIES
True vapour prwure : - actual vapour pressure of a crude oil at the actual
temperature of the fluid.
Reid vapour pressure : - reference vapour pressure of an oil af a controlled
temperature of 100 “F (used as a basis for product specification).
. .
Molal average boiling point : - equal to the sum of the mole fracrion of each
component x its atmospheric boiling point “R, ,
Volume average boiiing point : VABP : - average temperature af which the ASTM
10 %, 30 %, 50 %, 70 % and 90 % volumes boil. -
VABP = TIO % + T30 % + T50 % + T70 % + T90 % 5
Mean average kding point : MABP : - the slope of the ASTIM distillation curve is used
ro correct the VABP to give MABP. See Fig. 7
Cubic average boiling point : CABP : - another corrected form of VABP.
UOP K or WATSON CHARACTEFUSAIION FACTOR
K = CABP ‘4
% sg at 60/60
CABP in “R
.
This issued as a characterisation factor when defining crude oils. It is required for
various other data evaluations.
h
-
TEP
-
1 Mer 2 E:n 3 Pro
c
A n-9 5 Irot
6 ~J=I 7 lsoc
kc -
.1-H J 24.4
11 3.4 12 Net 13 2.3.
10 n-n 15 2M 16 344 17 3-51 18 22. 19 2.4. 20 33. 21 Tnc
22 no 23 Our 24 Isoc
25 n-N, 26 n.Dr 27 Crc 28 Mer’ 29 Cvc 30 Mer
31 Erht 32 Proc 33 1-h 34 err-; y .-an
mb

PROCESS ENGINEERING Q.ESIGN MANUAL s5 Page No :
-. --” -
TOlTib
;
190.55 o.w6 17 305.43 O.OO492 369.82 o.ocd 6.0 425.16 o.w4 33 406 13 0.004 52
3368. 469.6 0.004 21 3361. 460.39 O.ooO 24 3199. 433.75 0.004 20
0.004 29 0.03426 0.001126 o.oDa17 . 0.004 15
o.OO431 0.0% 20 o.OO403 o.oDp 15 0.004 15 o.ooo 17 o.ooo 13 0.003 97
568.76 o.ma 31 599.99 0.004 22 543.89 o.ma 10 594.56 0.004 27 617.4 O.ooO 24 511.6 0.003 71 532.73 0.063 79 553.5 0.003 68 572.12 0.003 75
O.ooO 67 0.004 30 0.004 28 0.004 17 O.tXX 24 O.OCM 26 o.ca 22
IO.009 05) o.ooa 09
(0.004 061
o.ow 34 0.00328 o.m3 43 0.033 53 0.003 46 0.00346 0.003 54 0.00354 0.00356 0.00356 0.003 38 0.003 38 0.00357 0.00357
0.003 6a 0.0036a 0.003 62 0.00362 0.003 32(331 0.003 x2(331 0.002 14133) o.OcJ2 14l33) 0.002 07 0.002 07 0.00190 O.OrJl 90
0.001 75 0.003 18 0014 36(321
_o.w222
TEP/D?/EXP/SUR
PHYSICAL CONSTANTS OF HYOROCARBONS(27)
SreNottNo -
-I== Commund
2.
-161.52(2E -88.58 -42.07
-0.49 -11.81
EE 9.50
68.74 60.26 63.27 49.73 57.98
98.42 90.05 91.85 93.48 79.19 80.49 86.06 80.88
125.67 103.11
9924 150.82 174.16 49.25 71.81 80.73
loo.93
-103.77m -47.72
-6.23 3.72
-!gY 2946 10.85
-4.41 36.07
-84.8@ 80.09
110.63 136.20 144.43 139.12
:z:: 152:41
649 70.29
-19149 -xl.51* -60.31 -10.02
-33.33(x1 -194.2121 -252.87" - 182.962" -195.80(31
-a.03 100.00”
-268.93(32 -65.00 ---.
1
16.O43 30.070 ~.W? 58.124 58.124
12.151 72.151 72.151
86.170 86.178 86.178 86.118 86.178
loo.205 100.2O5 im.205 im.205 I 00.205 too.205 too.205 i m.205
I14232 114232 !14.232 128.259 142286
70.135 84.162 84.162 96.189
Z&O54 42.oBl 56.108 56.lO6 56.108
Exz 54.092
22% A 26.038 78.114 92.141
106.168 106.166 106.166 106.168 104.152 lM.195
32.O42 46.069 28.010 44.010 34.076 64059
17031 28.9W
2.016 31.999 28.013 70.906 18.015
am3 36461
-95.32 . 3012. -153.66 3010.
- 3 124. 5061. 3127
5074 497.45 sm.4 400.73 499.93
2736. 27w. 2814. 2891. 2773. 2 137. 2945. 2954.
540.2 530.31 535.13
p,::z '519.73 536.36 531 11
2 486. - --. 2486.
f Z: 2099. 4 5O2. 3 785. 4 074. 3472.
5001. 4 600. 4 023. 4 220. 4-07 - E:
(4 5O2.1 4 330.
13850.)
282.35 3m.85 419.53 435.56 426.63 417.90 4M.78 lM4.1 425. '4&d .I
6139. 4896. 4 106. 3609. 3734. 3536. 3511. 3999. 3209.
ma.33 562.16 591.80 617.20 6P.33 611.05 616.23 6476 631.1
8096. 512.W 6 383. 513.92 3 4QQ.u3) 132.9213: 7 382.m) 300 19(X 9m5. 373.5 7 894. 430.6
:5 ow.1 -182.4?* 6000.b -182EO4 1341. -187.684
377. -138.36 528. -159.60
115.66 151.3 289.
3728 50.68
:3::: 55.34
1230 1722 16.16 15.27 26.32 24.04 2093 25.40
4.143 8.417
12.96 1.40 0.473:
73.91 33.85 24.63 12.213
-
1596: 451.9 337.6 365.8 452.3 141.65 269. 43a. 12377 -
2436 7 895 2.07 2.05 253 2.65 185 1.47
36.43 17.70 -
2 EvtJnt 3 Prooanc 0 n.&Jtsnt 5 IrocwrJnc
:: 16 17 18
:: 21
z! 23
I:
f ':
it
E
% 33 34 F
-99870 -128.54
-90.582 -llE2? -
-118.6O -123.81 -119.24
"%3:, A
-56.76 -91200
-107‘36 -53.49 -29.64 -93.866
-142.46 6.554
-126.59
-169.1S4 -18525d 45;:"
-105.55 -140.35 - .-- -165.22 -136.19 -108.91
1PJnIJm Jlj 13&JIJolene 3Q 138UI~lJne 40 IsoofCM
41 ACIWICM 62 Bcnzcrr
t
43 Tolucne 44 Etnvlbtnrcnc 45 o.xvlcnc
46 m.xvh?nJ 47 LB-Xvlcne 46 Swmt 49 I
lSOO~OOYItlCI-lltN
50 I Mtlnvl Jlconol 51 ElhVl JkOnOl 52 CJrWn monoxmx 53 Groan OIORKIC 54 ~v0eqtn wlftae 55 Sulfw at0~m
56 Ammoma 57 AM 58 Hrdrcqtn 55 O.vpen ISO Nttr~pen 61 Cnwlnt 62 WJ1.r 63 Utlwm 64 uvdmqtn cnmrtat
. -.-- - - .
-145.95
-8O.ed 5.533
-94 99 1 -94975
ZU.0
-25.18~ 47.87
13.26 -30.61 -96.035
-97.68 -114 1 -2Q5.04
-56.574 -85.534 -75.484
--77.d
C~H,O :0
2881. 6X.8
1513. - A -
405.6 132 412)
33.2 154 71331 126.1 417 6473
5.2(321 324 7 .._-_ -- .-
11260. 3 771.12) 1299) 5081. 3399.
113J 7377
7711 22 118.
227.5n2I 0303. - - ._- .-._

TEP/DP/EXP/SUR
PROCESS ENGINEEEICS DESIGN MANUAL Revision : 0
DATA SECTION I
Date : z/es
PHYSICAL CONSTANTS OF HYDROCARBONSl27)
4 * v E P,
I" 5 I’S
I I
-
0 .WT?dh 0.002 llrn 0.002 lQh
0.001 57 0.00162 0.W16?h
O.Wl 35 O.Wlag 0.001 3s O.Wl40 o.w13!5
0.001 24 O.Wl22 O.Wl 24 0.001 26
i%E ii o:w1 17 O-Ml 24
O.ool 12 0.001 17 0.001 17 0.001 I3 o.wo 99 0.001 26 0.001 28 0.00122 O.ool 13
o.GM 0.00209" 0.001 76& O.WlO~ 0.W2 16h 0.001 60 0.001 76h o.w2oY O.WlS5
- 0.001 19 O.Wloa o.wo 97 o.ow 99 o.oou 97 o.ow 97 o.oo103 o.wo 97
cl.Wl 17 o.oo107
- - - -
- - - - - -
o.ooo 14 -
0.006 03
0.3)’ 03581h O.SC& 05!347.- 0.5637"
l3w.)' 357.P.
$$' 563.2'
0.6316 631.0 624.4 596. 7h
0.6644 6633 0.6583 657.7 0.6694 6688 0.6545 653.9 06668 666.2
0 6686 688.0 0.6635 662.8 0.6921 691.5 0.7032 702.6 0.6787 676.0 0.6777 677.1 0.6980 697.4 0.6950 694.4
0.7073 706.7 0.6984 697.7 0.6966 6s6.0 0.7224 721.7 0.7346 733.9 0.7508 750.2 0.7511 753.4 0.7836 783.1 0.7744 773.7
0.5231h 06019h 0.6277h 0.610Sh 0.6clOh 06462 0.6576h 0.626d 0.6866
0.675' o.aixci 08723 00721 0 8850 0.6691 0.6661 0.9115
522.6”*’ 601 4h 627.1h 610.0h 600.Sh 645.f 657. 627.0h 686.0 -
884 2 6716 671 3 880.2 868.3 865.3 910.6 866.0
796.0 791.5 768.6"(341 821.9hms, 789~.'(36 396. .'f361
617 +(fO, ess.-
71.oom(371 iai.mfja) aO8.6"'(331~ 4245 9991 ~25.U-'(321 053ti
-: - - I z+= g 4 0.5539 1.0382 1.5225
;:z
Z.ogrc 2.4911 2.a9r I
2.9753
f-;:g 29753 29753
s.os96 3.45% 3.4596 3.45%
E$ 3.45% 7.4596
oea1 ga:
-EC 1 706 1625 1.652 1616
1.622 1.600 1.624
TX5 I.602 1.578 1.593 1.566
1.606 1.595 1.564 1.613 1.613 1.651 1.603 1.578
Tizi 1.573 1.599 1.590 1 s95 1.133 1.258 1211 1.324
-- 1.514 1.480 1.483 1.366 1.528 1.547 1.519 1.446 I.426 1.492
1.659 1.014 1.085 1.169
.I.218 1.163 1.157 1.133 1.219
Tz? 1.389 t 040 0.63X 0.996( 0.606;
2.019 1005
la.20 0.916e 1000 0476C I a62 5.192 0 799
LOAl
-
3807 2.076 2.366(41 2.366141
w
2.317
2.231 2.205 2.170 2.148 2.146
2109 2.183 2.137 2.150 2.161 2.193 2.099 2.088
2.191 2.138 2.oa9 2.164 2.179 1.763 1.843 1.811 1.839
-
2.443 2.237 2.24lf 2.23a 2.296 2.241f43 2.262 2.124 2.171
-
: :::5- 1.721 1.741 1.696 1.708 1.724 1.732
2.rSd 2.340
- -
2.o806l 1.3!59(36
469X30 - L - - -
4 191 - -
CLOSI’ 0.0126 0.0978 0.1541 0.2015 O.lsao
0.252* 02286 0.1967
zsii 0.2704 0.2741 02333 0.2475
0.3494 0.3x3 0.3239 0.3107 02876 0.3o31 02631 0.2509
0481 0.3564 0.3o41 0.4452 a.49@ 0.1945 0.2308 0.2038 0.2364
0.0869 0.1443 0.1949 0.2033 0.2126 0.2026 0.2334 0.2s40 0.1971 0.1567
0.r893 0.2095 0.2633 0.3031 0.3113 0.3257 0.3214 0.1997 0.3260
0.5608 0.6608 On442 0.2667 0.0920 0.2546
0.2976 -
0/19w .-I.0200 0.0372 0.0737 0.3434
00.1232
300.1' 356.6' 506.7' 583.1' 562.1'
629.9 623.3 595.6'
662.7 656.6 667.7 652.8 665.1
686.9 681.7 690.4 701.5 676.9 676.0 696.3 693.3
705.6 696.6 694.9 720.6 732.8 749.1 752.3 782.0 772.6
0.998 I 0.9915 0.9810 0.9m1 0.9665
i 374 i442.1' 231.3 272.3
% 2 206.8 204.6 195.5'
182.1 180.5 183.5 179.4 182.6
0.084 04” 0.00684h 0.099ah 0.103 t4
0.110 3
0.7862 0.5362 o.afxa 0.4068
..2 ;: 13 2
14 n 1s 2
i
16 3 I? 3 18 2 19 2 20 3 2\ -f
0.9421 0.908t 0.9538 0.9107
iillS 0.120sh
0.3277 0.3277
0.131 8 0.129 4
0.2360 0.236o 0236o 0.2360 0.2360 0.2m 02360 02360
0.1456 0.146B 0.144 9 0.1426 0.147 a 0.148 0 0.143 7 0.144 3
0.8521 162.4 161.1 163,2 165.8
;Ei:: 164.6 163.9
lrg.3 144.4 144.1 133.0 122.0 2s2.9 211.7 220.0 186.3 -
293.6' 253.4' 264.9 257.1' 253.1' 217.7 207.2 274.2 238.1 -
2676 223.7 194.0 196.9 193.4 192.7 206.7 170.4
xi77 406.2
- - - 1
1,. 18
:P 2
5 23 2' 2 2 2
20, 3
5
3:
i'
i
3- 4
i 42 43 4 4 4 47' 40 a’ 5 5
-
0.161 6 0.163 7 0.164 1 0.177 7 0.1939 009349 0.111 7 0.107 5 0.126 9
39439 3.9439 39439 -.- -_ 4.4282 4.9125
0.783t
- - -
0.949t - -
I
I
. ,
s
0.9938 o.&a2g 0.5619 0.4214 0.4214 0.4214 0.4214 0.3371 0.4371 0.4371 0.3471
h
::Ei 53 0.08947" 0.0919P 0.09300h 0.108 6 p3&3$
3.099 30
521.5' 6ocl.j 626.d 608.9' 599.4"
3 626:y 684.9 -
883.1 870.5 070.5 883.1 067.2 864.2 909.5 aw.9
19r1.9 790.4
0.9844 0.9703 0.9660 0.9661 0.9608 0.9ar
IO.9591 IO.9651 0.949t
.--.- 19372 19372 19372
::2: 18676 2.3519
o.esso 2.6989 3.1812 3.6655 3.6655 3.6655 3.66% 359% 4.14%
56 I 57 1 58 k 59 ( 60 r 61 ( 62 i 63 ) 64 b
0.9061 0.3027
0.9925 0.92+ 0.903'
-
o.c33 34
0.10" 7 0.121 9 0.120 i
0.122 3 0.122 7 0.114 4 0.139 0
-
0.7379 05122 0.64~ I 0.5373 0.6939 0.3691
1.388 0.8163 1.73 0.7389 OE441 0.3335 1.312 5907 0.645 v-w-
- -
09995 0.9943 0.99o3 0.9aott
1.1063
:*9z I:5195 1.1765 22117
0.5880 1 .ooaJ O.oa% 1.1008 O.%R 2.4481 0.6220 0.1362 I2566
020.0" 787.24 395.
616.6"
441.6A E-57.5& 5lS.Y
0.9899(301 0.99% l.WO6
a574 - - -
0.0339" 0.028 39" 0.02a o4m 0.034 wm 0.049 76 0.01803 0.03202- 0.042 74
- - 0.9993(391
0.9997 :0.9875)'06! 423.5
998.0 -
6519
075.0 1311.
- 553.2
1 .wo 5l-m -

I I
TEP/DF/EXP/SUR
PROCESS ENGINEERING DESIGN MANUAL
I
Revision : 0 Page No :
DATA SECTION Date : 2/85 I5 - 13 PHYSICAL CONSTANTS OF HYDROCARBONS(27)
509.86 489.36 425.73 38526 366.40
'35722 34220 315.30
:2z 1.3A5
137746 137417 1.379 18 1.37157 1337759
316.33
%S 308.9A 291.03 294.41 295.87 288.90
30126 1.39981 285.69 1.39r06 271.04 1.39392 288.82 l.AO773 276X)6 1.414 11 38920 1.40927 345.51 1.41240 35595 1.42892 317.03 1.425 66
4a2.77 43x68 390.60 016.10 40556 394.18 35925
M-49.6) (418.7) 1385.21
- -
- 1.374 61 ,-
-
1.42s 36
.uernanc f mane prooane tt-ab.nt
33.936 60.395 66.456
112.384 112.031
18 ow 25394' 287lV 27621'
9.5a t6.70 2386 31.02 31.02
38.18
?I t
3 ; 5.3 2.9 2.1 l.E IS
137.A6S lA8.739 1 48.427
1.4 1 .A 1.6
I U.402 164.075 164.188 163.683 16A.025
n-+hXHJnC 2-Mccnvrhex4ne 3-Merhvlherrne 3.Echvlantme 22.bne?hvlmnIane 2 A.Dtmecnvtpenranc 3.3-~l~IhvlOWtWe
130.398 190.099 190.243 190.327 189.6M 189.803 189.885 169.690
nOzIanc o~lsoeuIvl ISOOCIJfW n-Nonane n-Deane CvcloDencrm Mecnvlcyc*orxnrane Cvclohexrne MelhvltyclohexAne
216.374 215.797 215.732 242.398 268.36 131.114 156.757 156.03A 181.567
Emene (Erwkne) ProoenelProovlenel l-htene IButylme~ 02.24utene rrwlr-2&cem IsoouIcne
-Pcotcne * .2.BuIaelcn 1.3-Bu1~01ene
55.942 81.482
lsOOrme
107.455 107.191 106.957 106.755 133.465 104.118 101.917 127.330
u.098 13A.055 ls9.53n 185.S55 185.092 185.020 1850s 180.290 211.328
28.M)1 56.062 11.959
2Y.912
205.431 48.10o 205132 aos1 205.276 A8.082 205.359 08.101 20A.662 47960 204.836 ag.wo 204918 08.019 200.722 A7982
233286 47.919 232.709 47.832 232.6AA 47.843 261.109 47.703 289.066 47.670 1~0.so9 46955 168.032 46.025 167.308 46.606 194.720 46.525
59.700 - 07.119 -
114.991 a.081 114.707 47.927 114.473 47.843 116271 47.769 142.860 47.788 109.755 47.5w 107.555 46.608 134846 46.406
3Q709
Eisj I
3203r 31 749
r:E 321s7
uo95 32809 33249 33 796
gg: 33488 33319
u 33372 33299 3448S 34985
%ffZ 36A97 35997
38.18 39.18
rg.ja 453 45.34 45.34 45.3
52.50 52.50
~~~ 52150 52.50
~Z
59.65
E:E 66.81 7397 '35.79 42.95 42.95
1 .o 11.01 t1.01 (1.01 (1.01 (1.01 Il.01 (1.01,
096 IO981
G7J 0.W
(1.4) (121
I.3 12
-.05 97 I 89.V 976
ifs7 90.3 80.2
26.0 73.5 'Ia. 93.A 90.3
0.0 46.4 55.6 69.3 95.6 638 86.6 4.d
-;- 5s ; = -
s ; 2 2 CC - + I .p.: . I .w.'
::. Yd.
61.)' 92.3 05.5
24.8 73A 74 5 91.6 9.3f
0.0 42.4 52.0 65.0 92.6 83.1 80.8 l 1B
2.9. 2.6
-
8.35 7.8
-
- -
26916, 30055 29lW
boil' 312104 29242' 31836
3=r 10.0 9.3
-
26.25 26.25 33.41
Fz 35.79 4295 50.11 50.11 50.11 50.11 al.72 57.27
2.7 2.0 1.6
(1.6) (1.61 (1.61
1.4
'E r1b
- - 0.7
(12.1 11.5
55.7 00. - -
84s'
E;o 71 .l
15.6
'3 83.5 -. - 77.1
+0.d 91 3 83.0 74.0
7 l 0.0
9:: 7
100.
81.0
90.9 - -
99 1
~~~vleoc Benzene To~ucne EInvleanzcm 0.XVlCl-W m.Xv1et-e o.xvlcne
Stvrene
- 36998 37 ow 37470 3793s 37 24s 37 122 38439 37591
2.5 1.Y 1.F
FY 1.1‘ 1.1' 1.1 0.08'
80. 7.9’ 7.11 6.?'
I ,"a8 6.6' 6.1 6.5'
- I l 5.a 9.8’ l A d
l 3. f *3. 4
l 2 1'
6.?2(51 3.26tSI
12.50~sI
- 83.32 1.50032 l 2.d 360.14 1.49973 +0.3/ 33498 1.498 56 97.9 346.80 1.5079s loo. 32.47 1.099 80 *2.6' 333.92 1.090 39 -1.2'
(35123) 1.54969 -0.2' Isooroovlbenzene 31225 1.494 00 99'3
Metnvl .lEOrlOl 16057 iO7597 1.330 20 1.16 36.50 Elnvl JICOhOf 23513 BUO.SU 1.363AS 14.32 16.95 Groan mono.aae 215.70 Loo0 36 2.39 74.20 Gmon OIOXIO~ 573.27" 1.00049 +araren SUI~I~C SA8.01 1.00061 7.16 4.300(51 AS.% -
““( 387.74 1.0CC162 -
-- nmmmoJ 17 301 - 1366. l.aKl36 3.58 15.MlSl 27w A,, - 214. - - -
10.230 12.091 - - 4504 l.ooo13 2.39 4 OOIS) 7420 - - 213. l.a302? - - - -m - - - -
60 N*rropcn - 2oa l.MX)28 - - - -m - - - 61 Ch~orme
0- -z79 - 288.0
0 2257 ,m,er - - - - -
62 Wafer 0 1.33347 - - - - - 63 +twm -- - - - l.oooO3 - - - - - 64 HvarCgen cn~or~~~ - A31.5 l.oooA2 - - - -- - - -
- - - - -
-I-
a2 A3 j ,
I a a
Q .’ A? rg A’

TOTAL TEP/DP/EXP/SUR
PROCESS E’NGINEEA,ING OESIGN MANUAL Revision : 0 Page No :
DATA SECTION Date : 2/85 IS -14
i351
ml
cm
Hwt. J. C.. Scr-wt. R 0. ‘+llwnwdyn.mu Row* V.1u.q for G.J.w. .nd Lsqwd C.rbon Mono.:de from 70 w ja, K -,,h Rnwm (0 300 A~maghertc- .Vac. Bw:Stmd. U.S. Tech. a%tr No 202 Yorwnbtr 30. 1% hm;. 5.; Anmcmne. 8.: dc fbuck. K M.. Ed.. “Cubon Dm.,d.. In~rrn~oon~l Thtrmodrnmmtc T3bl.a of ch. fled SU,r3’. Ptrc.mon Rn.: O.ford. 19%. ‘Thhr ,M.,hwn Un.bndr.d C.. Dqu Brisk’: .U.ch..on 6. Rducu: Nc- York. 1974. Dean. J. W. ‘A T.bul.uon of rhr Thcrmcdrn.mic Roprur of .Normd Hydrown fpm Ia- Trmpn.,um LO 300 K qnd from I 10 100 Atmo.vn.rn . Sat. Rur. Stand. US. 1-h. NOW 30. 120. N~.tmlmr 1951
133 .UcC.ny. R D.: We&r. L A. 7bmrmophy.ic~ Row.. of OxyKm front th. Frcr.,n6 Lnc to bQc*R for Re..um u) .WOV P.I.“. N.r. 8~. Stand. US. Tech .%rr No. 364. July 1971.
139) WM. L A. Nat. Bur. Stand. U.S. Rrm No. S710. I%& I401 lhdnbtrr. N. v.. PO
.nd Thtrmo /WY V. N., Siorotow~.N~A. T?wrmodyn.m‘c
hy.aa F’wmtn~t. of H~lwn : Atoma.ac Moue-. I%* I.r.4
~
‘mama for sclcnok lhnd.1lon. 1971. (411 Toulouk:.o. Y. S.. .Sldt~U. T. ‘~ermophr.w.1 Row’U~ of
S4.tt.r. Vol. 6. SvtctBc Hrac. ?lon.mrtcrll~ bus& .nd G...s-: lFl/PI*nurn: ?I*- York. 19io.
c42l Schbnrrr. W G.: 5.~. 8. H. lad. EM. Chrn. IS5L 44. 24% 1431 Todd. 5. S.: Olircr. C. 0.: Huffm.n. P. M. d. Am. Chum. Ser. IS47.
63. ISIS. NOTES
. AM .m~r.ud liowd. b Abwluu rJw. from -ewhu an “.cuY~. c llw .vv.rw“ rduw (mm weash, ‘n .I, .n .horn 61 uun’ con.
vcrwncc .nd comphanrr -ah ASTXIP Petmlman Mcvurcmml Tabln. In ,h. Un,,rd S,.,.. .nd Cm, Bn,.m. .II comm.rn.l -etsh,. .r. reqwred by I.- u, b. -aqhu an .,I. All olher m.” d.u .r. on .n l bwluw m... I-&h& ,n ..cuum# b..,..
d AI ..‘“,.“a” vr”.ur, Imvl, vmnt,. t Subhmwon p.an~ f
c h S.‘ur.uon vr”.un .nd IS-C.
Avv.ttnl vduc .I WC.

,
PROCESS ENGINEERING DSS~GN MANUAL Revision : 0
TEP/CP/EXP/SUR DATA SECTION Date : z/es
I
Page No :
15 - 15
COlcllPRESSIBILITY FACTORS
FOR NATURAL GAS
k-Y. 3-r :1.. :. _ :. : :-I..
. . -_~ .-.. -y -.... .--. 1..-. .-:... \ I-::.- . . . . . . . . . . . . . . . ._ . ,, .:.
E
. , i i:
__ .: :_ : i..!.. 1 . : .
-1 :. .: . . . . . . , . ..:::: .:.:;:;.1.:“““‘
.1.-;-.-..--~.--i--:. : l./+.’ :
e1 --“. A . . . . . . . . ..I.........~... : : ! :
I .,:, i., ;i, _. . . . . _. .: . ..-............... . . . . . . . . . . . . . . . . . . . . . ..-... . . . . . ..--.._.__._......... .i i: i.... i
. . :- . _,. . . -_,. ..fiI:fii^iii~~~i~~:~*~:=~ ’ . . . . . . . . . . :: . I:::‘::: .; . . ! . . . . . . : . . . . . . . ..-.m__......_..... . .. . . . . . . . . . . . . . . . _......... .:.:. ~ . . . . ..- A.:- ,“‘..“” :: : 1 .::;;:..;x:-; .x’
~~~~~~~~~~~~::.“.F. ‘I :,iy- .--. g-.*;
. . I. II

PROCESS ENGINEERING DESIGN MANUAL Revision : 0 Page No :
TEP/DP/EXP/SUR I
DATA SECTION I Date : 2/85 is - 16 I
SJOO
J500
mul
uxa
3500
loo0
2x0
10 10 JO 40 so- 60 70 80 90 loo
*blrcJa-
TEPID

1 -
1 I --
PROCESS ENGINEERING DESIGN MANUAL Revision : 0 Page NO :
-rEP/D?/EXP/SLJR DATA SECTION Dare : 2/85 I5 - I7
~ . : :, . . . . . . . . . . . . . . . . y..; . !. I ! :;.;-I : :i ; i i .-Ii.../ i.. ! i. !:::.;.. i . .._ ,:.. :..:..
& *reraae 6.P -iloesr ALL- :: .:... , ‘::.. ! :... . “, ,,.::... L; j i !, i : ; : I o.wJ ‘0.850 1
1 J.1 1. .,....: .’ I : .‘rYfY .,. .--- . . . . . . . . :::’ .:. ! i’,‘if’: .i- I.:.,; .“j i _f i ;J$7zy 0.8~~
280
260
240
i 220
: .:.:y:,:: i:::: ,.:.:i. , :’ 1’: 1 ‘.:i. .:l:.::L:::. ::i .I --m-a : :-:i.-;;: 1 :: .I:-:.. .I :: :. .:::.
:::,.::: 1 ::::: ::.i:::::.:+::i . . . . . .
,:: . . _.: ~.,I::iii:t!il.:.~i::1:1 :::i : 1 6oo ___: ,.... ,...:; . . ..I. :..:.. .:.:. :
580
300 400 500
Norm01 boiling p&m. ‘C
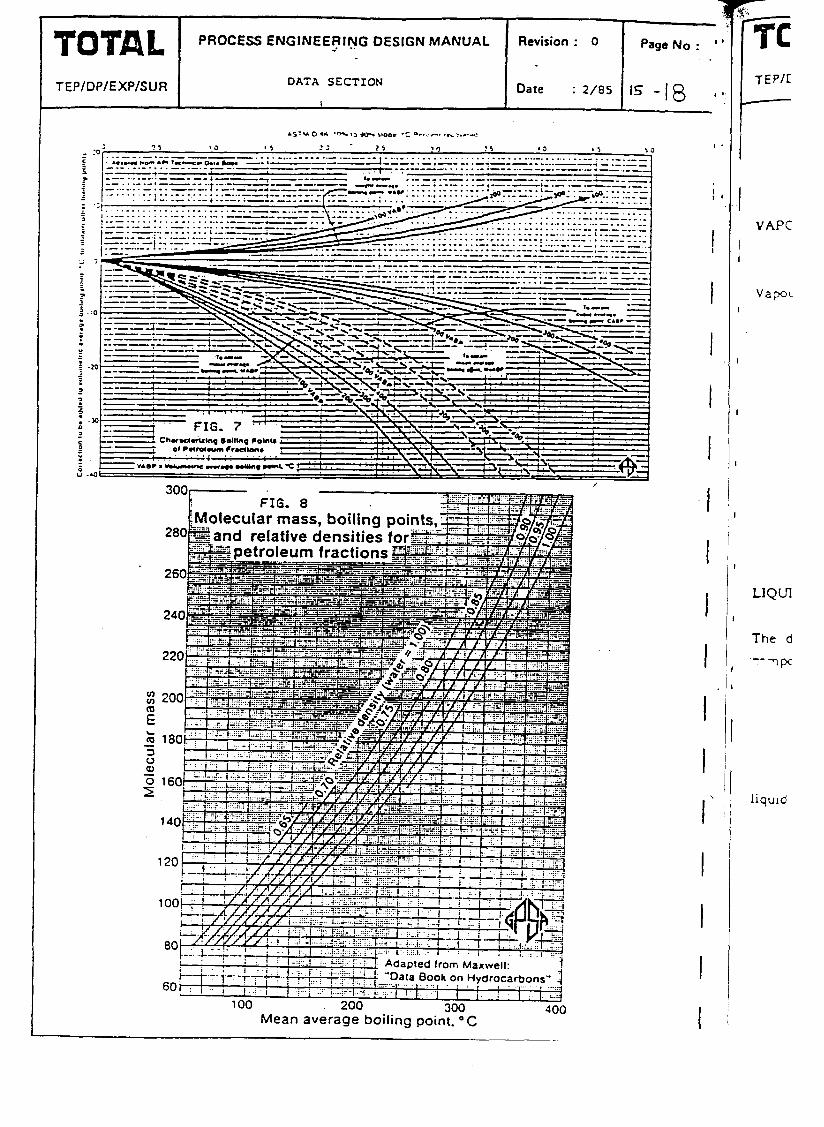
PROCESS ENGINEE~IhjG DESIGN MANUAL Revision : 0 Page No : ’ .
TEP/DP/EXP/SUR DATA SECTION
1 Date : 2/85 IS -18 1
ecular mass, boiling p nd relative densities fo
)ata 6OOkon Hvdrocarbons" -- - ~ .._‘~ ,_ ~ .._::
( ,.. . . . . . . )-..: I.....,:, , , ’ , , ’ , i a..::
100 200 %-In llnn -.-- Mean average boiling point. o C
-vv
I
VAPC
I t
Vapor I
I
I
I
I
’
LlQUl
I
The d
I
liquid

I
I
I
I
I
I
I
I
I
I
I
I
I -
-‘. “- PROCESS ENGINEERING DESIGN MANUAL Revision : 0 Page No :
TEP/DP/EXP/SUR DhTk S&C-X ON Date : 2785 ‘5-19
-
1
DENSITY
.
P
VAPOUR DENSITY
Vapour densities or molar volumes can be calculated from the equation:
v _ ZRT -- P
I P - MW.P ZRT
Specific pravity of a gas =MWF: MWa.ir
I p I psia I bara
T I OR I ‘K
I?. I 10.73 1 0.08314
I Ibs/ft3 I Kg/m3 L
MWair = 28.967
LIQUID DENSITY -
The density of a multi component mixture can be calculated using the summation of the
--mponkt densities :
Wi = mass component
pi = density component
liquid densities for hydrocarbon mixtures can be estimated using. Figures 10, 11 in this section.

TO’tBL-, PROCESS Et .IINEERING DESIGN MANUAL Revision : 0 Page No :
TEP/DP/EXP/SUR DA-PA SECTION Date : 2/85 15 - 20 *’
1
Approximate relative density of petroleum fractions FIG. 18
.’
!
0.3 0
~~lllli!lY~ 20 40 $0
TO TEP/D;

TEP/D;/EXP/SUR
Page No :
IS-21
PROCESS ENGINEERING DESIGN MANUAL Revision : 0
DATA SECTION Date : 2/85
No :
Relative density of petroleum fractions
Example:
At 300°C 0;
an oil with rel. den. at IS’C and 101.325 kPa(absj of O.S6. and Kw 11.00;
has a rei. den. of 0.636 at 7500 kPa(abs@).
[(Mean avg. B.P.. ‘C - 273.15) X 1.31”’
= F&l. den. at 15°C and 101.325 kPa(abs) KW
0.85
\ \
\ 0.80
0.75
0.70
0.65
0.60
0.55
0.50 0 A5
50
1 Oj
Adopwd 10 $1 by GP’SA from Ptner. L.no,r. and kh-•pps. P.woleum Rsl~ner, I958
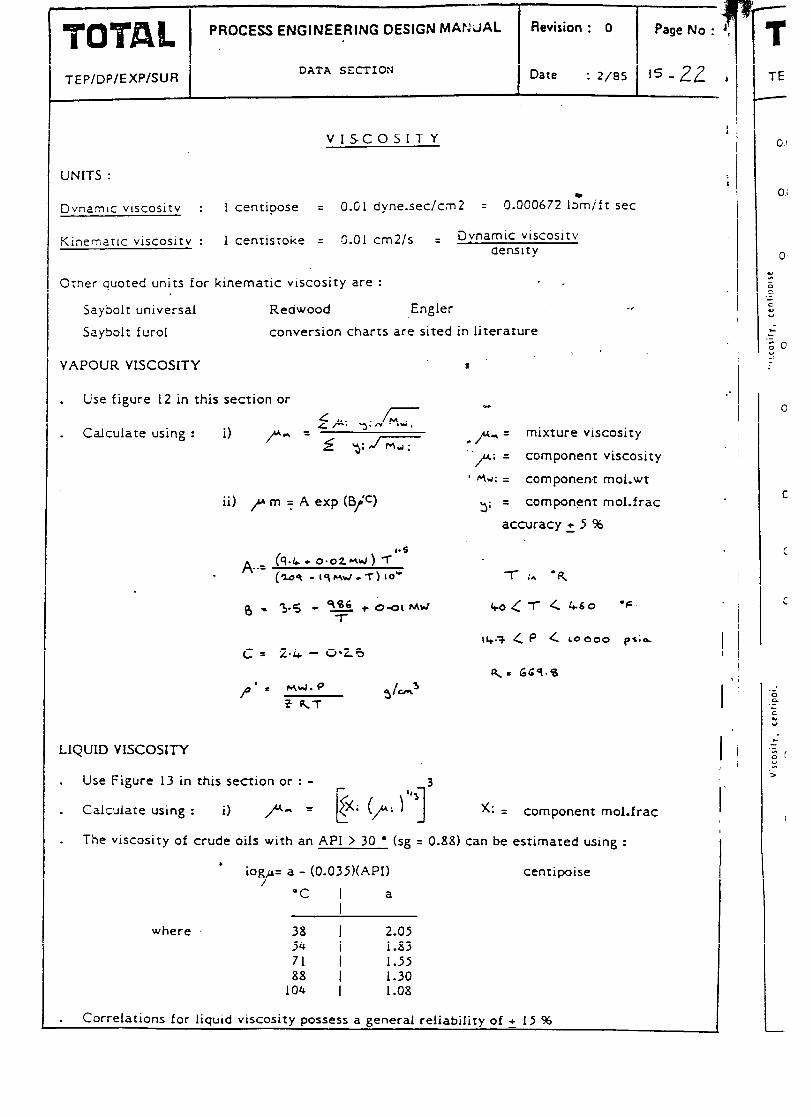
_~-~ TUTAL PROCESS ENGINEERING DESIGN MAr:;iAL
TEP/DP/EXP/SUR DATA SECTION Date : 2/85 ‘Lz2 1
VISCOSITY
UNITS :
Dvnanlc vlscositv : 1 centipose = 0.01 dyne.sec/c.m2 = 0.000672 IbPmift set
Kinematic viscositv : I centistoke = C-01 cm2/s = D?na~~~s;~;cositv
Orner quoted units for kinematic viscosity are : ’ _
Saybolt universal Redwood Engler
Saybolt furol conversion charts are sited in literature
VAPOUR VISCOSITY
. Use figure 12 in this section or - &Iu: y: P/ W-J; . Calculate using : i) pn = f y;J-c-
LIQUID VISCOSiTY
ii) p m y A exp (B/‘cl
C = 2.4 - O-29
. Use Figure 13 in this section or : -
. Calculate using : i)
I
.P= mixture viscosity
“p; = component viscosity
’ rr\bl: = component mol.wt
3; = component mol.frac
accuracy 2 5 %
7-h l q
x; = component mol.frac
. The viscosity of crude oils with an API > 30 o (sg = 0.88) can be estimated using :
. iOg = a -
r (O.O35)(API) centipoise
“C I a
where 38 I 2.05 54 I 1.83 71 I 1.55 88 1.30
104 1.08
. Correlations for liquid viscosity possess a general reliability of 2 I5 %

No: ’
- I I I 7
POTAh TEP/D?/EXP/SUR
PROCESS ENGINEERING DESIGN MANUAL Revision : 0 Page NO :
DATA SECTION Date : 2/85 l5 -23 +
Tempemture. dq F (b)
VlSCOSITY OF NATURAL GASES
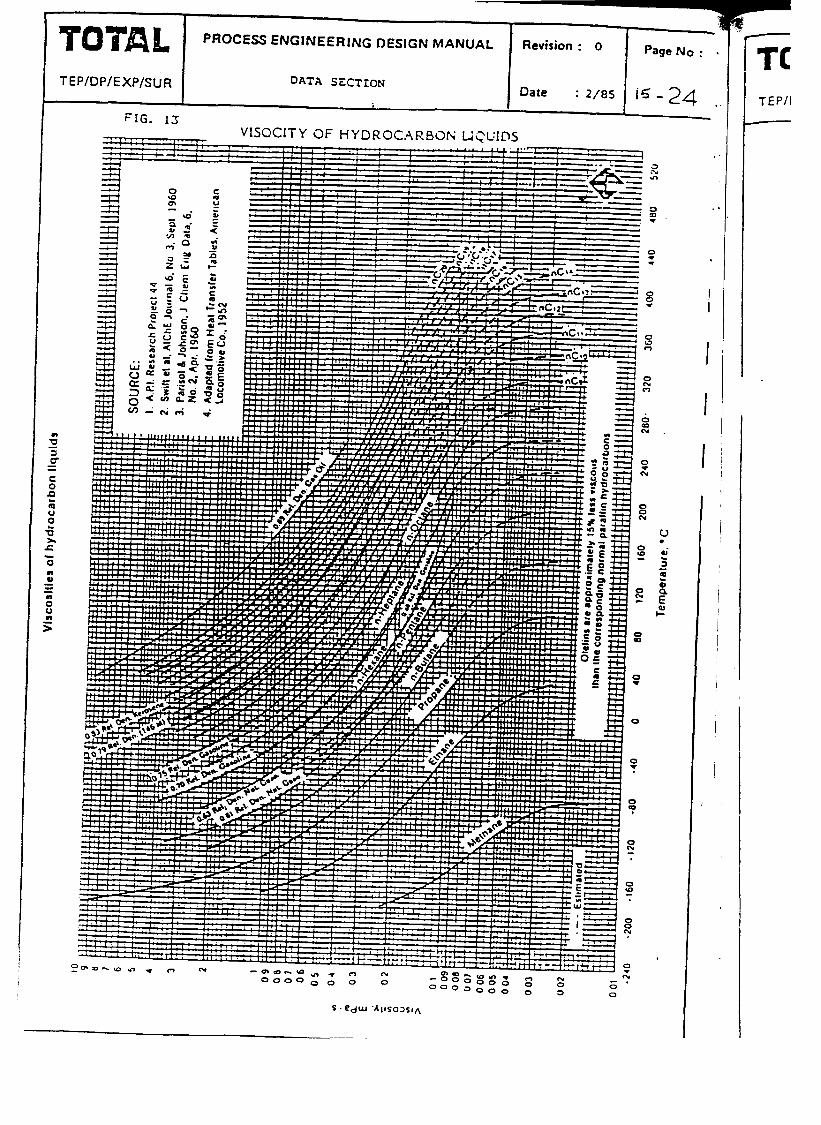
PROCESS ENGINEERING DESIGN MANUAL Revision : 0
TEP/DP/EXP/SUR DATA SECTION Date : ~/ES
TEP/I

TEP/DP/EXP/SUR
PROCESS ENGINE~,j?l~G DESIGN MANUAL Revision : 0
DATA SZCTION
!SOe)
sqe) edy ‘CJJnsSaJd lode/\

. .
TEP/C?/EXP/SUR
PROCESS ENGINEERING tlJESlGN MANUAL . Revision : 0 Page No :
DATA SECTIOt-’ Date : Z/85 ‘5-25
1
0.9
0.8
I.. . . , :.. ,,(_aI* ;;;,s,,Ttx ..I,
o.sL’.,‘..:;;; I* I..’ ,/ iI, ,., !,I, ; J-1 . . ..l .
0 100 200 300 40 SW 600 700 t3cF
temperature OF

C
TOTIlL PROCESS ENGINEERING DESIGN MANUAL
TEP/DT’/EXP/SUR DATA SECTION
Revision : 0 PageNo :
Date : 2/85 ‘5-27

PROCESS ENGINEERIKG DESIGN MANUAL
I
Revision : 0
TEP/DP/EXP/SUR I
DATA SECTION I Date : Z/ES
-
Page NO
IS -2E
FIG. 16 TRUE VAPOUR PRESSl‘?ES OF PETROLEUM PRODUCTS AND CRUDE OIL
3

I I
PROCESS ENGINEERING DES!GN MANUAL
DATA SECTION
Revision : 0 Page No :
Date : 2/85 ‘5 -29 TEP/lY/EXP/SUR
Permissible expansion of a 0.6 relallve density .
Final presqurc kPa tabs)
Permissible expansion of a 0.7 relalive density natural gas wlthout hydrate formation
7oco3 - 6OooO.”
;!I loo01 ’
;
1000 2ooa 3ooo so00 1OOW 2oooo 30( Final pressure. kPa (abs)
Permitrlble expansion of a 0.6 relatlvc density natural gas without hydrate formation
7ocm,
lor pr.dMlng hydde tomutlon
.---- 6oooo
50000
4OOW
3oooo
2sooo
20000
: . ..l..:.j:;::1::::;:iiif:~iii:I:::i 4 . *. _. . .._ . . . . . , ..,....,....I.. .Y...
!Ocrm :... !._..I.. .,../r
woo Urn
-u J
:Jm
2
. .-j:: .- : .-.. . -. . - I ; -
,- ---’ Es00
//I/i : : : ; .!..:;,:.!j.:
! : I .! t !:...i .;:.i
/ # Jcm*
: i / I i I’.IaI !
! i j : ; i i. : : : i.. i :
j:-:i::j ; .I .
1 /
. loal/ loo0 2Mx) 3ooo‘oal 6ooo 10000 20000
Fmal pressure. kPa laos)
FIG. 17 HYDRATE FORMATION

TEP/DP/EXP/SUR
PROCESS ENGINEER!NG OESICN MANUAL Revision : 0 ’ : Page NO :
DATA SECTION Date : 2/85 J5 - 30 i
UNITS: BTU/LB “F ,I BTU/lb “F = 4.19 KJ/Kg ‘C
KJ/KC “C I BTU/lb “F = 1 Cal/g “C
SPECIFIC HEATS
(HEAT CAPACITY) e-
VAPOUR MIXTURES
. Use figs 18, 19 in this iecfion w
, Cp” is a fuction of temperature and can be calculated using’: .
Cp” = A + BT + CT2
where A, 8, C are constants dependant on system composition
and T is in “R (K)
Values of A, 8, C are cited in Kern, or Perry.
Cp’ can be corrected for pressure if Pr and Tr are known using Figure
. K = ratio of specific heats 9 this should also be corrected for pressure if required. cv -_
LIQUID MIXTURES
. Use Figure 21 in this section or :
I Calculate using
CPl = 2.96 - 1.34 C + T (0.00620 - 0.002349) KJ/KC “C (T in ‘Cl
CPl = 0.68 - 0.31 C + T (0.00082 - 0.000319) BTU/LB “F (T in “F)
c = liquid specific gravity
(accuracy 2 5 %J)
CAMPBELL
I :
I’ ,

i
TOTAL TEP/DP/EXP/SUR
PROCESS ENGINEERING DESIGN MANUAL _a . . .
Revision : 0 Page NO :
DATA SECTION Date : 2/8S 15 -31 I I
FIG. 19 SPECIFlC HEAT OF HYDROCARBON VAPOURS AT I ATM (NOTE UNITS ARE
BTU/LB/OF)
I

TEP/DP/EXP/SUF?
Page No : I’
l-r 15 -32 l’
PROCESS ENGINEERIF!G DESIGN MANUAL Revision : 0
DATA SECTION Date : 2/85
; .;I 022 oc3 534 zc6 2,: 32 c.3 0.4 cs 0-e :o 2 :t j 3 ‘0 :CC I’.. I i : : ; !: ! ! iIl;ln 1 : ; ., : a t ,:cc
I ! I.4.i j i I I: I 60
.” . . . , . , -,,, .A I 1 I![ ] ( ] I;
; 6.0. I I II;: Illill
,o I illll I II” . 5 00. ” ! 10 I
g 2.0/r-- tXiii! ’ ’ 2.g ’ id 2.0
1.01 08
0.6
I /l/I IAll I, I Illi] 1,111 ,,.,oO.l 0.00
ace
0.04
Lea ~reshre. 3 = f c
FIG. 19 HEAT CAPACITY CC .,TION FACTORS (NOTE UNITS ARE BTU/LB
MOLE/“F) (at armosphc -ssure) . --

-fEPIDP.‘EXP/SUR
PROCESS ENGINEERING DESiGN MANUAL
DATA SZCTION
I -- --
i Revision : 0
Date : 2/85
Page No :
15 -33
.
FIG. 20
Approxlmat* rp.clllcg.ol copoclty rotloa of hydrocarbon gas..

TOTAL PROCESS ENGINEERING DESIGN MANUAL Revision : 0 Page NO :
TEP/DP/EXP/SUR DATA SECTION Dare : 2/85 I5 -34
THERMAL CONDUCTIVITY
UNITS : BTU/LB “F
k
VAPOUR MIXTURE.5
. Use figs 22, 23 in this section
t-
1 STU/lb “F = 1.1;SS Kcal/m.h.“C
t
. Low pressure thermal conductivities of pure gases and vapours can be estimated
using : *
k= /” (Cf + y) d
accuracy 2 8 5% k - BTU/hr.ft”F ’ ,
P - lb/hr.ft
CP- BTU/lb ‘F
LIQUIDS
. Use fig 24 in this section or :
. Liquid hydrocarbon mixtures can be estimated using :
k = - 0.0677 - 0.0003 (T - 32) sg
SOLIDS
accuracy 2 12 96 k - BTU/hr.f t’F
% - specific gravity .78 < > .95
T - ‘F 32 < > 392 .
See Perry of Kern for details of metals, earths and building materials.
I i Therm
1 I-
I t
; r
r 3 060 L g 0.058
I t : 0055r
T 0 054 f- s 0052c
I-

I ,I
’ I
’ I
I
TEP/DP.‘EXP/SUR
PROCESS ENGINEERING DESIGN MANUAL
Thermal Conductivity of Noturol Gores at 101.3250 kPo lobs)
1 ; i : 1 0 i i 1 ; ; _ I
: -- I
-<---y--.-L-- c--“-L--- ----y w -..c-~,~~ -. - I
Z ,---- -.” .-;
; 3060L..- -L-- --- I b.‘--‘--..V .-..-
2- .I-r-ir*.L-.-r.. -
,$ 0 078
-2 5
0.026
p 0074
$ 0021
5 OO?O E ; 0.018
f 0.014
0010. 0 10 10 30 ro 50 60 70 80 90 100
Molecular Molt
Date : 2/8S r5 -35
FIG. 22 ,
Thermal conducti%ty ratio for goscs
FIG. 23
THERMAL CONDUCTlVlTlES OF HYDRO-
CARBON LIQUIDS FIG. 24

PROCESS ENGINEERIf’!G DESIGN MANUAL .
TEP/OP/EXP/SUR I DATA SXTION TEPI
. i i
1802 1730 1600 1500
13oc
11oc
100:
9oc
BOC
70c
,OC
5oc
a01
30(
'31
18[
161
12(
1oc
9:
8(
7!
6;
LATENT HEAT OF VAPOURISATION
1 BTU/lb = 0.5556 K&/Kg UNITS BTU/LB
Kcal/Kg
Use figures : 25, 26
Estimate using Troutons rule : a
accuracy + 20 96 -
44 = 2l.Tb cal/gmole *
c
Tb = boiling point “K
I
I
I
I
I
I
I‘
I
I
I
I
For relief valve calculations use 50 BTU/lb if actual Lt.ht is not known.
Detailed estimation methods in Perry : pp 238

I.
I
I
I
I.
I I
I 1 I
I I
I (
I‘
I
I
I
I -
TEP/DP/EXP/SUR
*F l C
1000
3--
500
900
800 -2 400
60
S
40
0
30 F -S
20
18 3
PROCESS ENGINEERING DESIGN MANUAL : Revision : 0
Date : 2/85
LIOUID I RANGE
‘C lc-I l c x Y
,CIfIC .CIO 111 105-200 5.6 11.9 .ceto* 23s 140.240 7.0 10.2
,-0+3,. 133 ac-200 1.2 3.1 '",I Jlconol (I801 307 2ooJCO 6.0 1.4 Ien.?*"* 263 10300 1-c 12.s lutaoe (4) 152 40- 70 2.6 11.6 ,"lM. 70-200 2.6 11.7 lutanc (430) 124 IS175 a.4 121 3”l~l l ICMOI (-I) 267 17Odoo to 9.8 IUl~l alcohol (-180) 265 150400 1.7 6.7 IUl~l l lcmol 2OOd70 5.8 7.7 lutyl alcmol (.s*c) 265 170-270 6.6 t-1 btyl l lcmol (.lOlT) 23s 1-00 2.6 6-S :arooll dlollde lb100 a.1 11.1 :mbon dlsulrtdo 2;: 140-273 LS lJ.7 :Jrom ktr*Chlwl~ 26a 1oaoo 1-c 17.1 :hlWlM 143 la&200 1-s 14.S :nlorotam nr 176466 2.7 lL7 >Ichlorwm~lmr (4-l 242 2oQjoo '1.4 11.2 >lrnIh~l amIn 168 125-200 4.3 6.6 3lP~fVI 521 lo-a2 22 16.2 >kln*nvt 22-160 3.1 16.2 )Iph*nyl lso400 0.1 12.1 NgtwlyI orId* Sll 50440 a.1 1S.S N$rmnyl OXIda Jr0400 6.2 14.5 IlfWW 460 IO-1JO 4.0 ¶.6 itnyi l ICohOl 241 lb140 a1 7.0 Ethyl l ICWW 140.2S0 4.7 6.1 EthTl muIn* 183 00-230 3-s s.0 Ernyl cnlorlbe 166 150-110 Cl 122 Ethylon* 10 lb so 1.0 s.3 Ethyl-a lb-125 4.0 O-6 Emyl.ww 164 15-110 2.1 rt7 Etnyl .mr 110-240 1.6 1t7 Fwon 11 (Ccl-F) 1SI 70-250 3.6 17.2 From 12(CCI-F) 111 60-lS0 J.¶ 17.2 From 21 (CHCI-F) 163 2O-220 a3 15.4 Feeon 22 (CMCI) 96 SO960 4.0 lL.1 Fwm 113 (CCI-FCCIF) 214 4oGfSJ as 11.7 Freon 114 (CCMCCIF) 14s 4k2O0 a.5 12.7 n.pt.nm (-n) 267 lO&!70 a.4 13.5
n*m*nd (-3) 2¶c SW40 a4 11.1 urtnano 47 10. SO 1.2 6.1 Ycwv”l l IConOl 240 IO-140 33 1.1 nlnrl l COhol 94ti40 1.6 4.7 *ethyl amlm 157 100.200 4.1 6-S delhyt thlorld* 14) lC.110 2.6 11.1
hlh,l CtllQlb llbl20 s.2 11.2 4*wl,l IormolO 214 lsa-Isa 1.9 11-J Y,h,kno cnlatd. 216 so-260 1.0 13.7 MlOmJ. omIti % c- 25 1.2 6.2
MlW~~ O‘IO. 25-12s LA 12.3 Dc1m* (-3) n6 1650a 1.0 11.6 PwI1anc ,-j 187 (s-210 3-J 12.: Ponunc (dull 181 (WOO a.2 12.7 PIOOMU Y 16-262 ca 11.0 Proo,l alcohol (-ml 264 l-70 21 a.I
PlOpll l IcPnrl p-1 2% ls-2s a 32 Cl P,*IdlfU 344 2304so 7-3 12.5 su,tu dlorlaa lS8 looGo 20 123 TSIWW 121 lw-lW IS 11.1 Trlchlororth~)rrr 271 1804OS 6.0 11-t “al” 176 lo-JSS a0 1.:
Exemplc : Pour I’oau A 100-C 1, - t = 27S” .
-~4i20 538 k-l/kg
.
0
20
19 18
ri
16
1s
14
Y " 10
9
8
7
6
S
a
3
2.1 11 I I I-
1'llII
0 "iiI
I I
I I I 0 1 2 3 4 S 6 7 8 9 10
X
LATENT HEATS OF VAPORIZATION OF VARIOUS LIOUIDS FIG. 25
- 10
- 1s
- 20
- 30
- PO
- so
- 60
- 70
- 80
- 90
-100
-150
200
250
300
3so
400
aso
SW
550
600
700

PROCESS ENGINEERING DESIGN MANUAL Revision : 0
TEP/DP/EXP/SUR DATA SECTION Date : 2/13s
‘3 Y .
2 u Y
i= a
IL 0 I- O
-LLl
Page No : 1’ I
15 -38 I’ _(
i ’ :;I I Illli ill! i!Ilii
; PRESSURE - ATM
LATENT HEAT OF VAPOURISATION OF * HYDROCARBONS FIG. 26
--
Ii I
TEP

PROCESS ENGINEERING DES!GN MANUAL
DATA SECTION
60/600,: I.10 .U
,TA l7,ooO UJ. INC. 20
30 1 z --. 16.903 ApI 40
GRAVITY 50 60 70

TEP/DP/EXP/SUR DATA SECTION
SURFACE TENSIONS P
UNITS : Dynes/cm 1 dyne/cm = IO-3 N/m
N/m
3
. For surface tensions of paraffins use fig. 28 w
. To estimate surface tensions for hydrocarbon liquids/gas ,use
* [5 l ~Gq~“,,.;,,,; *.
pccuracy : 2 10 %
P = Parachor = 18.07 + 2.946 MW for paraffins with MW < 100
= 278 + 2.35 (MW - 100) for paraffins with MW > 100
,ol = liquid density Ib/ft3
P’ = vapour density Ib/ft3
For oil-gas mixtkes can also use
T = temperature in “F source: Beggs + Brill
P = pressure in psia
-

.) :
3 I, -
I.
I -1
I.
I
TEP/D;‘/EXP/SUR
I
I , 1 ~ 1
Surfore tension of paraffin hydrocorbonr FIG- 28
JO
23
20
IJ
IO
J
0
PROCESS ENGINEERING DESIGN-MANUAL Revision : 0 *,I . . .
DATA SECTION Date : 2/85
Page No :
L ‘5-41

Tajyyyg - PROCESS ENGINEERING DESIGN MANUAL Revision : 0
l * .
TEP/DP/EXP/SUR DATA SECTION Date : 2/bS
JO .cl 20
-
60000
40000
-a” -ro -30 -20 -IO 0 20 dJ 60 80 100 1210 Ia3
r*mpcrolu*r. ‘C
I I
I.

I
I
I .
PROCESS ENGINEERING DESIGN MANUAL .- ̂ ’ I
Revision : 0 Page NO :
DATA SZCTION
I Date : 2/8S ‘5-43 -rEP/DP/EXP/SUR I
203 so0 m :oGo zooo ecloo 6om :o.ooo ?ressurr. 3sio
&hbil;fy of noturoi gores in rottr ond brine. FIG. 38 Sdubility of methone in wotcr. FIG. 31
SOLUBILITY OF NATURAL GAS IN WATER

PROCESS ENGINEERING DESIGN MANUAL _ . T
‘I EF
DATA SZCTI@fJ TEP/DP/EXP/SUR Date, : 2/85 EL44
I Z
FIG, 33
SolubWty of wafer In hydrocarbons
0.09 0.06
0.07
0.06
0.05
0.04
0.03
0.02
0.01
0007
0006
3 005
OOW
I .!..,..I~. St t!y WS!! ’ ‘fib Or!glnaI from Or. John J. McKctta
Unkcrrltv ot Texas I
35 40 45 so 5s 60 65 70 75 80
Temperature. ‘C I

: ,i
1 -t a’ 1
PROCESS ENGINEERING DESIGN MANUAL
I
Revision : 0
I
Page No :
I TEP/D?/EXP/SUR
DATA SE’?TION Date : z/es /ZLQ 1 I -
-70
-40
-32
-20
- 10
0
. 10
TEMPERATURE DROPS FOR EXPANDING C;AS

. - _-. -.__ ._
cIll,co,
107 09
742
49 2
61 oe
170.5
10.5
105.14
lb9 18
14a.19
160 (Dccompolcr)
12.4
I05 I4
311
-12.5
133.19
249
42
180
‘110
-78 v
-.. __-
103 I @ YJ5.C
-.
2 052 v 5-c
0 I90 e l5.C
Moletutor mot). . . . . . . ~. . . , . . . ,
Boding poinl @ 101 3 LPo (obt). ‘C.. . . . . . . , .
fter8mf.J point. l c . . . , . . . . .
CllllCOl contlonll Prrllurr. kP0 (Obl). . . . ~. . . . . . . . . . . . . . , I~mp*rolw*. ‘C.. . , . . . . . . . . . . . . . . . . . . .
O.nllly @ 2O’C. LO/“’ I.. . . . . . . . . . . . . , . . . .
Relof~~c drnbily. ?O’C/?O’C; , . . . . . , . . . .
Specil~c haol topowy. LJ/(LQ**C) @ 15.6.C . . . , .
Ihcrmol conducli*ily. J/(~*tn~.*C/rn) 0 ?O*C . . . . ,
lolard hrot 01 rcporirolmn. rJ/ru 01 LPo (obt). , ,
5985 350
1018
I .01?9
1.546 @ 1O’C
0.156
826 @ 101 .I LPO
tin01 ol I~OCIIO~. LJ/~Q ol ocld go, H75 .................................. co2 ...............................
Viacody. rnP0.c ............................. 24
3173 1440
441 514
1095 ll24
I.0919 (30/10*C) I.1258
9.511 1.931 0.210 -
6700973LPo 535e 101.3hP0
3771 403
1058 @ 15.6.C
I.0572
1.391
0.109
510 e 101.3 LPO
3770 109
999 @ 30.C
0 9av e 4512o.C
1.889 0 3O’C
430 0 I?) LPO
-. --
I705 7
I.101
1.403
0 ?OB I!! (‘)‘C
4114 P IO1 3 LPO
-u
-930 -t568 -1465 -1977
I @ 20-c 150 0 20.C 1013 e 10v 40 d l5.6.C I90 mrrr x WJlulwl) I95 *us, n rolutlorl)
m
,.442 P 35 l C -372 @ 75*c
5 II I? 25-c 198 0 45*c 06 0 54’C
Rolsoctire indea. t4J. 1O'C . . . . . . . , . . . . . . I.4539 1‘.,776 1.4851 I.4598 I 4541@ 45’C
lOlIP 7!l*c 45c ll*c 75@ 25-c
ou7iy IOO~C
I 4209
I I?
-.. 93 I38 I85 127 I24 151
flh+n* Cl+ Oi~lh+ne Clycol Irirfhylrnr Gly~el -I_----.- _ .____.___ ,._
Iewwhyl.ne CIy~ol --_. . __.
SUllOlW,.* M*llwwl -.--m---s _-._. _ _ . . _. ._.
folmvlo . . . . . . . . . . . . . . . . . . . . . . . . . . . . . . . . . . . . . . . . . . . . MOC7H4Ot1 HqC?H40)7tf
106.11
245
-0
tlO(C7H4O)lH
150.17
207
-7.2 ,
tlo(C7Hto),l1
I94 32
317
-6.2 *
t 1594
474
1146
I.148
1.177
floth poml. COC. l C . . , . . . . . . . . . . . . . . .
C4lCBS0, 110.17
785
2?.6
SW0 545
I163 I 2bB
I 50? f?J IO’C
OlPlf+37fJ*C
575 CJ 1fJo*c
IO 3 v IO’C 6l@ 5O.C 7 5 Q 100°C I 4 e I5O.C
0 97 f? 3OO’C
I 481 * IO’C
I??
CtllOlf
32 04
64 5
VI I
IV54 240
700
0 IV!?
2 410 15’. IO’C]
091s
1103 I? 101 3 &PO
04QxJ’C
Molrcvlor moi1 . ~ I ~. , . . . . . I.. . . . . . , . . . . . . . . . * . , . . . . 61.01
Boiling poinl @ 101.3 hl’o (obl). l C . . . . , . . , . . . , . . , . , . . , 197
f1.*ring polnl. ‘C.. . . . . . . . . . . . *. . . . . . . . *. . . . . . . . . -13
Cfilicol tomlonl~ P~a,ru~r. LPo (obl) . . . . . . . . . . . . . . . . . . . 1696 l.mprroiu~c. ‘C . . . . . . . *. . . . . . . . . . . . . . 372
Damity @ 2O’C. hg/m7 . . ..*.......*.... .*..,, I I I3
R&lirr denrity. ?O'C/2O'C . . . . . . . . . . , . . . . . . . . . . I.1155
S~~IIG 18eot capacity, LJ/(kg.‘C) @ I5 6-C , .,.... 1.311
Ihwmol conduclirltr. J/(t.m7**C/m) 8 1O'C . ..*.. . 0.207 @ I5 6’C
lotrot hrol ol ropotitotion. bJ/Lg 01 LPo (obt) . . . . . . . . . . . BOO 0 101.3 LPo
V~ctolily, mP0.t . . . . . . . . . . * . , . . . . . . , . . . . . . . . . . , * . . . . 20.9 ‘3 2O’C
466 I 3304 408 441
I II6 1123
l.llB4 1.1254
1 140 1.060
0.249 @ I5.6.C 0.141 @ lS.b*C
540 e IO1 3 LPO 416 e 101.3 LPO
35.7 0 ?O’C 47 9 e 1o*c
374 0 101 3 APO
60 0 0 1O’C
R*(rocci*r lndrfi. Nd, 2O’C.. . , . . . . . . . . ..,.........,.. 1.4316 I 44?2 I 455v
floth point. COC. ‘C
I 4595
. . . . . . . . . . . . ..I.................. I16 t43 166 17’
NOIf: I rnPo.8 = I trdpoi,a
- -
I I?86
I4
- -
- -

Revision : 0
Date : 2/8S
page No
i
:
‘5-47 TEP/DP/EXP/SUR
LP
VISCOSITY OF STEAM AH0
HIGH TEMPERATURE WATER
.-- -----. -- _- _._--_ - _--_ -.-
0 IOU Loowoyx) WC l o low Ix)0 ‘sx Loo0 zsol
PHYSICAL PROPERTIES OF WATER

/ TmllB PROCESS ENGINEERING DESiGN MANUAL Revision : 0
i :
1 TEP/OP/EXP/SUR DATA SECTION ! I Oate : 2/8S
15 -48 ! I .I i
Prcuurr. -
Viuosity l f Air* vlscmn lb ICC: P3w.: x lo-: - -
R-. : Temp.. ‘F
lb/q ua 4& -100. -so! 0 : so ;loo’Isolaxr~?5o
iii , xx 3.64 ! 395 JJY 406
Eon s t 33:
3% 3.83 4.14 900 3.3 3.95 42:
1.aJo f 3.90 ; 4.0; 4 31
llm 4M 420 4 42 I.4m 43. 43.5 4s4 l.mn 44: 4.15
4.-o : 4.6b
1.&x 4 75 4.8j 2.m : 5;o 4.95 4.9:
: , 2500 605 3.32. 336 -
426 4s; 45: : 4.56 . 5.12 3.43 463 : 4.6s : 5.19. 531
443; 4.e9:494:szs 53 4lO! 4~6,3.OZ.S31:S61 4.55 , 4644:5.1o:sJe SST
’ 466 47 4.67 5.m 3.10
: 4.92 3.16 i s.44 ST2 . 5.00 S24 S.50 3 ;: 3n6 311’3s Sk 5 IS 3JY S.&l SW 31; s4; ; 3.70 x97
5J.4 Ill : S6R ’ 5.E SO?
.XUJ 4 6.06 662 6 I4 5.;; 5 i0 S.iS . S 91 6 I9
3500 * i6Z 6.76 63 6.05 ’ 6.06 6.12 62.5 su
4.m sJ5 IY 66s 6.42 6.3S.642: 643’661 45oo 910 r.0 I T-09 STb 6.66 6.69 6.i1 662 : .
s.aw 9 M 6.49 7.33 i f.16 6.99 6.99 ’ 6.95 7.02 6.000 : 11.X. 966 b.39 5.90 ‘bb: 732 3.alo 12.62 10% 9.17 ’ S61 626 6.03
;;A& ;z’
8.ow 1456’11.94 10.16 942: 5.89 5.36 532 IO.11 i
639, 9.m 16.09 12.W Ii.05 9.46. 0.Oi 6.63 5.90
10ooo 17x1 1403 1x5 In.79 1010 063 9.X 91:
‘Cornpled bv P E L,lrr For ,ahk III 51 un#u bon w)’ 10 l301’K.. 1 (0 IUOD bra. it Vauerm~n ka;rrawcL&,. l nd Rahmowch. -Ccm- phrlacal Proprnlo of .\w and \sr Componcnu.” Uouor- 1%. aad
.<
PHYSICAL PROPERTIES OF AIR
COK?OlfTION OF THE ATMOS?RLII
l-be waqxdioa of dry air is -kably wasunt atI over the globe and through- our the a&x uopxpbuc The proportions by ~olwne of tie vanou5 compooeno UC gkn b&w (after h F. Fkne’~. 1939. 1952).
21)X ICP
1 XIP
5 xl@
5 XIU-
9 x10-e 6 xWLe
i i i ; : j j , 1 1 / ’
1 / : ’ I4
-.
I i .
I
I
Related Documents