Final TMDL for Fecal Coliform Bacteria: Dry Creek January 2003 TOTAL MAXIMUM DAILY LOAD (TMDL) DEVELOPMENT For FECAL COLIFORM in the DRY CREEK WATERSHED (HUC 03150202) Perry and Dallas Counties, Alabama

Welcome message from author
This document is posted to help you gain knowledge. Please leave a comment to let me know what you think about it! Share it to your friends and learn new things together.
Transcript
Final TMDL for Fecal Coliform Bacteria: Dry Creek January 2003
TOTAL MAXIMUM DAILY LOAD (TMDL) DEVELOPMENT
For FECAL COLIFORM in the
DRY CREEK WATERSHED
(HUC 03150202)
Perry and Dallas Counties, Alabama
Final TMDL for Fecal Coliform Bacteria: Dry Creek January 2003
ii
In compliance with the provisions of the Federal Clean Water Act, 33 U.S.C §1251 et.seq., as amended by the Water Quality Act of 1987, P.L. 400-4, the U.S Environmental Protection Agency is hereby establishing a Total Maximum Daily Load (TMDL) for fecal coliform bacteria in Dry Creek. Subsequent actions must be consistent with this TMDL. __________________________________ ____________ James D. Giattina, Director Date Water Management Division
Final TMDL for Fecal Coliform Bacteria: Dry Creek January 2003
iii
Table of Contents
1.0 EXECUTIVE SUMMARY: DRY CREEK..........................................................................................................v
2.0 TMDL: DRY CREEK .............................................................................................................................................. 1
2.1 INTRODUCTION ..................................................................................................................................................... 1 2.1.1 The TMDL Process ..................................................................................................................................... 1 2.1.2 Watershed Description............................................................................................................................... 1 2.1.3 Designated Use of the 303(d) Stream...................................................................................................... 3
2.2 TMDL INDICATORS AND NUMERIC TARGETS................................................................................................. 3 2.3 WATER QUALITY ASSESSMENT.......................................................................................................................... 4 2.4 SOURCE ASSESSMENT .......................................................................................................................................... 4
2.4.1 Point Source Assessment............................................................................................................................ 5 2.4.2 Nonpoint Source Assessment..................................................................................................................... 5 Septic Systems and Urban Runoff ...................................................................................................................... 5 Land Application of Animal Manure................................................................................................................. 6 Livestock in Streams and Unknown Sources.................................................................................................... 7 Wildlife and Background Load........................................................................................................................... 7
2.5 LINKING THE SOURCES TO THE INDICATORS AND TARGETS.......................................................................... 8 2.5.1 Model Selection ........................................................................................................................................... 8 2.5.2 Model Setup.................................................................................................................................................. 8 2.5.3 Hydrologic Calibration.............................................................................................................................. 9 2.5.4 Water Quality Calibration......................................................................................................................... 9 2.5.4 Results from Water Quality Modeling................................................................................................... 10
2.6 ALLOCATION....................................................................................................................................................... 11 2.6.1 Total Maximum Daily Load (TMDL)..................................................................................................... 11 2.6.2 Seasonal Variation.................................................................................................................................... 12 2.6.3 Margin of Safety........................................................................................................................................ 12 2.6.4 Critical Conditions.................................................................................................................................... 13
REFERENCES............................................................................................................................................................... 16
APPENDIX A ................................................................................................................................................................ 17
Final TMDL for Fecal Coliform Bacteria: Dry Creek January 2003
iv
List of Figures Figure 1. Dry Creek watershed location map. .................................................................... 2 Figure 2. Dry Creek land use distribution and statistics. .................................................... 2 Figure 3. Simulated and observed flows in Shades Creek (EPA, 2001)............................ 9 Figure 4. Simulated and Observed Fecal Coliform Concentrations in Dry Creek (1996).
................................................................................................................................... 10 Figure 5. Simulated Geometric Mean Concentration of Fecal Coliform in Dry Creek For
Existing and TMDL Conditions(1989-1998)............................................................ 14 Figure 6. Simulated Fecal Coliform Concentration and the Instantaneous Water Quality
Criteria (1996)........................................................................................................... 14 Figure 7. Simulated Geometric Mean Concentration of Fecal Coliform in Dry Creek
During Critical Period. .............................................................................................. 15
List of Tables Table 1. Dry Creek Watershed Land Use Distribution....................................................... 1 Table 2 . Water quality sampling data collected at DRY-1996 for Dry Creek................... 4 Table 3. Estimated Population on Septic Systems. ............................................................. 6 Table 4. Estimated agricultural animals in Perry County (USDA 1997). .......................... 6 Table 5. Estimated land application rates for confined animal manure in Dry Creek
(NRCS, 2000).............................................................................................................. 7 Table 6. Summary of existing conditions in the Dry Creek watershed. .......................... 11 Table 7. Allocation Scenario for TMDL conditions ........................................................ 12 Table 8. TMDL components for Dry Creek. ................................................................... 12
Final TMDL for Fecal Coliform Bacteria: Dry Creek January 2003
v
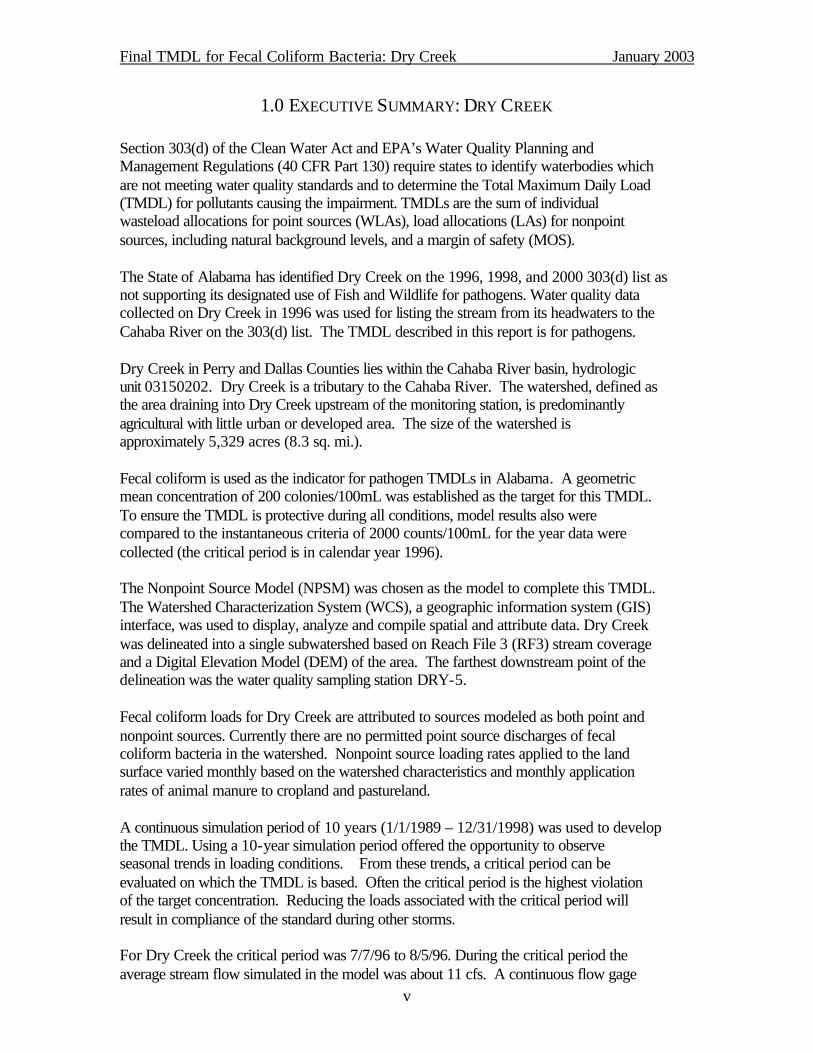
1.0 EXECUTIVE SUMMARY: DRY CREEK Section 303(d) of the Clean Water Act and EPA’s Water Quality Planning and Management Regulations (40 CFR Part 130) require states to identify waterbodies which are not meeting water quality standards and to determine the Total Maximum Daily Load (TMDL) for pollutants causing the impairment. TMDLs are the sum of individual wasteload allocations for point sources (WLAs), load allocations (LAs) for nonpoint sources, including natural background levels, and a margin of safety (MOS). The State of Alabama has identified Dry Creek on the 1996, 1998, and 2000 303(d) list as not supporting its designated use of Fish and Wildlife for pathogens. Water quality data collected on Dry Creek in 1996 was used for listing the stream from its headwaters to the Cahaba River on the 303(d) list. The TMDL described in this report is for pathogens. Dry Creek in Perry and Dallas Counties lies within the Cahaba River basin, hydrologic unit 03150202. Dry Creek is a tributary to the Cahaba River. The watershed, defined as the area draining into Dry Creek upstream of the monitoring station, is predominantly agricultural with little urban or developed area. The size of the watershed is approximately 5,329 acres (8.3 sq. mi.). Fecal coliform is used as the indicator for pathogen TMDLs in Alabama. A geometric mean concentration of 200 colonies/100mL was established as the target for this TMDL. To ensure the TMDL is protective during all conditions, model results also were compared to the instantaneous criteria of 2000 counts/100mL for the year data were collected (the critical period is in calendar year 1996). The Nonpoint Source Model (NPSM) was chosen as the model to complete this TMDL. The Watershed Characterization System (WCS), a geographic information system (GIS) interface, was used to display, analyze and compile spatial and attribute data. Dry Creek was delineated into a single subwatershed based on Reach File 3 (RF3) stream coverage and a Digital Elevation Model (DEM) of the area. The farthest downstream point of the delineation was the water quality sampling station DRY-5. Fecal coliform loads for Dry Creek are attributed to sources modeled as both point and nonpoint sources. Currently there are no permitted point source discharges of fecal coliform bacteria in the watershed. Nonpoint source loading rates applied to the land surface varied monthly based on the watershed characteristics and monthly application rates of animal manure to cropland and pastureland. A continuous simulation period of 10 years (1/1/1989 – 12/31/1998) was used to develop the TMDL. Using a 10-year simulation period offered the opportunity to observe seasonal trends in loading conditions. From these trends, a critical period can be evaluated on which the TMDL is based. Often the critical period is the highest violation of the target concentration. Reducing the loads associated with the critical period will result in compliance of the standard during other storms. For Dry Creek the critical period was 7/7/96 to 8/5/96. During the critical period the average stream flow simulated in the model was about 11 cfs. A continuous flow gage
Final TMDL for Fecal Coliform Bacteria: Dry Creek January 2003
vi
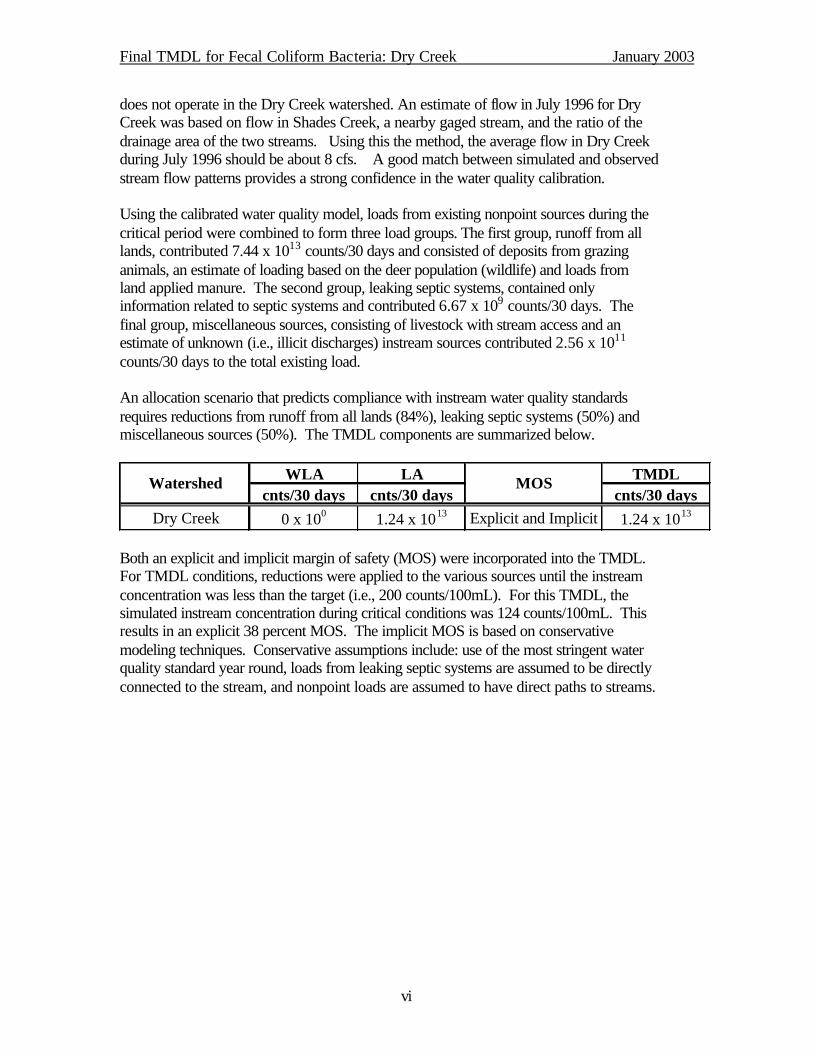
does not operate in the Dry Creek watershed. An estimate of flow in July 1996 for Dry Creek was based on flow in Shades Creek, a nearby gaged stream, and the ratio of the drainage area of the two streams. Using this the method, the average flow in Dry Creek during July 1996 should be about 8 cfs. A good match between simulated and observed stream flow patterns provides a strong confidence in the water quality calibration. Using the calibrated water quality model, loads from existing nonpoint sources during the critical period were combined to form three load groups. The first group, runoff from all lands, contributed 7.44 x 10¹³ counts/30 days and consisted of deposits from grazing animals, an estimate of loading based on the deer population (wildlife) and loads from land applied manure. The second group, leaking septic systems, contained only information related to septic systems and contributed 6.67 x 10⁹ counts/30 days. The final group, miscellaneous sources, consisting of livestock with stream access and an estimate of unknown (i.e., illicit discharges) instream sources contributed 2.56 x 10¹¹ counts/30 days to the total existing load. An allocation scenario that predicts compliance with instream water quality standards requires reductions from runoff from all lands (84%), leaking septic systems (50%) and miscellaneous sources (50%). The TMDL components are summarized below.
WLA LA TMDLcnts/30 days cnts/30 days cnts/30 days
Dry Creek 0 x 100 1.24 x 10¹³ Explicit and Implicit 1.24 x 10¹³
Watershed MOS
Both an explicit and implicit margin of safety (MOS) were incorporated into the TMDL. For TMDL conditions, reductions were applied to the various sources until the instream concentration was less than the target (i.e., 200 counts/100mL). For this TMDL, the simulated instream concentration during critical conditions was 124 counts/100mL. This results in an explicit 38 percent MOS. The implicit MOS is based on conservative modeling techniques. Conservative assumptions include: use of the most stringent water quality standard year round, loads from leaking septic systems are assumed to be directly connected to the stream, and nonpoint loads are assumed to have direct paths to streams.
Final TMDL for Fecal Coliform Bacteria: Dry Creek January 2003
1
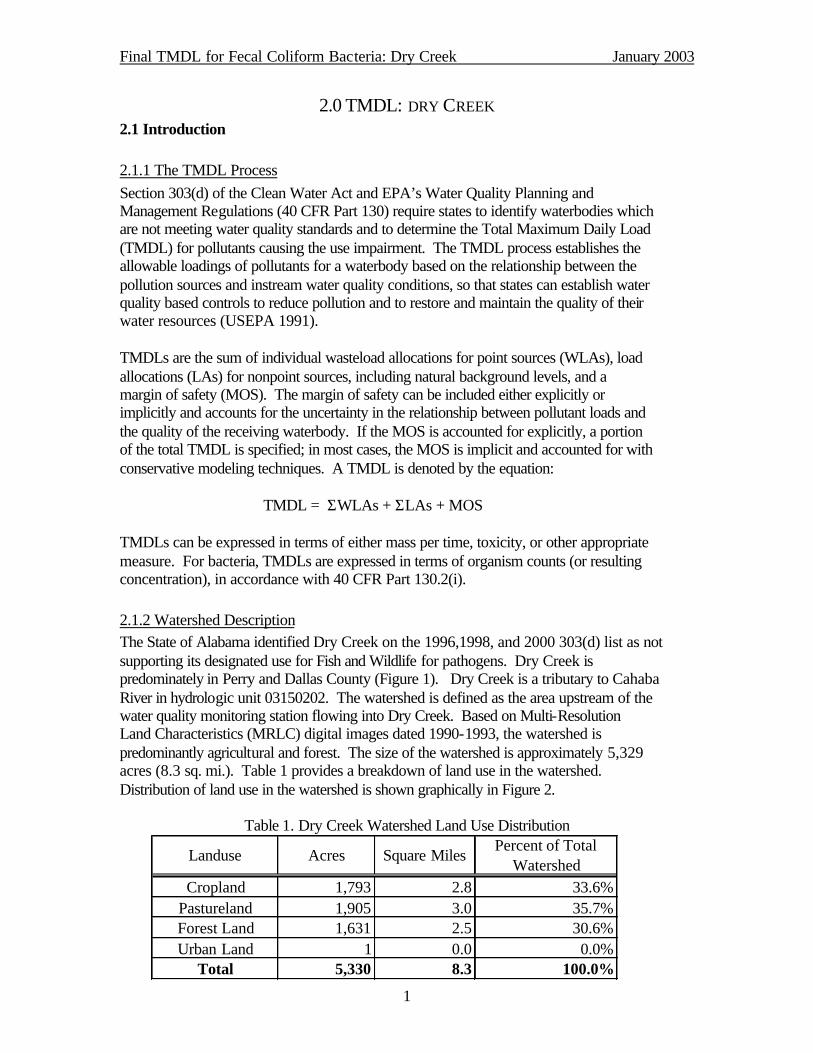
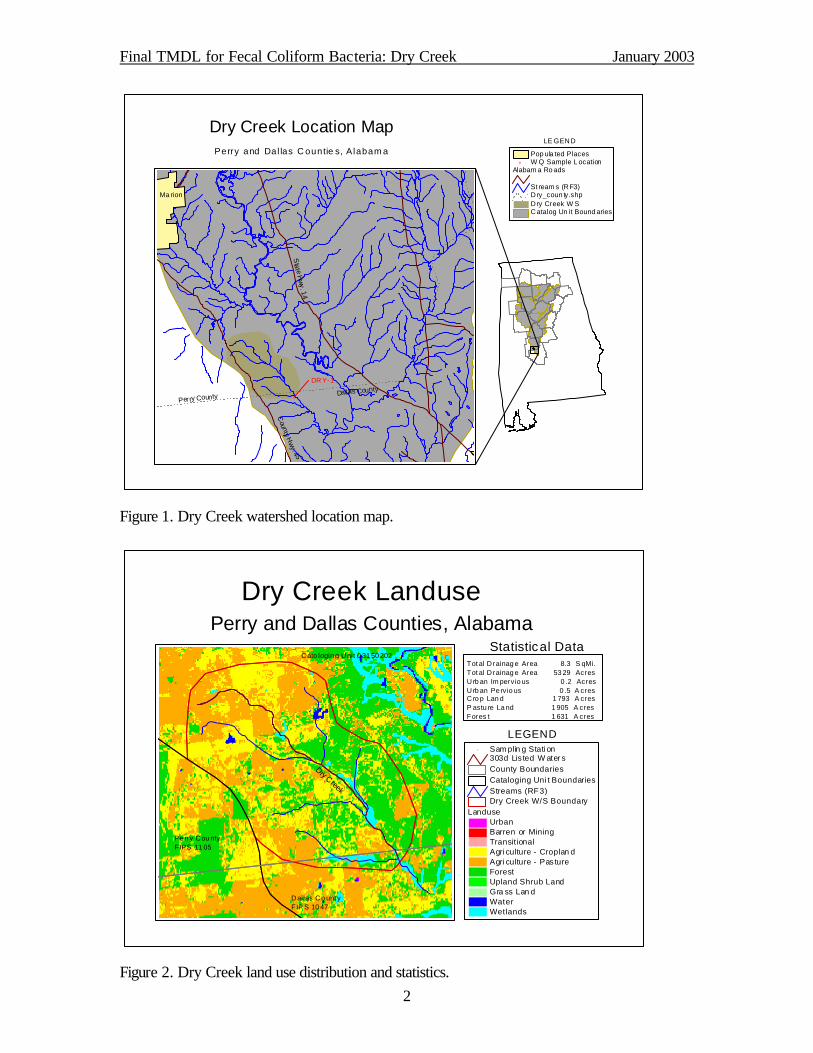
2.0 TMDL: DRY CREEK 2.1 Introduction 2.1.1 The TMDL Process Section 303(d) of the Clean Water Act and EPA’s Water Quality Planning and Management Regulations (40 CFR Part 130) require states to identify waterbodies which are not meeting water quality standards and to determine the Total Maximum Daily Load (TMDL) for pollutants causing the use impairment. The TMDL process establishes the allowable loadings of pollutants for a waterbody based on the relationship between the pollution sources and instream water quality conditions, so that states can establish water quality based controls to reduce pollution and to restore and maintain the quality of their water resources (USEPA 1991). TMDLs are the sum of individual wasteload allocations for point sources (WLAs), load allocations (LAs) for nonpoint sources, including natural background levels, and a margin of safety (MOS). The margin of safety can be included either explicitly or implicitly and accounts for the uncertainty in the relationship between pollutant loads and the quality of the receiving waterbody. If the MOS is accounted for explicitly, a portion of the total TMDL is specified; in most cases, the MOS is implicit and accounted for with conservative modeling techniques. A TMDL is denoted by the equation: TMDL = ΣWLAs + ΣLAs + MOS TMDLs can be expressed in terms of either mass per time, toxicity, or other appropriate measure. For bacteria, TMDLs are expressed in terms of organism counts (or resulting concentration), in accordance with 40 CFR Part 130.2(i). 2.1.2 Watershed Description The State of Alabama identified Dry Creek on the 1996,1998, and 2000 303(d) list as not supporting its designated use for Fish and Wildlife for pathogens. Dry Creek is predominately in Perry and Dallas County (Figure 1). Dry Creek is a tributary to Cahaba River in hydrologic unit 03150202. The watershed is defined as the area upstream of the water quality monitoring station flowing into Dry Creek. Based on Multi-Resolution Land Characteristics (MRLC) digital images dated 1990-1993, the watershed is predominantly agricultural and forest. The size of the watershed is approximately 5,329 acres (8.3 sq. mi.). Table 1 provides a breakdown of land use in the watershed. Distribution of land use in the watershed is shown graphically in Figure 2.
Table 1. Dry Creek Watershed Land Use Distribution
Cropland 1,793 2.8 33.6%Pastureland 1,905 3.0 35.7%Forest Land 1,631 2.5 30.6%Urban Land 1 0.0 0.0%
Total 5,330 8.3 100.0%
Percent of Total Watershed
Square MilesAcresLanduse
Final TMDL for Fecal Coliform Bacteria: Dry Creek January 2003
2
Figure 1. Dry Creek watershed location map.
Figure 2. Dry Creek land use distribution and statistics.
#
Dry Creek Location MapPerry and Dal las C ountie s, A labam a
Catalog Un it Bound ariesDry Creek W SDry_coun ty.shpSt ream s (RF3)
Alabam a Ro ads# W Q Sample L ocation
Pop ula ted Places
LE GEND
Perry County Dallas County
Ma rion
Sta
t e Hw
y. 1
4
Coun
ty Hw
y . 45
DRY-1
#
LanduseUrbanBarren or MiningTransit ionalAgri culture - Croplan dAgri culture - Pas tureForestUpland Shrub LandGra ss Lan dWaterWetlands
Dry Creek W/S BoundaryStreams (RF3)Cataloging Uni t BoundariesCounty Boundaries303d Lis ted W ater s
# Sam plin g Stati on
LEGEND
Statistical DataTot al D rainag e Area 8.3 S qMi.Tot al D rainag e Area 53 29 AcresUrb an Im pervio us 0 .2 AcresUrb an Pe rvio us 0 .5 A cresCro p Lan d 1 793 A cresP astu re La nd 1 905 A cresFores t 1 631 A cres
Dry Creek Landuse
Pe rry Cou ntyFIPS 11 05
Dallas Co unt yFIP S 10 47
Cato login g Unit 0 31 50 202
Perry and Dallas Counties, Alabama
Dry Creek
Final TMDL for Fecal Coliform Bacteria: Dry Creek January 2003
3
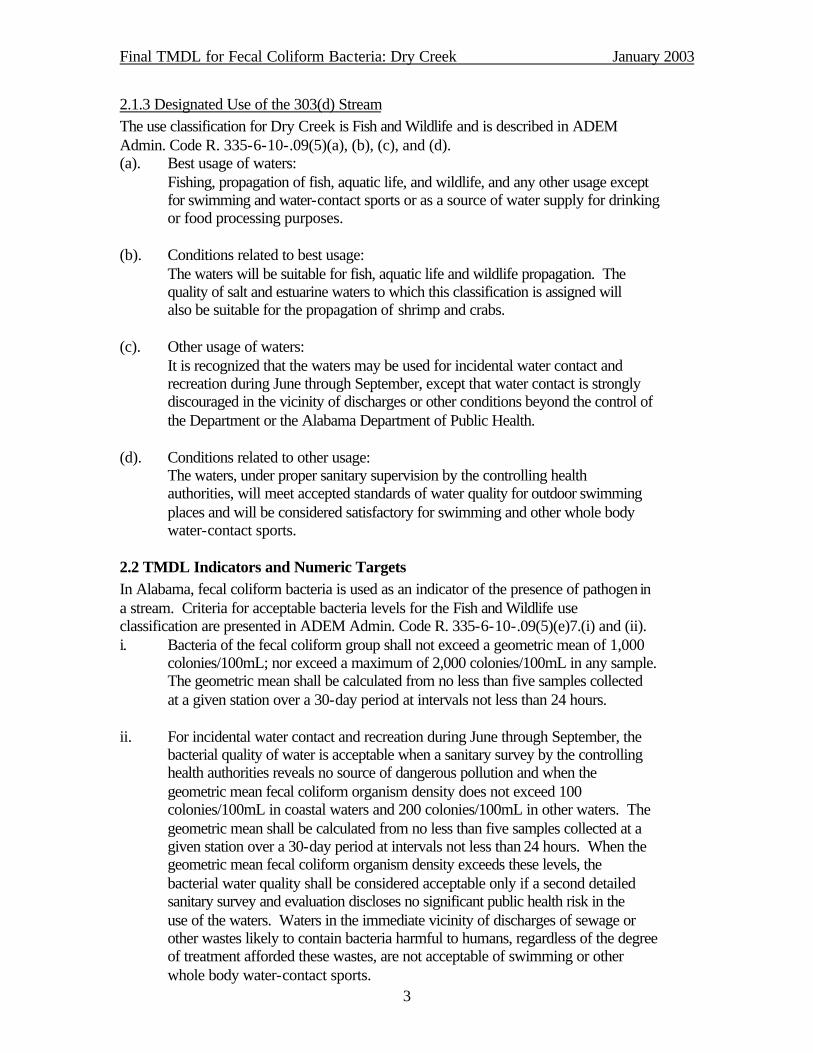
2.1.3 Designated Use of the 303(d) Stream The use classification for Dry Creek is Fish and Wildlife and is described in ADEM Admin. Code R. 335-6-10-.09(5)(a), (b), (c), and (d). (a). Best usage of waters:
Fishing, propagation of fish, aquatic life, and wildlife, and any other usage except for swimming and water-contact sports or as a source of water supply for drinking or food processing purposes.
(b). Conditions related to best usage: The waters will be suitable for fish, aquatic life and wildlife propagation. The quality of salt and estuarine waters to which this classification is assigned will also be suitable for the propagation of shrimp and crabs.
(c). Other usage of waters: It is recognized that the waters may be used for incidental water contact and recreation during June through September, except that water contact is strongly discouraged in the vicinity of discharges or other conditions beyond the control of the Department or the Alabama Department of Public Health.
(d). Conditions related to other usage: The waters, under proper sanitary supervision by the controlling health authorities, will meet accepted standards of water quality for outdoor swimming places and will be considered satisfactory for swimming and other whole body water-contact sports.
2.2 TMDL Indicators and Numeric Targets In Alabama, fecal coliform bacteria is used as an indicator of the presence of pathogen in a stream. Criteria for acceptable bacteria levels for the Fish and Wildlife use classification are presented in ADEM Admin. Code R. 335-6-10-.09(5)(e)7.(i) and (ii). i. Bacteria of the fecal coliform group shall not exceed a geometric mean of 1,000
colonies/100mL; nor exceed a maximum of 2,000 colonies/100mL in any sample. The geometric mean shall be calculated from no less than five samples collected at a given station over a 30-day period at intervals not less than 24 hours.
ii. For incidental water contact and recreation during June through September, the
bacterial quality of water is acceptable when a sanitary survey by the controlling health authorities reveals no source of dangerous pollution and when the geometric mean fecal coliform organism density does not exceed 100 colonies/100mL in coastal waters and 200 colonies/100mL in other waters. The geometric mean shall be calculated from no less than five samples collected at a given station over a 30-day period at intervals not less than 24 hours. When the geometric mean fecal coliform organism density exceeds these levels, the bacterial water quality shall be considered acceptable only if a second detailed sanitary survey and evaluation discloses no significant public health risk in the use of the waters. Waters in the immediate vicinity of discharges of sewage or other wastes likely to contain bacteria harmful to humans, regardless of the degree of treatment afforded these wastes, are not acceptable of swimming or other whole body water-contact sports.
Final TMDL for Fecal Coliform Bacteria: Dry Creek January 2003
4
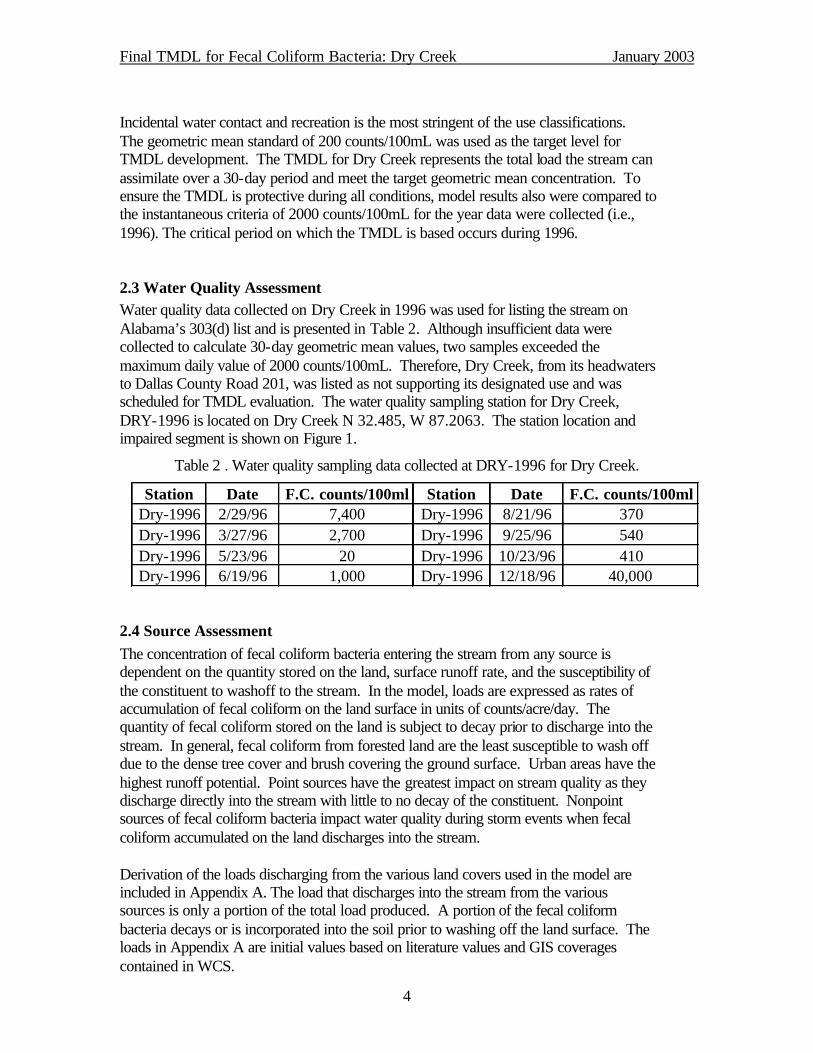
Incidental water contact and recreation is the most stringent of the use classifications. The geometric mean standard of 200 counts/100mL was used as the target level for TMDL development. The TMDL for Dry Creek represents the total load the stream can assimilate over a 30-day period and meet the target geometric mean concentration. To ensure the TMDL is protective during all conditions, model results also were compared to the instantaneous criteria of 2000 counts/100mL for the year data were collected (i.e., 1996). The critical period on which the TMDL is based occurs during 1996. 2.3 Water Quality Assessment Water quality data collected on Dry Creek in 1996 was used for listing the stream on Alabama’s 303(d) list and is presented in Table 2. Although insufficient data were collected to calculate 30-day geometric mean values, two samples exceeded the maximum daily value of 2000 counts/100mL. Therefore, Dry Creek, from its headwaters to Dallas County Road 201, was listed as not supporting its designated use and was scheduled for TMDL evaluation. The water quality sampling station for Dry Creek, DRY-1996 is located on Dry Creek N 32.485, W 87.2063. The station location and impaired segment is shown on Figure 1.
Table 2 . Water quality sampling data collected at DRY-1996 for Dry Creek.
Station Date F.C. counts/100ml Station Date F.C. counts/100mlDry-1996 2/29/96 7,400 Dry-1996 8/21/96 370Dry-1996 3/27/96 2,700 Dry-1996 9/25/96 540Dry-1996 5/23/96 20 Dry-1996 10/23/96 410Dry-1996 6/19/96 1,000 Dry-1996 12/18/96 40,000
2.4 Source Assessment The concentration of fecal coliform bacteria entering the stream from any source is dependent on the quantity stored on the land, surface runoff rate, and the susceptibility of the constituent to washoff to the stream. In the model, loads are expressed as rates of accumulation of fecal coliform on the land surface in units of counts/acre/day. The quantity of fecal coliform stored on the land is subject to decay prior to discharge into the stream. In general, fecal coliform from forested land are the least susceptible to wash off due to the dense tree cover and brush covering the ground surface. Urban areas have the highest runoff potential. Point sources have the greatest impact on stream quality as they discharge directly into the stream with little to no decay of the constituent. Nonpoint sources of fecal coliform bacteria impact water quality during storm events when fecal coliform accumulated on the land discharges into the stream. Derivation of the loads discharging from the various land covers used in the model are included in Appendix A. The load that discharges into the stream from the various sources is only a portion of the total load produced. A portion of the fecal coliform bacteria decays or is incorporated into the soil prior to washing off the land surface. The loads in Appendix A are initial values based on literature values and GIS coverages contained in WCS.
Final TMDL for Fecal Coliform Bacteria: Dry Creek January 2003
5
2.4.1 Point Source Assessment A point source is defined as any discernable, confined, and discrete conveyance from which pollutants are or may be discharged to surface waters. Point source discharges of industrial wastewater, treated sanitary wastewater, storm water associated with industrial activity, or storm water from municipal storm sewer systems that serve over 100,000 people must be authorized by National Pollutant Discharge Elimination System (NPDES) permits. ADEM requires a general NPDES permit for all concentrated animal feeding operations (CAFOs) in excess of 1000 animal units and for poultry operations in excess of 125,000 birds. The general NPDES permit for CAFOs is a ‘no discharge’ permit except during the 25-year, 24-hour storm event, and then the CAFO facility can discharge only process overflow wastewater to the stream. Based on the number of cattle in the watershed, CAFOs could be causing or contributing to the impairment of Dry Creek as indicated by the 303(d) listing. This TMDL requires CAFO facilities to comply with their permits and to not cause or contribute to water quality impairment. If future water quality data indicate CAFOs are causing water quality impairment, individual permits may be required for these facilities. Permitted facilities impacting the impaired stream are entered as point sources having constant flow and load based on design flow and permit concentration limits for fecal coliform bacteria. NPDES permitted facilities are the only contributions to the wasteload allocation (WLA) component of the TMDL. Currently, there are no NPDES permitted facilities located within the Dry Creek watershed. All future NPDES facilities will be required to meet end-of-pipe criteria equivalent to the water quality standard for fecal coliform bacteria of 200 counts/100mL. 2.4.2 Nonpoint Source Assessment Nonpoint sources of fecal coliform bacteria are diffuse sources that cannot be identified as entering the waterbody at a single location. These sources generally involve land activities that contribute fecal coliform bacteria to streams during rainfall runoff events. All sources considered to be nonpoint sources contribute to the load allocation (LA) portion of the TMDL. Typical nonpoint sources of fecal coliform bacteria include:
• Septic Systems • Livestock in streams • Land application of manure • Wildlife • Urban Runoff • Pastures
Septic Systems and Urban Runoff Leaking septic systems were modeled as hourly point sources having a constant flow and load. Literature values were used to estimate the loadings from failing septic systems in the watershed using a representative effluent flow and concentration. Horsley and Witten (1996) estimate septic systems to have an average daily discharge of 70 gallons/person-day with septic effluent concentrations ranging from 104 to 107 counts/100mL.
Final TMDL for Fecal Coliform Bacteria: Dry Creek January 2003
6
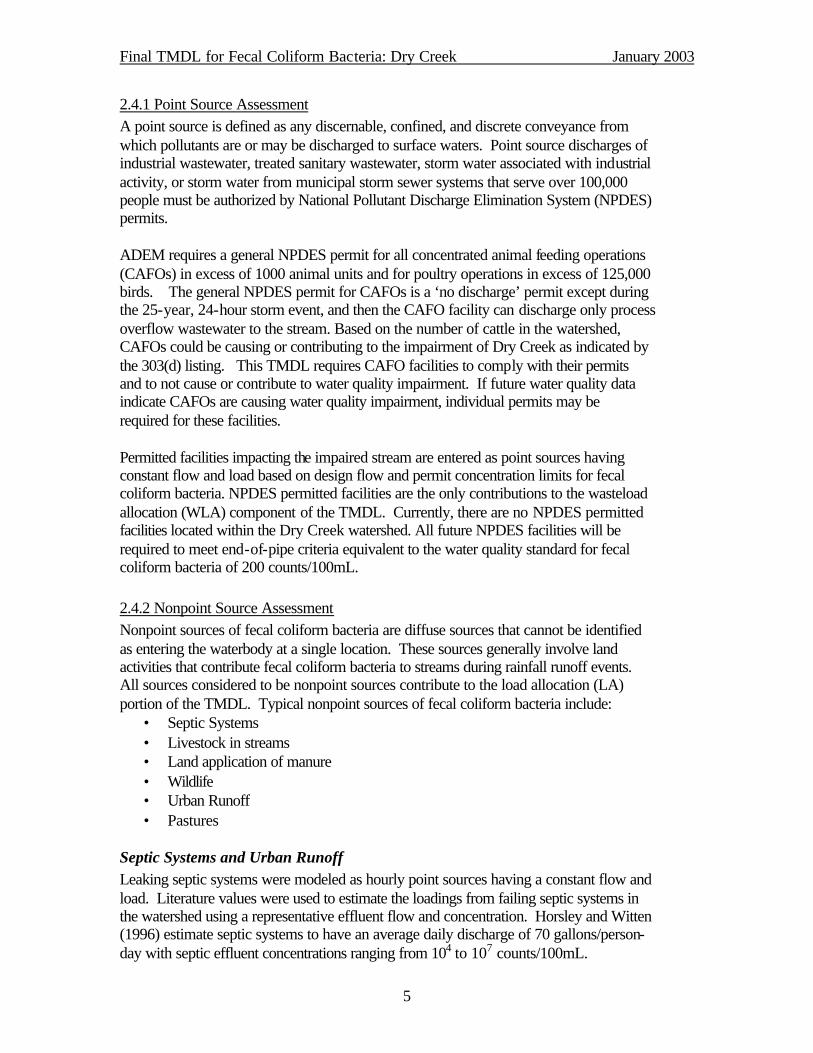
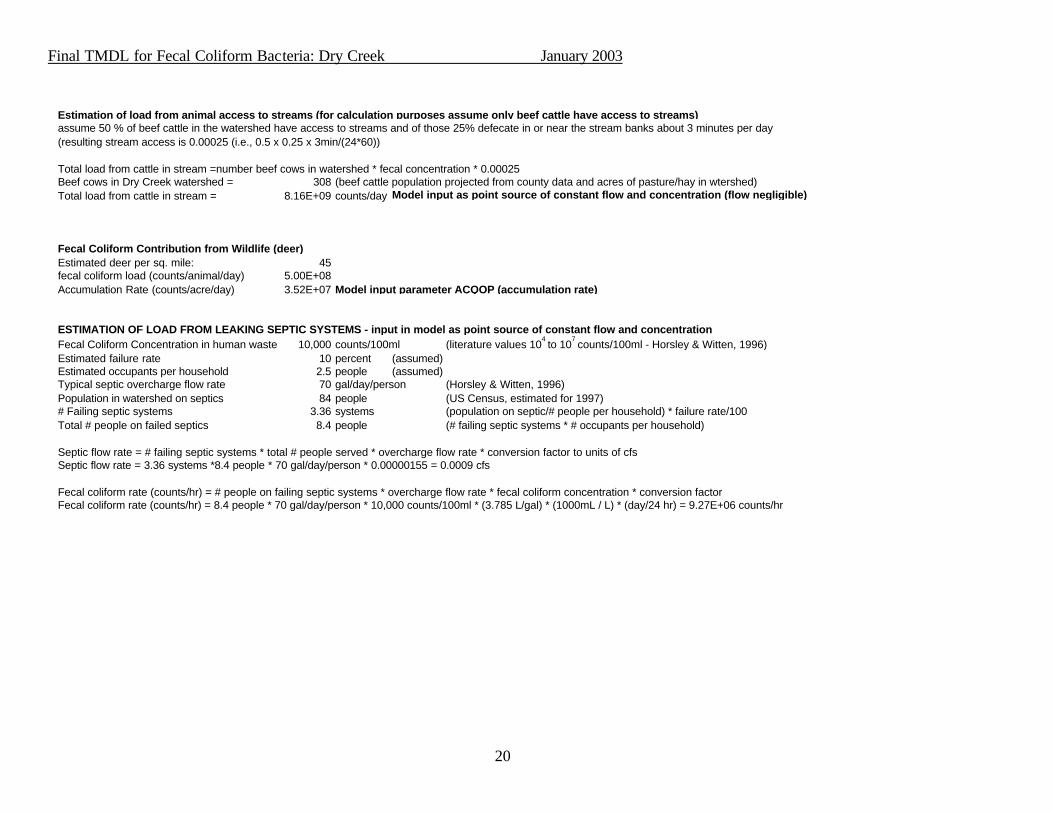
Stormwater runoff from urban areas can contribute to fecal coliform nonpoint source loads by delivering litter and the waste of domestic pets and wildlife to the stream. The number of people in the Dry Creek watershed on septic systems was estimated using 1997 U.S. Census Bureau county data shown in Table 3. Using best professional judgment it was assumed that 10 percent of the total septic systems in the watershed would leak or fail. Each household was assumed to house 2.5 people. Assuming a septic effluent concentration of 104 counts/100mL, the load from failing septic systems was estimated to be 9.27 x 10⁶ counts/hr. Over any 30-day period, this hourly load is equivalent to 6.67 x 10⁹ counts/30 days. This value is a conservative estimate of the loads as it assumes septic systems discharge directly into the stream rather than through the soil layer.
Table 3. Estimated Population on Septic Systems.
Watershed Estimate of Individuals on Septic SystemsDry Creek 84
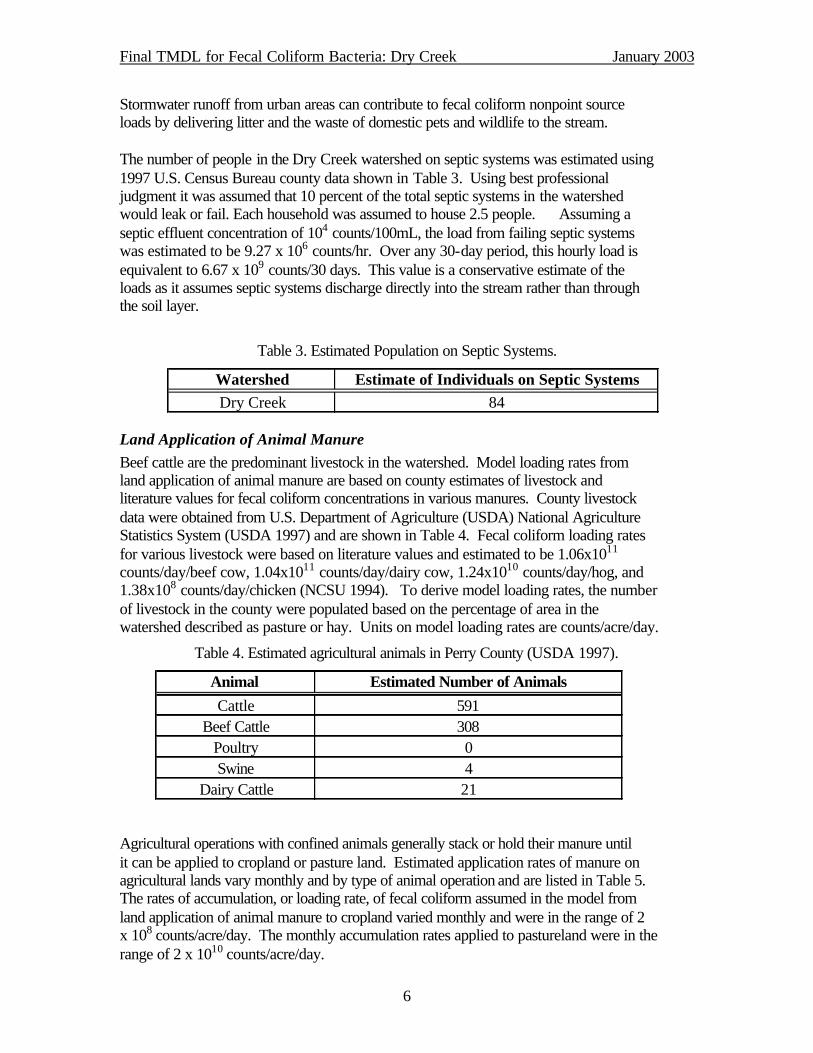
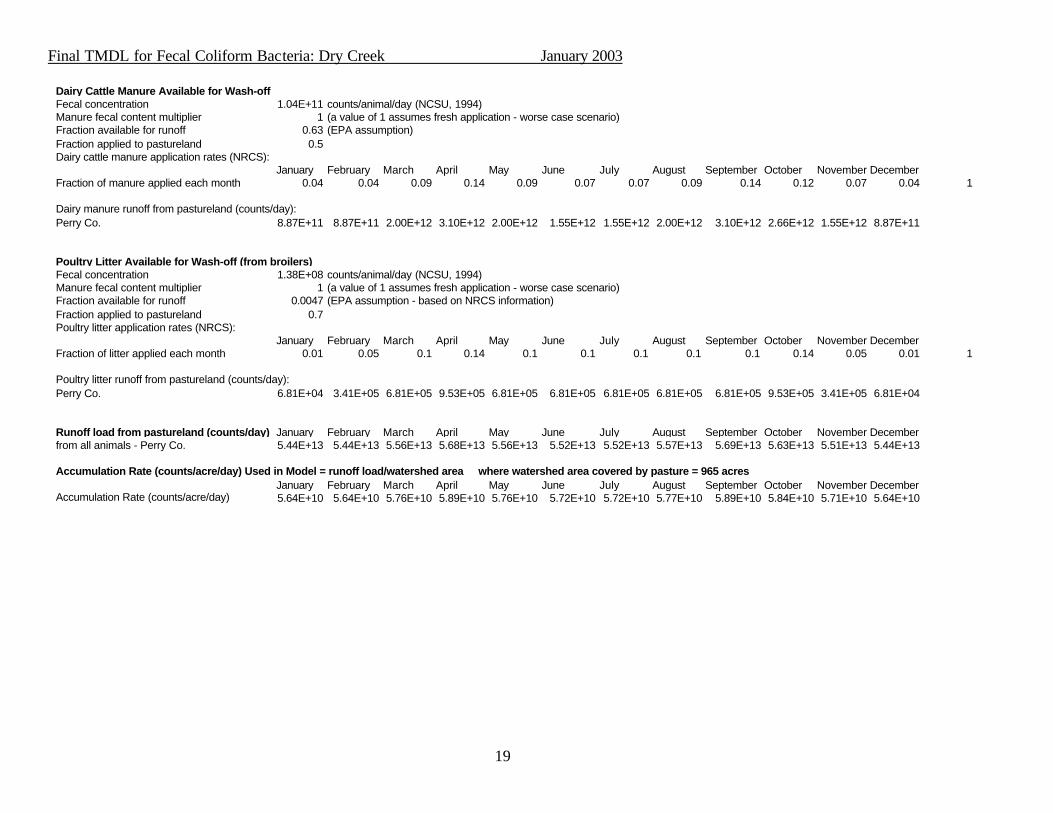
Land Application of Animal Manure Beef cattle are the predominant livestock in the watershed. Model loading rates from land application of animal manure are based on county estimates of livestock and literature values for fecal coliform concentrations in various manures. County livestock data were obtained from U.S. Department of Agriculture (USDA) National Agriculture Statistics System (USDA 1997) and are shown in Table 4. Fecal coliform loading rates for various livestock were based on literature values and estimated to be 1.06x10¹¹ counts/day/beef cow, 1.04x10¹¹ counts/day/dairy cow, 1.24x10¹⁰ counts/day/hog, and 1.38x10⁸ counts/day/chicken (NCSU 1994). To derive model loading rates, the number of livestock in the county were populated based on the percentage of area in the watershed described as pasture or hay. Units on model loading rates are counts/acre/day.
Table 4. Estimated agricultural animals in Perry County (USDA 1997).
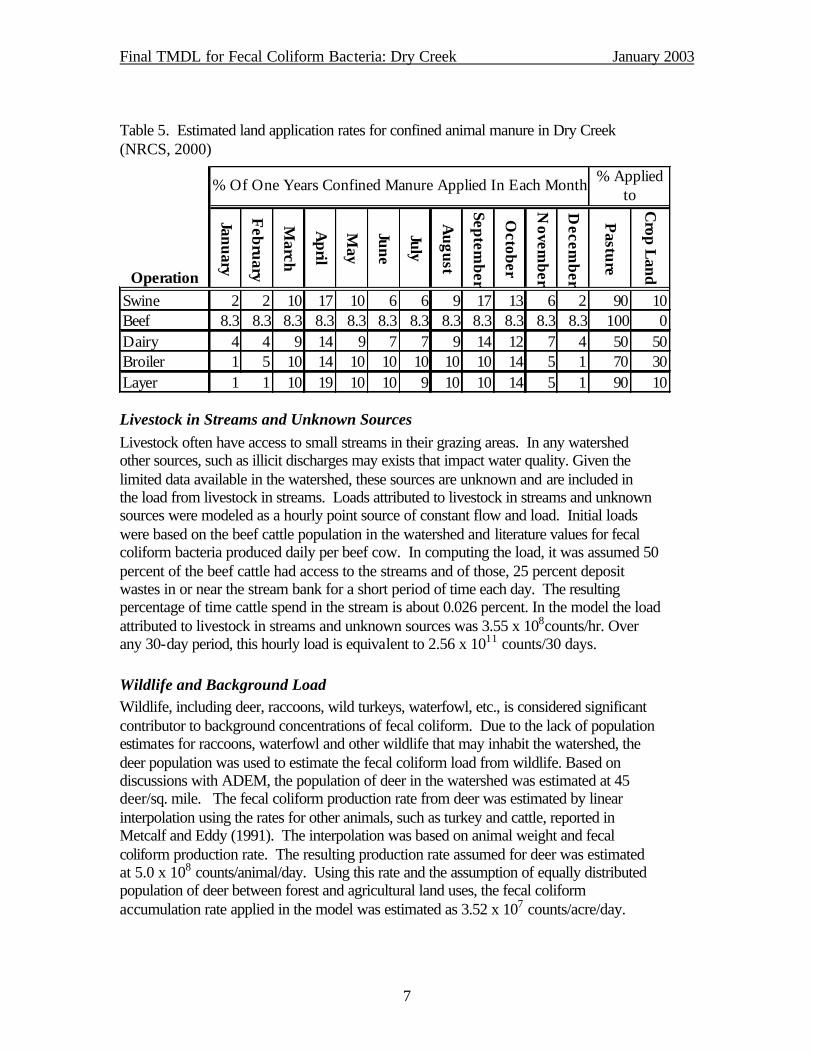
Agricultural operations with confined animals generally stack or hold their manure until it can be applied to cropland or pasture land. Estimated application rates of manure on agricultural lands vary monthly and by type of animal operation and are listed in Table 5. The rates of accumulation, or loading rate, of fecal coliform assumed in the model from land application of animal manure to cropland varied monthly and were in the range of 2 x 10⁸ counts/acre/day. The monthly accumulation rates applied to pastureland were in the range of 2 x 10¹⁰ counts/acre/day.
Animal Estimated Number of Animals
Cattle 591Beef Cattle 308
Poultry 0Swine 4
Dairy Cattle 21
Final TMDL for Fecal Coliform Bacteria: Dry Creek January 2003
7
Table 5. Estimated land application rates for confined animal manure in Dry Creek (NRCS, 2000)
Operation
Janu
ary
Feb
ruary
March
April
May
Jun
e
July
Au
gust
Septem
ber
Octob
er
Novem
ber
Decem
ber
Pastu
re
Crop L
and
Swine 2 2 10 17 10 6 6 9 17 13 6 2 90 10Beef 8.3 8.3 8.3 8.3 8.3 8.3 8.3 8.3 8.3 8.3 8.3 8.3 100 0Dairy 4 4 9 14 9 7 7 9 14 12 7 4 50 50Broiler 1 5 10 14 10 10 10 10 10 14 5 1 70 30Layer 1 1 10 19 10 10 9 10 10 14 5 1 90 10
% Of One Years Confined Manure Applied In Each Month % Applied to
Livestock in Streams and Unknown Sources Livestock often have access to small streams in their grazing areas. In any watershed other sources, such as illicit discharges may exists that impact water quality. Given the limited data available in the watershed, these sources are unknown and are included in the load from livestock in streams. Loads attributed to livestock in streams and unknown sources were modeled as a hourly point source of constant flow and load. Initial loads were based on the beef cattle population in the watershed and literature values for fecal coliform bacteria produced daily per beef cow. In computing the load, it was assumed 50 percent of the beef cattle had access to the streams and of those, 25 percent deposit wastes in or near the stream bank for a short period of time each day. The resulting percentage of time cattle spend in the stream is about 0.026 percent. In the model the load attributed to livestock in streams and unknown sources was 3.55 x 10⁸counts/hr. Over any 30-day period, this hourly load is equivalent to 2.56 x 10¹¹ counts/30 days. Wildlife and Background Load Wildlife, including deer, raccoons, wild turkeys, waterfowl, etc., is considered significant contributor to background concentrations of fecal coliform. Due to the lack of population estimates for raccoons, waterfowl and other wildlife that may inhabit the watershed, the deer population was used to estimate the fecal coliform load from wildlife. Based on discussions with ADEM, the population of deer in the watershed was estimated at 45 deer/sq. mile. The fecal coliform production rate from deer was estimated by linear interpolation using the rates for other animals, such as turkey and cattle, reported in Metcalf and Eddy (1991). The interpolation was based on animal weight and fecal coliform production rate. The resulting production rate assumed for deer was estimated at 5.0 x 10⁸ counts/animal/day. Using this rate and the assumption of equally distributed population of deer between forest and agricultural land uses, the fecal coliform accumulation rate applied in the model was estimated as 3.52 x 10⁷ counts/acre/day.
Final TMDL for Fecal Coliform Bacteria: Dry Creek January 2003
8
2.5 Linking the Sources to the Indicators and Targets Establishing the relationship between instream water quality and sources of fecal coliform, the pathogen indicator, is an important component of the TMDL. It provides the relative contribution of the sources, as well as a predictive examination of water quality resulting from changes in these source contributions. 2.5.1 Model Selection The model selected for this TMDL needed to meet several objectives. The first objective was to simulate the time varying behavior of the deposition and transport of fecal coliform bacteria from the land surface to receiving water bodies. The second was to use a continuous simulation period to identify the critical condition from which to develop the TMDL. Having the ability to use a continuous simulation period while varying the monthly loading rates provided the means to evaluate seasonal effects on the production and fate of fecal coliform bacteria. The Nonpoint Source Model (NPSM) is a dynamic computer model capable of simulating nonpoint source runoff and associated pollutant loads, accounting for point source discharges, and performing flow and water quality routing through stream reaches. It is based on the Hydrologic Simulation Program – FORTRAN (HSPF) and was chosen as the model to complete this TMDL because it incorporates the buildup and wash-off of pollutants on both pervious and impervious land surfaces. In addition, HSPF allows discrete simulation of the required components of the TMDL (i.e., WLA and LA components). The Watershed Characterization System (WCS), a geographic information system (GIS) interface, was used to display, analyze and compile spatial and attribute data. Available data sources included landuse category, point source discharges, soil type and characteristics, population data (human and livestock), digital elevation data, stream characteristics, precipitation and flow data. Results from these analyses provided input to loading spreadsheets developed by Tetra Tech, Inc. Output from the spreadsheets include fecal coliform loading rates from surface runoff and from direct sources including leaking septic systems and livestock with stream access. This output supported initial estimates of model parameters. 2.5.2 Model Setup Dry Creek was delineated into a single subwatershed based on Reach File 3 (RF3) stream coverage and a Digital Elevation Model (DEM) of the area. The farthest downstream point of the delineation was the water quality sampling station DRY-1996. Local meteorological data and local watershed and stream characteristics were used. Landuse in the watershed was characterized based on Multi-Resolution Land Characteristics (MRLC) digital images dated 1990-1993. A continuous simulation period of 10 years (1/1/89 - 12/31/98) was used to analyze the TMDL as this incorporates a wide range of meteorological events for evaluating the worst-case scenario. This long time period also allows the TMDL to be based on a range of seasonal conditions.
Final TMDL for Fecal Coliform Bacteria: Dry Creek January 2003
9
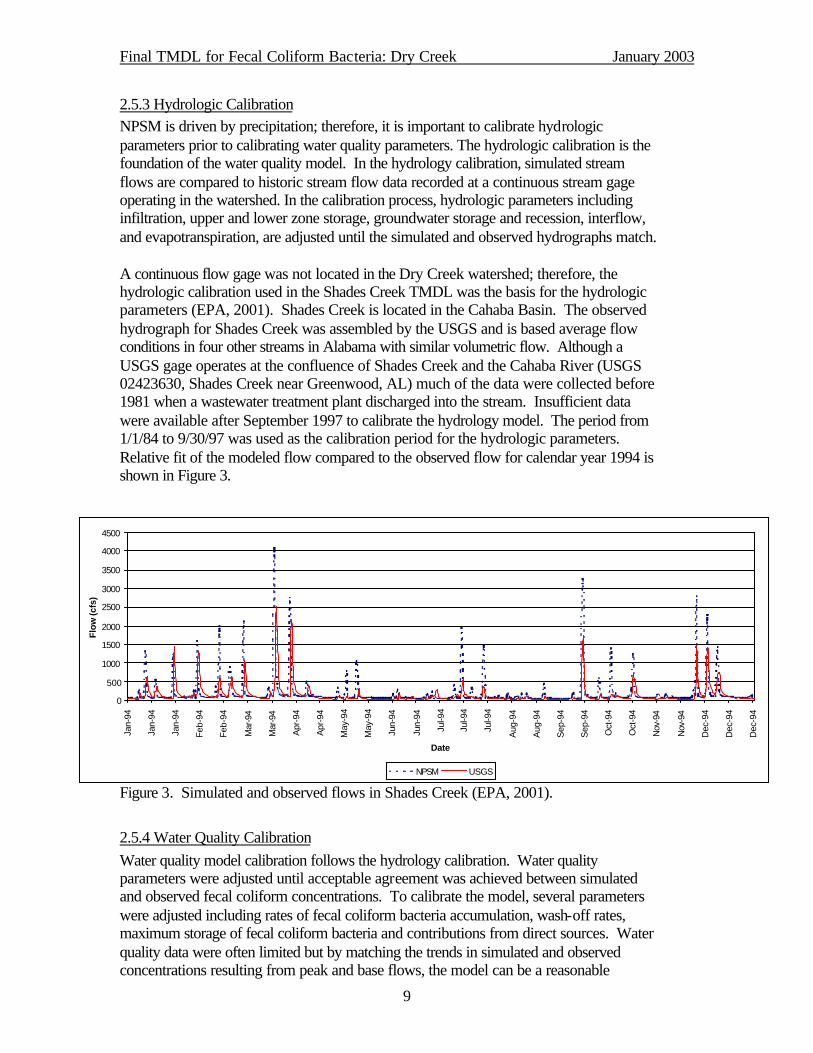
2.5.3 Hydrologic Calibration NPSM is driven by precipitation; therefore, it is important to calibrate hydrologic parameters prior to calibrating water quality parameters. The hydrologic calibration is the foundation of the water quality model. In the hydrology calibration, simulated stream flows are compared to historic stream flow data recorded at a continuous stream gage operating in the watershed. In the calibration process, hydrologic parameters including infiltration, upper and lower zone storage, groundwater storage and recession, interflow, and evapotranspiration, are adjusted until the simulated and observed hydrographs match. A continuous flow gage was not located in the Dry Creek watershed; therefore, the hydrologic calibration used in the Shades Creek TMDL was the basis for the hydrologic parameters (EPA, 2001). Shades Creek is located in the Cahaba Basin. The observed hydrograph for Shades Creek was assembled by the USGS and is based average flow conditions in four other streams in Alabama with similar volumetric flow. Although a USGS gage operates at the confluence of Shades Creek and the Cahaba River (USGS 02423630, Shades Creek near Greenwood, AL) much of the data were collected before 1981 when a wastewater treatment plant discharged into the stream. Insufficient data were available after September 1997 to calibrate the hydrology model. The period from 1/1/84 to 9/30/97 was used as the calibration period for the hydrologic parameters. Relative fit of the modeled flow compared to the observed flow for calendar year 1994 is shown in Figure 3.
Figure 3. Simulated and observed flows in Shades Creek (EPA, 2001).
2.5.4 Water Quality Calibration Water quality model calibration follows the hydrology calibration. Water quality parameters were adjusted until acceptable agreement was achieved between simulated and observed fecal coliform concentrations. To calibrate the model, several parameters were adjusted including rates of fecal coliform bacteria accumulation, wash-off rates, maximum storage of fecal coliform bacteria and contributions from direct sources. Water quality data were often limited but by matching the trends in simulated and observed concentrations resulting from peak and base flows, the model can be a reasonable
0
500
1000
1500
2000
2500
3000
3500
4000
4500
Jan-
94
Jan-
94
Jan-
94
Feb
-94
Feb
-94
Mar
-94
Mar
-94
Apr
-94
Apr
-94
May
-94
May
-94
Jun-
94
Jun-
94
Jul-9
4
Jul-9
4
Jul-9
4
Aug
-94
Aug
-94
Sep
-94
Sep
-94
Oct
-94
Oct
-94
Nov
-94
Nov
-94
Dec
-94
Dec
-94
Dec
-94
Date
Flow
(cfs
)
NPSM USGS
Final TMDL for Fecal Coliform Bacteria: Dry Creek January 2003
10
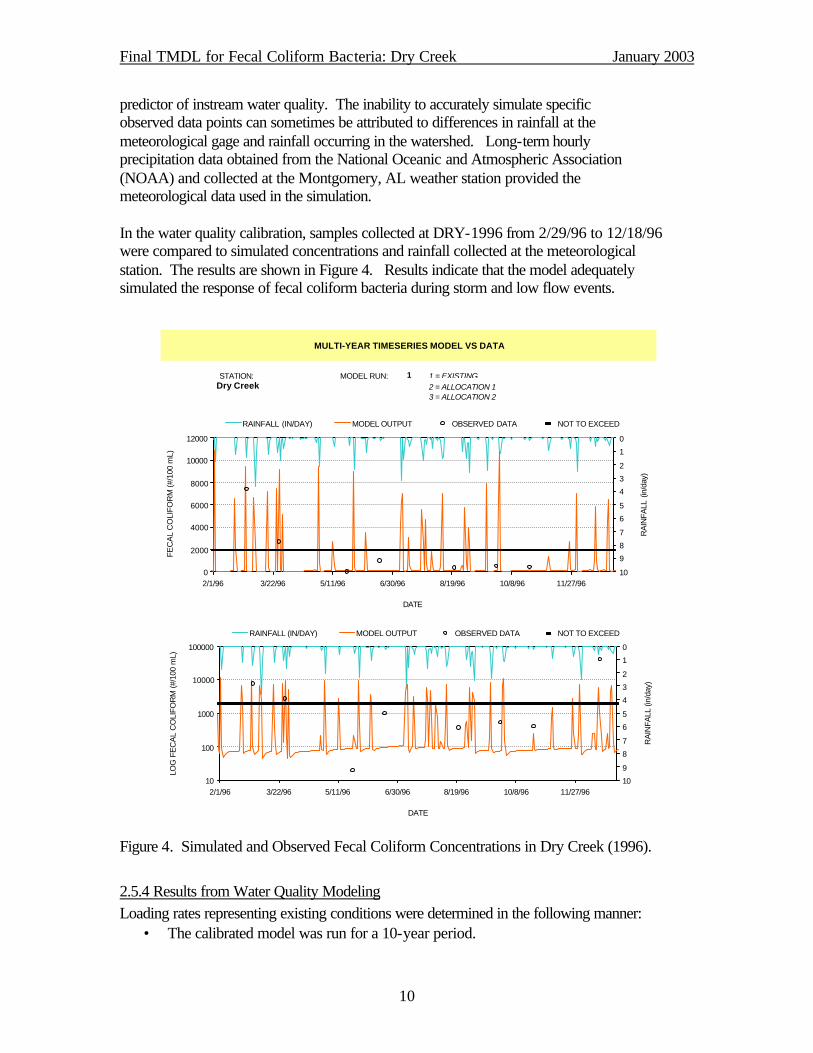
predictor of instream water quality. The inability to accurately simulate specific observed data points can sometimes be attributed to differences in rainfall at the meteorological gage and rainfall occurring in the watershed. Long-term hourly precipitation data obtained from the National Oceanic and Atmospheric Association (NOAA) and collected at the Montgomery, AL weather station provided the meteorological data used in the simulation. In the water quality calibration, samples collected at DRY-1996 from 2/29/96 to 12/18/96 were compared to simulated concentrations and rainfall collected at the meteorological station. The results are shown in Figure 4. Results indicate that the model adequately simulated the response of fecal coliform bacteria during storm and low flow events.
Figure 4. Simulated and Observed Fecal Coliform Concentrations in Dry Creek (1996).
2.5.4 Results from Water Quality Modeling Loading rates representing existing conditions were determined in the following manner:
• The calibrated model was run for a 10-year period.
MODEL RUN: 1 1 = EXISTING2 = ALLOCATION 13 = ALLOCATION 2
MULTI-YEAR TIMESERIES MODEL VS DATA
STATION:Dry Creek
0
2000
4000
6000
8000
10000
12000
2/1/96 3/22/96 5/11/96 6/30/96 8/19/96 10/8/96 11/27/96
DATE
FE
CA
L C
OLI
FO
RM
(#/
100
mL)
0
1
2
3
4
5
6
7
8
9
10
RA
INF
ALL
(in
/day
)
RAINFALL (IN/DAY) MODEL OUTPUT OBSERVED DATA NOT TO EXCEED
10
100
1000
10000
100000
2/1/96 3/22/96 5/11/96 6/30/96 8/19/96 10/8/96 11/27/96
DATE
LOG
FE
CA
L C
OLI
FO
RM
(#/
100
mL)
0
1
2
3
4
5
6
7
8
9
10
RA
INF
ALL
(in/
day)
RAINFALL (IN/DAY) MODEL OUTPUT OBSERVED DATA NOT TO EXCEED
Final TMDL for Fecal Coliform Bacteria: Dry Creek January 2003
11
• Simulated fecal coliform concentrations for the 10-year period were plotted as running 30-day geometric mean concentrations and compared to the standard criteria of 200 counts/100 mL (see Figure 5).
• From Figure 5, critical conditions were determined. • The simulated daily fecal coliform loads from all sources were summed for the 30
day critical period. These values, shown in Table 6, represent existing loads. In this table runoff from all lands includes: loads from grazing animals including deer, an estimate of loads from urban areas, and loads from land applied manure. Leaking septic systems contains only information related to septic systems. Miscellaneous sources include two components: livestock with stream access as well as an estimate of unknown, or illicit, instream sources. Model results indicate that runoff from all lands during storm events provide the largest load of fecal coliform bacteria to the stream. Loads from leaking septic systems and miscellaneous sources are constant loads to the stream. These sources will have the greatest impact on instream water quality during periods of low flow.
Table 6. Summary of existing conditions in the Dry Creek watershed.
Watershed Runoff From All Lands (counts/30 days)1
Leaking Septic Systems (counts/30days)
Miscellaneous Sources (counts/30days)
Instream Concentration (counts/100mL)
Dry Creek 7.74 x 10¹³ 6.67 x 10⁹ 2.56 x 10¹¹ 312
1 Includes grazing animals, deer population, land-applied manure, and urban runoff. 2 Includes livestock with stream access and illicit discharges. 3 Maximum simulated concentration during the critical period
2.6 Allocation 2.6.1 Total Maximum Daily Load (TMDL) Once the model was calibrated for water quality, load reductions were applied until the simulated 30-day geometric mean of the fecal coliform bacteria counts for the 10-year period did not exceed the water quality geometric mean criteria of 200 counts/100 mL (Figure 5). In addition, the simulated concentrations for the allocation scenario were compared to the instantaneous criterion of 2000 counts/100mL during the sampling period to ensure the loads would be protective for daily fluctuation in concentration (Figure 6). The 30-day geometric mean concentrations over the 10-year simulation period are a better indication of average conditions in the stream than the instantaneous criteria. The wasteload allocation (WLA) portion of the TMDL includes any NPDES permitted facilities. The load allocation (LA) portion includes coliform from grazing animals, animals with access to streams, urban runoff and illicit discharges, leaking septic systems and runoff from land applied animal manure.
Final TMDL for Fecal Coliform Bacteria: Dry Creek January 2003
12
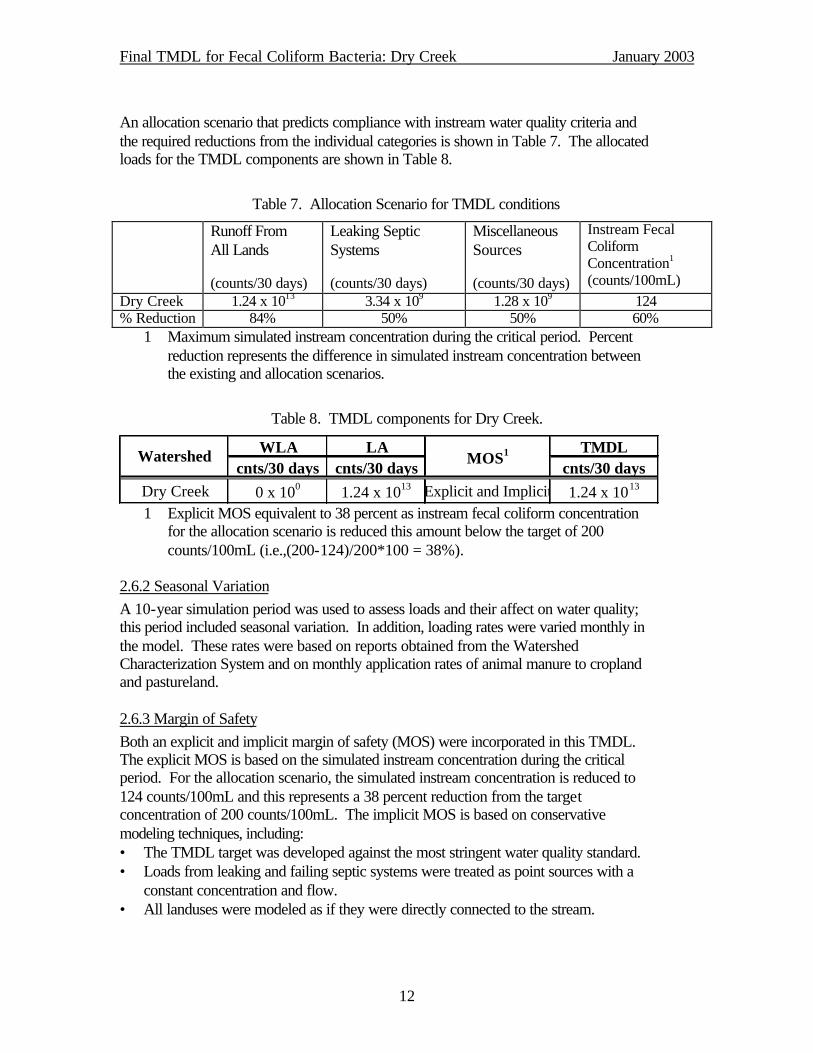
An allocation scenario that predicts compliance with instream water quality criteria and the required reductions from the individual categories is shown in Table 7. The allocated loads for the TMDL components are shown in Table 8.
Table 7. Allocation Scenario for TMDL conditions
Runoff From All Lands (counts/30 days)
Leaking Septic Systems (counts/30 days)
Miscellaneous Sources (counts/30 days)
Instream Fecal Coliform Concentration1
(counts/100mL) Dry Creek 1.24 x 10¹³ 3.34 x 10⁹ 1.28 x 10⁹ 124 % Reduction 84% 50% 50% 60%
1 Maximum simulated instream concentration during the critical period. Percent reduction represents the difference in simulated instream concentration between the existing and allocation scenarios.
Table 8. TMDL components for Dry Creek.
WLA LA TMDLcnts/30 days cnts/30 days cnts/30 days
Dry Creek 0 x 100 1.24 x 10¹³ Explicit and Implicit 1.24 x 10¹³
Watershed MOS1
1 Explicit MOS equivalent to 38 percent as instream fecal coliform concentration
for the allocation scenario is reduced this amount below the target of 200 counts/100mL (i.e.,(200-124)/200*100 = 38%).
2.6.2 Seasonal Variation A 10-year simulation period was used to assess loads and their affect on water quality; this period included seasonal variation. In addition, loading rates were varied monthly in the model. These rates were based on reports obtained from the Watershed Characterization System and on monthly application rates of animal manure to cropland and pastureland. 2.6.3 Margin of Safety Both an explicit and implicit margin of safety (MOS) were incorporated in this TMDL. The explicit MOS is based on the simulated instream concentration during the critical period. For the allocation scenario, the simulated instream concentration is reduced to 124 counts/100mL and this represents a 38 percent reduction from the target concentration of 200 counts/100mL. The implicit MOS is based on conservative modeling techniques, including: • The TMDL target was developed against the most stringent water quality standard. • Loads from leaking and failing septic systems were treated as point sources with a
constant concentration and flow. • All landuses were modeled as if they were directly connected to the stream.
Final TMDL for Fecal Coliform Bacteria: Dry Creek January 2003
13
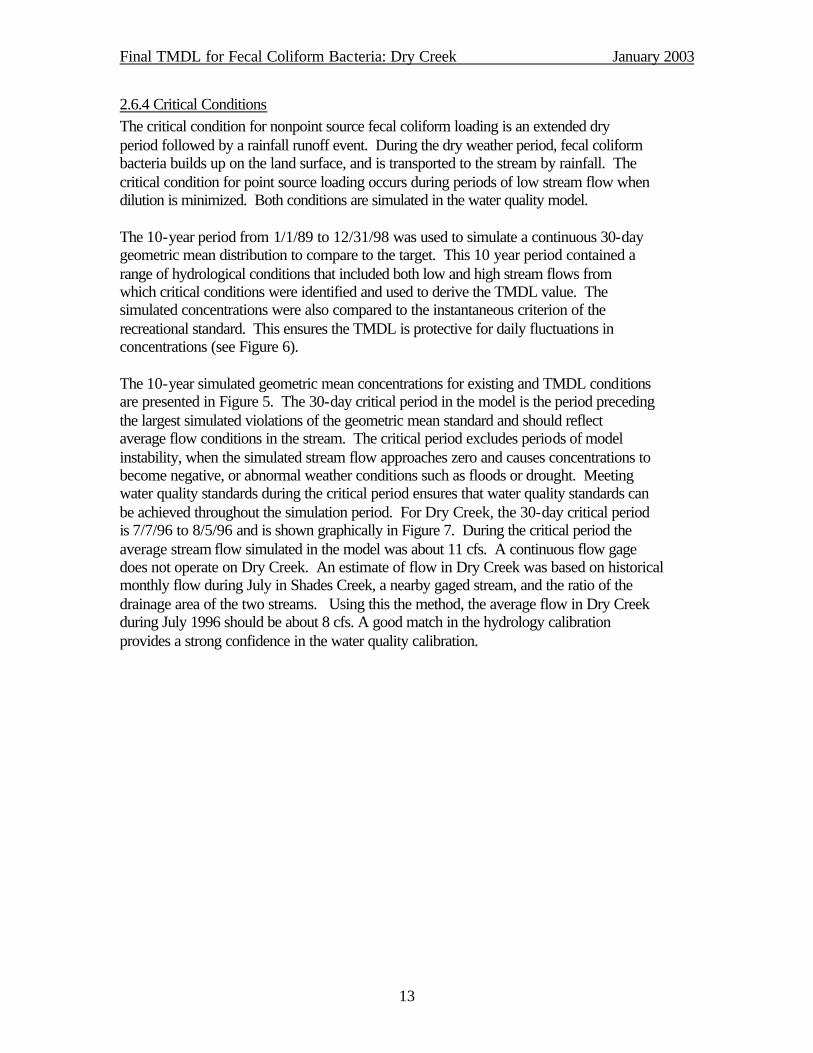
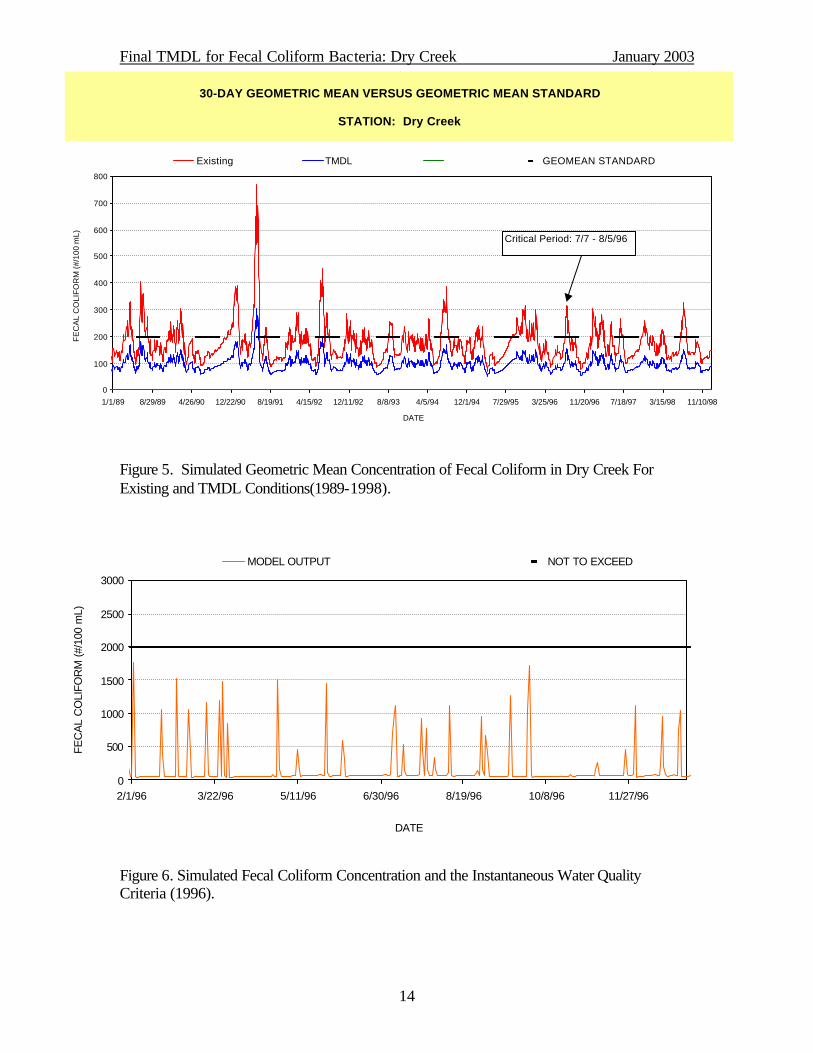
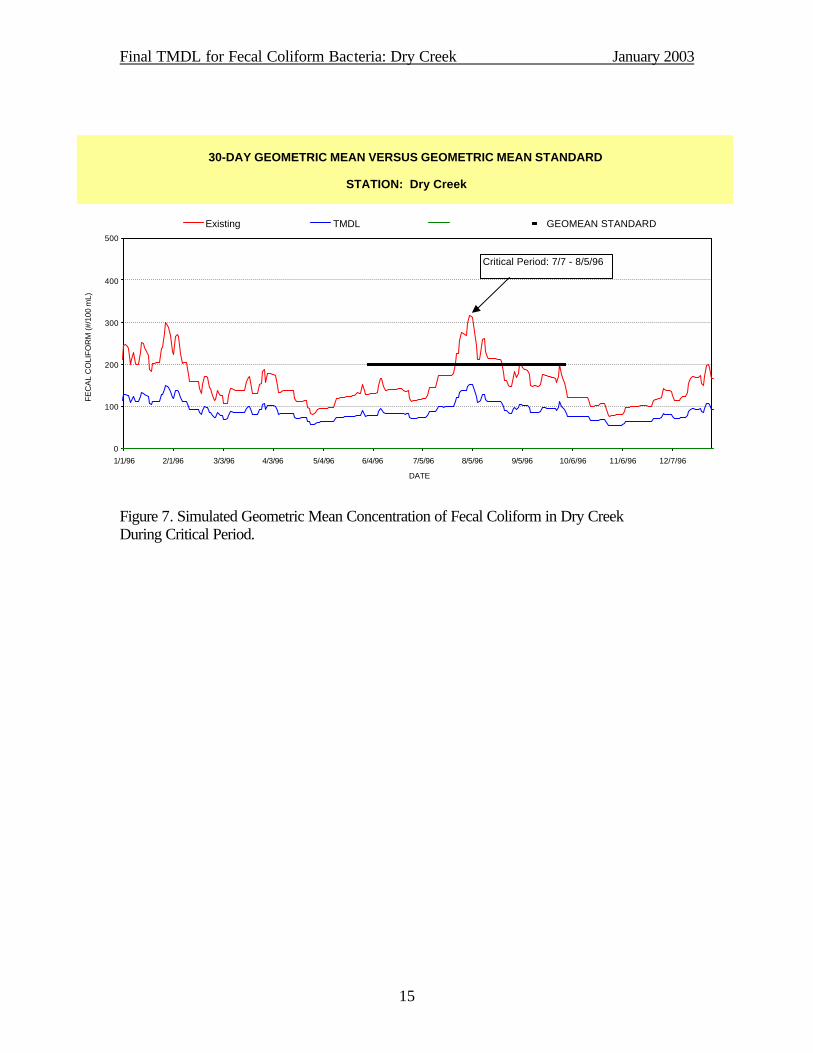
2.6.4 Critical Conditions The critical condition for nonpoint source fecal coliform loading is an extended dry period followed by a rainfall runoff event. During the dry weather period, fecal coliform bacteria builds up on the land surface, and is transported to the stream by rainfall. The critical condition for point source loading occurs during periods of low stream flow when dilution is minimized. Both conditions are simulated in the water quality model. The 10-year period from 1/1/89 to 12/31/98 was used to simulate a continuous 30-day geometric mean distribution to compare to the target. This 10 year period contained a range of hydrological conditions that included both low and high stream flows from which critical conditions were identified and used to derive the TMDL value. The simulated concentrations were also compared to the instantaneous criterion of the recreational standard. This ensures the TMDL is protective for daily fluctuations in concentrations (see Figure 6). The 10-year simulated geometric mean concentrations for existing and TMDL conditions are presented in Figure 5. The 30-day critical period in the model is the period preceding the largest simulated violations of the geometric mean standard and should reflect average flow conditions in the stream. The critical period excludes periods of model instability, when the simulated stream flow approaches zero and causes concentrations to become negative, or abnormal weather conditions such as floods or drought. Meeting water quality standards during the critical period ensures that water quality standards can be achieved throughout the simulation period. For Dry Creek, the 30-day critical period is 7/7/96 to 8/5/96 and is shown graphically in Figure 7. During the critical period the average stream flow simulated in the model was about 11 cfs. A continuous flow gage does not operate on Dry Creek. An estimate of flow in Dry Creek was based on historical monthly flow during July in Shades Creek, a nearby gaged stream, and the ratio of the drainage area of the two streams. Using this the method, the average flow in Dry Creek during July 1996 should be about 8 cfs. A good match in the hydrology calibration provides a strong confidence in the water quality calibration.
Final TMDL for Fecal Coliform Bacteria: Dry Creek January 2003
14
Figure 5. Simulated Geometric Mean Concentration of Fecal Coliform in Dry Creek For Existing and TMDL Conditions(1989-1998).
Figure 6. Simulated Fecal Coliform Concentration and the Instantaneous Water Quality Criteria (1996).
0
500
1000
1500
2000
2500
3000
2/1/96 3/22/96 5/11/96 6/30/96 8/19/96 10/8/96 11/27/96
DATE
FE
CA
L C
OLI
FO
RM
(#/
100
mL)
MODEL OUTPUT NOT TO EXCEED
30-DAY GEOMETRIC MEAN VERSUS GEOMETRIC MEAN STANDARD
STATION: Dry Creek
0
100
200
300
400
500
600
700
800
1/1/89 8/29/89 4/26/90 12/22/90 8/19/91 4/15/92 12/11/92 8/8/93 4/5/94 12/1/94 7/29/95 3/25/96 11/20/96 7/18/97 3/15/98 11/10/98
DATE
FE
CA
L C
OL
IFO
RM
(#
/10
0 m
L)
Existing TMDL GEOMEAN STANDARD
Critical Period: 7/7 - 8/5/96
Final TMDL for Fecal Coliform Bacteria: Dry Creek January 2003
15
Figure 7. Simulated Geometric Mean Concentration of Fecal Coliform in Dry Creek During Critical Period.
30-DAY GEOMETRIC MEAN VERSUS GEOMETRIC MEAN STANDARD
STATION: Dry Creek
0
100
200
300
400
500
1/1/96 2/1/96 3/3/96 4/3/96 5/4/96 6/4/96 7/5/96 8/5/96 9/5/96 10/6/96 11/6/96 12/7/96
DATE
FE
CA
L C
OLI
FO
RM
(#/
100
mL)
Existing TMDL GEOMEAN STANDARD
Critical Period: 7/7 - 8/5/96
Final TMDL for Fecal Coliform Bacteria: Dry Creek January 2003
16
REFERENCES Alabama Department of Environmental Management (ADEM). 2000. Water Quality
Criteria. Chapter 335-6-10. Water Division – Water Quality Program. Code of Federal Regulations. “Water Quality Planning and Management.” Title 40, Part
130, 2000 ed. Horsley & Witten, Inc. 1996. Identification and evaluation of nutrient and bacterial
loadings to Maquiot Bay, New Brunswick and Freeport, Maine. Final Report. Metcalf & Eddy. 1991. Wastewater Engineering: Treatment, Disposal, Reuse. 3rd ed.
McGraw-Hill, Inc., New York. North Carolina State University (NCSU). 1994. Livestock Manure Production and
Characterization in North Carolina. North Carolina Cooperative Extension Service. College of Agriculture and Life Sciences, Raleigh, NC.
NRCS. 2000. Personal Communication. Environmental Engineer. NRCS State Office,
Alabama. USDA. 1997. Census of Agriculture, Volume 1, Geographic Area Series, Part 42.
AC97-A-42. Department of Agriculture, National Agricultural Statistics Service. USEPA. 1991. Guidance for Water Quality – Based Decisions: The TMDL Process.
EPA-440/4-91-001. U.S. Environmental Protection Agency, Office of Water, Washington, DC.
USEPA. 1997. New Policies for Establishing and Implementing Total Maximum Daily
Loads (TMDLs). August 8, 1997. Memorandum from Robert Perciasepe to Regional Administrators. U.S. Environmental Protection Agency, Washington, DC. http://www.epa.gov/owow/tmdl/policy.html.
USEPA. 1998. Better Assessment Science Integrating Point and Nonpoint Sources
(BASINS), Version 2.0 User’s Manual. U.S. Environmental Protection Agency, Office of Water, Washington DC. EPA-823-B-98-006.
USEPA. 2001. Protocol for Developing Pathogen TMDLs. U.S. Environmental
Protection Agency, Office of Water, Washington DC. EPA 841-R-00-001. USEPA. 2001. EPA-Region 4. Watershed Characterization System – User’s Manual.
U.S. Environmental Protection Agency. Region 4. Atlanta, GA. USEPA. 2001. EPA-Region 4. Proposed TMDL: Shades Creek Watershed for Siltation,
Habitat Alteration, Pathogens, U.S. Environmental Protection Agency. Region 4. Atlanta, GA, October 1, 2001.
Final TMDL for Fecal Coliform Bacteria: Dry Creek January 2003
17
APPENDIX A EXAMPLE CALCULATION OF LOADING RATES

Final TMDL for Fecal Coliform Bacteria: Dry Creek January 2003
18
EXAMPLE CALCULATION OF RUNOFF LOAD (example shown for runoff from pastureland in Perry Co)
COUNTY AGRICULTURAL ANIMALS (1997 Data from WWW.NASS.GOV )CATTLE BEEF DAIRY SWINE SHEEP BROILERS LAYERS cattle access to stream
Perry Co. 18544 9611 677 120 0 15 0 yes
LOAD ESTIMATES BASED ON COUNTY ANIMAL POPULATION AND LAND APPLICATION OF MANURE (INITIAL VALUES - FINAL VALUES MAY BE DIFFERENT AS RESULT OF CALIBRATION)Runoff from pastureland (COUNTS/DAY) = Number animals * Fecal concentration (counts/animal/day) * Fecal content multiplier * Runoff rate * monthly application rate* percentage applied to pastureland
Hog Manure Available for Wash-offFecal concentration 1.24E+10 counts/animal/day (NCSU, 1994)Manure fecal content multiplier 1 (stored in lagoons before applying to pastureland - by assuming no decay in the lagoon is a conservative assumption)Fraction available for runoff 0.6 (EPA assumption)Fraction applied to pastureland 1Hog manure application rates (NRCS):
January February March April May June July August September October November DecemberFraction of manure applied each month 0.02 0.02 0.1 0.17 0.1 0.06 0.06 0.09 0.17 0.13 0.06 0.02 1
Hog manure runoff from pastureland (counts/day):Perry Co. 2.98E+10 2.98E+10 1.49E+11 2.53E+11 1.49E+11 8.93E+10 8.93E+10 1.34E+11 2.53E+11 1.93E+11 8.93E+10 2.98E+10
Beef Cattle Manure Available for Wash-offFecal concentration 1.06E+11 counts/animal/day (NCSU, 1994)Manure fecal content multiplier 1 (a value of 1 assumes fresh application - worse case scenario)Fraction available for runoff 0.63 (EPA assumption)Fraction applied to pastureland 1Beef cattle manure application rates (NRCS):
January February March April May June July August September October November DecemberFraction of manure applied each month 0.0833 0.0833 0.0833 0.0833 0.0833 0.0834 0.0834 0.0834 0.0834 0.0833 0.0833 0.0833 1
Beef manure runoff from pastureland (counts/day):Perry Co. 5.35E+13 5.35E+13 5.35E+13 5.35E+13 5.35E+13 5.35E+13 5.35E+13 5.35E+13 5.35E+13 5.35E+13 5.35E+13 5.35E+13
Final TMDL for Fecal Coliform Bacteria: Dry Creek January 2003
19
Dairy Cattle Manure Available for Wash-offFecal concentration 1.04E+11 counts/animal/day (NCSU, 1994)Manure fecal content multiplier 1 (a value of 1 assumes fresh application - worse case scenario)Fraction available for runoff 0.63 (EPA assumption)Fraction applied to pastureland 0.5Dairy cattle manure application rates (NRCS):
January February March April May June July August September October November DecemberFraction of manure applied each month 0.04 0.04 0.09 0.14 0.09 0.07 0.07 0.09 0.14 0.12 0.07 0.04 1
Dairy manure runoff from pastureland (counts/day):Perry Co. 8.87E+11 8.87E+11 2.00E+12 3.10E+12 2.00E+12 1.55E+12 1.55E+12 2.00E+12 3.10E+12 2.66E+12 1.55E+12 8.87E+11
Poultry Litter Available for Wash-off (from broilers)Fecal concentration 1.38E+08 counts/animal/day (NCSU, 1994)Manure fecal content multiplier 1 (a value of 1 assumes fresh application - worse case scenario)Fraction available for runoff 0.0047 (EPA assumption - based on NRCS information)Fraction applied to pastureland 0.7Poultry litter application rates (NRCS):
January February March April May June July August September October November DecemberFraction of litter applied each month 0.01 0.05 0.1 0.14 0.1 0.1 0.1 0.1 0.1 0.14 0.05 0.01 1
Poultry litter runoff from pastureland (counts/day):Perry Co. 6.81E+04 3.41E+05 6.81E+05 9.53E+05 6.81E+05 6.81E+05 6.81E+05 6.81E+05 6.81E+05 9.53E+05 3.41E+05 6.81E+04
Runoff load from pastureland (counts/day) January February March April May June July August September October November Decemberfrom all animals - Perry Co. 5.44E+13 5.44E+13 5.56E+13 5.68E+13 5.56E+13 5.52E+13 5.52E+13 5.57E+13 5.69E+13 5.63E+13 5.51E+13 5.44E+13
Accumulation Rate (counts/acre/day) Used in Model = runoff load/watershed area where watershed area covered by pasture = 965 acresJanuary February March April May June July August September October November December
Accumulation Rate (counts/acre/day) 5.64E+10 5.64E+10 5.76E+10 5.89E+10 5.76E+10 5.72E+10 5.72E+10 5.77E+10 5.89E+10 5.84E+10 5.71E+10 5.64E+10
Final TMDL for Fecal Coliform Bacteria: Dry Creek January 2003
20
Estimation of load from animal access to streams (for calculation purposes assume only beef cattle have access to streams)assume 50 % of beef cattle in the watershed have access to streams and of those 25% defecate in or near the stream banks about 3 minutes per day (resulting stream access is 0.00025 (i.e., 0.5 x 0.25 x 3min/(24*60))
Total load from cattle in stream =number beef cows in watershed * fecal concentration * 0.00025Beef cows in Dry Creek watershed = 308 (beef cattle population projected from county data and acres of pasture/hay in wtershed)Total load from cattle in stream = 8.16E+09 counts/day Model input as point source of constant flow and concentration (flow negligible)
Fecal Coliform Contribution from Wildlife (deer)Estimated deer per sq. mile: 45fecal coliform load (counts/animal/day) 5.00E+08Accumulation Rate (counts/acre/day) 3.52E+07 Model input parameter ACQOP (accumulation rate)
ESTIMATION OF LOAD FROM LEAKING SEPTIC SYSTEMS - input in model as point source of constant flow and concentrationFecal Coliform Concentration in human waste 10,000 counts/100ml (literature values 10
4 to 10
7 counts/100ml - Horsley & Witten, 1996)
Estimated failure rate 10 percent (assumed)Estimated occupants per household 2.5 people (assumed)Typical septic overcharge flow rate 70 gal/day/person (Horsley & Witten, 1996)Population in watershed on septics 84 people (US Census, estimated for 1997)# Failing septic systems 3.36 systems (population on septic/# people per household) * failure rate/100Total # people on failed septics 8.4 people (# failing septic systems * # occupants per household)
Septic flow rate = # failing septic systems * total # people served * overcharge flow rate * conversion factor to units of cfsSeptic flow rate = 3.36 systems *8.4 people * 70 gal/day/person * 0.00000155 = 0.0009 cfs
Fecal coliform rate (counts/hr) = # people on failing septic systems * overcharge flow rate * fecal coliform concentration * conversion factorFecal coliform rate (counts/hr) = 8.4 people * 70 gal/day/person * 10,000 counts/100ml * (3.785 L/gal) * (1000mL / L) * (day/24 hr) = 9.27E+06 counts/hr
Related Documents