LURRALDE ANTOLAMENDU ETA INGURUMEN SAILA DEPARTAMENTO DE ORDENACION DEL TERRITORIO Y MEDIO AMBIENTE Environmental Framework Programme series n.º 7, May 2002 Total Material Requirement of the Basque Country TMR 2002

Welcome message from author
This document is posted to help you gain knowledge. Please leave a comment to let me know what you think about it! Share it to your friends and learn new things together.
Transcript

LURRALDE ANTOLAMENDUETA INGURUMEN SAILA
DEPARTAMENTO DEORDENACION DEL TERRITORIOY MEDIO AMBIENTE
Environmental Framework Programme series n.º 7, May 2002
Total MaterialRequirement
of the Basque Country
TMR 2002

Published by:Sociedad Pública de Gestión Ambiental – IHOBE
Designed by:Imprenta Berekintza
Basque Translation:Elhuyar
© IHOBE 2002
Registration n.º:BI-2421-01
Printed entirely on recycled paper
Environmental Framework Programme Series
– N.º 1, November 2000, Economic Impact ofEnvironmental Spending and Investment of theBasque Public Authorities
– N.º 2, May 2001, Ecology Barometer 2001
– N.º 3, October 2001, The Environment in theBasque Country
– N.º 4, January 2002, European UnionStrategy for Sustainable Development
– N.º 5, February 2002, Inventory of HazardousWaste in the Basque Country (Outline)
– N.º 6, April 2002, Cycling Towards Fume-freeCities
– N.º 7, May 2002, Total Material Requirementof the Basque Country.TMR 2002
www.ingurumena.net

TMR 2002
Total MaterialRequirement
of the Basque Country

Tota
l M
ater
ial
Requ
irem
ent
of t
he B
asqu
e Co
untr
y
FOREWORD ..................................................................................................................................................................................................................................................................................... 5
ACKNOWLEDGEMENTS ............................................................................................................................................................................................................................................ 6
1. INTRODUCTION ..................................................................................................................................................................................................................................................................... 7
2. GOALS AND METHODS ........................................................................................................................................................................................................................................... 10
3. SOURCES OF INFORMATION.......................................................................................................................................................................................................................... 13
4. ANALYSIS OF RESULTS ......................................................................................................................................................................................................................................... 15
4.1 DOMESTIC RESOURCE EXTRACTION4.1.1 Domestic biomass extraction & associated hidden flows4.1.2 Domestic extraction of abiotic material & associated hidden flows
Mining & overburdenExcavationDredging
4.1.3 Domestic total material requirement4.2 FOREIGN RESOURCE REQUIREMENTS
4.2.1 Foreign direct material input4.2.2 Hidden flows associated with foreign direct material input4.2.3 Foreign total material requirement
4.3 TOTAL MATERIAL REQUIREMENT OF THE BASQUE COUNTRY4.3.1 Direct material input of the Basque Country4.3.2 Hidden flows of the Basque Country4.3.3 Total material requirement of the Basque Country
5. CONCLUSIONS & ACTIONS TO REDUCE TMR ............................................................................................................................................................ 42
5.1 CONCLUSIONS5.2 ACTIONS TO REDUCE TMR
BASIC BIBLIOGRAPHY ................................................................................................................................................................................................................................................................... 45
APPENDIX: GLOSSARY & ABBREVIATIONS ........................................................................................................................................................................................ 46
Index

Tota
l M
ater
ial
Requ
irem
ent
of t
he B
asqu
e Co
untr
y
5
In the coming decade the Basque Country will have a great opportunity to producemore well-being using more human resources and less natural resources. It is essen-tial that economic growth be decoupled from the use of resources and from conta-
mination if sustainable development is to be achieved. A transformation can and musttake place which will reduce the use of natural resources and increase productivity, thusgenerating lower environmental impacts in all sectors of the economy throughout thelife cycle of products and services.
This new document has been drawn up under the Environmental Framework Programmeto analyse the progress made in this decoupling process. It looks at developments in theuse of natural resources in the Basque Country between 1989 and 1998. It also presentsa series of indicators which can be used to monitor the pressure exerted by the Basqueproduction system on the environment year by year, to determine the sources of thatpressure and to promote action to palliate them. Chief among these indicators is theTotal Material Requirement, which indicates the accumulated volume (measured intonnes per inhabitant per annum) of materials extracted from nature by economic activ-ities.
This study has been drawn up by the Environmental Economy Unit of the University ofthe Basque Country. This unit was set up jointly by the Basque Government Departmentof Land Use and the Environment and the Institute for Public Economics of theUniversity of the Basque Country. Its main purpose is to analyse the relationshipbetween economic activity in the Basque Country and the environment.
Foreword
Sabin Intxaurraga
Basque Government Ministerfor Land Use and the Environment
Foreword
This document was drawn up by Iñaki Arto of the Environmental Economy Unit at theInstitute for Public Economics of the University of the Basque Country (UPV) for thepublicly-owned environmental management company IHOBE, S.A.
The Basque Government Department of Land Use and the Environment wishes specifi-cally to thank the following persons:
• Roberto Bermejo (UPV), Alexander Boto (IHOBE, S.A.), M.ª Carmen Gallastegui (UPV)and Javier Fernández (UPV) for the conceptual design of the project and for their tech-nical management work.
• Ignacio Quintana (IHOBE, S.A.) for his comments in the final document.
• Javier Aguirre (Basque Govt. Dept. of Land Use and the Environment), Esther Álvaro(UPV Library), Javier Aramburu (EUSTAT), Stefgan Bringezu (Wüppertal Institute), SaraChamizo (Dept. of Public Works & Transport, Provincial Council of Bizkaia), José MiguelEdeso (UPV), Irune Elorriaga (Basque Govt. Dept. of Transport & Public Works), M.ªVictoria García (EUSTAT), Patxi Garrido (EUSTAT), Mª Isabel Inza (Dept. of Transport &Highways, Provincial Council of Gipuzkoa), Michael Kuhndt (Wüppertal Institute), CharoMartínez (UPV European Documentation Centre), Pedro Ortega (Dept. of Public Works &Transport, Provincial Council of Bizkaia), Juan Luis Peña (Port of Pasajes), Roberto Pérezde San Román (IKT), Josune Redondo (IKT), Mª Lourdes Sáenz de Castillo (UPV Library),Pilar Santa María (IKT), Lluís Selma (Institute of Surveyors and Technical Architects ofBarcelona), Helmut Schütz (Wüppertal Institute), José Luis Vargas (UPV EuropeanDocumentation Centre), Jesús Villanueva (Port of Bilbao), Ramón de Zubiaur (MENDIKOI,S.A.). Thanks to each and every one of them for their advice and for the documentationthey provided for the drawing up of this study.
Acknowledgements
6Eskerrak
Tota
l M
ater
ial
Requ
irem
ent
of t
he B
asqu
e Co
untr
y

Tota
l M
ater
ial
Requ
irem
ent
of t
he B
asqu
e Co
untr
y
7Introduction
1 Introduction
Calculating the amount of natural resources consumed and identifying the associa-ted environmental impacts are key points within the sustainability objectives andthe strategy of integrating the economy and the environment outlined in the
Environmental Framework Programme of the Basque Country 2002-2020. Material FlowAnalysis (MFA) provides a systematic picture of the physical flows of natural resourcesfrom extraction through production, use and recycling to final elimination, taking intoaccount the losses along the way. The technique is based on the desire to link the con-sumption of natural resources with the capacity of the environment to providematerials and absorb waste.
MFA is used to give an overview of the physical basis underlying industrial economiesand provide a series of sustainability indicators. The idea is to account for all the nat-ural resources extracted from the environment (materials processed and/ or dis-placed) to sustain different economic activities.
Raw materials enter the economy from agriculture, forestry, fishing, mining and gas/oildrilling. Industry processes those raw materials and converts them into goods and serv-ices. Materials are thus passed on to consumers and eventually to their final destina-tion: recycling and re-use, dumping as waste or dispersal into the atmosphere.
Extracting or harvesting primary natural resources often calls for the displacement orprocessing of considerable amounts of material, which can modify or damage the envi-ronment. For instance to get at mineral deposits huge quantities of material sometimeshave to be displaced. Then, once the minerals are extracted, the ore must be separatedfrom the gangue minerals and concentrated for processing. All this generates largequantities of waste.
Some agricultural activities heighten erosion by exposing more and more cultivated landto the wind and weather. The construction of buildings and infrastructure involves theexcavation of large amounts of materials. All these flows are part of a country’s eco-nomic activity, but are hardly ever considered as economic goods per se. From the view-point of material flows a distinction is drawn between materials which enter the econ-omy directly (known as Direct Material Input or DMI) and those which do not (knownas Hidden Flows or HF). The latter are associated with the extraction of primary natu-ral resources. The pressure exerted on the environment by these flows is normally dif-ferent from that exerted by materials which enter industry directly and are convertedinto goods and services. A tonne of earth shifted to extract uranium is not the same asa tonne of uranium. But all uses of natural resources have the potential to cause majorupsets in the environment.

Tota
l M
ater
ial
Requ
irem
ent
of t
he B
asqu
e Co
untr
y
8
MFA does not enable us to recognise in advance which flows are likely to harm the envi-ronment. The harmfulness of flows depends on the point of view of the observer and onthe characteristics of the local environment. MFA centres on studying the quantitativeaspects of material flows, and takes no account of their qualitative aspects, even thoughdifferences in their potential to do harm may be evident. In spite of this, MFA providesus with a series of figures which, if properly weighted, can give us an overview ofthe environmental impact (in qualitative terms) of economic activity. For instance,the flow of oil in an economy can be used to estimate that economy’s contribution toacid rain or the greenhouse effect.
Since the market sets no price on hidden flows, they are not generally considered ineconomic accounting. This results in statistics that underestimate the dependence onnatural resources of an economy and provide planners with a distorted image of thephysical scale and consequences of their economic decisions.
The primary natural resources and associated hidden flows required for the productionof any given product or service comprise the total material requirement associated withit. This requirement is also a measure of the pressure on the environment potentiallyattributable to that product or service. These flows represent the total amount of natu-ral resources which need to be used to generate the goods and services of an economy.
Separate mention must be made of materials originating in other economies. In the cur-rent global economic context materials may originate in one country, be processed inanother, turned into end products in a third and consumed in a fourth. This is especial-ly important in MFA’s of highly open economies such as the Basque economy. In princi-ple, the hidden flows associated with exported materials could be allocated to theexporting country on the grounds that each country should take responsibility for theenvironmental damage arising from its exports. In practice, however, this approach failsto take into account the major asymmetries which exist in industrial economies (whichimport large amounts of raw materials) and developing economies (many of whichdepend largely on exports of those materials and therefore bear the environmental costsof extracting them). It also fails to consider the current physical basis of most indus-
Introduction
ENVIRONMENT
OUTPUTINPUT
Technosphere
Anthroposphere
Economy
metals, non metals,energy resources
water
air
harvested biomass,fishing, hunting
waste deposits
waste water
emissions into theatmosphere
fertilisers, pesticides,dissipative losses
HIDDEN FLOWSoverburden, excavation, dredging,
erosion, discards
DMI
TMR
Figure 1: Material Flow Analysis

Tota
l M
ater
ial
Requ
irem
ent
of t
he B
asqu
e Co
untr
y
9
trial economies and the importance from a global environmental perspective of usingresources more efficiently in those economies. MFA’s include an estimate of hidden flowsassociated with imports.
The total physical requirements of an economy (i.e. the sum of domestic andimported materials, excepting air and water, and their associated hidden flows) areknown as the Total Material Requirement (TMR) (see Fig. 1). The TMR is a measure-ment of the physical flows or of the scale of economic activity in physical terms bywhich an economy is sustained. The TMR complements other, monetary measure-ments of a nation’s economic activity, such as GDP. Together, monetary and physicalmeasurements provide a more comprehensive view of the size and scope of industrialeconomies. The TMR can also be seen as an approximate measurement of the pressurepotentially exerted by an economy on the global environment: the accuracy of thatmeasurement will depend on the degree of aggregation of TMR components and theirenvironmental impact. Material flow accounting is presented in terms of TMR percapita to facilitate comparisons between countries. The use of raw materials comingfrom natural resources is also calculated (i.e. the DMI per capita). This is the TMR minusthe domestic and foreign hidden flows.
In the short and medium term no changes may be expected in the pattern of consump-tion and production which could make for a rapid reduction in direct demand and adematerialisation of the economy. Feasible alternative ways of reducing raw materialflows must therefore be considered. One of the most important of those alternatives isprovided by TMR, as it enables highly material intensive economic processes to be iden-tified. It is in these processes that ways must be sought of reducing the material flows.
Introduction

Tota
l M
ater
ial
Requ
irem
ent
of t
he B
asqu
e Co
untr
y
10Goals & Methods
2 Goals& Methods
The main goal of this study is to provide a series of indicators for monitoringthe physical basis of the economy of the Basque Country between 1989 and1998. The set of indicators drawn up enable the degree of dematerialisation of
the economy and the level of decoupling between the economy and the environ-ment to be analysed over time
DOMESTIC TOTALMATERIAL REQUIREMENT
FOREIGN TOTALMATERIAL REQUIREMENT
Domestic DMI:- Agriculture- Timber- Other forestry
products- Bee-keeping- Hunting- River fishing- Sea fishing- Mining- Excavation
Foreign DMI:- Imports from rest of
world- Imports from rest of
Spain
Domestic HF:- Erosion- Discards in fishing- Overburden in mining- Dredging- Excavation
Foreign HF:- HF from rest of
world- HF from rest of
Spain
DIRECT MATERIAL INPUT HIDDEN FLOWS
TOTAL MATERIAL REQUIREMENT
Figure 2: Components of the Total Material Requirement
The main indicator to be calculated is the Total Material Requirement (TMR). This is amacro-indicator developed by the Wüppertal Institute which describes, in terms of totalmass, not only the total amount of resources which enter the production processes ofan economy directly (direct material input), but also the indirect flows (hidden flows)associated with that production. Material flows of both domestic and foreign origin aretaken into account. This breaks down the TMR into a domestic component and a foreigncomponent, thus indicating the geographical location of the pressures exerted on theenvironment by our economic activities (see Fig. 2). It also indicates the dependency ofour economy in terms of resources.

Tota
l M
ater
ial
Requ
irem
ent
of t
he B
asqu
e Co
untr
y
11
Domestic TMR comprises domestic direct material input plus domestic hidden flows.Domestic DMI covers the domestic extraction of raw materials, both biotic (agriculture,timber, other forestry products, bee-keeping, hunting, river fishing and sea fishing) andabiotic (mining and materials from excavation used in construction). Cattle farming isnot included in domestic DMI, as this would amount to accounting twice for the sameresources: primary production of feedstuffs for animals and the biomass grazed arecounted under agriculture and other forestry products. Furthermore, foreign DMI includesimported cattle feedstuffs, so there is no need to take livestock biomass into accountbecause the inputs needed to sustain it are already accounted for. Domestic hiddenflows are materials displaced as a result of the extraction of domestic DMI which do notenter the economy (erosion due to agriculture, discards in sea fishing, displacement ofthe overburden in mining, surplus materials in excavation for construction of infra-structures/ buildings and dredging operations).
Foreign TMR is divided into foreign DMI and foreign hidden flows. Foreign DMI compris-es imports into the Basque Country from the rest of the world and from the rest of Spain.This covers raw and semi-manufactured materials and products of biotic and abiotic ori-gin. The hidden flows associated with imports are those materials displaced elsewhereto obtain the material imported.
The TMR of the Basque Country is therefore made up of the domestic and foreign DMIplus the domestic and foreign hidden flows:
Goals & Methods
DMIdomestic + HFdomestic
TMRdomestic
TMR = DMI + HF = [ DMIforeign + HFforeign
TMRforeign
[+
INPUT = Direct Material Input (per capita DMI)
Direct Material productivity(GDP per DMI)
DMI + HF = Total Material Requirement(annual TMR)
Material Intensity of the Economy(per capita TMR)
Total Material Productivity (GDP per TMR)
Figure 3: Main Indicators
From the various components of the TMR a series of indicators can be obtained (seeFig. 3) which relate physical variables (DMI, hidden flows and TMR) to economic andsocial variables (GDP and population levels) .

Tota
l M
ater
ial
Requ
irem
ent
of t
he B
asqu
e Co
untr
y
12
The TMR of the Basque Country has been calculated using the method laid down by theEuropean Environment Agency in technical reports nº 55 Total Material Requirement ofthe European Union and 56 Total Material Requirement of the European Union: TechnicalPart. However, it has proved necessary to adapt this method to the specific character-istics of the Basque Country. The main changes made are:
• Use of specific coefficients in calculating erosion due to agriculture;
• Introduction of a new method for calculating excavation due to the construction ofinfrastructure and buildings; and
• Estimation of imports from the rest of Spain.
Although these changes in methods make the study somewhat more complicated, theylead to significant improvements in the accuracy of the results. Those improvementsmean that the indicators are closer to the reality of the Basque economy.
Goals & Methods

DOMESTIC SECTOR
Direct Material Input Source
Agriculture Nekazal Ikerketa eta Teknologia S.A. (IKT)Ministry of Agriculture, Fisheries and Food (MAFF)
Bee-keeping IKT, MAFF
Timber IKT, MAFF
Hunting IKT, MAFF
Sea fishing IKT, MAFF
Mining Spanish Geological and Mining Institute (SGMI)
Excavation used Own estimates
Hidden Flows Source
Erosion Own estimates
Discards in fishing Greenpeace
Overburden in mining Wüppertal Institute
Excavation not used Own estimates
Dredging Port authorities at the ports of Pasajes and Bilbao
Tota
l M
ater
ial
Requ
irem
ent
of t
he B
asqu
e Co
untr
y
13
The process of obtaining data to calculate the TMR of the Basque Country was a labo-rious one, as the data were widely dispersed. In some cases data were expressed innon conventional weight units, and conversion factors had to be applied before they
could be processed. In other cases a lack of data made it necessary to draw up estima-tes.The main sources of information for calculating the Basque TMR are shown in Table 1,broken down by sectors and types of flow.
Sources of Information
3 Sourcesof Information
Table 1: Main sources of information for calculating the TMR
Tota
l M
ater
ial
Requ
irem
ent
of t
he B
asqu
e Co
untr
y
14Sources of Information
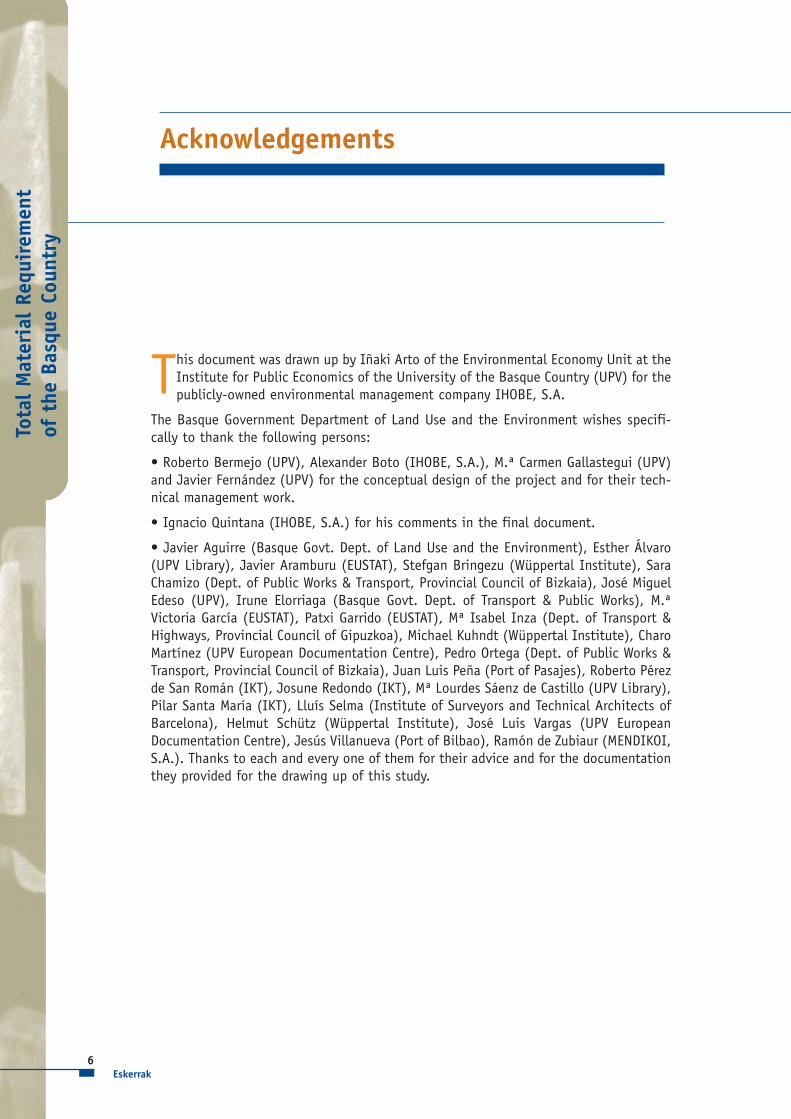
FOREIGN SECTOR
Direct Material Input Source
Imports from rest of world (RW) ICEX (Institute for Foreign Trade)
EUSTAT (Basque Institute of Statistics)
Imports from rest of Spain (RS) Own estimates
EVE (Basque Energy Organisation)
Hidden flows Source
Hidden flows in imports from RW Wüppertal Institute
Hidden flows in imports from RS Wüppertal Institute

Tota
l M
ater
ial
Requ
irem
ent
of t
he B
asqu
e Co
untr
y
15
The results of this study are presented below. First the domestic components aregiven, then the foreign components and finally the totals for DMI, HF and TMR.
4.1 DOMESTIC RESOURCE EXTRACTION
This comprises all direct appropriations of raw materials within the Basque Country, plusthe displaced material that does not enter the economy as an input per se, i.e. thedomestic DMI and domestic HF, which between them make up the domestic TMR.
4.1.1 Domestic Biomass Extraction and Associated Hidden Flows
In 1998 4.81 MT of biotic materials were extracted in the Basque Country. That sameyear the biggest flow of biomass directly entering the economy was that of extractionof agricultural resources. This includes the production of cereals, legumes, tubers forhuman consumption, industrial crops, forage crops (harvested and grazed), vegetables,fresh fruit, nuts, vineyard, olives and other woody plants. In 1998 these categoriesaccounted for 36.88% (1.55 MT) of the total biomass extracted.
Analysis of Results
4 Analysisof Results
Tota
l M
ater
ial
Requ
irem
ent
of t
he B
asqu
e Co
untr
y
16
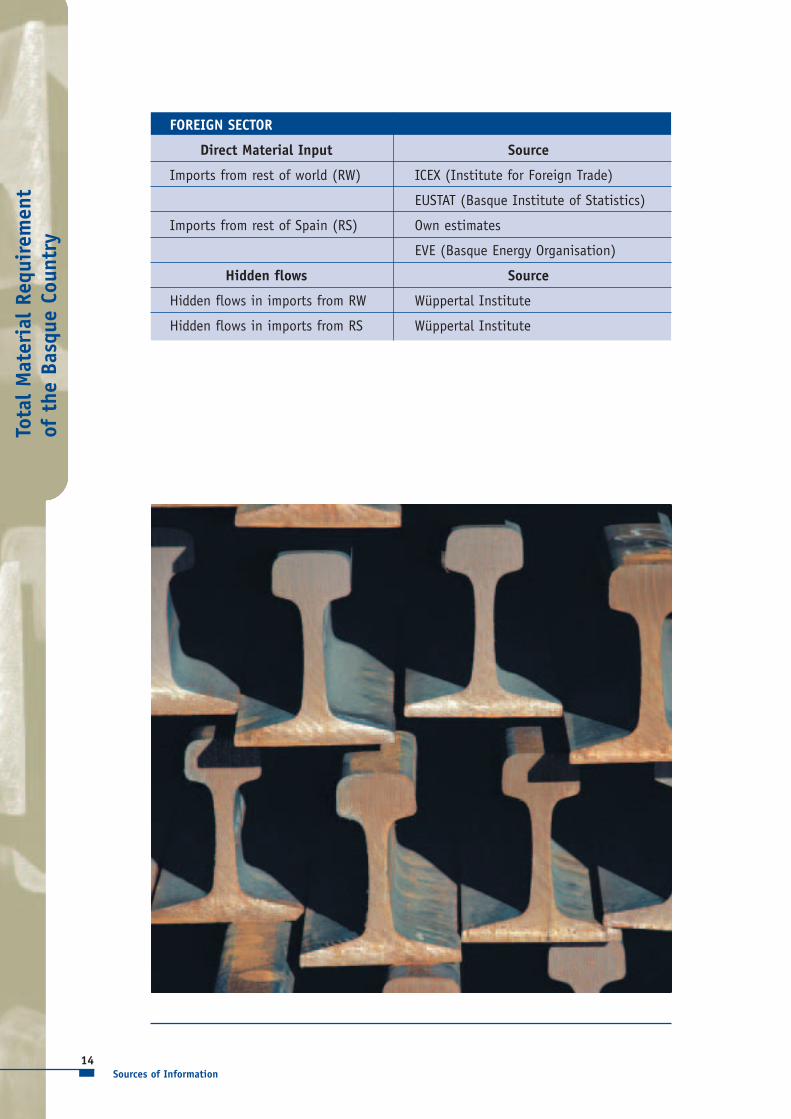
The second biggest input flow in terms of biomass was that of extraction of forestryproducts. Timber accounted for 35.61% (1.5 MT) of the total biotic domestic DMI andother forestry products, comprising mainly the mowing and grazing of natural meadow-land, grazing land, etc. accounted for 25.97% (1.09 MT).
The remaining domestic biomass extraction categories were sea fishing (1.53%), bee-keeping (0.007%), hunting (0.004%) and river fishing (0.001%).
Figure 4 shows the changes in domestic DMI between 1985 and 1998. The steadyincrease caused by the growth of forestry production (timber and other forestry prod-ucts) from 1991 onwards is noteworthy. A comparison of the figures for 1985 and 1998reveals major increases in other forestry products and timber (104.24% and 53.08%respectively). The 13.95% drop in agricultural production is also worthy of mention.Overall, the biotic domestic DMI increased by 24.55% (0.84 MT) between 1985 and1998.
The second component of domestic extraction of biotic material is that of hidden flows,i.e. the materials disturbed as a result of the process to obtain the biotic DMI. Two typesof HF associated with domestic biomass extraction can be distinguished: erosion anddiscards in sea fishing.
Erosion due to the extraction of plant biomass (except for timber) is counted in the TMR.Certain agricultural activities propitiate erosion because cultivated land is more exposedto wind and rain. These erosion processes displace huge amounts of material, reduce thefertility of the soil, increase salt levels in water, propitiate eutrophication and acceler-ate the growth of deltas and estuaries.
Discards are catches thrown back into the sea because they are below authorised or mar-ketable sizes, and catches of species not wanted because they are of little or no eco-nomic value. Discards result in economic losses in terms of future biomass, and upsetthe trophic chain.
Analysis of Results
1985 1986 1987 1988 1989 1990 1991 1992 1993 1994 1995 1996 1997 19980
0,5
1
1,5
2
2,5
3
3,5
4
4,5
Mili
ons
of
tonn
es
Other forestry products Sea fishing
River fishingBee-keeping
TimberAgriculture
Hunting Biotic DMI
Figure 4: Biotic domestic DMI

Araba Bizkaia Gipuzkoa
Land area Ratio Land area Ratio Land area Ratio
Dry farmed herbaceous crops 59,015.6 36.523 8,792.4 14.360 4,590.8 14.360
Dry farmed vines & trees 10,697.9 34.435 453.7 13.419 436.5 13.419
Permanent grazing land 39,681.2 10.336 45,601.5 0.297 42,436.6 0.297
Irrigated crops 6,677.4 4.441 335 0.393 90 0.393
Tota
l M
ater
ial
Requ
irem
ent
of t
he B
asqu
e Co
untr
y
17
In terms of the volume of material displaced, erosion is the more significant of the twofactors. It is estimated that between 1985 and 1998 erosion due to agriculture displaced4.52 MT of soil per annum in the Basque Country, distributed between the threeprovinces or “Historical Territories” as follows: 88.2% in Araba, 7% in Bizkaia and 4.8%in Gipuzkoa (see Figure 5).
Analysis of Results
Araba Gipuzkoa Bizkaia
Millions of tonnes
0.31
0.22
3.98
Figure 5: 1985-1998. Distribution by territories of erosion due to agriculture
The big difference in erosion in the three territories is due to two things: on the onehand the erosion ratios per type of crop in Araba exceed those in Bizkaia and Gipuzkoa,and on the other hand the land area given over to crops liable to erosion (dry-farmedherbaceous crops and vinyards) is much greater in Araba. Table 2 shows the mean dis-tribution of the main areas of agricultural land according to the erosion which theycause.
A comparison of the figures for 1985 and 1998 shows a decrease of 14.62% in the totalmaterial displaced in the Basque Country. This good performance of erosion is a direct
Table 2: 1985-1998. Mean distribution of agricultural land and erosion ratios
Land area given over to agriculture in hectares and erosion ratio in tonnes per hectare per annum

Tota
l M
ater
ial
Requ
irem
ent
of t
he B
asqu
e Co
untr
y
18Analysis of Results
result of the decrease in the amount of land given over to dry farming of herbaceouscrops.
The map in Figure 6 shows the location of the main focal points for erosion. Most ero-sion is located in Llanada Alavesa, Valles Alaveses and in Rioja Alavesa areas, as a resultof the large areas given over to dry farming of herbaceous crops and vineyards there.
4.1.2 Domestic extraction of abiotic material & associated hidden flows
Mining and Overburden
Material originating from the extraction of metals, non metals, energy resources andquarry products is the biggest component in abiotic domestic DMI. In the case of met-als the direct material input is considered to comprise both the ore and the gangue.
Figure 6: 1996. Map showing the location of erosion caused by agriculture
Tonnes per hectare per annum
34.435
14.360
10.336
4.441
0.297
Non agricultural land
36.523
Tota
l M
ater
ial
Requ
irem
ent
of t
he B
asqu
e Co
untr
y
19Analysis of Results
0
2
4
6
8
10
12
14
16
18
20
1985 1986 1987 1988 1989 1990 1991 1992 1993 1994 1995 1996 1997 1998
Mill
ions
of
tonn
es
Limestone Iron ore Loam
Stone Sand Silica & silica sand
Ophite Energy resources Others
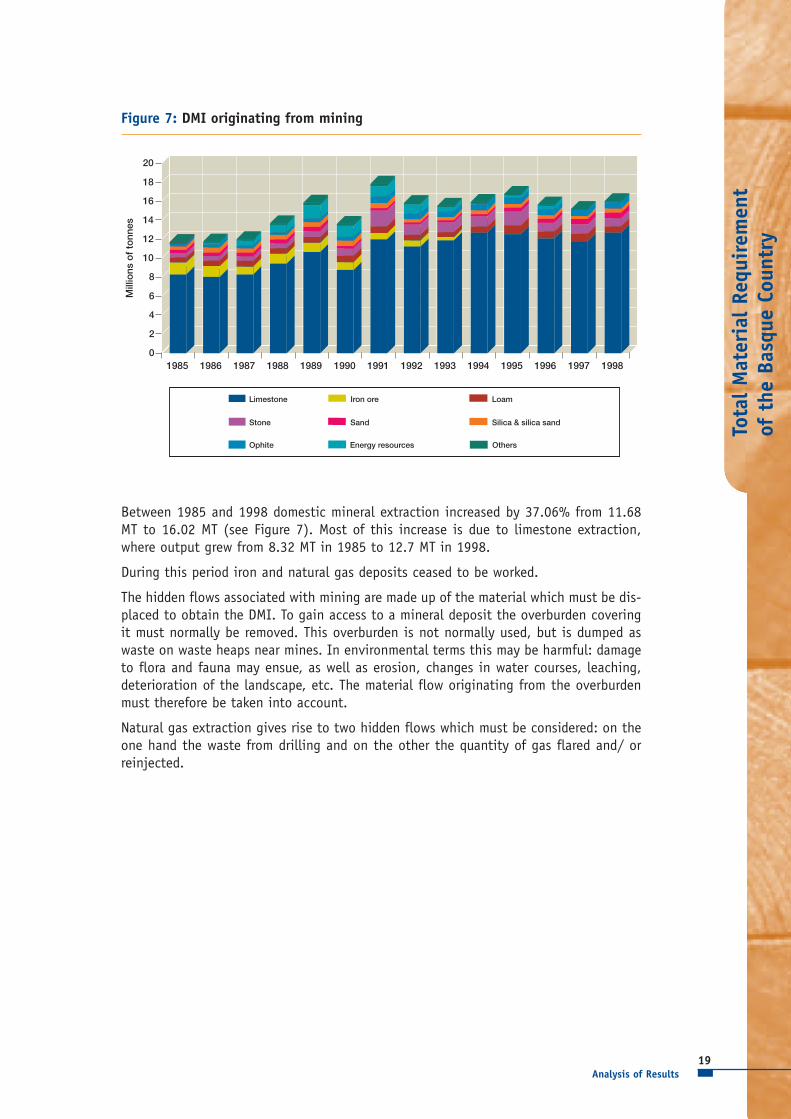
Figure 7: DMI originating from mining
Between 1985 and 1998 domestic mineral extraction increased by 37.06% from 11.68MT to 16.02 MT (see Figure 7). Most of this increase is due to limestone extraction,where output grew from 8.32 MT in 1985 to 12.7 MT in 1998.
During this period iron and natural gas deposits ceased to be worked.
The hidden flows associated with mining are made up of the material which must be dis-placed to obtain the DMI. To gain access to a mineral deposit the overburden coveringit must normally be removed. This overburden is not normally used, but is dumped aswaste on waste heaps near mines. In environmental terms this may be harmful: damageto flora and fauna may ensue, as well as erosion, changes in water courses, leaching,deterioration of the landscape, etc. The material flow originating from the overburdenmust therefore be taken into account.
Natural gas extraction gives rise to two hidden flows which must be considered: on theone hand the waste from drilling and on the other the quantity of gas flared and/ orreinjected.
Tota
l M
ater
ial
Requ
irem
ent
of t
he B
asqu
e Co
untr
y
20
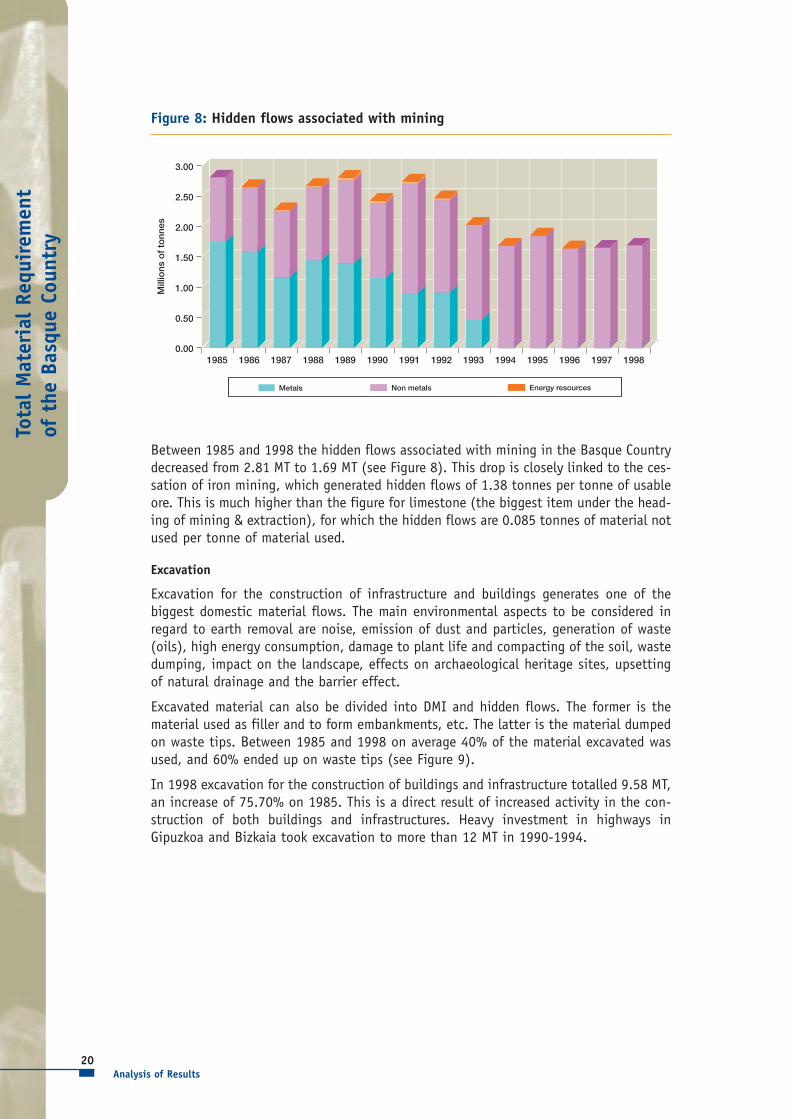
Between 1985 and 1998 the hidden flows associated with mining in the Basque Countrydecreased from 2.81 MT to 1.69 MT (see Figure 8). This drop is closely linked to the ces-sation of iron mining, which generated hidden flows of 1.38 tonnes per tonne of usableore. This is much higher than the figure for limestone (the biggest item under the head-ing of mining & extraction), for which the hidden flows are 0.085 tonnes of material notused per tonne of material used.
Excavation
Excavation for the construction of infrastructure and buildings generates one of thebiggest domestic material flows. The main environmental aspects to be considered inregard to earth removal are noise, emission of dust and particles, generation of waste(oils), high energy consumption, damage to plant life and compacting of the soil, wastedumping, impact on the landscape, effects on archaeological heritage sites, upsettingof natural drainage and the barrier effect.
Excavated material can also be divided into DMI and hidden flows. The former is thematerial used as filler and to form embankments, etc. The latter is the material dumpedon waste tips. Between 1985 and 1998 on average 40% of the material excavated wasused, and 60% ended up on waste tips (see Figure 9).
In 1998 excavation for the construction of buildings and infrastructure totalled 9.58 MT,an increase of 75.70% on 1985. This is a direct result of increased activity in the con-struction of both buildings and infrastructures. Heavy investment in highways inGipuzkoa and Bizkaia took excavation to more than 12 MT in 1990-1994.
Analysis of Results
1985 1986 1987 1988 1989 1990 1991 1992 1993 1994 1995 1996 1997 19980.00
0.50
1.00
1.50
2.00
2.50
3.00M
illio
ns o
f to
nnes
Energy resourcesNon metalsMetals
Figure 8: Hidden flows associated with mining

Tota
l M
ater
ial
Requ
irem
ent
of t
he B
asqu
e Co
untr
y
21
Dredging
Dredging generates a material flow which is not strictly connected to the extraction ofresources, but which is necessary for the construction of maritime transport infrastruc-tures and for the maintenance of water depth in ports and river courses. The mainsources of this flow are the dredging operations at the ports of Bilbao and Pasajes.Dredged material is usually considered as a hidden flow, as it normally remains outsidethe economy.
Dredging has negative effects on the marine environment in that it releases contami-nants, has a negative impact on trophic chains (especially in the marine benthos),increases salinity in river courses, etc.
Figure 10 shows how the volume of material displaced in dredging operations changedfrom 1985 to 1998. Between 1985 and 1993 the figure was over 1 MT per annum, butfrom 1994 onwards it dropped to less than half that amount. This is because consider-able extension work was carried out at the port of Bilbao between 1985 and 1993 whichrequired the dredging of huge amounts of material (construction of the Punta Lucerobreakwater and several quays and jetties).
Analysis of Results
1985 1986 1987 1988 1989 1990 1991 1992 1993 1994 1995 1996 1997 19980
2
4
6
8
10
12
14
16
18
Mill
ions
of
tonn
es
Hidden flows DMI
Figure 9: Excavation
1985 1986 1987 1988 1989 1990 1991 1992 1993 1994 1995 1996 1997 1998
Port of Bilbao Port of Pasajes
Mill
ions
of
tonn
es
0.0
0.2
0.4
0.6
0.8
1.0
1.2
1.4
1.6
Figure 10: Dredging

Tota
l M
ater
ial
Requ
irem
ent
of t
he B
asqu
e Co
untr
y
22
4.1.3 Domestic Total Material Requirement
In 1998 the domestic TMR was 17.20 tonnes per head of population. Domesticresource extraction was up by 21.05% from 29.91 MT in 1985 to 36.21 MT in 1998.The TMR rose sharply between 1989 and 1994 due to an increase in abiotic materialextraction, mainly in excavation (see Figure 11).
Analysis of Results
Mill
ions
of
tonn
es
1985 1986 1987 1988 1989 1990 1991 1992 1993 1994 1995 1996 1997 19980
5
10
15
20
25
30
35
40
45
DMI HF
Figure 11: Domestic DMI & HF
Mill
ions
of
tonn
es
1985 1986 1987 1988 1989 1990 1991 1992 1993 1994 1995 1996 1997 19980
5
10
15
20
25
30
35
40
45
Erosion HF excavation HF mining
DMI excavation Dredging Discards Energy resources
Biomass
Metals
Non metals
Figure 12: Domestic TMR
Tota
l M
ater
ial
Requ
irem
ent
of t
he B
asqu
e Co
untr
y
23
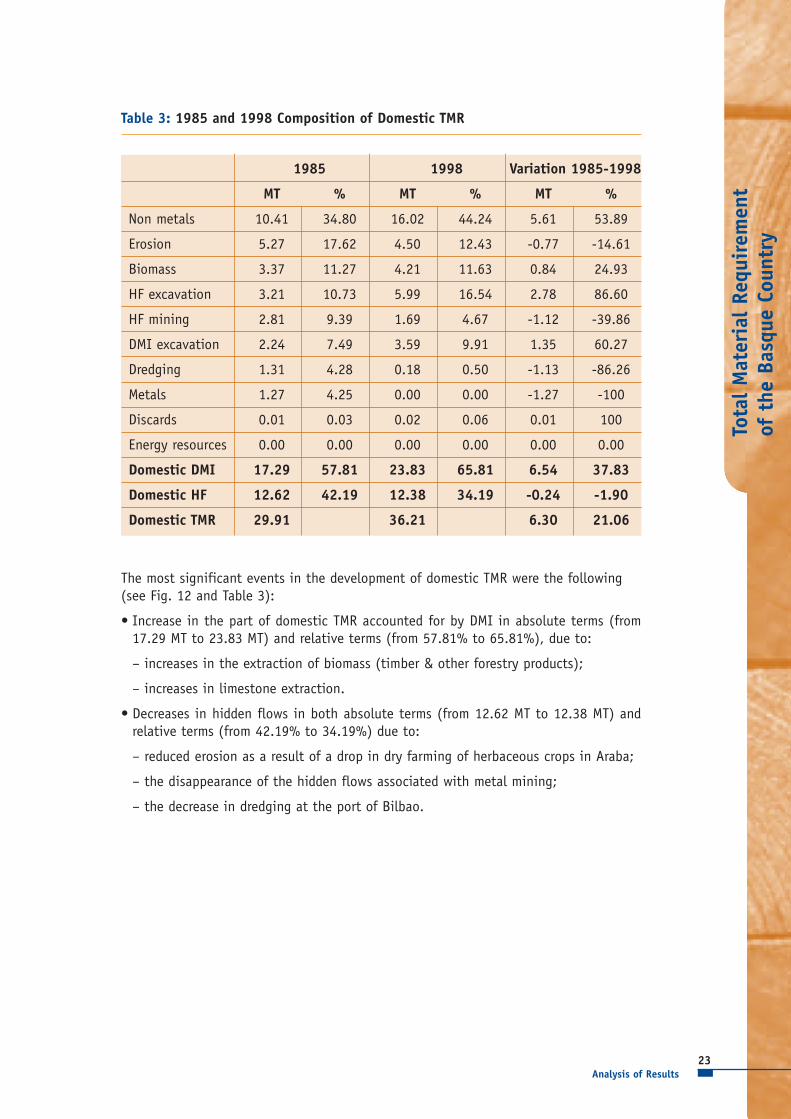
The most significant events in the development of domestic TMR were the following(see Fig. 12 and Table 3):
• Increase in the part of domestic TMR accounted for by DMI in absolute terms (from17.29 MT to 23.83 MT) and relative terms (from 57.81% to 65.81%), due to:
– increases in the extraction of biomass (timber & other forestry products);
– increases in limestone extraction.
• Decreases in hidden flows in both absolute terms (from 12.62 MT to 12.38 MT) andrelative terms (from 42.19% to 34.19%) due to:
– reduced erosion as a result of a drop in dry farming of herbaceous crops in Araba;
– the disappearance of the hidden flows associated with metal mining;
– the decrease in dredging at the port of Bilbao.
Analysis of Results
1985 1998 Variation 1985-1998
MT % MT % MT %
Non metals 10.41 34.80 16.02 44.24 5.61 53.89
Erosion 5.27 17.62 4.50 12.43 -0.77 -14.61
Biomass 3.37 11.27 4.21 11.63 0.84 24.93
HF excavation 3.21 10.73 5.99 16.54 2.78 86.60
HF mining 2.81 9.39 1.69 4.67 -1.12 -39.86
DMI excavation 2.24 7.49 3.59 9.91 1.35 60.27
Dredging 1.31 4.28 0.18 0.50 -1.13 -86.26
Metals 1.27 4.25 0.00 0.00 -1.27 -100
Discards 0.01 0.03 0.02 0.06 0.01 100
Energy resources 0.00 0.00 0.00 0.00 0.00 0.00
Domestic DMI 17.29 57.81 23.83 65.81 6.54 37.83
Domestic HF 12.62 42.19 12.38 34.19 -0.24 -1.90
Domestic TMR 29.91 36.21 6.30 21.06
Table 3: 1985 and 1998 Composition of Domestic TMR
Tota
l M
ater
ial
Requ
irem
ent
of t
he B
asqu
e Co
untr
y
24
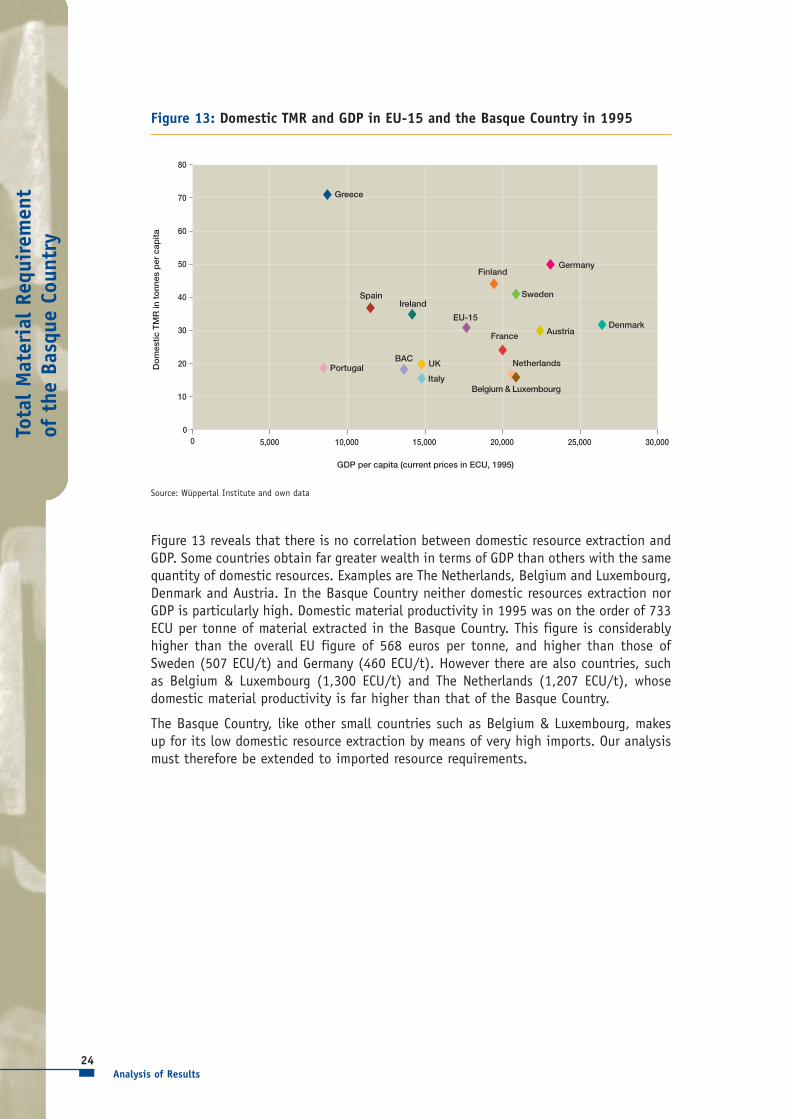
Figure 13 reveals that there is no correlation between domestic resource extraction andGDP. Some countries obtain far greater wealth in terms of GDP than others with the samequantity of domestic resources. Examples are The Netherlands, Belgium and Luxembourg,Denmark and Austria. In the Basque Country neither domestic resources extraction norGDP is particularly high. Domestic material productivity in 1995 was on the order of 733ECU per tonne of material extracted in the Basque Country. This figure is considerablyhigher than the overall EU figure of 568 euros per tonne, and higher than those ofSweden (507 ECU/t) and Germany (460 ECU/t). However there are also countries, suchas Belgium & Luxembourg (1,300 ECU/t) and The Netherlands (1,207 ECU/t), whosedomestic material productivity is far higher than that of the Basque Country.
The Basque Country, like other small countries such as Belgium & Luxembourg, makesup for its low domestic resource extraction by means of very high imports. Our analysismust therefore be extended to imported resource requirements.
Analysis of Results
Do
mes
tic T
MR
in t
onn
es p
er c
apita
GDP per capita (current prices in ECU, 1995)
0
10
20
30
40
50
60
70
80
0 5,000 10,000 15,000 20,000 25,000 30,000
Greece
SpainIreland
EU-15
FinlandGermany
Sweden
DenmarkAustriaFrance
Netherlands
Belgium & Luxembourg
UK
ItalyPortugal
BAC
Figure 13: Domestic TMR and GDP in EU-15 and the Basque Country in 1995
Source: Wüppertal Institute and own data

Tota
l M
ater
ial
Requ
irem
ent
of t
he B
asqu
e Co
untr
y
25
4.2 FOREIGN RESOURCE REQUIREMENTS
These include materials imported by the Basque Country from the rest of the world andfrom the rest of Spain to meet its material requirements, plus the hidden flows associ-ated with those imports.
4.2.1 Foreign DMI
Foreign DMI totalled 15.12 tonnes per capita in 1998, up 0.63 tonnes per capita(4.33%) on 1989. In absolute terms foreign DMI increased over this period by 1.16 MT(3.8%). This difference in DMI growth rates is due to the fact that the population of theBasque Country was smaller in 1998. Materials classed as biomass, metal minerals, nonmetal minerals and “others” increased. The only decrease was in fossil fuels (see Figure14).
The main component of imported used material flows is fossil fuels. Although importsof these fuels decreased by 18.72% from 1989, in 1998 they still accounted for 34.4%of total imports (10.95 MT of a total of 31.81 MT). Within fossil fuels the biggestimports were crude oils and petroleum oils.
The large amount of fossil fuels imported is linked closely to the petrochemical indus-try and to the energy dependency of the Basque Country. In the period under study achange in the production structure of the metal industry in the Basque Country isreflected in the drop in coal imports (from 1.57 MT in 1989 to 0.30 MT in 1998). Froman environmental viewpoint the decrease in the fossil fuel flow is significant, as thesefuels are one of the main causes of global warming and acid rain.
The second biggest imported material flow is that of metal minerals at 29.39%. This fig-ure rose in absolute terms from 8.45 MT in 1989 to 9.35 MT in 1998, though the typeof material imported changed towards more highly processed materials: there were
Analysis of Results
1989 1990 1991 1992 1993 1994 1995 1996 1997 19980
5
10
15
20
25
30
35
40
Metal minerals Biomass
Others Non metal minerals Foreign DMI
Fossil fuels
Mill
ions
of
tonn
esFigure 14: DMI from imports
Tota
l M
ater
ial
Requ
irem
ent
of t
he B
asqu
e Co
untr
y
26
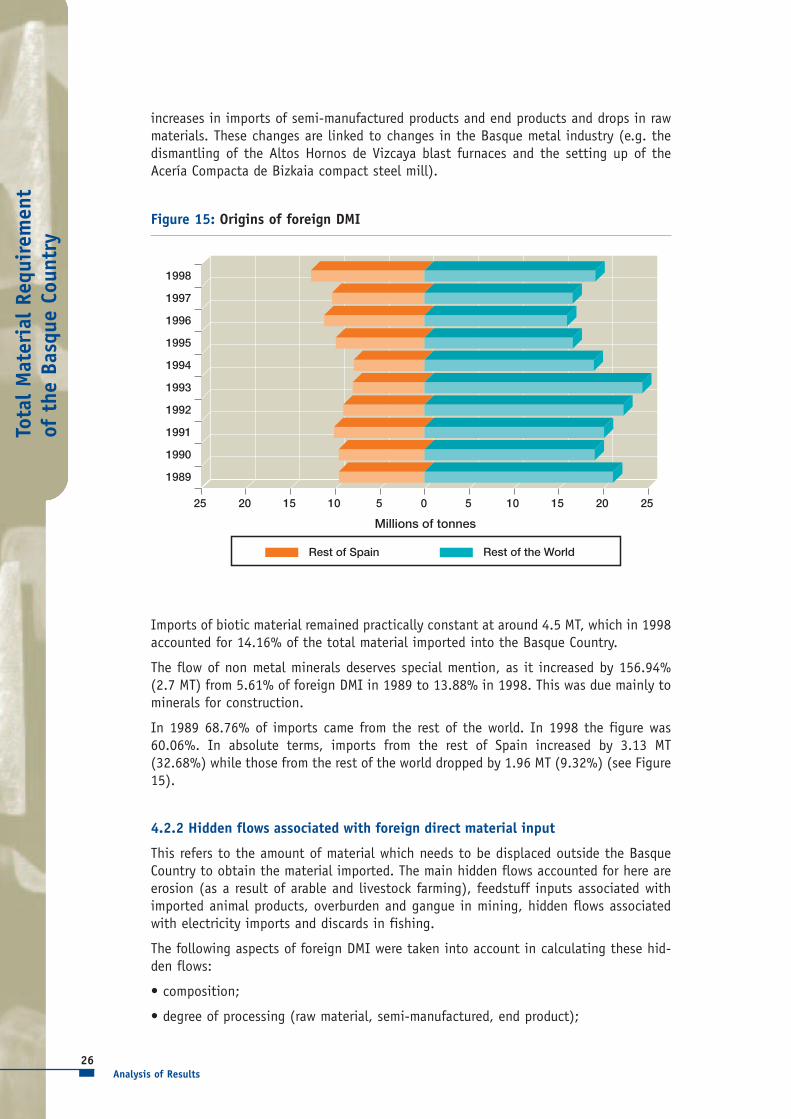
increases in imports of semi-manufactured products and end products and drops in rawmaterials. These changes are linked to changes in the Basque metal industry (e.g. thedismantling of the Altos Hornos de Vizcaya blast furnaces and the setting up of theAcería Compacta de Bizkaia compact steel mill).
Analysis of Results
Millions of tonnes
1989
1990
1991
1992
1993
1994
1995
1996
1997
1998
25 20 15 10 5 0 5 10 15 20 25
Rest of Spain Rest of the World
Figure 15: Origins of foreign DMI
Imports of biotic material remained practically constant at around 4.5 MT, which in 1998accounted for 14.16% of the total material imported into the Basque Country.
The flow of non metal minerals deserves special mention, as it increased by 156.94%(2.7 MT) from 5.61% of foreign DMI in 1989 to 13.88% in 1998. This was due mainly tominerals for construction.
In 1989 68.76% of imports came from the rest of the world. In 1998 the figure was60.06%. In absolute terms, imports from the rest of Spain increased by 3.13 MT(32.68%) while those from the rest of the world dropped by 1.96 MT (9.32%) (see Figure15).
4.2.2 Hidden flows associated with foreign direct material input
This refers to the amount of material which needs to be displaced outside the BasqueCountry to obtain the material imported. The main hidden flows accounted for here areerosion (as a result of arable and livestock farming), feedstuff inputs associated withimported animal products, overburden and gangue in mining, hidden flows associatedwith electricity imports and discards in fishing.
The following aspects of foreign DMI were taken into account in calculating these hid-den flows:
• composition;
• degree of processing (raw material, semi-manufactured, end product);
Tota
l M
ater
ial
Requ
irem
ent
of t
he B
asqu
e Co
untr
y
27
• geographical origin of imports;
• year of importation.
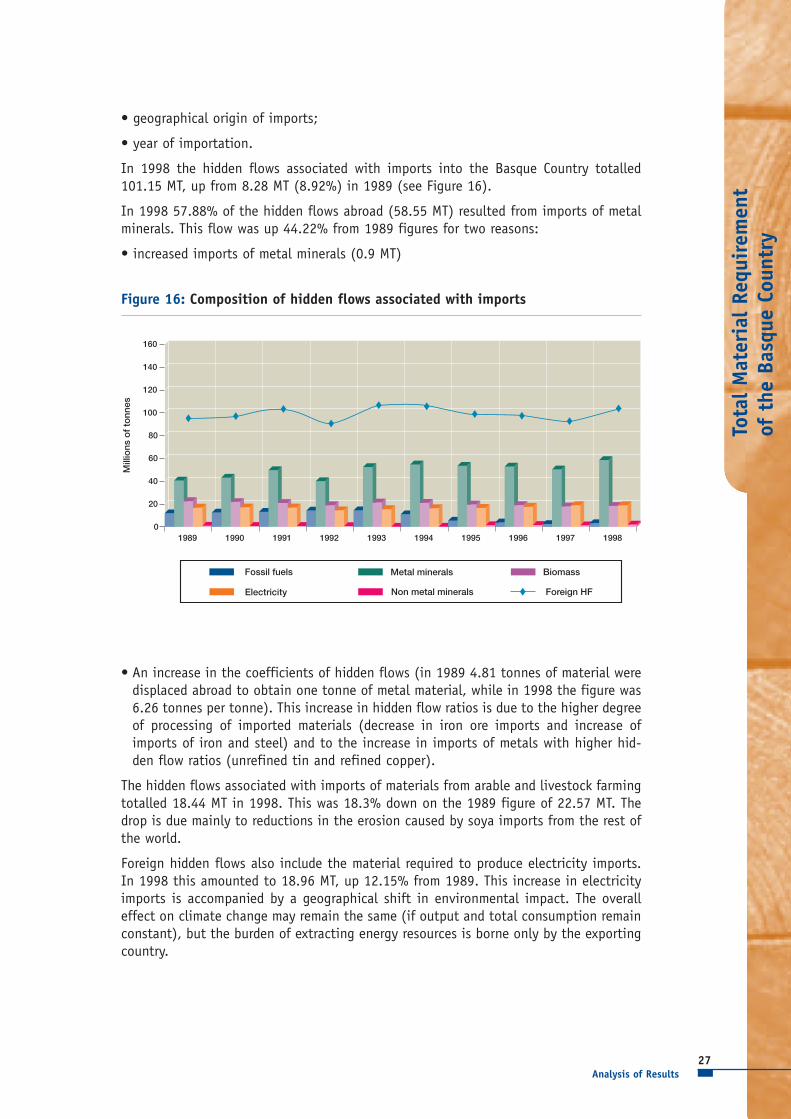
In 1998 the hidden flows associated with imports into the Basque Country totalled101.15 MT, up from 8.28 MT (8.92%) in 1989 (see Figure 16).
In 1998 57.88% of the hidden flows abroad (58.55 MT) resulted from imports of metalminerals. This flow was up 44.22% from 1989 figures for two reasons:
• increased imports of metal minerals (0.9 MT)
Analysis of Results
Mill
ions
of
tonn
es
1989 1990 1991 1992 1993 1994 1995 1996 1997 19980
20
40
60
80
100
120
140
160
Fossil fuels Metal minerals Biomass
Electricity Non metal minerals Foreign HF
Figure 16: Composition of hidden flows associated with imports
• An increase in the coefficients of hidden flows (in 1989 4.81 tonnes of material weredisplaced abroad to obtain one tonne of metal material, while in 1998 the figure was6.26 tonnes per tonne). This increase in hidden flow ratios is due to the higher degreeof processing of imported materials (decrease in iron ore imports and increase ofimports of iron and steel) and to the increase in imports of metals with higher hid-den flow ratios (unrefined tin and refined copper).
The hidden flows associated with imports of materials from arable and livestock farmingtotalled 18.44 MT in 1998. This was 18.3% down on the 1989 figure of 22.57 MT. Thedrop is due mainly to reductions in the erosion caused by soya imports from the rest ofthe world.
Foreign hidden flows also include the material required to produce electricity imports.In 1998 this amounted to 18.96 MT, up 12.15% from 1989. This increase in electricityimports is accompanied by a geographical shift in environmental impact. The overalleffect on climate change may remain the same (if output and total consumption remainconstant), but the burden of extracting energy resources is borne only by the exportingcountry.
Tota
l M
ater
ial
Requ
irem
ent
of t
he B
asqu
e Co
untr
y
28
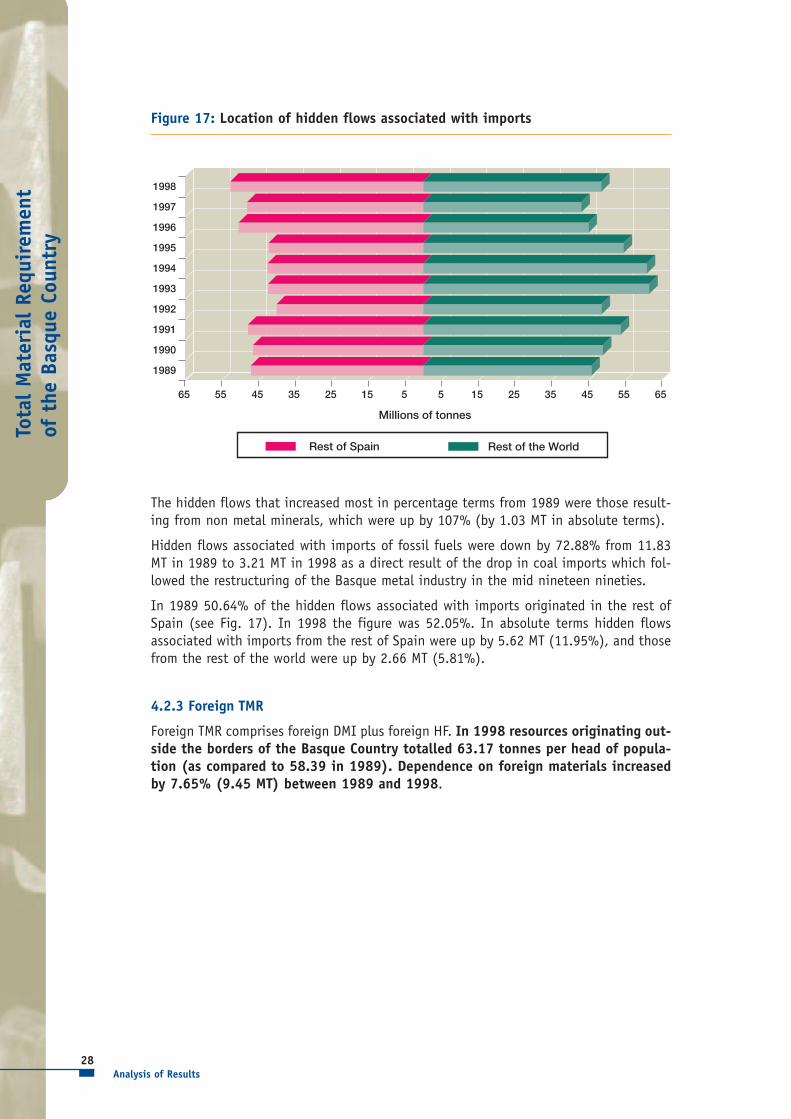
The hidden flows that increased most in percentage terms from 1989 were those result-ing from non metal minerals, which were up by 107% (by 1.03 MT in absolute terms).
Hidden flows associated with imports of fossil fuels were down by 72.88% from 11.83MT in 1989 to 3.21 MT in 1998 as a direct result of the drop in coal imports which fol-lowed the restructuring of the Basque metal industry in the mid nineteen nineties.
In 1989 50.64% of the hidden flows associated with imports originated in the rest ofSpain (see Fig. 17). In 1998 the figure was 52.05%. In absolute terms hidden flowsassociated with imports from the rest of Spain were up by 5.62 MT (11.95%), and thosefrom the rest of the world were up by 2.66 MT (5.81%).
4.2.3 Foreign TMR
Foreign TMR comprises foreign DMI plus foreign HF. In 1998 resources originating out-side the borders of the Basque Country totalled 63.17 tonnes per head of popula-tion (as compared to 58.39 in 1989). Dependence on foreign materials increasedby 7.65% (9.45 MT) between 1989 and 1998.
Analysis of Results
Millions of tonnes
1989
1990
1991
1992
1993
1994
1995
1996
1997
1998
65 55 45 35 25 15 5 5 15 25 35 45 55 65
Rest of Spain Rest of the World
Figure 17: Location of hidden flows associated with imports

Tota
l M
ater
ial
Requ
irem
ent
of t
he B
asqu
e Co
untr
y
29
In 1998 hidden flows accounted for 76.07% of foreign TMR, and DMI for 23.93%, ascompared to 75.19% and 24.81% in 1989. This implies that for each tonne of materialimported into the Basque Country from the rest of the world or the rest of Spain in 19983.18 tonnes of material were displaced (as compared to 3.03 in 1989) (See Fig. 18 andTable 4).
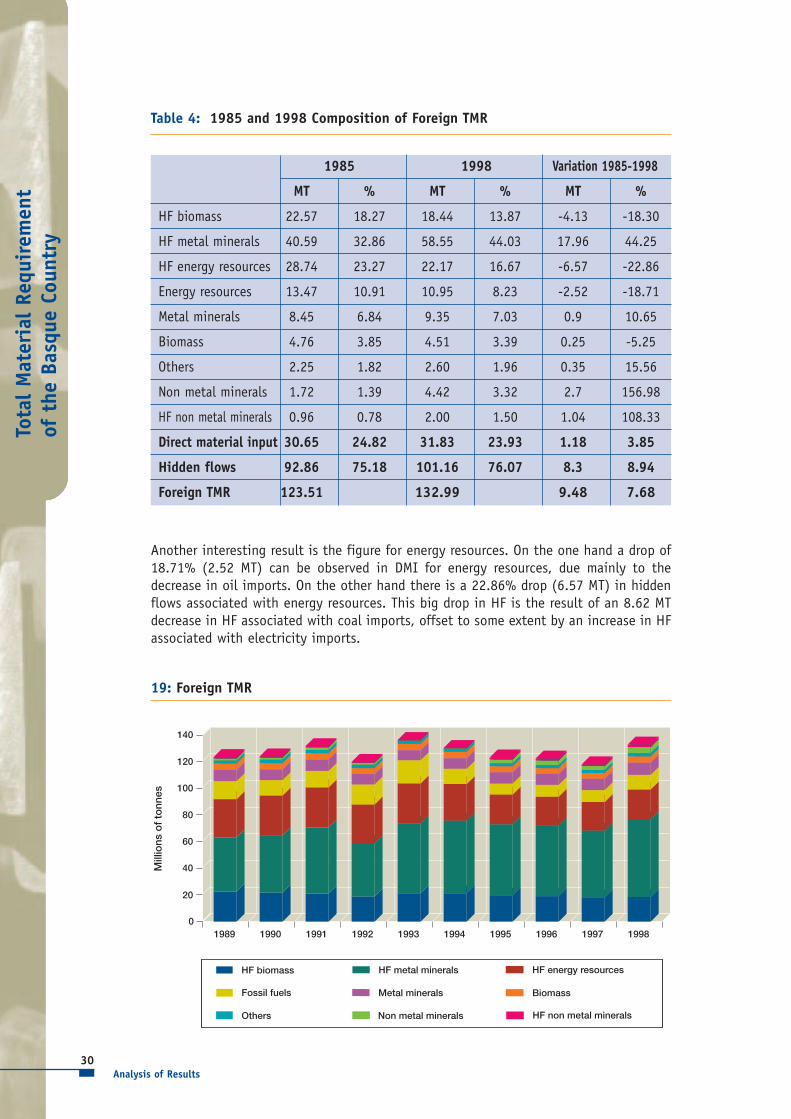
The most significant aspect of the changes in foreign TMR is the increase in bothabsolute (17.96 MT) and relative (44.25%) terms of the hidden flows associated withmetal mineral imports (Fig. 19). This is the result of a combination of three circum-stances:
• increased metal material imports;
• imports of more highly processed materials: one tonne of iron ore has an associatedHF of 2.11 tonnes, while for one tonne of unrefined iron or scrap the figure is 3.66tonnes;
• increased imports of unrefined tin and refined copper, which have HF’s of 6,791.26and 300.6 tonnes per tonne respectively.
Analysis of Results
Mill
ions
of
tonn
es
1989 1990 1991 1992 1993 1994 1995 1996 1997 19980
20
40
60
80
100
120
140
DMI Hidden flows
Figure 18: Foreign DMI and hidden flows
1985 1998 Variation 1985-1998
MT % MT % MT %
HF biomass 22.57 18.27 18.44 13.87 -4.13 -18.30
HF metal minerals 40.59 32.86 58.55 44.03 17.96 44.25
HF energy resources 28.74 23.27 22.17 16.67 -6.57 -22.86
Energy resources 13.47 10.91 10.95 8.23 -2.52 -18.71
Metal minerals 8.45 6.84 9.35 7.03 0.9 10.65
Biomass 4.76 3.85 4.51 3.39 0.25 -5.25
Others 2.25 1.82 2.60 1.96 0.35 15.56
Non metal minerals 1.72 1.39 4.42 3.32 2.7 156.98
HF non metal minerals 0.96 0.78 2.00 1.50 1.04 108.33
Direct material input 30.65 24.82 31.83 23.93 1.18 3.85
Hidden flows 92.86 75.18 101.16 76.07 8.3 8.94
Foreign TMR 123.51 132.99 9.48 7.68
Tota
l M
ater
ial
Requ
irem
ent
of t
he B
asqu
e Co
untr
y
30
Another interesting result is the figure for energy resources. On the one hand a drop of18.71% (2.52 MT) can be observed in DMI for energy resources, due mainly to thedecrease in oil imports. On the other hand there is a 22.86% drop (6.57 MT) in hiddenflows associated with energy resources. This big drop in HF is the result of an 8.62 MTdecrease in HF associated with coal imports, offset to some extent by an increase in HFassociated with electricity imports.
Analysis of Results
Table 4: 1985 and 1998 Composition of Foreign TMR
Mill
ions
of
tonn
es
1989 1990 1991 1992 1993 1994 1995 1996 1997 19980
40
60
80
100
120
140
HF biomass HF metal minerals HF energy resources
Fossil fuels Metal minerals Biomass
Others Non metal minerals HF non metal minerals
20
19: Foreign TMR

Tota
l M
ater
ial
Requ
irem
ent
of t
he B
asqu
e Co
untr
y
31
4.3 TOTAL MATERIAL REQUIREMENT OF THE BASQUE COUNTRY
Now that the domestic and foreign components of the TMR have been calculated, we arein a position to work out the total DMI, HF and TMR of the Basque Country.
4.3.1 Direct material input of the Basque Country
The DMI is the component of the TMR that covers the materials used for processing inan economy. It comprises the domestic DMI and the foreign DMI (physical flow of mate-rial imports).
Most of the DMI of the Basque Country originates from imports. In 1989 the figurewas 57.82, and in 1998 it had dropped slightly to 57.18%. The Basque Country is there-fore highly dependent on foreign resources. This contrasts with the situation in the USA,the EU, Germany and Japan, where foreign resources account for 11, 20, 23 and 33%respectively. The Netherlands is also fairly dependent on foreign resources, having a for-eign DMI of 53%. The conclusion may be drawn that a country’s dependence on foreignDMI is correlated with its size: smaller countries tend to import more materials to off-set their lack of primary output.
Four periods can be distinguished in the development of the DMI of the Basque Country:
• 1989-1990: DMI dropped by 2.42 MT (4.56%) as a result of reductions in imports offossil fuels and metal minerals from the rest of the world and lower domestic extrac-tion of limestone.
• 1990-1993: DMI grew steadily, bringing 7.06 MT (13.95%) more material into theeconomy, as a result of three factors: steady growth in fossil fuel imports from the restof the world, increased domestic limestone extraction and increases in DMI from exca-vation for construction.
• 1993-1997: DMI dropped by 8.5 MT due to a fall in fossil fuel imports from the rest ofthe world and in materials from excavation.
• 1997-1998: DMI increased again, rising by 6.49 MT (13.21%) in this short period asa result of increased fossil fuel imports from the rest of the world, increased non metalmineral imports from the rest of Spain and higher domestic limestone extraction.
In quantitative terms the component of DMI which fluctuated most was fossil fuels,comprising crude oil and petroleum oils imported to meet the energy requirements ofthe Basque Country, and especially the needs of its petrochemical industry. The conclu-sion can be drawn that the main cause of fluctuation in the DMI of the BasqueCountry lies in oil imports from the rest of the world.
The DMI of the Basque Country decreased in absolute terms by 7.28% between1989 and 1997. The decrease in the EU between 1988 and 1997 was 5%. In percapita terms the drop was 6.81% (as compared to 8% in the EU) from 25.06 to 23.35tonnes (EU: 21.2 to 19.5 tonnes). A trend towards dematerialisation can be seen inDMI between 1993 and 1997, following an increase of 7.06 MT between 1990 and1993. A look at the data for 1998 seems to indicate that this trend was reversed: DMIincreased that year by 13.21% on 1997 figures (see Fig. 20). This was due to:
Analysis of Results

Tota
l M
ater
ial
Requ
irem
ent
of t
he B
asqu
e Co
untr
y
32
• an increase of 2.55 million tonnes in imports from the rest of the world;
• an increase of 2.35 million tonnes in imports from the rest of Spain;
• an increase of 1.59 million tonnes in domestic resource extraction.
A comparison of the data for the Basque Country and those for EU member States revealsvarious points worthy of mention (see Table 5):
• Finland, Sweden, Italy, Germany and France have achieved slight reductions in theirDMI (between 1 and 3%)
• There is a second group of countries where DMI has increased by more than the EUaverage, comprising Ireland (36%), Belgium/ Luxembourg (24%), Greece (19%),Denmark (17%) and Spain (12%).
• The Basque Country has reduced its DMI by 6.81%, a considerably higher figure thanin the member States of the EU.
• In per capita terms Finland, Ireland, Sweden, Belgium/ Luxembourg, Denmark and TheNetherlands had DMI’s higher than the EU average in 1997. The remaining countries,including the Basque Country, were below the EU average.
Analysis of Results
Millions of tonnes
1989
1990
1991
1992
1993
1994
1995
1996
1997
1998
60 50 40 30 20 10 0 10 20 30 40 50 60
Per capita DMI Foreign DMI Domestic DMI
Tonnes
Figure 20: Total DMI
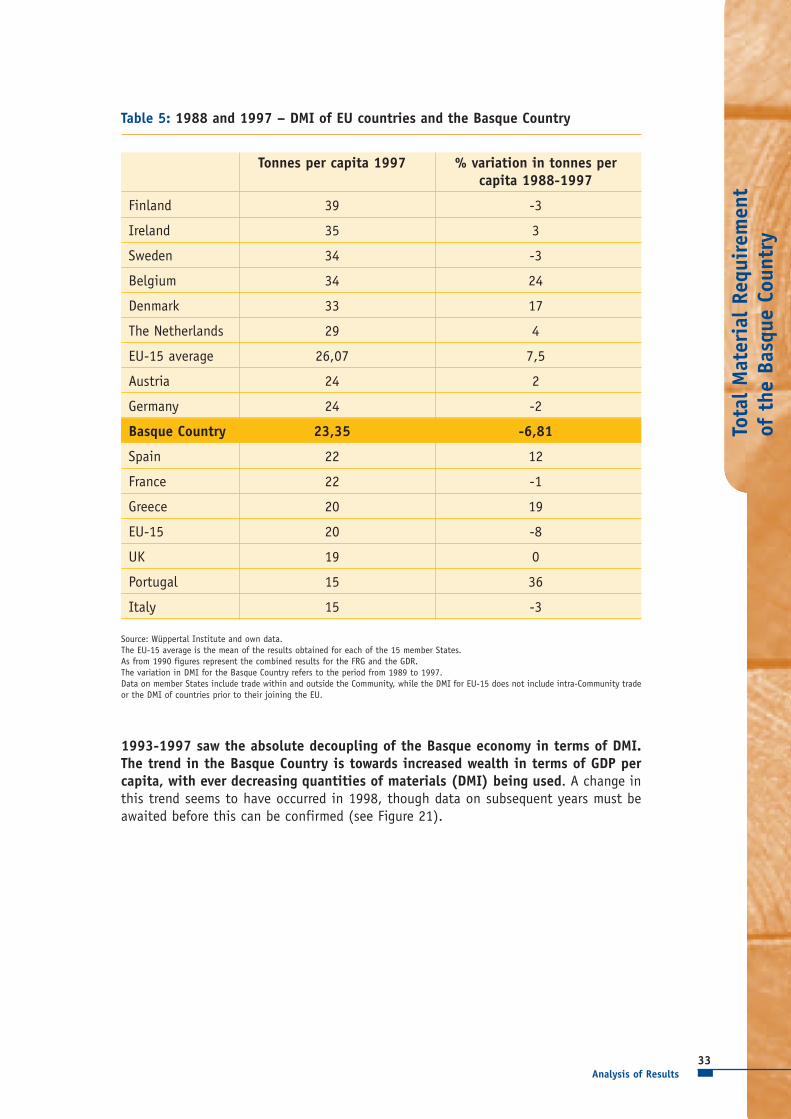
Tonnes per capita 1997 % variation in tonnes percapita 1988-1997
Finland 39 -3
Ireland 35 3
Sweden 34 -3
Belgium 34 24
Denmark 33 17
The Netherlands 29 4
EU-15 average 26,07 7,5
Austria 24 2
Germany 24 -2
Basque Country 23,35 -6,81
Spain 22 12
France 22 -1
Greece 20 19
EU-15 20 -8
UK 19 0
Portugal 15 36
Italy 15 -3
Tota
l M
ater
ial
Requ
irem
ent
of t
he B
asqu
e Co
untr
y
33Analysis of Results
Table 5: 1988 and 1997 – DMI of EU countries and the Basque Country
Source: Wüppertal Institute and own data.The EU-15 average is the mean of the results obtained for each of the 15 member States.As from 1990 figures represent the combined results for the FRG and the GDR.The variation in DMI for the Basque Country refers to the period from 1989 to 1997.Data on member States include trade within and outside the Community, while the DMI for EU-15 does not include intra-Community tradeor the DMI of countries prior to their joining the EU.
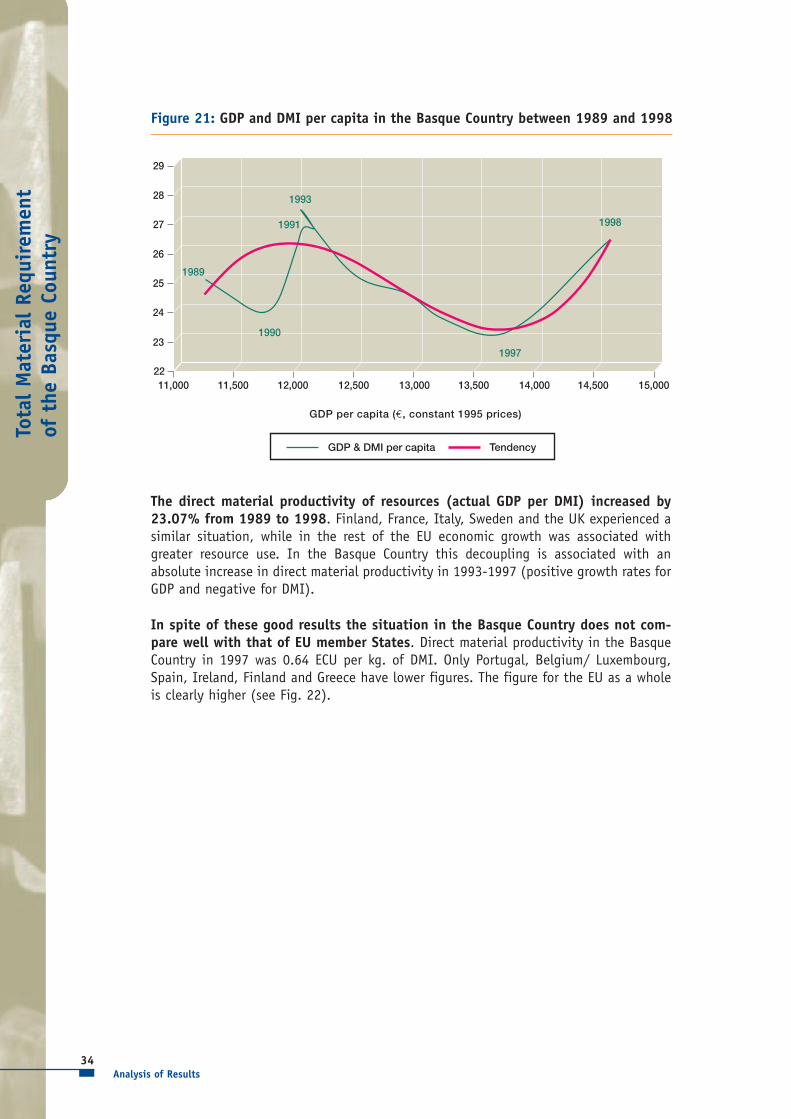
1993-1997 saw the absolute decoupling of the Basque economy in terms of DMI.The trend in the Basque Country is towards increased wealth in terms of GDP percapita, with ever decreasing quantities of materials (DMI) being used. A change inthis trend seems to have occurred in 1998, though data on subsequent years must beawaited before this can be confirmed (see Figure 21).
Tota
l M
ater
ial
Requ
irem
ent
of t
he B
asqu
e Co
untr
y
34
The direct material productivity of resources (actual GDP per DMI) increased by23.07% from 1989 to 1998. Finland, France, Italy, Sweden and the UK experienced asimilar situation, while in the rest of the EU economic growth was associated withgreater resource use. In the Basque Country this decoupling is associated with anabsolute increase in direct material productivity in 1993-1997 (positive growth rates forGDP and negative for DMI).
In spite of these good results the situation in the Basque Country does not com-pare well with that of EU member States. Direct material productivity in the BasqueCountry in 1997 was 0.64 ECU per kg. of DMI. Only Portugal, Belgium/ Luxembourg,Spain, Ireland, Finland and Greece have lower figures. The figure for the EU as a wholeis clearly higher (see Fig. 22).
Analysis of Results
Figure 21: GDP and DMI per capita in the Basque Country between 1989 and 1998
GDP & DMI per capita Tendency
11,000 11,500 12,000 12,500 13,000 13,500 14,000 14,500 15,00022
24
25
26
27
28
29
23
1998
1997
1990
1991
1993
1989
GDP per capita (€, constant 1995 prices)

Tota
l M
ater
ial
Requ
irem
ent
of t
he B
asqu
e Co
untr
y
35
4.3.2 Hidden flows in the Basque Country
Hidden flows (HF) indicate the amount of material which is displaced to obtain the DMIbut which does not enter the economy. In 1998 HF in the Basque Country totalled113.53 MT (53.94 tonnes per capita). 91.12% of these HF’s are from foreign sources,and result from three basic aspects of the Basque economy:
• The importance of the metal industry, the inputs to which are associated with highhidden flows. In 1997 the joint output of the steel making, foundry, forging and drop-forging industries was close to 7 MT. Assuming 100% efficiency in the use of metalinputs, the HF associated with this output would be around 41 MT. If the energy con-sumption of these industries is taken into account the figure for HF increases toaround 7.2 MT.
• High dependency in foodstuffs: this results in high levels of HF as a result of the cropand livestock farming needed to meet import requirements.
• Energy dependency: HF associated with electricity production totalled 18.96 MT in1998.
The trends in hidden flows over time can be broken down as follows:
• 1989-1991. HF increased by 11.54 MT (10.84%) as a result of increased imports ofmetals with high HF coefficients (silver, tin, refined copper and unrefined copper) andof iron and tin ore. There was also an increase in HF associated with coal imports. Thiscoincided with increases in HF associated with excavation for construction of housingand infrastructure.
• 1991-1992. HF fell by 12.33 MT (10.45%) as some components reversed the tenden-cy evidenced in the previous period. There were drops in HF associated with imports
Analysis of Results
EC
U p
er k
g.
0
0,2
0,4
0,6
0,8
1
1,2
1,4
Italy UE-15 Germany Austria
France Denmark The Netherlands Sweden
UK Basque Country Portugal Belgium&Luxembourg
Spain Ireland Finland Greece
Figure 22: Direct material productivity – GDP/ DMI
Source: Wüppertal InstituteGDP in ECU, current prices, 1995
Tota
l M
ater
ial
Requ
irem
ent
of t
he B
asqu
e Co
untr
y
36
from the rest of the world of silver, tin, refined copper and unrefined copper. HF asso-ciated with imports from the rest of Spain of biomass, metal minerals and electricityalso dropped.
• 1992-1993. HF increased by 14.73 MT (13.95%), mainly as a result of HF associatedwith metal imports from the rest of the world (iron and steel, tin, refined copper andunrefined copper). HF associated with imports of biomass and electricity from the restof Spain also rose during this period. From 1992 onwards HF associated with coalimports gradually decreased.
• 1993-1997. HF dropped by 17.37 MT (14.43%). There were decreases in HF associat-ed with imports from the rest of the world of iron ore (offset by the increase in HFassociated with iron and steel imports from the rest of the world and the rest ofSpain), unrefined copper and unprocessed tin. There was a sharp drop in HF associat-ed with coal imports, and HF associated with biomass imports from the rest of Spainalso decreased. Much of this decrease in HF can be explained in terms of the reduc-tion in HF associated with excavation for construction.
• 1997-1998. HF increased by 10.53 MT (10.22%), mainly as a result of increases in HFassociated with imports from the rest of the world of refined copper and unprocessedtin, and with imports of metal minerals from the rest of Spain. HF associated with coalalso increased as a result of operations at the Pasajes power station.
Analysis of Results
Mill
ions
of
tonn
es
1989 1990 1991 1992 1993 1994 1995 1996 1997 19980
20
40
60
80
100
120
140
Domestic HF Foreign HF
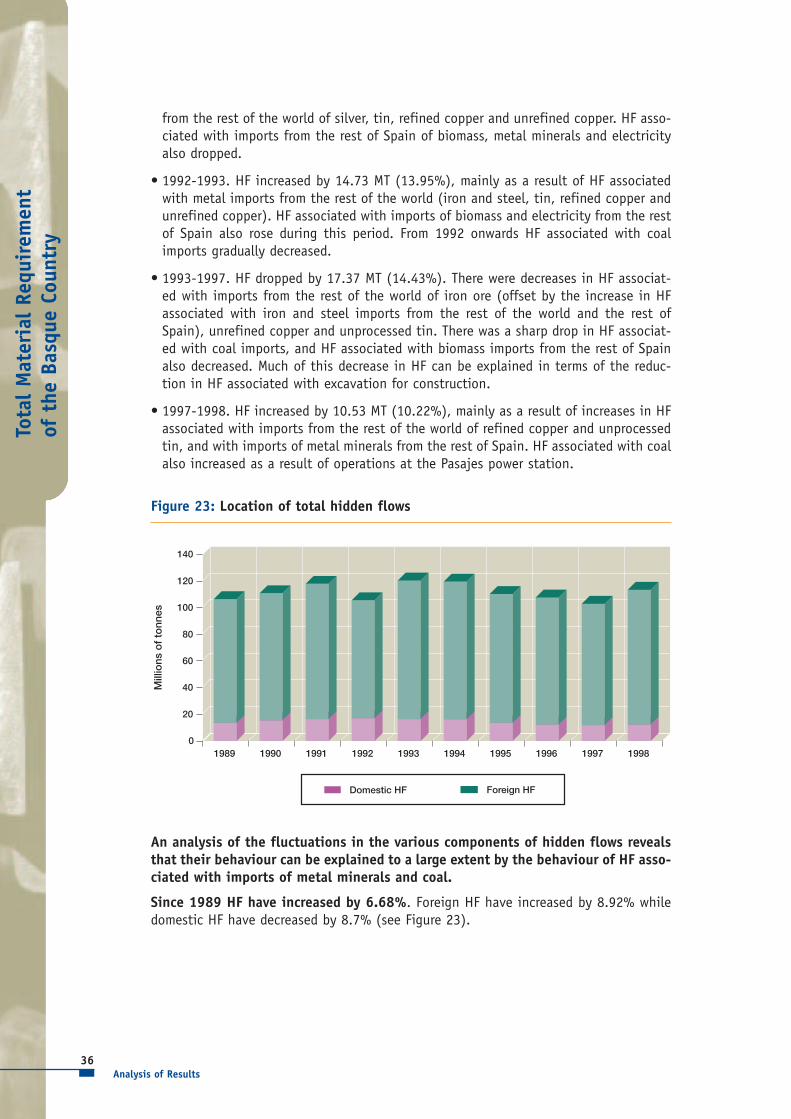
Figure 23: Location of total hidden flows
An analysis of the fluctuations in the various components of hidden flows revealsthat their behaviour can be explained to a large extent by the behaviour of HF asso-ciated with imports of metal minerals and coal.
Since 1989 HF have increased by 6.68%. Foreign HF have increased by 8.92% whiledomestic HF have decreased by 8.7% (see Figure 23).
Tota
l M
ater
ial
Requ
irem
ent
of t
he B
asqu
e Co
untr
y
37
4.3.3 Total Material requirement of the Basque Country
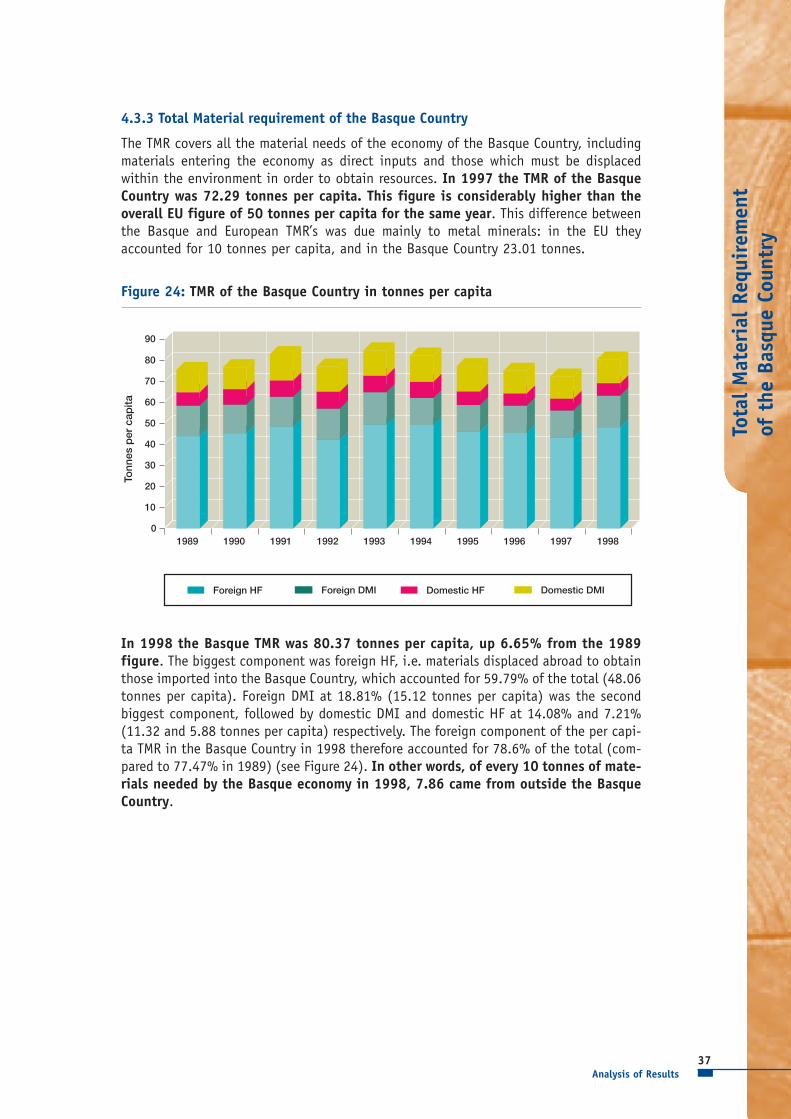
The TMR covers all the material needs of the economy of the Basque Country, includingmaterials entering the economy as direct inputs and those which must be displacedwithin the environment in order to obtain resources. In 1997 the TMR of the BasqueCountry was 72.29 tonnes per capita. This figure is considerably higher than theoverall EU figure of 50 tonnes per capita for the same year. This difference betweenthe Basque and European TMR’s was due mainly to metal minerals: in the EU theyaccounted for 10 tonnes per capita, and in the Basque Country 23.01 tonnes.
Analysis of Results
Tonn
es p
er c
apita
Foreign HF Foreign DMI
1989 1990 1991 1992 1993 1994 1995 1996 1997 19980
10
20
30
40
50
60
70
80
90
Domestic HF Domestic DMI
Figure 24: TMR of the Basque Country in tonnes per capita
In 1998 the Basque TMR was 80.37 tonnes per capita, up 6.65% from the 1989figure. The biggest component was foreign HF, i.e. materials displaced abroad to obtainthose imported into the Basque Country, which accounted for 59.79% of the total (48.06tonnes per capita). Foreign DMI at 18.81% (15.12 tonnes per capita) was the secondbiggest component, followed by domestic DMI and domestic HF at 14.08% and 7.21%(11.32 and 5.88 tonnes per capita) respectively. The foreign component of the per capi-ta TMR in the Basque Country in 1998 therefore accounted for 78.6% of the total (com-pared to 77.47% in 1989) (see Figure 24). In other words, of every 10 tonnes of mate-rials needed by the Basque economy in 1998, 7.86 came from outside the BasqueCountry.
Tota
l M
ater
ial
Requ
irem
ent
of t
he B
asqu
e Co
untr
y
38
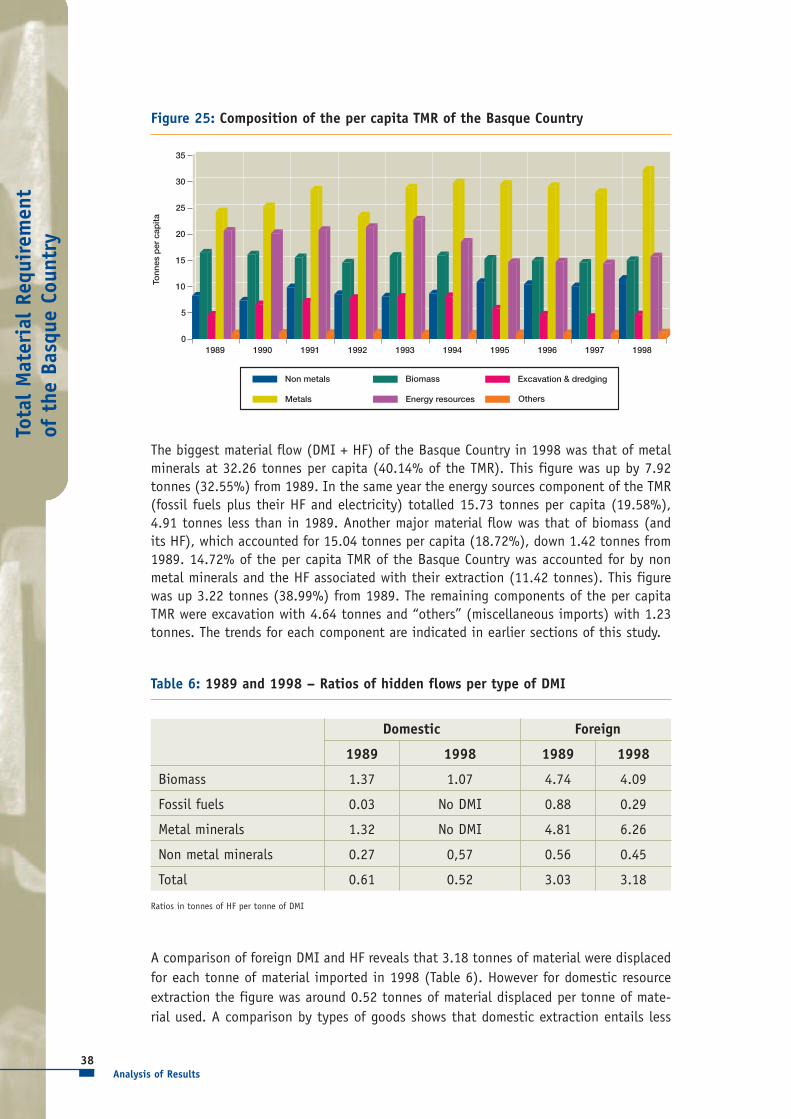
The biggest material flow (DMI + HF) of the Basque Country in 1998 was that of metalminerals at 32.26 tonnes per capita (40.14% of the TMR). This figure was up by 7.92tonnes (32.55%) from 1989. In the same year the energy sources component of the TMR(fossil fuels plus their HF and electricity) totalled 15.73 tonnes per capita (19.58%),4.91 tonnes less than in 1989. Another major material flow was that of biomass (andits HF), which accounted for 15.04 tonnes per capita (18.72%), down 1.42 tonnes from1989. 14.72% of the per capita TMR of the Basque Country was accounted for by nonmetal minerals and the HF associated with their extraction (11.42 tonnes). This figurewas up 3.22 tonnes (38.99%) from 1989. The remaining components of the per capitaTMR were excavation with 4.64 tonnes and “others” (miscellaneous imports) with 1.23tonnes. The trends for each component are indicated in earlier sections of this study.
A comparison of foreign DMI and HF reveals that 3.18 tonnes of material were displacedfor each tonne of material imported in 1998 (Table 6). However for domestic resourceextraction the figure was around 0.52 tonnes of material displaced per tonne of mate-rial used. A comparison by types of goods shows that domestic extraction entails less
Analysis of Results
Tonn
es p
er c
apita
1989 1990 1991 1992 1993 1994 1995 1996 1997 19980
5
10
15
20
25
30
35
Non metals Biomass Excavation & dredging
Metals Energy resources Others
Figure 25: Composition of the per capita TMR of the Basque Country
Domestic Foreign
1989 1998 1989 1998
Biomass 1.37 1.07 4.74 4.09
Fossil fuels 0.03 No DMI 0.88 0.29
Metal minerals 1.32 No DMI 4.81 6.26
Non metal minerals 0.27 0,57 0.56 0.45
Total 0.61 0.52 3.03 3.18
Table 6: 1989 and 1998 – Ratios of hidden flows per type of DMI
Ratios in tonnes of HF per tonne of DMI

Tota
l M
ater
ial
Requ
irem
ent
of t
he B
asqu
e Co
untr
y
39Analysis of Results
HF than foreign extraction (except for non metal minerals in 1998). The reasons are asfollows:
• Imported biomass includes a large percentage of semi-manufactured and end products,which have higher ratios of hidden flows than raw materials (NB: in domestic DMI,only raw material extraction is considered).
• The same applies to metal minerals, but an additional factor also comes into play:metal mineral extraction in the Basque Country was restricted to iron ore, whileimports included other metals with higher hidden flows than iron (especially copperand tin).
• The only sources of fossil fuel extraction in the Basque Country were the Gaviota andAlbatros natural gas deposits (the former exhausted in 1995 and the latter operationalin 1995 and 1996), for which the hidden flows were 0.03 tonnes per tonne. However,imported fossil fuels include coal, which has higher associated HF than natural gas.
• The flow of non metal minerals was greater in the Basque Country in 1998 becauseexcavation for construction (with HF of 0.60 tonnes per tonne) was included underthis category, in which it outweighed other items.
1989 1990 1991 1992 1993 1994 1995 1996 1997 199880
90
100
110
120
130
140
150
160
Ind
ex. 1
989
= 1
00
GDPPopulationHFDMI TMR
Figure 26: Population, GDP, DMI, HF and TMR
• Two circumstances deserve special mention in terms of trends in foreign HF: firstly the39.73% increase in HF associated with imported metal minerals (as a result of shiftsin imports towards materials with higher HF), and secondly the 18.57% drop in HFassociated with fossil fuel imports as a result of decreasing coal imports.
A comparison of the TMR and its components with population data and GDP prompts thefollowing conclusions in regard to the Basque Country (see Fig. 26 and 27):
• The population dropped slightly from 1989, but material requirements increasedas a result of greater hidden flows associated with imports.
• Decoupling of the Basque economy from the environment increased in every yearexcept 1991, 1993 and 1998, with the actual GDP growing at higher rates than theTMR.
Tota
l M
ater
ial
Requ
irem
ent
of t
he B
asqu
e Co
untr
y
40
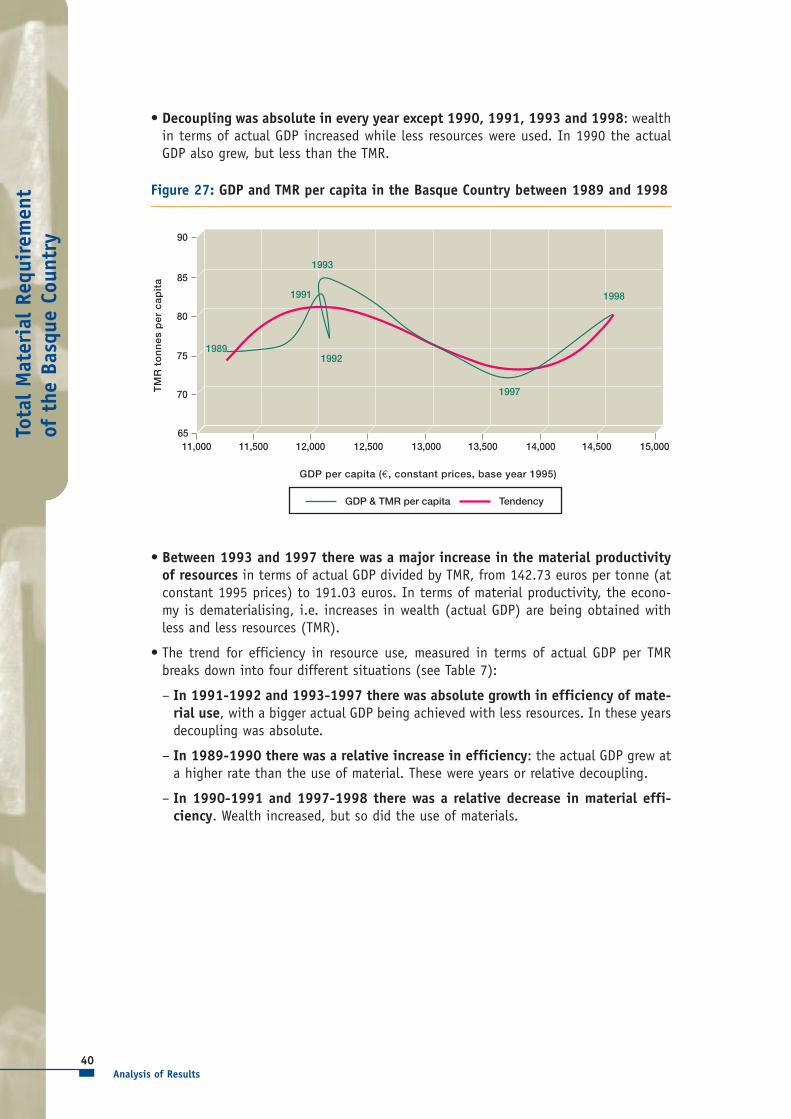
• Decoupling was absolute in every year except 1990, 1991, 1993 and 1998: wealthin terms of actual GDP increased while less resources were used. In 1990 the actualGDP also grew, but less than the TMR.
Analysis of Results
GDP & TMR per capita Tendency
11,000 11,500 12,000 12,500 13,000 13,500 14,000 14,500 15,00065
75
80
85
90
70
1998
1997
1992
1991
1993
1989
GDP per capita (€, constant prices, base year 1995)
TM
R t
on
ne
s p
er
ca
pit
a
Figure 27: GDP and TMR per capita in the Basque Country between 1989 and 1998
• Between 1993 and 1997 there was a major increase in the material productivityof resources in terms of actual GDP divided by TMR, from 142.73 euros per tonne (atconstant 1995 prices) to 191.03 euros. In terms of material productivity, the econo-my is dematerialising, i.e. increases in wealth (actual GDP) are being obtained withless and less resources (TMR).
• The trend for efficiency in resource use, measured in terms of actual GDP per TMRbreaks down into four different situations (see Table 7):
– In 1991-1992 and 1993-1997 there was absolute growth in efficiency of mate-rial use, with a bigger actual GDP being achieved with less resources. In these yearsdecoupling was absolute.
– In 1989-1990 there was a relative increase in efficiency: the actual GDP grew ata higher rate than the use of material. These were years or relative decoupling.
– In 1990-1991 and 1997-1998 there was a relative decrease in material effi-ciency. Wealth increased, but so did the use of materials.

Tota
l M
ater
ial
Requ
irem
ent
of t
he B
asqu
e Co
untr
y
41
– Surprisingly, efficiency decreased in absolute terms in 1992-93: the actual GDPdecreased in spite of an increase in TMR. The main cause was an upturn in importsfrom the rest of the world of refined and unrefined copper, which led to an increasein hidden flows of 10.49 MT. HF associated with imports of tin grew by 4.42 MT inthe same period. To all this we must add a 5.61 MT increase in petroleum oil imports.As a result, the TMR of the Basque Country grew by 9.81%, while at the same timethe Basque economy shrank by 0.76% (actual GDP).
• The performance of TMR can be approximated by considering only the metal andenergy components, which between them explain 94.83% of its variation.
Analysis of Results
Growth rate
GDP TMR GDP per TMRVariation in efficiency
1989-1990 4.13 1.27 2.82 relative !
1990-1991 2.41 8.02 -5.19 relative "
1991-1992 0.68 -7.05 8.32 absolute !
1992-1993 -0.76 9.81 -9.63 absolute "
1993-1994 3.35 -2.92 6.46 absolute !
1994-1995 3.53 -6.23 10.40 absolute !
1995-1996 2.45 -2.78 5.39 absolute !
1996-1997 4.36 -3.42 8.06 absolute !
1997-1998 5.98 11.19 -4.69 relative "
Table 7: 1989-1998 – Trends in average efficiency in terms of actual GDP per TMR
Tota
l M
ater
ial
Requ
irem
ent
of t
he B
asqu
e Co
untr
y
42
This section presents the main conclusions of this study. A series of proposals foraction to reduce the TMR are also proposed.
5.1 CONCLUSIONSThe pressure exerted on the environment by the Basque Country is truly high,and has increased since 1989.
As of 1998 every inhabitant of the Basque Country required 80.37 tonnes of mate-rial to meet his/ her needs. This figure was up by 6.65% (5.01 tonnes) from 1989.
The Basque Country evidences a high dependency on imported materials. Thatdependency has increased since 1989.
In 1998 78.6% of the per capita TMR originated outside the Basque Country. This isclosely related to the energy and foodstuffs dependency of the Basque Country andto the significance in material terms of the metal and petrochemicals industry. Since1989, dependency on foreign resources has increased by 8.2% (4.79 tonnes per capi-ta).
The origins of the TMR of the Basque Country varied from 1989 to 1998.
In 1989 41.97% of the material requirement of the Basque Country came from therest of the world, 35.51% from the rest of Spain and 22.53% from within the BasqueCountry itself. In 1998 the figures were 39.97%, 38.63% and 21.40%, respectively.
In 1997 the TMR of the Basque Country totalled 72.29 tonnes per capita, whilethe figure for the EU as a whole was 50 tonnes.
The big difference between the figure for the Basque Country and the figure for theEU is due mainly to metal minerals, which in the EU account for 10 tonnes per capi-ta and in the Basque Country account for 28.01.
Conclusions & Actions to Reduce TMR
5 Conclusions& Actions to Reduce TMR
1
2
3
4
Tota
l M
ater
ial
Requ
irem
ent
of t
he B
asqu
e Co
untr
y
43
Most of the Basque TMR is made up of hidden flows. Both hidden flows and DMIdecreased between 1989 and 1997, but increased in 1998.In 1998 67.11% of the TMR comprised hidden flows, i.e. material displaced in theprocess of obtaining DMI. Between 1989 and 1997 HF per capita in the BasqueCountry dropped by 2.73%. DMI dropped by 6.81% (as compared with 8% for theEU).
The variables which cause DMI and HF to fluctuate are clearly identified.Changes in DMI are due mainly to imports of crude oil and petroleum oils, whilethose in HF are due to variations in imports of tin, unrefined and refined copper,iron and steel, iron ore and coal.
There is decoupling and an increase in material productivity over most of theperiod analysed.With the exception of 1991, 1993 and 1998, there has been decoupling in theBasque Country, with the actual GDP growing at a higher rate than the TMR. Thisdecoupling is absolute except in 1990, 1991, 1993 and 1998, i.e. greater wealth isproduced in terms of actual GDP with less resources. Between 1993 and 1997 thereis a 33.84% increase in material productivity measured as actual GDP divided by TMRfrom 142.73 euros to 191.03 euros per tonne. In terms of material productivity, theeconomy is dematerialising, i.e. wealth (actual GDP) is being increased with less andless resources (TMR).
There is no direct dependency between wealth and use of resources.The results of this study suggest that there is no direct dependency between theeconomic cycle of the Basque Country and its material requirement. Changes in theTMR are usually due to one-off fluctuations in the demand for resources in certainmaterial-intensive industries whose contribution to the GDP is not so high in rela-tion to their material requirements (e.g. petrochemicals and the metallurgical indus-try).
Between 1985 and 1998 local pressure on the environment increased.In 1998 domestic resources extraction in the Basque Country (domestic TMR) was17.2 tonnes per capita, up 23.19% from 1985 levels. This rise is due to increases inforestry production and quarry product extraction. The main material flows in 1998were those of extraction of non metal minerals (16.02 MT), surplus material fromexcavation for construction (5.99 MT), erosion due to agriculture (4.5 MT), bioticmaterial (4.21 MT) and DMI from excavation for construction (3.59 MT).
From 1985 to 1998 the share of domestic TMR accounted for by domestic DMIincreased, while domestic HF decreased.This is due to increases in the extraction of forestry products and limestone, a dropin erosion due to agriculture and material dredged at the port of Bilbao, and the dis-appearance of the hidden flows associated with the extraction of metal minerals.
Conclusions & Actions to Reduce TMR
7
9
10
5
6
8

Tota
l M
ater
ial
Requ
irem
ent
of t
he B
asqu
e Co
untr
y
44
5.2 ACTIONS TO REDUCE MRExamples of corrective measures are proposed below which could be adopted to reducethe material flows of the Basque Country.
• In 1998 the energy resources component of the TMR of the Basque Country was 33.12MT (24.9% of the total). The following actions would reduce this figure:
– Gradual replacement of current energy sources by other, non material input-inten-sive sources (e.g. solar & wind power).
– Increased use of natural gas in detriment to oil and coal: natural gas has a grosscalorific value of 11,764.71 therms per tonne (including HF), which is 1.12 timesgreater than that of crude oil and 10.37 times greater than that of coal (includingHF in both cases). In other words, more energy can be obtained with the sameamount of material. For instance if coal imports from the rest of the world in 1998had been replaced by natural gas, a drop of 1.44 MT in TMR would have resulted.
– Encouragement of energy sources which use waste as an input (e.g. electricity gen-erated from refuse or petroleum waste). One initiative along these lines is the IGCC(Integrated Gas Combined Cycle) plant, which is capable of producing electricalpower from crude oil distillation waste.
• In 1998 erosion due to Basque agriculture totalled 4.5 MT. This hidden flow could bereduced by changing the way farms are managed and implementing defensive meas-ures such as terracing and vegetation barriers.
• Excavation for infrastructure and housing construction produces one of the maindomestic material flows. In 1998 9.58 MT of material was excavated, of which only37.5% was used. The authorities could do more to encourage the use of excavatedmaterial. Measures in this direction would have a two-fold effect: on the one handDMI would increase in detriment to hidden flows, and on the other materials fromexcavation would replace other DMI (and the HF associated with their extractionwould diminish accordingly).
• Any action which encourages recycling and/ or re-use of materials will directly help toreduce TMR. Such measures reduce DMI (material entering the economy as DMI isreplaced by material already within the economy which does not therefore count asDMI) and indirectly help to reduce hidden flows (the HF associated with the DMIreplaced would be avoided).
• New communications technologies provide many opportunities for dematerialising theeconomy: e-books, advertising on the Internet, e-business, etc.
Conclusions & Actions to Reduce TMR

Basic Bibliography
Tota
l M
ater
ial
Requ
irem
ent
of t
he B
asqu
e Co
untr
y
45
Basic Bibliography
ADRIAANSE, ALBERT; et. al. Resource Flows: The Material Basis of Industrial Economies.World Resources Institute, Washington, D.C. 1997.
AYRES, ROBERT U.; Ayres, Leslie W. Accounting for Resources, 1: Economy–WideApplications of Mass–Balance Principles to Materials and Waste. Edward Elgar,Cheltenham (U.K.). 1999.
AYRES, ROBERT U.; Ayres, Leslie W. Accounting for Resources, 2: The Life of Materials.Edward Elgar, Cheltenham (U.K.). 1999.
BRINGEZU, STEFAN; Schütz, Helmut. Total Material Requirement of the European Union.Technical report n.º 55. European Environmental Agency, Copenhagen, 2001.
BRINGEZU, STEFAN; Schütz, Helmut. Total Material Requirement of the European Union:Technical Part. Technical report n.º 56. European Environmental Agency,Copenhagen, 2001.
DE MARCO, OTTILIA; et. al. Appendix to Material Flow Analysis of the Italian Economy.Journal of Industrial Ecology, 4(2). Spring 2000.
Eurostat. Economy-wide Material Flow Accounts and Derived Indicators: AMethodological Guide. European Communities, Luxembourg, 2001.
SPANGENBERG, JOACHIM H.; et. Al. Material Flow-based Indicators in EnvironmentalReporting. Environmental Issues Series n.º 1. European Environmental Agency,Copenhagen, 1999.

Appendix: Glossary and Abbreviations
• Absolute decoupling: an absolute reduction in the use of material.
• Dematerialisation: an absolute or relative reduction in the amount of material usedper unit of product.
• Direct Material Input (DMI): The flow of natural resources into an industrial econo-my to be processed. It is calculated as the TMR minus the HF.
• Direct material productivity: an indicator of output per unit of material which entersthe economy directly.
• Hidden Flows (HF): also known as the “ecological rucksack”. The quantity of materi-al which is displaced by the process of obtaining DMI and which remains outside theeconomy.
• Material Flow Accounting: a system of accounting used for national economies, basedon accounts organised methodologically which reflect the total quantities of materialused in the economy. This enables the total consumption of resources to be account-ed for, along with the associated indirect flows, and can be used to draw up indica-tors.
• Material Flow Analysis (MFA): a method of assessment which compares the efficien-cy with which materials are used, using information from material flow accounting.MFA helps to identify needless waste of natural resources and other materials in theeconomy which would otherwise go unnoticed in conventional systems of economicaccounting.
• Material productivity: an indicator of output per unit of material.
• MT: millions of tonnes.
• Relative decoupling: a process of reducing the amount of material used per unit ofproduct, even though the amount in absolute terms continues to grow.
• t: tonne.
• Total Material Requirement (TMR): An indicator developed by the WüppertalInstitute to describe in terms of tonnage not only the quantity of natural resourcescontained in the goods produced by an economy but also the hidden flows associat-ed with their production. It is used to compare efficiency in the use of resources inan economy.
Tota
l M
ater
ial
Requ
irem
ent
of t
he B
asqu
e Co
untr
y
46Appendix: Glossary and Abbreviations

Ibáñez de Bilbao, 28-8.ª planta48009 BILBAO (Bizkaia)Teléfono 900 15 08 64
Fax 94 425 59 10e-mail: [email protected]
www.ihobe.net
LURRALDE ANTOLAMENDUETA INGURUMEN SAILA
DEPARTAMENTO DE ORDENACION DELTERRITORIO Y MEDIO AMBIENTE
Related Documents