Part II – National Reports JAPAN by Dr. Takanobu Nakajima, Koji Nomura and Toshiyuki Matsuura From: Total Factor Productivity Growth: Survey Report ©APO 2004, ISBN: 92-833-7016-3 Report of the APO Survey on Total Factor Productivity 2001/2002 Published by the Asian Productivity Organization 1-2-10 Hirakawacho, Chiyoda-ku, Tokyo 102-0093, Japan Tel: (81-3) 5226 3920 • Fax: (81-3) 5226 3950 E-mail: [email protected] • URL: www.apo-tokyo.org Disclaimer and Permission to Use This document is a part of the above-titled publication, and is provided in PDF format for educational use. It may be copied and reproduced for personal use only. For all other purposes, the APO's permission must first be obtained. The responsibility for opinions and factual matter as expressed in this document rests solely with its author(s), and its publication does not constitute an endorsement by the APO of any such expressed opinion, nor is it affirmation of the accuracy of information herein provided. Bound editions of the entire publication may be available for limited purchase. Order forms may be downloaded from the APO's web site.

Welcome message from author
This document is posted to help you gain knowledge. Please leave a comment to let me know what you think about it! Share it to your friends and learn new things together.
Transcript

Part II – National ReportsJAPAN
by Dr. Takanobu Nakajima, Koji Nomura and Toshiyuki Matsuura
From:
Total Factor Productivity Growth:Survey Report©APO 2004, ISBN: 92-833-7016-3
Report of the APO Survey on Total FactorProductivity 2001/2002
Published by the Asian Productivity Organization1-2-10 Hirakawacho, Chiyoda-ku, Tokyo 102-0093, JapanTel: (81-3) 5226 3920 • Fax: (81-3) 5226 3950E-mail: [email protected] • URL: www.apo-tokyo.org
Disclaimer and Permission to Use
This document is a part of the above-titled publication, and is provided in PDFformat for educational use. It may be copied and reproduced for personal use only.For all other purposes, the APO's permission must first be obtained.
The responsibility for opinions and factual matter as expressed in this documentrests solely with its author(s), and its publication does not constitute anendorsement by the APO of any such expressed opinion, nor is it affirmation of theaccuracy of information herein provided.
Bound editions of the entire publication may be available for limited purchase.Order forms may be downloaded from the APO's web site.
- 168 -
Dr. Takanobu Nakajima, ProfessorFaculty of Business and CommerceKoji Nomura, Assistant Professor
Keio Economic ObservatoryToshiyuki Matsuura
Faculty of Business and CommerceKeio University
OVERVIEW OF THE JAPANESE ECONOMY DURING THE "LOST DECADE"
The Japanese economy has been experiencing the pain of serious recession formore than 10 years since the bursting of financial bubble in 1991. Things appear to begetting even worse. Macro statistics in 2001 show the evidence: [0.5% GDP growth rate(1.6% in 1995), 5.0% unemployment rate (3.0% in 1995), and 19,164 cases of firmbankruptcy (15,108 in 1995). Explanations could be made both from the supply anddemand sides of the economy. While shrinking demand possibly lowers utilization ofabundant resources accumulated during the bubble period, out-of-date economic andsocial structures might prevent resource reallocation from inefficient to efficient sectors.
Political instability seems to be a mirror of the economic turmoil in Japan. Therehave been eight prime ministers in the past 10 years. The Japanese political structure hadbeen stable since 1957 under the "system of the year 1955" (when the two majorconservative parties merged), which means a Gulliver-type of oligopolistic dominance inthe Diet by the Liberal Democratic Party (LDP). A major change occurred in 1993, whena considerable number of politicians withdrew from the LDP and launched a newconservative party. The allied minority parties turned into a new majority and removedthe leader of the LDP from the position of prime minister. Since then, the LDP has neverrecaptured an absolute majority in the Diet and has had to form a coalition governmentwith at least one minority party.
Resource allocation appeared to be a minor issue during the high-growth period,because the total size of the economic pie was expanding and at least a small portion ofthe increase in output was attributable to everyone. The cessation of growth, however,would make some worse off if the government changed the rules of resource allocation,say, from a planned economy-oriented to a market economy-oriented system. LDPsupporters mostly belong to traditional sectors of the Japanese economy such asagriculture, construction, and finance which have been highly protected by governmentregulations. In the face of globalization and marketization, these sectors will soon have toface severe competition in the global market. To receive stable votes from supporters, thegovernment had to turn the economy away from a serious decline.
When the economic downturn occurred in 1991, however, the government at firstconsidered it a temporary business shock that would be resolved shortly and tried to stand
JAPAN

Japan
- 169 -
by its simple monetary policy. While the Bank of Japan made a 180-degree turn from atight-money policy to calm the bubble economy to an easy-money policy to pull theeconomy up, the reduced budget principle was cited to maintain the soundness of nationalfinance. (The official bank rate was continuously lowered from 4.5% in 1991 to 0.5% in1995.) Just when the recovery process looked satisfactory, another blow came in 1997.The Hashimoto administration, criticized for passivity in its economic policy, wasreplaced by the Obuchi administration after the national election in 1998. Prime MinisterObuchi and his successor, Prime Minister Mori, drastically converted to a positive fiscalpolicy. Government bond issues increased by 46% in 1998, 32% in 1999, and 21% in2000, and finally reached ¥90 trillion (US$0.75 trillion) in 2001. Both regional andcentral government loans soared to ¥666 trillion (US$5.5 trillion), which is ¥5.55 millionper capita.
Considering the current situation of the Japanese economy, what can a survey oftotal factor productivity (TFP) contribute? TFP is one of the most convenient indicators toevaluate economic performance ex post facto. It is reasonable to view the Japaneseeconomy during the period of drastic change in terms of TFP. Furthermore, TFP isexpected to work as a buffer against economic fluctuations, especially during recession. IfTFP gains during business booms are sufficient, companies accumulate them in the formof profits or capital gains and spend them during recession to maintain sound businessconditions. In this sense, TFP can be interpreted as a shock absorber of business cycles.We should carefully watch TFP performance during bubble periods as well as after theyburst.
REVISION FROM THE PREVIOUS SURVEY REPORT
A TFP study mainly involves the collection of data. The TFP derivation processitself is not very difficult once good data are obtained for sources of inputs and outputs. Inother words, even with imprecise data we can calculate TFP indicators that could includeboth structural and stochastic errors, because the definition of TFP is a residual factor bysubtracting input contributions from output growth.
Since TFP indices are convenient to evaluate the economic performance ofnations, not only academic researchers but also government offices and commercialresearch institutes collect data and make their own calculations. There is usuallyinsufficient information disclosure on how times series of input and output variables inthose research papers were developed. Limited disclosure might cause duplication ofwork in collecting data, and as a result many types of TFP are reported for the Japaneseeconomy.
A data processing procedure is laborious and time-consuming. Once an idealdatabase is constructed from the best sources, duplication of work may be inefficientunless the marginal productivity of an additional resource to upgrade the database isgreater than the marginal cost. What we should do first is search for the best current TFPstudy in Japan and make full use of it. We can save resources by not doing the same workand allocate them to data extension or another analysis. The paper from Japan in the 2001APO publication on TFP (Measuring Total Factor Productivity: Survey Report) is onecandidate.
Total Factor Productivity Growth
- 170 -
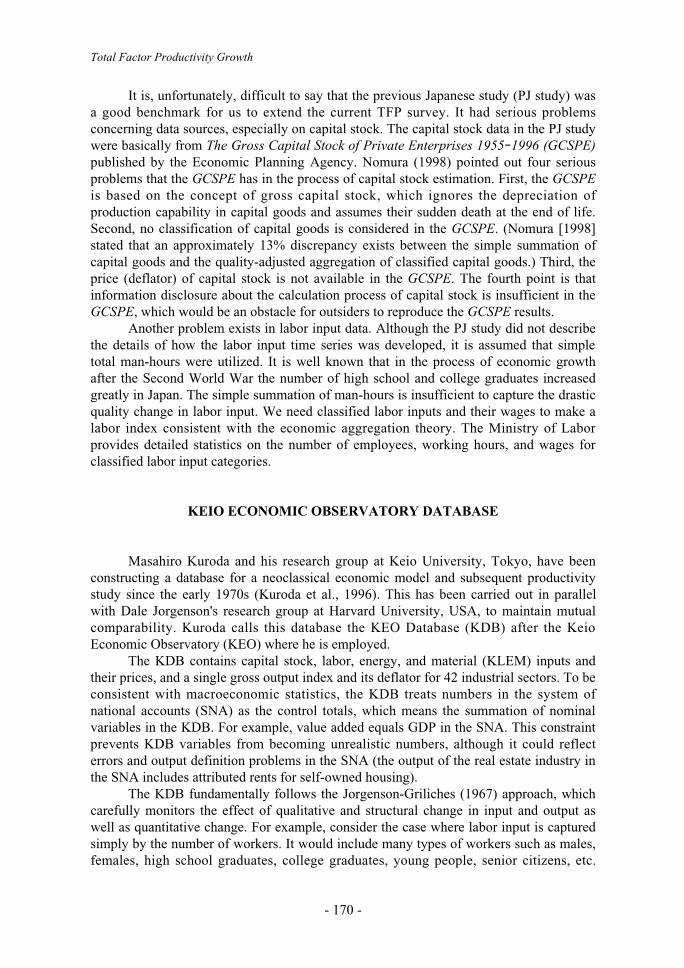
It is, unfortunately, difficult to say that the previous Japanese study (PJ study) wasa good benchmark for us to extend the current TFP survey. It had serious problemsconcerning data sources, especially on capital stock. The capital stock data in the PJ studywere basically from The Gross Capital Stock of Private Enterprises 1955[1996 (GCSPE)published by the Economic Planning Agency. Nomura (1998) pointed out four seriousproblems that the GCSPE has in the process of capital stock estimation. First, the GCSPEis based on the concept of gross capital stock, which ignores the depreciation ofproduction capability in capital goods and assumes their sudden death at the end of life.Second, no classification of capital goods is considered in the GCSPE. (Nomura [1998]stated that an approximately 13% discrepancy exists between the simple summation ofcapital goods and the quality-adjusted aggregation of classified capital goods.) Third, theprice (deflator) of capital stock is not available in the GCSPE. The fourth point is thatinformation disclosure about the calculation process of capital stock is insufficient in theGCSPE, which would be an obstacle for outsiders to reproduce the GCSPE results.
Another problem exists in labor input data. Although the PJ study did not describethe details of how the labor input time series was developed, it is assumed that simpletotal man-hours were utilized. It is well known that in the process of economic growthafter the Second World War the number of high school and college graduates increasedgreatly in Japan. The simple summation of man-hours is insufficient to capture the drasticquality change in labor input. We need classified labor inputs and their wages to make alabor index consistent with the economic aggregation theory. The Ministry of Laborprovides detailed statistics on the number of employees, working hours, and wages forclassified labor input categories.
KEIO ECONOMIC OBSERVATORY DATABASE
Masahiro Kuroda and his research group at Keio University, Tokyo, have beenconstructing a database for a neoclassical economic model and subsequent productivitystudy since the early 1970s (Kuroda et al., 1996). This has been carried out in parallelwith Dale Jorgenson's research group at Harvard University, USA, to maintain mutualcomparability. Kuroda calls this database the KEO Database (KDB) after the KeioEconomic Observatory (KEO) where he is employed.
The KDB contains capital stock, labor, energy, and material (KLEM) inputs andtheir prices, and a single gross output index and its deflator for 42 industrial sectors. To beconsistent with macroeconomic statistics, the KDB treats numbers in the system ofnational accounts (SNA) as the control totals, which means the summation of nominalvariables in the KDB. For example, value added equals GDP in the SNA. This constraintprevents KDB variables from becoming unrealistic numbers, although it could reflecterrors and output definition problems in the SNA (the output of the real estate industry inthe SNA includes attributed rents for self-owned housing).
The KDB fundamentally follows the Jorgenson-Griliches (1967) approach, whichcarefully monitors the effect of qualitative and structural change in input and output aswell as quantitative change. For example, consider the case where labor input is capturedsimply by the number of workers. It would include many types of workers such as males,females, high school graduates, college graduates, young people, senior citizens, etc.

Japan
- 171 -
Their quality might be different in the sense of suitability to jobs. Suppose a firmsubstitutes one college graduate for a high school graduate, expecting more advancedtechnological skills from the former. In this case it is inappropriate to consider the laborinput unchanged, because the quality of labor is improved even though the number ofworkers is still the same.
How can the quality be captured in data? We usually use proxy variables for thequality index with the help of economic theory. A product with higher quality should bepriced higher than the one with lower quality at the equilibrium, because the latter wouldnot be utilized at all if the two were priced equally. The quality differences are reflected inprice differentials. The KDB and Jorgenson approaches make use of price information forclassified inputs/outputs and calculate their aggregates that are consistent with economictheory. It can be shown that under perfectly competitive market conditions the applicationof appropriate aggregation function formulae yields a precise quality-adjusted quantityindex. In the case of a trans-log aggregation function, for example, the Theil-Törnqvistformula creates exact index numbers. The KDB takes into account quality changes forKLEM inputs, as summarized below (for more details, see Kuroda et al., 1996).
Labor InputThe labor force is classified by gender (male and female), age (11 classes),
educational career (four for males and three for females), and employment status(employed, self-employed, family worker) for industrial sectors. Working hours are alsotaken into account as the utilization rate of the labor force. Since in the SNA the incomeof self-employed and family workers is defined as a part of business surplus, the KDBreallocates it to a labor compensation item.
Capital InputMaking capital stock time series is one of the most laborious processes in
constructing databases. The KDB applies the double benchmark methodology, whichutilizes the Census of National Wealth (CNW) for 1955 and 1970. The two-pointavailability of the CNW is useful for determining the depreciation rates of capital goodson the basis of the Hulten-Wykoff (1981) dual approach, because the rates can beestimated so that the theoretical values are equal to the observed values. Applying theperpetual inventory method, capital stock is annually accumulated using investment dataand estimates of depreciation rates. Capital goods are classified into 78 commodities for42 sectors and aggregated into a single capital input index.
Intermediary InputRich information about intermediary input is available in input/output (I/O) tables.
Unfortunately, the most precise commodity-by-commodity basic tables (X-tables) arepublished by the Ministry of General Affairs every five years, so the KDB estimates timeseries of X-tables through the KEO-RAS method, which allows estimation of inputcoefficients of X-tables by minimizing the summation of squared deviations betweenestimated coefficients and those of the X-tables on the restriction of control totals givenby the annual SNA. After the estimation of X-tables, the KDB estimates commodity-by-sector input tables (U-tables) from sector-by-commodity output tables (V-tables) of theSNA and estimated X-tables under the commodity-technology assumption.

Total Factor Productivity Growth
- 172 -
OutputThe KDB assumes separation between input and output and aggregates multiple
outputs into a single index for 42 industrial sectors. Basic information on output is fromV-tables in the SNA. One characteristic of the KDB is that it does not use I/O commoditydeflators for the conversion from nominal to real values, but applies the wholesale priceindex published by the Bank of Japan (BOJ). The reason is that the BOJ index considersquality change in commodities. Shimpo (1999) showed how the two different outputdeflators lead to large discrepancies in the TFP index. While in case of the I/O deflator,the US automobile industry had an advantage in the level of TFP over the Japaneseindustry in the 1980s, the BOJ price index yields higher TFP of the Japanese auto industrythan that in the USA (Urata et al., 1995). Considering the recent rapid technical change inhigh-tech commodities, a quality-adjusted price index is preferable.
INDUSTRY-LEVEL TFP GROWTH, 1960]95
Industry-level TFP growth rates from 1960 to 1995 were calculated using theNomura-Kuroda (1999) method based on the KDB. The observation period covered bythe KDB is divided into four subperiods: 1961[73 (high-growth period); 1974[85 (stable-growth period); 1986[91 (bubble economy period); and 1992[95 (post-bubble economyperiod).
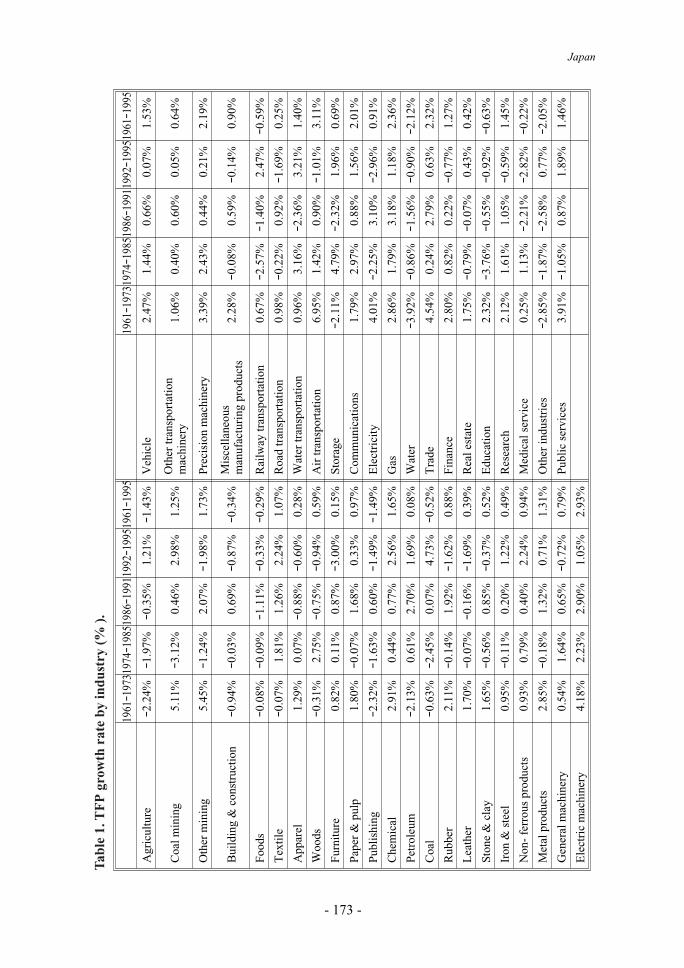
Table 1 summarizes the results. (For the theoretical background of the TFPcalculations, see the Appendix.) First the good performance of machinery-relatedindustries in general can be noted. They maintained positive TFP growth except forgeneral machinery during the final period, although the rates gradually declined. Thecommunications industry made constant productivity progress against the background ofan expanding telecommunications market. On the other hand, some traditional sectorssuch as agriculture, food, wood, publishing, leather products, water supply, and educationhad almost constant productivity declines throughout the observation period.
Examining the average annual growth rates from 1961 to 1995 in Tables 1 and 2,the differences in TFP performance among industries become more obvious. The rankingsupports the understanding that TFP measured in the long term reflects the characteristicsof industries. (See Nakajima [2001] for a more detailed explanation of the relationshipbetween industrial characteristics and TFP growth.) Although air, railway, and watersupply services are categorized as a network-based transportation industry, their TFPperformance differs. The differences in their market conditions are obviously aninfluence. Water supply is still widely provided by local governments in Japan. However,we should also pay more attention to production and technological characteristics. Thebig difference exists in the burden of cost for building infrastructure. While railway andwater supply services need huge amounts of investment to construct rails and lay pipesthroughout the country, an air transportation service needs only an airport.
Japan
- 173 -
Agr
icul
ture
Coa
l min
ing
Oth
er m
inin
g
Bui
ldin
g &
con
stru
ctio
n
Food
s
Tex
tile
App
arel
Woo
ds
Furn
iture
Pape
r &
pul
p
Publ
ishi
ng
Che
mic
al
Petr
oleu
m
Coa
l
Rub
ber
Lea
ther
Ston
e &
cla
y
Iron
& s
teel
Non
- fe
rrou
s pr
oduc
ts
Met
al p
rodu
cts
Gen
eral
mac
hine
ry
Ele
ctri
c m
achi
nery
[2.2
4%[1
.97%
[0.3
5%1.
21%[1
.43%
Veh
icle
2.47
%1.
44%
0.66
%0.
07%
1.53
%
1961[1
9731
974[
1985
1986[1
9911
992[
1995
1961[1
995
1961[1
9731
974[
1985
1986[1
9911
992[
1995
1961[1
995
5.11
%[3
.12%
0.46
%2.
98%
1.25
%O
ther
tran
spor
tatio
n m
achi
nery
1.06
%0.
40%
0.60
%0.
05%
0.64
%
5.45
%[1
.24%
2.07
%[1
.98%
1.73
%Pr
ecis
ion
mac
hine
ry3.
39%
2.43
%0.
44%
0.21
%2.
19%
[0.9
4%[0
.03%
0.69
%[0
.87%
[0.3
4%M
isce
llane
ous
man
ufac
turi
ng p
rodu
cts
2.28
%[0
.08%
0.59
%[0
.14%
0.90
%
[0.0
8%[0
.09%
[1.1
1%[0
.33%
[0.2
9%R
ailw
ay tr
ansp
orta
tion
0.67
%[2
.57%
[1.4
0%2.
47%[0
.59%
[0.0
7%1.
81%
1.26
%2.
24%
1.07
%R
oad
tran
spor
tatio
n0.
98%[0
.22%
0.92
%[1
.69%
0.25
%
1.29
%0.
07%[0
.88%
[0.6
0%0.
28%
Wat
er tr
ansp
orta
tion
0.96
%3.
16%[2
.36%
3.21
%1.
40%
[0.3
1%2.
75%[0
.75%
[0.9
4%0.
59%
Air
tran
spor
tatio
n6.
95%
1.42
%0.
90%[1
.01%
3.11
%
0.82
%0.
11%
0.87
%[3
.00%
0.15
%St
orag
e[2
.11%
4.79
%[2
.32%
1.96
%0.
69%
1.80
%[0
.07%
1.68
%0.
33%
0.97
%C
omm
unic
atio
ns1.
79%
2.97
%0.
88%
1.56
%2.
01%
[2.3
2%[1
.63%
0.60
%[1
.49%
[1.4
9%E
lect
rici
ty4.
01%[2
.25%
3.10
%[2
.96%
0.91
%
2.91
%0.
44%
0.77
%2.
56%
1.65
%G
as2.
86%
1.79
%3.
18%
1.18
%2.
36%
[2.1
3%0.
61%
2.70
%1.
69%
0.08
%W
ater
[3.9
2%[0
.86%
[1.5
6%[0
.90%
[2.1
2%
[0.6
3%[2
.45%
0.07
%4.
73%[0
.52%
Tra
de4.
54%
0.24
%2.
79%
0.63
%2.
32%
2.11
%[0
.14%
1.92
%[1
.62%
0.88
%Fi
nanc
e2.
80%
0.82
%0.
22%[0
.77%
1.27
%
1.70
%[0
.07%
[0.1
6%[1
.69%
0.39
%R
eal e
stat
e1.
75%[0
.79%
[0.0
7%0.
43%
0.42
%
1.65
%[0
.56%
0.85
%[0
.37%
0.52
%E
duca
tion
2.32
%[3
.76%
[0.5
5%[0
.92%
[0.6
3%
0.95
%[0
.11%
0.20
%1.
22%
0.49
%R
esea
rch
2.12
%1.
61%
1.05
%[0
.59%
1.45
%
0.93
%0.
79%
0.40
%2.
24%
0.94
%M
edic
al s
ervi
ce0.
25%
1.13
%[2
.21%
[2.8
2%[0
.22%
2.85
%[0
.18%
1.32
%0.
71%
1.31
%O
ther
indu
stri
es[2
.85%
[1.8
7%[2
.58%
0.77
%[2
.05%
0.54
%1.
64%
0.65
%[0
.72%
0.79
%Pu
blic
ser
vice
s3.
91%[1
.05%
0.87
%1.
89%
1.46
%
4.18
%2.
23%
2.90
%1.
05%
2.93
%
Tab
le 1
. TF
P g
row
th r
ate
by in
dust
ry (
% )
.
Total Factor Productivity Growth
- 174 -
Top 10 Worst 10
1 Air transportation Water supply
2 Electric machinery Other industries
3 Gas Publishing
4 Trade Agriculture
5 Precision machinery Education
6 Communications Railway transportation
7 Other mining Coal
8 Chemicals Building & construction
9 Vehicles Food
10 Public services Medical services
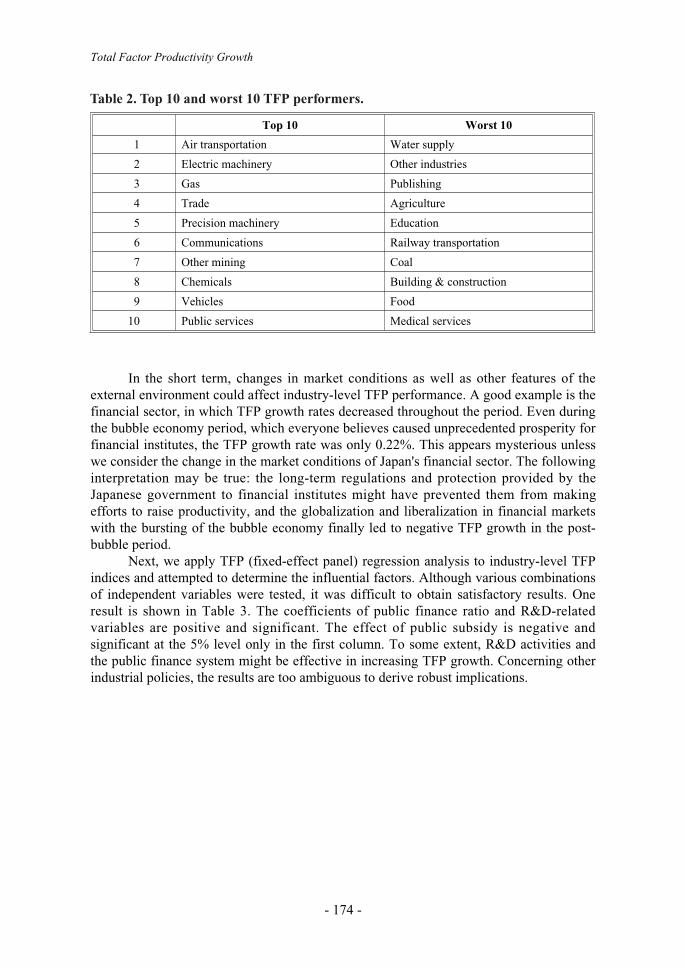
Table 2. Top 10 and worst 10 TFP performers.
In the short term, changes in market conditions as well as other features of theexternal environment could affect industry-level TFP performance. A good example is thefinancial sector, in which TFP growth rates decreased throughout the period. Even duringthe bubble economy period, which everyone believes caused unprecedented prosperity forfinancial institutes, the TFP growth rate was only 0.22%. This appears mysterious unlesswe consider the change in the market conditions of Japan's financial sector. The followinginterpretation may be true: the long-term regulations and protection provided by theJapanese government to financial institutes might have prevented them from makingefforts to raise productivity, and the globalization and liberalization in financial marketswith the bursting of the bubble economy finally led to negative TFP growth in the post-bubble period.
Next, we apply TFP (fixed-effect panel) regression analysis to industry-level TFPindices and attempted to determine the influential factors. Although various combinationsof independent variables were tested, it was difficult to obtain satisfactory results. Oneresult is shown in Table 3. The coefficients of public finance ratio and R&D-relatedvariables are positive and significant. The effect of public subsidy is negative andsignificant at the 5% level only in the first column. To some extent, R&D activities andthe public finance system might be effective in increasing TFP growth. Concerning otherindustrial policies, the results are too ambiguous to derive robust implications.

Japan
- 175 -
Eq. 1 Eq. 2 Eq. 3 Eq. 4
Dependent ln TFP ln TFP ln TFP
number of observations 154 168 105 105
PF0.461[2.264]**
0.434[2.164]**
R&D01.591[4.754]**
R&D10.153
[10.577]**0.114[7.662]**
R&D20.768[2.585]**
R&D30.052
[0.626]
R&D40.105[4.885]**
subsidy[5.062[[1.960]*
[1.322[[0.595]
2.756[0.953]
3.165[1.118]
tariff[1.207
[[0.736]0.839
[0.611]1.499
[0.821]2.010
[1.117]
const0.973
[80.892]**0.782
[39.429]**0.771
[23.269]**0.759
[22.837]**
sigma_u 0.093 0.209 0.144 0.156
sigma_e 0.114 0.102 0.070 0.069
rho 0.397 0.809 0.807 0.837
Table 3. Estimation results of TFP regression model (fixed-effect model).
All independent variables are measured by logarithmic values*,**: significant on 5% and 1% level respectivelyPF: The ratio of public finance over total debt.(source: Basic Survey on Commercial and Manufacturing Structure and Activities )R&D0 : R&D expenditure based on I[O table over total productionR&D1 : R&D sales ratio (source: Survey of Research and Development )R&D2 : R&D (basic reserch)/sales (source: Survey of Research and Development )R&D3 : R&D (applied reserch)/sales (source: Survey of Research and Development )R&D4 : R&D (development)/sales (source: Survey of Research and Development )subsidy : subsidy production ratio (quoted from Urata et al.(1995))tariff : tariff production ratio (quoted from Urata et al.(1995))Eq.1 : 1965[1995Eq.2 : 1960[1995Eq.3, Eq.4 : 1970[1990
Total Factor Productivity Growth
- 176 -
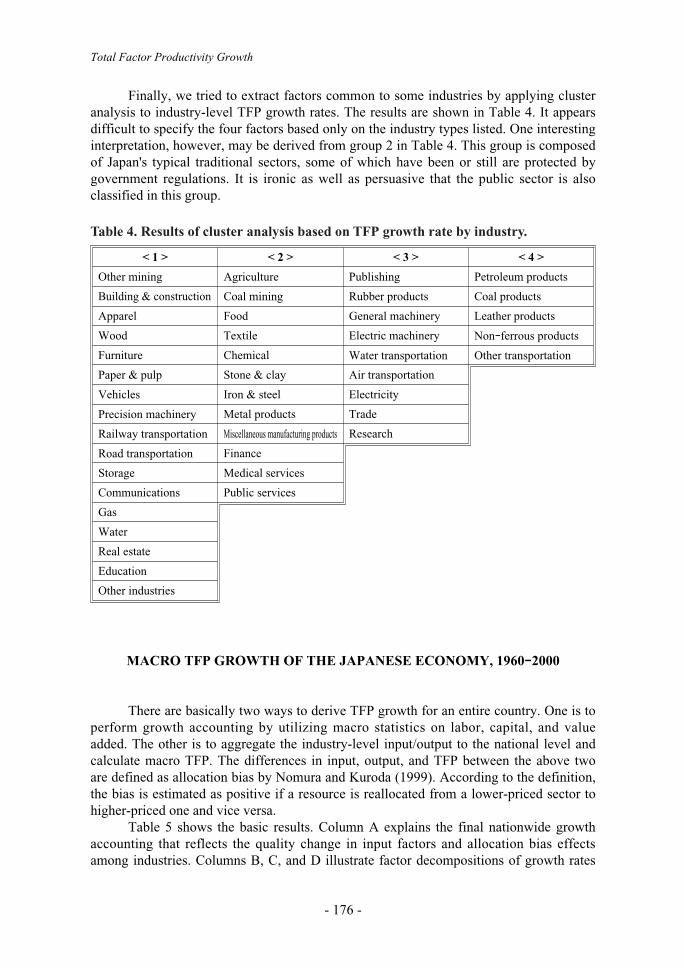
Finally, we tried to extract factors common to some industries by applying clusteranalysis to industry-level TFP growth rates. The results are shown in Table 4. It appearsdifficult to specify the four factors based only on the industry types listed. One interestinginterpretation, however, may be derived from group 2 in Table 4. This group is composedof Japan's typical traditional sectors, some of which have been or still are protected bygovernment regulations. It is ironic as well as persuasive that the public sector is alsoclassified in this group.
MACRO TFP GROWTH OF THE JAPANESE ECONOMY, 1960]2000
There are basically two ways to derive TFP growth for an entire country. One is toperform growth accounting by utilizing macro statistics on labor, capital, and valueadded. The other is to aggregate the industry-level input/output to the national level andcalculate macro TFP. The differences in input, output, and TFP between the above twoare defined as allocation bias by Nomura and Kuroda (1999). According to the definition,the bias is estimated as positive if a resource is reallocated from a lower-priced sector tohigher-priced one and vice versa.
Table 5 shows the basic results. Column A explains the final nationwide growthaccounting that reflects the quality change in input factors and allocation bias effectsamong industries. Columns B, C, and D illustrate factor decompositions of growth rates
< 1 > < 2 > < 3 > < 4 >
Other mining Agriculture Publishing Petroleum products
Building & construction Coal mining Rubber products Coal products
Apparel Food General machinery Leather products
Wood Textile Electric machinery Non[ferrous products
Furniture Chemical Water transportation Other transportation
Paper & pulp Stone & clay Air transportation
Vehicles Iron & steel Electricity
Precision machinery Metal products Trade
Railway transportation Miscellaneous manufacturing products Research
Road transportation Finance
Storage Medical services
Communications Public services
Gas
Water
Real estate
Education
Other industries
Table 4. Results of cluster analysis based on TFP growth rate by industry.

Japan
- 177 -
for output, input, and TFP, respectively, and correspond to the four panels in Figures 1and 2. The row of "other bias" stands for the value of the cross-term that inevitablyappears in the process of aggregation from industry level to macro level.
A. D
ivis
ia a
ggre
gatio
n
a1T
rue
TFP
4.86
75.
903[0
.063
1.45
21.
647
1.38
0[0
.160
0.51
44.
542
0.83
21.
259
0.12
41.
942
a2V
alue
add
edO
utpu
t10
.187
11.8
574.
167
4.21
14.
218
4.63
91.
018
0.86
610
.095
3.70
44.
463
0.64
95.
146
a3L
abor
Con
trib
utio
n
Inpu
t
Val
ue a
dded
Cap
ital
Agg
rega
tion
3.88
53.
772
1.35
92.
541
1.89
02.
170[0
.282
[0.2
233.
417
1.65
51.
900[0
.342
1.88
9
a4C
apita
l7.
061
8.30
67.
836
3.08
53.
610
4.77
83.
289
1.27
57.
980
4.39
35.
024
1.84
14.
905
a5L
abor
2.10
52.
008
0.71
21.
565
1.14
51.
265[0
.166
[0.1
371.
832
0.99
11.
107[0
.204
1.06
2
a6C
apita
l3.
214
3.94
63.
519
1.19
51.
427
1.99
41.
344
0.49
03.
721
1.79
52.
097
0.72
92.
141
B. O
utpu
t Dec
ompo
sitio
n
b1A
ggre
gate
4.79
810
.014
4.09
33.
067
3.72
44.
302
0.99
91.
031
7.17
93.
024
4.19
30.
723
4.00
4
b2A
lloca
tion
5.38
61.
829
0.08
51.
149
0.49
30.
336
0.01
9[0
.165
2.92
10.
682
0.26
9[0
.074
1.14
1
C. I
nput
dec
ompo
sitio
n
c1A
ggre
gate
2.57
12.
960[0
.162
0.80
70.
684
1.38
8[0
.998
[0.6
602.
310
0.43
71.
168[0
.929
0.82
4
c2Q
ualit
y0.
146
0.81
61.
012
1.25
01.
018
0.53
70.
495
0.06
50.
560
0.88
20.
512
0.26
90.
667
c3A
lloca
tion
[0.2
61[0
.259
[0.1
45[0
.038
0.02
20.
002
0.01
1[0
.010
[0.2
65[0
.007
0.00
00.
001[0
.085
c4O
ther
Bia
s1.
431
0.25
80.
660
0.52
30.
190
0.23
80.
210
0.13
20.
814
0.34
90.
216
0.17
80.
455
c5A
ggre
gate
1.93
12.
447
2.89
51.
684
1.58
52.
421
2.49
71.
354
2.39
82.
188
2.67
71.
700
2.10
2
c6Q
ualit
y6.
287
4.75
84.
408
1.71
61.
928
2.10
10.
610[0
.037
5.46
02.
117
2.17
40.
037
2.72
2
c7A
lloca
tion
[4.0
71[2
.571
[1.3
21[1
.058
[1.2
35[1
.095
[0.9
45[0
.551
[2.9
56[1
.144
[1.1
25[0
.690
[1.6
06
c8O
ther
Bia
s2.
917
3.66
91.
848
0.74
01.
325
1.34
61.
124
0.50
93.
076
1.22
61.
290
0.79
51.
685
D. T
FP d
ecom
posi
tion
d1A
ggre
gate
TFP
2.53
87.
255
2.95
21.
917
2.68
22.
482
0.57
80.
918
4.81
81.
873
2.39
40.
614
2.66
5
d2Bi
as in
valu
e add
ed5.
386
1.82
90.
085
1.14
90.
493
0.33
60.
019[0
.165
2.92
10.
682
0.26
9[0
.074
1.14
1
d3B
ias
in la
bor[0
.725
[0.4
16[0
.862
[1.0
66[0
.738
[0.4
53[0
.430
[0.1
13[0
.592
[0.7
36[0
.425
[0.2
70[0
.600
d4B
ias
in c
apita
lbi
as[2
.335
[2.7
84[2
.227
[0.5
43[0
.797
[0.9
80[0
.327
0.03
0[2
.601
[0.9
01[0
.976
[0.0
59[1
.245
Cal
cula
tion
is b
ased
on
the
Kei
o E
cono
mic
Obs
erva
tory
Dat
abas
e.N
ote
: a1=
a2[a
5[a6
a2=b
1+b2
a3=c
1+c2
+c3+
c4a4
=c5+
c6+c
7+c8
a1=d
1+d2
+d3+
d4
Tab
le 5
. Dec
ompo
siti
on o
f so
urce
s of
eco
nom
ic g
row
th d
urin
g 19
60]2
000
in J
apan
.
Total Factor Productivity Growth
- 178 -
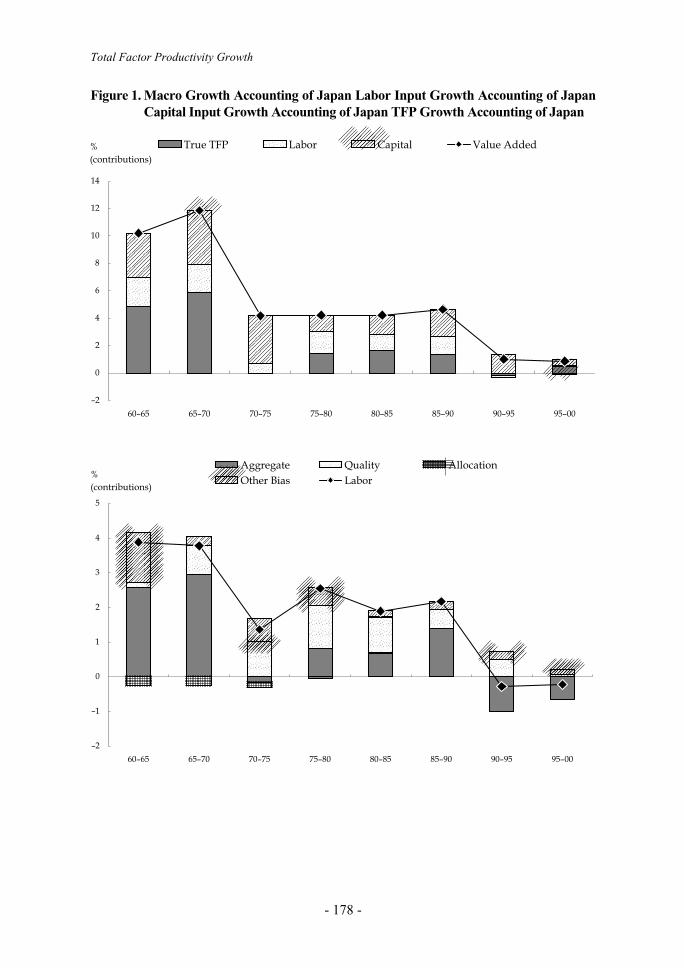
Figure 1. Macro Growth Accounting of Japan Labor Input Growth Accounting of JapanCapital Input Growth Accounting of Japan TFP Growth Accounting of Japan

Japan
- 179 -

Total Factor Productivity Growth
- 180 -
Figure 2. TFP, LP and KP growth rates
Column A1) The contribution of TFP to value-added growth was strongly significant (mostly 50%)
during the high-growth period.2) The supply-side shock of the first oil crisis was perfectly absorbed by TFP growth from
1970 to 1975.3) The bubble economy, which was praised as the second advent of high growth, had
substantially different characteristics in terms of growth accounting from the higheconomic growth in the 1960s. While the latter was mostly attained by TFP growth, theformer relied on a more than 70% contribution from input growth.
Column B1) Allocation bias had a substantially large positive value during the high-growth period,
which reflected rapid structural change in Japanese industries.2) Only the post-bubble recession period (1995[2000) showed a negative value of bias,
which indicates that some inefficiency might have occurred in output allocation amongindustries at that time.
Column C1) The positive and significant contribution of labor quality change was constant.2) The contribution of capital stock to Japan's economic growth was constantly
substantial.3) The allocation bias of capital was constantly negative, which shows that capital goods
were allocated to industries that have relatively small capital stock shares in theJapanese economy.
Figure 3 summarizes the macro growth accounting results and partial productivityindicators for the Japanese economy. The LP growth was stably larger than KP growth.

Japan
- 181 -
The KP growth rate was small and occasionally negative a result of a higher rate ofcapital accumulation than economic growth. The difference between LP and KP narrowedafter the first oil crisis, but expanded again until the bubble economy period. This showsthat capital accumulation-driven growth experiences setbacks at economic downturns.
Figure 3. Macro Growth Accounting of the Japanese Economy
CONCLUSIONS AND POLICY IMPLICATIONS
In TFP studies there is always a trade-off between data precision and availability ofresources. The KDB is one of the finest data sources for TFP calculations but needs ahuge amount of work to construct. We must accept a three-year-lag to obtain the completeversion. The previous APO TFP publication sacrificed precision for the latest growthaccounting numbers. In this paper, we chose the KDB in exchange for a three-year-lag.The reason for our choice is that a TFP indicator becomes meaningless if it containsmeasurement errors.
Figure 3 and Table 4 show that TFP growth has made a considerable contributionto the economic growth of Japan. Especially during the high-growth period, thecontribution of TFP was nearly 50%, which must have worked as a shock absorber at thetime of the economic recession after the first oil crisis in 1973. The bubble economy afterthe late 1980s raised TFP growth rates, but the gains at that time might not have beenenough to absorb the downward shock of the sudden bursting of the bubble in 1992.
In a sophisticated economy like Japan, it is not easy to interpret macro TFPfluctuations because it has a complicated industrial structure and many other factors that
Total Factor Productivity Growth
- 182 -
jointly affect TFP measurement. Relatively longer time series of industry-level TFPindicators could present more interpretable results reflecting industrial characteristics.Table 1 shows that manufacturing industries, especially machinery-related ones, hadbetter TFP performance throughout the observation period. Tertiary industries, on theother hand, had either positive or negative TFP growth rates depending on theirproduction technologies and market structures. Although the TFP regression analysisresults only show a significant effect of R&D expenditure on TFP growth, the clusteranalysis based on industry-level TFP growth rates (group 2) pointed out industries thathave been under government protection and regulations.
Our results based on the KDB unfortunately still seem to have uncorrected errors.We cannot say that the effect of the business cycle has been completely eliminated fromour TFP fluctuations in Figures 1, 2, and 3. Since Griliches-Jorgenson (1967), greatefforts have been made to select data sources to obtain "pure" TFP indicators. However,those efforts mainly focused on the input side of growth accounting. Less attention hasbeen paid to the definition of output, that is, GDP, although a 1% error in output growthleads directly to the same amount of error in TFP growth.
The problem of output definition is more serious for a developed economy likeJapan. In the early stage of economic development, the main actor is manufacturing thatproduces a visible and measurable output. As the economy becomes more mature, astructural change may occur from econdary to tertiary industry such as finance, retail, realestate, and many other service industries. How can we correctly define output for thoseindustries? What should be their deflators? Consider the retail industry. The serviceoutput is defined as the trade margin, and traditionally the double deflation approach hasbeen utilized to obtain the "real" output. When the trade margin decreases and the qualityof a retail service increases as a result of more competition, "real output" will decreaseunder the traditional definition. The TFP number for trade is 92 to 95 in Table 1 and couldreflect this situation. Considering the more than 40% contribution of the service industryto nominal GDP, we should pay more attention to the output definition issue in TFPanalysis.
ACKNOWLEDGMENTS
We thank Noriyoshi Oguchi and other participants in the APO meeting in KualaLumpur for useful comments and suggestions. We are also grateful to Masahiro Kurodaand Kazushige Shimpo for allowing us to utilize the Keio Economic ObservatoryDatabase and to quote some of their results.

Japan
- 183 -
REFERENCES
Diewert, W.E. Exact and superlative index numbers. Journal of Econometrics 1976; 4:115[145.
Honma, M. Japan. In: Asian Productivity Organization, ed. Measuring Total FactorProductivity: Survey Report. Tokyo: Asian Productivity Organization; 2001, pp.50[96.
Hulten, C.R. and Wykoff, F.C. The estimation of economic depreciation using vintageasset prices: An application of the Box-Cox power transformation. Journal ofEconometrics 1981; 15: 367[396.
Jorgenson, D.W. and Griliches, Z. The explanation of productivity change. Review ofEconomics and Statistics 1967; 34: 249[283.
Kuroda, M., Shimpo, K. Nomura, K., and Kobayashi, N. KEO Database. Keio EconomicObservatory Monograph Series. Tokyo: Keio University; 1996. (In Japanese)
Nakajima, T. Productivity Analysis on the Japanese Economy. Tokyo: Nihon KeizaiShimbunsha; 2001. (In Japanese)
Nomura, K. Several problems in capital stock estimation in Japan and time-seriesestimation of fixed capital matrix. Keizai-Tokei-Kenkyu 1998; 25: 1[31. (InJapanese)
Nomura, K. and Kuroda, M. An explanation of productivity paradox: TFP spilloverthrough capital accumulation. IMES Discussion Paper, No. 99[E[10, 1999.
Oguchi, N. Integrated summary. In: Asian Productivity Organization, ed. MeasuringTotal Factor Productivity-Survey Report. Tokyo: Asian Productivity Organization;2001: pp. 1[13.
Shimpo, K. Productivity comparison between Japan and U.S. Mimeo, 1999.Urata, S., Kawai, H., Kiji, T., and Nishimura, T. Comparative advantage of Japanese
manufacturing industries: Its change and determinants. MITI-RI Review 1995; 5:1995. (In Japanese)
Yoshioka, K. Productivity Analysis on Japan's Manufacturing and Financial Industries.Tokyo: Toyo-Keizai-Shimposha; 1987. (In Japanese)
Total Factor Productivity Growth
- 184 -
APPENDIX. THEORETICAL BACKGROUND OF TFP
Choice of Index FormulaTFP is defined as the ratio of output to input. It is simple to calculate TFP in the
case of a single-input/output technology such as a simple transportation service in which aworker carries baggage from one place to another. In more general cases of multiple-input/output technologies, we need to aggregate them into single input and output indicesto calculate TFP. Although the choice of an appropriate aggregate function is basicallyleft to a researcher according to the purpose of the study, economic theory givesguidelines on making the choice, especially when a TFP indicator with a specificcalculation formula holds.
Diewert (1976) made a considerable contribution to the consistency of an indexformula with a production technology (a form of production function). He proved that aninput/output index based on the Theil-Törnqvist (T-T) formula is consistent with a trans-log production function. This implication is useful, because once a producer's rationalchoice of an input combination is assumed, it is not necessary to estimate the productionfunction itself to obtain aggregated numbers. It is only needed to calculate an index usingan exact (corresponding) formula. Since the trans-log production function satisfies therequirement for technological flexibility, Diewert called the T-T (trans-log) index thesuperlative index.
The TFP numbers referred in this paper were basically calculated using the T-Tindex to maintain the flexibility of production technologies. If we assume a constant costshare for an input factor, the production function is specified as a Cobb-Douglas type.
Adjustment of Capital UtilizationOne of the most difficult tasks for TFP researchers is how to solve the problem of
fixed-factor utilization. Because in the KDB the rate of return on capital stock isendogenously derived based on the neoclassical economic theory, it is impossible to showthe difference in TFP results before and after the utilization adjustment. As Yoshioka(1987) explained, TFP occasionally has a procyclical movement with the business cycle.For the sake of the original definition of TFP, that is, a purely external technological shiftfactor of production technology, the mixture of business cycle effects might be anobstacle to be eliminated. There are actually a variety of methods to remove the effect offixed-factor utilization from TFP. Oguchi (2001) presented a useful and appropriatemethod that could be applied to most APO member countries. In this paper, however, weapply another method to adjust capital utilization.
One of the most famous theories of microeconomics explains that a perfectallocation of nominal output to the compensation of input factors is guaranteed under thefollowing conditions: perfect competition, linear-homogeneous production technology,perfect flexibility of input factors, and producer's rational behavior (profit maximization).In this ideal case, no capital utilization problem occurs because the optimal input level isobtained rapidly. One simple method for the utilization adjustment is to make use of thistheorem.
Suppose the short-run production cost can be expressed using a variable cost
Japan
- 185 -
function G as follows:
(Eq. 1)
where p stands for the price vector of variable inputs, Y for output, K for fixedinput (capital stock), and pK for the user cost of capital. Taking a partial derivative interms of Y, we obtain the following two different results depending on whether capitalstock is adjustable (in the long term) or not (in the short term):
2 Change in variable cost in the long term (Eq. 2)
2 Change in variable cost in the short term (Eq. 3)
We define the optimal input level of K (unity capital stock utilization rate) as onethat equalizes the long-run derivative and short-run derivative in terms of Y, that is,
(Eq. 4)
Since it can be shown that the left-hand side corresponds to marginal productivityof capital, replacement of the user cost of capital with LHS in Eq. 4 gives utilization-adjusted growth accounting.
The marginal productivity of capital can be easily calculated if we assume that thefour conditions mentioned above hold true. Applying Euler's theorem for a linear-homogeneous function to production function Y = F(L, K), the following relation holds:
(Eq. 5)
where w means wage rate and it is assumed that the product price equals unity.Using Eq. 5, the marginal productivity can be calculated as:
(Eq. 6)
Considering the discussion above, it is theoretically confirmed that utilizationadjustment can be achieved using the estimated marginal productivity of capital instead ofuser cost.
KG
KwL
9
9[ =
[Y
wLKG
K9
9= [
LF
LKF
K9
9
9
9= +Y
pKG
K9
9=[
G9
9
Y
GKG K
pK
K9
9
9
9
9
9
9
9+ +
Y Y Y
( , , )C G p Y K p KK= +
Related Documents