PLEASE SCROLL DOWN FOR ARTICLE This article was downloaded by: [TÜBTAK EKUAL] On: 18 September 2009 Access details: Access Details: [subscription number 772814176] Publisher Informa Healthcare Informa Ltd Registered in England and Wales Registered Number: 1072954 Registered office: Mortimer House, 37-41 Mortimer Street, London W1T 3JH, UK Free Radical Research Publication details, including instructions for authors and subscription information: http://www.informaworld.com/smpp/title~content=t713642632 Total antioxidant capacity assay of human serum using copper(II)-neocuproine as chromogenic oxidant: The CUPRAC method Reat Apak a ; Kubilay Güçlü a ; Mustafa Özyürek a ; Saliha Esn Karademr a Mehmet Altun a et al. a Faculty of Engineering, Department of Chemistry, Istanbul University, Istanbul, Turkey Online Publication Date: 01 September 2005 To cite this Article Apak, Reat, Güçlü, Kubilay, Özyürek, Mustafa, Karademr, Saliha Esn Altun, Mehmetet al.(2005)'Total antioxidant capacity assay of human serum using copper(II)-neocuproine as chromogenic oxidant: The CUPRAC method',Free Radical Research,39:9,949 — 961 To link to this Article: DOI: 10.1080/10715760500210145 URL: http://dx.doi.org/10.1080/10715760500210145 Full terms and conditions of use: http://www.informaworld.com/terms-and-conditions-of-access.pdf This article may be used for research, teaching and private study purposes. Any substantial or systematic reproduction, re-distribution, re-selling, loan or sub-licensing, systematic supply or distribution in any form to anyone is expressly forbidden. The publisher does not give any warranty express or implied or make any representation that the contents will be complete or accurate or up to date. The accuracy of any instructions, formulae and drug doses should be independently verified with primary sources. The publisher shall not be liable for any loss, actions, claims, proceedings, demand or costs or damages whatsoever or howsoever caused arising directly or indirectly in connection with or arising out of the use of this material.

Welcome message from author
This document is posted to help you gain knowledge. Please leave a comment to let me know what you think about it! Share it to your friends and learn new things together.
Transcript
PLEASE SCROLL DOWN FOR ARTICLE
This article was downloaded by: [TÜBTAK EKUAL]On: 18 September 2009Access details: Access Details: [subscription number 772814176]Publisher Informa HealthcareInforma Ltd Registered in England and Wales Registered Number: 1072954 Registered office: Mortimer House,37-41 Mortimer Street, London W1T 3JH, UK
Free Radical ResearchPublication details, including instructions for authors and subscription information:http://www.informaworld.com/smpp/title~content=t713642632
Total antioxidant capacity assay of human serum using copper(II)-neocuproineas chromogenic oxidant: The CUPRAC methodReat Apak a; Kubilay Güçlü a; Mustafa Özyürek a; Saliha Esn Karademr a Mehmet Altun aet al.a Faculty of Engineering, Department of Chemistry, Istanbul University, Istanbul, Turkey
Online Publication Date: 01 September 2005
To cite this Article Apak, Reat, Güçlü, Kubilay, Özyürek, Mustafa, Karademr, Saliha Esn Altun, Mehmetet al.(2005)'Total antioxidantcapacity assay of human serum using copper(II)-neocuproine as chromogenic oxidant: The CUPRAC method',Free RadicalResearch,39:9,949 — 961
To link to this Article: DOI: 10.1080/10715760500210145
URL: http://dx.doi.org/10.1080/10715760500210145
Full terms and conditions of use: http://www.informaworld.com/terms-and-conditions-of-access.pdf
This article may be used for research, teaching and private study purposes. Any substantial orsystematic reproduction, re-distribution, re-selling, loan or sub-licensing, systematic supply ordistribution in any form to anyone is expressly forbidden.
The publisher does not give any warranty express or implied or make any representation that the contentswill be complete or accurate or up to date. The accuracy of any instructions, formulae and drug dosesshould be independently verified with primary sources. The publisher shall not be liable for any loss,actions, claims, proceedings, demand or costs or damages whatsoever or howsoever caused arising directlyor indirectly in connection with or arising out of the use of this material.
Total antioxidant capacity assay of human serum using copper(II)-neocuproine as chromogenic oxidant: The CUPRAC method
RESAT APAK, KUBILAY GUCLU, MUSTAFA OZYUREK, SALIHA ESIN KARADEMIR, &
MEHMET ALTUN
Faculty of Engineering, Department of Chemistry, Istanbul University, Avcilar 34320, Istanbul, Turkey
Accepted by Professor B. Halliwell
(Received 30 March 2005; in revised form 31 May 2005)
AbstractBackground: Tests measuring the combined antioxidant effect of the nonenzymatic defenses in biological fluids may be usefulin providing an index of the organism’s capability to counteract reactive species known as prooxidants, resist oxidative damageand combat oxidative stress-related diseases. The selected chromogenic redox reagent for the assay of human serum should beeasily accessible, stable, selective, respond to all types of biologically important antioxidants such as ascorbic acid, a-tocopherol, b-carotene, reduced glutathione (GSH), uric acid and bilirubin, regardless of chemical type or hydrophilicity.Currently, there is no rapid method for total antioxidant assay of human serum meeting the above criteria.Methods: Our recently developed cupric reducing antioxidant capacity (CUPRAC) spectrophotometric method for a
number of polyphenols and flavonoids using the copper(II)-neocuproine reagent in ammonium acetate buffer was nowapplied to a complete series of plasma antioxidants for the assay of total antioxidant capacity (TAC) of serum, and theresulting absorbance at 450 nm was recorded either directly (e.g. for ascorbic acid, a-tocopherol and glutathione) or afterincubation at 508C for 20 min (e.g. for uric acid, bilirubin and albumin), quantitation being made by means of a calibrationcurve. The lipophilic antioxidants, a-tocopherol and b-carotene, were assayed in dichloromethane (DCM). Lipophilicantioxidants of serum were extracted with n-hexane from an ethanolic solution of serum subjected to centrifugation.Hydrophilic antioxidants of serum were assayed after perchloric acid precipitation of proteins in the centrifugate.Results: The molar absorptivities, linear ranges and trolox equivalent antioxidant capacity (TEAC) coefficients of the serum
antioxidants were established with respect to the CUPRAC spectrophotometric method, and the results (TEAC, or TEACcoefficients) were evaluated in comparison to the findings of the ABTS/TEAC reference method using persulfate as oxidant.As for hydrophilic phase, a linear correlation existed between the CUPRAC and ABTS findings (r ¼ 0.58), contrary to currentliterature reporting that either serum ORAC or serum ferric reducing antioxidant potency (FRAP) does not correlate at allwith serum TEAC. The analytical responses of serum antioxidants were shown to be additive, enabling a TAC assay. Theintra- and inter-assay CVs were 0.7 and 1.5%, respectively, for serum.Conclusions: The CUPRAC assay proved to be efficient for glutathione and thiol-type antioxidants, for which the FRAP test
was nonresponsive. The findings of CUPRAC completely agreed with those of ABTS-persulfate for lipophilic phase. Theadditivity of absorbances of all the tested antioxidants confirmed that antioxidants in the CUPRAC test did not chemicallyinteract among each other so as to cause an intensification or quenching of the theoretically expected absorbance. As a distinctadvantage over other electron-transfer based assays (e.g. Folin, FRAP, ABTS, DPPH), CUPRAC is superior in regard to itsrealistic pH close to the physiological pH, favourable redox potential, accessibility and stability of reagents and applicability tolipophilic antioxidants as well as hydrophilic ones.
Keywords: CUPRAC antioxidant capacity, human serum, plasma antioxidants, ABTS assay, uric acid, bilirubin
ISSN 1071-5762 print/ISSN 1029-2470 online q 2005 Taylor & Francis Group Ltd
DOI: 10.1080/10715760500210145
Correspondence: R. Apak, Faculty of Engineering, Department of Chemistry, Istanbul University, Avcilar, 34320 Istanbul, Turkey.Tel: 90 212 473 7028. Fax: 90 212 473 7179. E-mail: [email protected]
Free Radical Research, September 2005; 39(9): 949–961
Downloaded By: [TÜBTAK EKUAL] At: 07:44 18 September 2009
Introduction
When natural defenses of the organism (of enzymatic,
non-enzymatic or dietary origin) are overwhelmed by
an excessive generation of reactive oxygen species, a
situation of oxidative stress occurs, in which cellular
and extracellular macromolecules (proteins, lipids and
nucleic acids) can suffer oxidative damage, causing
tissue injury [1,2]. Living organisms have developed
complex antioxidant systems to counteract reactive
species and to reduce their oxidative damage [3].
These antioxidant systems include enzymes such as
superoxide dismutase, catalase and glutathione per-
oxidase [4]; macromolecules such as albumin,
ceruloplasmin and ferritin; and an array of small
molecules, including ascorbic acid, a-tocopherol, b-
carotene, ubiquinol-10, glutathione (GSH), methion-
ine, uric acid and bilirubin [5]. Several methods have
been developed to measure the TAC of biological
fluids such as human serum or plasma [6–13], and
these have been discussed in relevant reviews [14,15].
Antioxidant activity assay methods existing in litera-
ture based on the measurement of radical scavenging
activity of antioxidant compounds suffer from the
difficulties encountered in the formation and stability
of colored radicals [16] such as ABTS (2,20-azinobis-
(3-ethylbenzothiazoline-6-sulfonic acid)) [9] and
DPPH (2,20-diphenyl-1-picrylhydrazyl) [17]. Re et al.
developed an improved ABTS radical cation decolor-
ization assay using persulfate as the oxidant, and
thereby compensated for the weaknesses of the
original ferryl myoglobulin/ABTS assay [18]. The
total radical trapping parameter (TRAP) assay of
Wayner et al. [6] was the most widely used method of
measuring total antioxidant capacity (TAC) of plasma
or serum during the last decade. However, it suffered
from the major drawback of oxygen electrode end-
point in that the electrode would not maintain its
stability over the required time period [19]. Anti-
oxidant assays based on spectrophotometric methods
of thiobarbituric acid-reactive substances (TBARS)
formation have poor reproducibility due to instability
of substrates used for lipid peroxidation [20]. The
inhibition of accumulation of colored radical reagents
in the presence of antioxidants is expressed in the units
of “lag time” (i.e. the time period required for the
colored radical to emerge in the reaction medium),
constituting a rather unobjective approach for anti-
oxidant assay, because “lag time” is not always linearly
correlated to antioxidant concentration. The major
limitation of the ORACPE (ORAC test based on B-
phycoerythrin: B-PE) has been reported to be the use
of B-PE as the fluorescent probe, in that B-PE
produces inconsistency from lot to lot, resulting in
variable reactivity to peroxyl radical, and additionally,
B-PE is not photostable and can be bleached after
extended exposure to excitation radiation. How-
ever, the alternative fluorescent probe, fluorescein,
developed to overcome the drawbacks of B-PE,
reports extremely high ORAC values (as trolox
equivalents) for a number of antioxidant compounds
that are quite inconsistent with those of conventional
assays [21]. On the other hand, the ferric reducing
antioxidant potency (FRAP) assay of antioxidants
[13], which is based on ferric-to-ferrous reduction in
the presence of a Fe(II)-stabilizing ligand such as
tripyridyltriazine (TPTZ), is both unrealistic (i.e. the
colored complex is formed at a definitely acidic pH
such as pH ¼ 3.6, much lower than the physiological
pH) and insufficiently reactive to thiol-type (i.e. ZSH
containing) antioxidants like cysteine and glutathione
[22].
The range of tests used for antioxidant activity
measurement is a testimony to the uncertainty
surrounding the chemistry of antioxidant compounds.
Thus for example, in tests where free radical oxidation
is induced by a metal ion like Cu(II) or Fe(III), it is
uncertain whether the test measures the ability of the
antioxidant to interact with a free radical or its ability
to bind the metal ion [23]. Current literature taking a
philosophical look at antioxidant indexes clearly states
that there is no “total antioxidant” as a nutritional
index available for food labeling because of the lack of
standard quantitation methods [24]. As a result, the
antioxidant activities of common vegetables (total
sample size: 927) collected from the US market,
analyzed using the ORAC and FRAP procedures, did
not correlate well [24]. Exactly, a similar situation
exists for human plasma or serum where different tests
yield different results that do not correlate well. For
example, Cao and Prior observed a weak linear
correlation between serum ORAC and serum FRAP,
but no correlation either between serum ORAC and
serum TEAC, or between serum FRAP and serum
TEAC [3]. Total antioxidant capacity assays measure
the capacity of biological samples only under defined
conditions prescribed by the given method using
different oxidants in each case. If the standard
potential of the oxidant is too high (e.g. the potential
of the ferric–ferrous couple is 0.77 V, that may
significantly increase in the presence of ferrous-
stabilizing ligands such as TPTZ or phenanthroline),
then compounds other than the plasma antioxidants
of interest, like glucose or citrate, the latter being used
to preserve the plasma, may also be oxidized causing
positive error. Some methods measure only the
hydrophilic antioxidants, without caring for the
lipophilic ones. Not all methods measure protein-
thiols, or smaller molecule ZSH compounds of
different origin (such as GSH, with FRAP). To briefly
summarize the current situation, there is no single,
widely-acceptable assay method applicable to a
reasonable variety of compounds in plasma and food
matrices. Thus the aim of this work is to develop
a simple, widely applicable antioxidant capacity
index for human serum, as successively performed
R. Apak et al.950
Downloaded By: [TÜBTAK EKUAL] At: 07:44 18 September 2009
previously for dietary polyphenols, vitamins C and E
[25], utilizing the copper(II)–neocuproine (Cu(II)–
Nc) reagent as the chromogenic oxidizing agent. Since
copper(II) (or cupric) ion reducing ability is
measured, the method is named by our research
group as cupric reducing antioxidant capacity
(CUPRAC) method. This method should be advan-
tageous over FRAP since the redox chemistry of
copper(II)—as opposed to that of chemically inert
high-spin ferric ion having half-filled d-orbitals in its
electronic configuration—should involve faster kin-
etics. Since the optimal pH of the method is close to
the physiological one, there would be no risk of
underestimation (under acidic conditions) or over-
estimation (under basic conditions) of TAC, due to
either protonation of antioxidants or proton dis-
sociation of phenolic compounds, respectively [15].
As in similar electron-transfer based assays, the
antioxidant capacity is assumed to be equal to
reducing capacity [15].
Materials and methods
Chemicals and instruments
Uric acid, ascorbic acid and neocuproine (2,9-dimethyl-
1,10-phenanthroline) were purchased from Sigma
Chemical Co.; trolox (6-hydroxy-2,5,7,8-tetramethyl-
chroman-2-carboxylic acid) from Aldrich Chem. Co.;
glutathione (reduced, GSH),a-tocopherol, ammonium
acetate, copper(II) chloride, albumin fraction V (from
bovine serum, BSA), potassium persulfate, dichloro-
methane (DCM) and 96% ethanol from E. Merck,
b-carotene, bilirubin, ABTS (2,20-azinobis(3- ethyl-
benzothiazoline-6-sulfonic acid) diammonium salt) and
ascorbate oxidase from Fluka Chemicals and n-hexane
from Riedel-deHaen. Serum samples from healthy
adults were supplied freshly from Istanbul University,
Cerrahpasa Faculty of Medicine, Central Laboratory,
Istanbul, Turkey and citrated for a longer standing to
access whenever necessary.
The absorbance measurements after reaction of
serum antioxidant compounds and human serum
samples with the CUPRAC reagent were made with
the aid of a Varian CARY 1E UV–Vis spectro-
photometer using a pair of matched quartz cuvettes.
Serum centrifugation was made with a MSE Mistral
2000 centrifuge apparatus using 10 cm-tubes of
1.5 cm diameter. The pH measurements were made
with a E512 Metrohm Herisau pH-meter equipped
with a combined glass electrode.
Serum extraction
Plasma or serum samples that were freshly collected
and kept at þ48C in a refrigerator just prior to analysis
(or stored at 2708C as necessary, were thawed
slowly), mixed well on a vortex, and centrifuged if
needed. Serum extraction was based upon the
procedure published by Aebischer et al. [26], and
applied to plasma and serum samples by Prior et al.
[27]. One ml of such a (serum) sample was transferred
to a centrifuge tube, 2 ml of 96% ethanol and 1 ml of
distilled water were added, and mixed well. Four
milliliters of n-hexane were added to the mixture,
again mixed and the final mixture was let to stand for a
few minutes for the separation of phases. The solution
was centrifuged at 5000 rpm (1500g) for 5 min. The
upper organic phase was separated, and transfered to a
dark tube. The procedure was repeated with extra 4 ml
of hexane, i.e. 4 ml hexane was added to the remaining
aqueous phase, mixed well, let to stand for a few
minutes for the separation of phases and centrifuged
again at 5000 rpm for 5 min. This second hexane
extract was separated, and transferred to the original
dark tube so as to combine with the first extract. The
organic solution comprising combined hexane
extracts was dried down under N2 flow, and the
residue was taken up with 1 ml of DCM for the assay
of lipophilic antioxidants. The above procedure was
repeated 8 times for the serum sample: The DCM
phases were combined for the assay of lipophilic
antioxidants.
The minute amounts of hexane remaining in the
aqueous phase of each tube was removed by drying
under nitrogen. Protein content of each tube was
precipitated by adding 4 ml of 0.5 M HClO4. The
nature and relative quantity of this precipitant was as
optimized by Prior et al. [27]. The aqueous solution
was centrifuged at 5000 rpm (1500g) for 5 min. The
upper clear phases of 8 tubes were combined for the
assay of hydrophilic antioxidants. The combined
acidic aqueous phase was neutralized with 10.1 ml of
1.0 M NaOH prior to analysis. Thus the serum was
separated into two phases for the assay of lipophilic
and hydrophilic antioxidants. For the application of
standard addition technique (so as to observe whether
the calibration curve of a given antioxidant compound
in standard-added serum was parallel to the one
obtained with the sole antioxidant), the lipophilic
antioxidants, a-tocopherol and b-carotene were
added one by one to the organic phase, and the
hydrophilic antioxidants, bilirubin, uric acid, ascorbic
acid, glutathione (GSH) and albumin were added one
by one to the aqueous phase.
Preparation of standard solutions of CUPRAC reagents
and plasma antioxidants
The CUPRAC reagent solutions were prepared as
described in the original CUPRAC method developed
for flavonoids [25]. Copper(II) chloride solution at a
concentration of 1022 M was prepared from CuCl2·2-
H2O weighing 0.4262 g, dissolving in H2O and
diluting to 250 ml with water. Ammonium acetate
(NH4Ac) buffer at pH ¼ 7.0 was prepared by
The CUPRAC method 951
Downloaded By: [TÜBTAK EKUAL] At: 07:44 18 September 2009
dissolving 19.27 g of NH4Ac in water and diluting to
250 ml. Neocuproine (Nc) solution at a concentration
of 7.5 £ 1023 M was prepared by dissolving 0.039 g
Nc in 96% EtOH, and diluting to 25 ml with ethanol.
The standard solutions of plasma antioxidants were
prepared at 1.0 £ 1023 M concentration. a-Toco-
pherol and b-carotene were dissolved in dichloro-
methane (DCM), and the b-carotene solution was
further diluted with the same solvent at 1:50 volume
ratio. Ascorbic acid and glutathione (GSH) solutions
were prepared in distilled water. Uric acid (0.0168 g)
was dissolved in 20 ml of 0.01 M NaOH, the excess
base was neutralized with the addition of 0.01 M HCl,
and finally diluted to 100 ml with H2O. Bilirubin
(0.0146 g) was dissolved using 1 ml of 0.1 M NaOH,
excess base was neutralized with 0.1 M HCl, and
finally diluted to 25 ml with water.
Standard addition method applied to organic extract of
serum
To a test tube were added 1 ml each of copper(II)
chloride solution, neocuproine solution and NH4Ac
buffer solutions in this order. A suitable aliquot
(0.8 ml) of the combined organic extract (of serum)
was added to this tube (such that the initial
absorbance of this extract with respect to the
CUPRAC spectrophotometric method would be
around 0.2). To this mixture, 3.2 ml of DCM were
added, shaken and the organic phase was separated
from the aqueous phase. Standard additions of a-
tocopherol and b-carotene in varying concentrations
were made to the serum (organic) extract so as to
construct the calibration curves of these lipophilic
antioxidants in organic serum extract of initial
absorbance around 0.2. Absorbance reading was
made against a reagent blank at 450 nm. Since the
boiling temperature of DCM was low, the DCM used
in the procedure was cooled to an initial temperature
of þ48C to prevent evaporation losses. No elevated
temperature incubation tests (as applied to hydro-
philic antioxidants in the aqueous phase) were carried
out with the organic extract.
Standard addition method applied to aqueous extract of
serum
To a test tube were added 1 mL each of copper(II)
chloride solution, neocuproine solution and NH4Ac
buffer solution in this order. A suitable aliquot
(1.5 ml) of the combined aqueous extract (of serum)
was added to this tube (such that the initial
absorbance of this extract with respect to the
CUPRAC spectrophotometric method would be
around 0.2). Standard additions of bilirubin, uric
acid, ascorbic acid and GSH in varying concentrations
were made to this extract so as to construct the
calibration curves of these hydrophilic antioxidants in
aqueous serum extract of initial absorbance around
0.2. If (x) ml of the standard antioxidant solution was
taken, then (0.25 2 x) ml H2O was added to make the
final volume 4.75 ml. For dilution experiments of
serum, 1.5 ml of the combined aqueous extract
diluted with water at ratios varying between 1:1 and
1:10 was treated as the unknown sample, and 1.5 ml of
this final diluted sample was subjected to CUPRAC
analysis as stated above. Absorbance reading was
made against a reagent blank at 450 nm. All
hydrophilic antioxidants reacted instantly with the
CUPRAC reagent except uric acid and bilirubin,
which showed a slight absorbance increase upon
standing at room temperature. Therefore, absorbance
readings were recorded 30 min after the mixing of
analyte solution with reagents. The results were
evaluated by means of a calibration curve (line) for
each antioxidant. Comparison with trolox as the
reference compound was made using the room
temperature molar absorptivity of trolox, i.e. 1.67 £
104 l mol21 cm21.
Standard addition method applied to aqueous extract of
serum with incubation
The standard addition method applied to aqueous
extract of serum was followed with the single
difference of extract volume taken for analysis (i.e.
0.7 ml of combined aqueous extract of serum was
suitable so that it would yield an initial absorbance of
0.2 with respect to the CUPRAC method). After the
addition of (x) ml of standard hydrophilic antioxidant
(bilirubin, uric acid, GSH and BSA) solutions,
dilution was made with H2O to 4.75 ml. The tubes
were stoppered, and incubated at 508C in a water bath
for 20 min. (Tests were also performed to follow the
color development kinetics of hydrophilic antioxidants
for longer incubation periods at this temperature).
The incubation period was selected with respect to the
kinetic behavior of bilirubin, which required 20 min at
508C for absorbance stabilization. Data for ascorbic
acid was not collected at this stage, because ascorbic
acid decomposed at elevated temperature incubation.
The incubated tubes were let to cool to room
temperature, and the 450 nm-absorbance was read
as stated. The results were evaluated by means of a
calibration curve (line) for each antioxidant. Com-
parison with trolox as the reference compound was
made using the 508C-incubated molar absorptivity of
trolox, i.e. 1.86 £ 104 l mol21 cm21.
Individual determination of ascorbic acid among
hydrophilic serum antioxidants
The original ascorbate oxidase enzyme solution of
initial activity 328 U/mg was diluted with water to a
concentration of 4 U/ml. To a separate test tube was
added 0.100 ml of 1023 M ascorbic acid, and analyzed
R. Apak et al.952
Downloaded By: [TÜBTAK EKUAL] At: 07:44 18 September 2009
conventionally with the CUPRAC method to yield an
absorbance of 0.30. To another tube containing the
same amount (0.100 ml) of ascorbic acid solution was
added 0.200 ml of ascorbate oxidase solution, let to
stand for 1 min, and analyzed with the CUPRAC
method to observe at least 90% quenching of the
absorbance due to ascorbic acid (A450 ¼ 0.03).
A synthetic mixture of hydrophilic antioxidants was
prepared to include 0.050 ml uric acid, 0.050 ml GSH
and 0.100 ml ascorbic acid standard solutions. The
CUPRAC absorbance of this mixture was 0.57. To
another tube containing the same antioxidants
mixture (with identical amounts) was added
0.200 ml ascorbate oxidase solution, and subsequently
analyzed with the CUPRAC method to yield an
absorbance of 0.26, the absorbance difference
corresponding to ascorbic acid content of the mixture.
Thus it was shown that ascorbic acid among
hydrophilic antioxidants of serum could be individu-
ally quantified by the aid of two successive CUPRAC
measurements of the antioxidant mixture with and
without ascorbate oxidase, the ascorbic acid content
being calculated from the difference.
ABTS assay of total antioxidant capacity of serum
antioxidants
The ABTS-persulfate assay of Re et al. [18] was
slightly modified for serum antioxidant assay. An
ABTS chromogenic radical reagent solution at
7.0 mM concentration was prepared in water. To
this solution was added K2S2O8 (as an oxidant for
conversion of ABTS into a radical cation) to yield a
final persulfate concentration of 2.45 mM. The color
of the resulting solution was blue–green. This radical
solution was kept in a stoppered flask in the dark at
room temperature for 12–16 h before use in actual
measurements. The kept solution was diluted with
96% ethanol at a ratio of 1:10. The absorbance of the
1:10 diluted ABTSþ radical cation solution was
1.28 ^ 0.04 at 734 nm. To (x) ml of the sample
solution (aqueous extract of serum) were added 1 ml
of final ABTSþ solution, and (4 2 x) ml of 96%
EtOH, and the change of absorbance during 6 min
was recorded (usually the absorbance decrease at the
6th-min was used for calculations). As a convention,
(x) was selected between 0.5 and 1.0 ml for the
organic and aqueous extracts of serum, and the total
volume was 5.0 ml.
Results and discussion
The copper(II)-neocuproine (2,9-dimethyl-1,10-phe-
nanthroline) reagent, introduced for various reducing
agents as a mild oxidant [28], was previously used by
our research team to determine the biochemically
important reductants such as cysteine [29] and
vitamin E [30]. It has recently been used for ascorbic
acid assay in foods and beverages [31], and for
flavonoids as a total antioxidant capacity assay
(CUPRAC assay) of food materials [25]. The
antioxidant potency of flavonoids of similar conju-
gation level was roughly proportional to the total
number of ZOH groups in the CUPRAC assay, and
was positively affected by the presence of o-dihydroxy
moiety in the B-ring [25].
The trolox equivalent antioxidant capacity (TEAC)
is defined as the millimolar concentration of a trolox
solution having the antioxidant capacity equivalent to
a 1.0 mM solution of the substance under investi-
gation. The TEAC values of various antioxidants
found according to the original ABTS method
(TEACorig) [9,32], FRAP method (TEACFRAP)
[13,33] and calculated with respect to the developed
CUPRAC method (TEACCUPRAC) were very close to
each other, except for hydroxycinnamic acids [25] for
which the results of the CUPRAC method were more
consistent with structure–activity relationships than
those of the ABTS assay. The TEACCUPRAC
coefficients are simply calculated by dividing the
molar absorptivity (1) of the species under investi-
gation by that of trolox under corresponding
conditions (e.g. the 1 values of normal and incubated
solutions of trolox are 1.67 £ 104 and 1.86 £
104 l mol21 cm21, respectively).
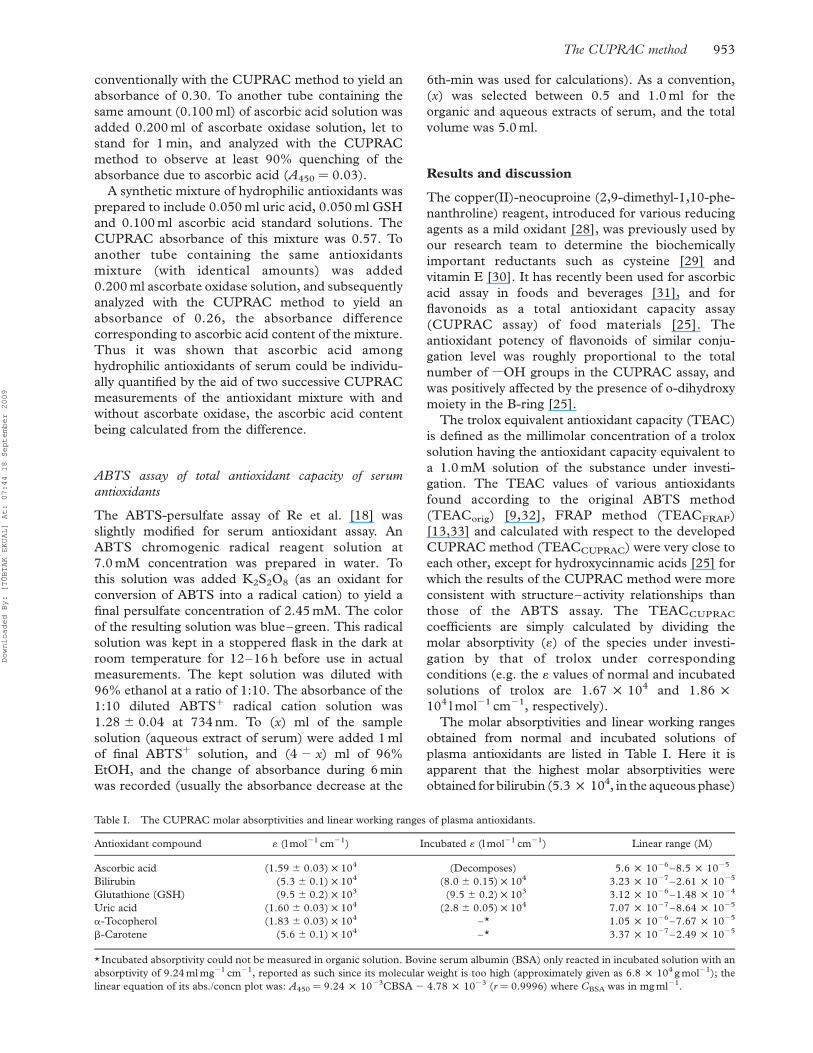
The molar absorptivities and linear working ranges
obtained from normal and incubated solutions of
plasma antioxidants are listed in Table I. Here it is
apparent that the highest molar absorptivities were
obtained for bilirubin (5.3 £ 104, in the aqueous phase)
Table I. The CUPRAC molar absorptivities and linear working ranges of plasma antioxidants.
Antioxidant compound 1 (l mol21 cm21) Incubated 1 (l mol21 cm21) Linear range (M)
Ascorbic acid (1.59 ^ 0.03) £ 104 (Decomposes) 5.6 £ 1026–8.5 £ 1025
Bilirubin (5.3 ^ 0.1) £ 104 (8.0 ^ 0.15) £ 104 3.23 £ 1027–2.61 £ 1025
Glutathione (GSH) (9.5 ^ 0.2) £ 103 (9.5 ^ 0.2) £ 103 3.12 £ 1026–1.48 £ 1024
Uric acid (1.60 ^ 0.03) £ 104 (2.8 ^ 0.05) £ 104 7.07 £ 1027–8.64 £ 1025
a-Tocopherol (1.83 ^ 0.03) £ 104 –* 1.05 £ 1026–7.67 £ 1025
b-Carotene (5.6 ^ 0.1) £ 104 –* 3.37 £ 1027–2.49 £ 1025
* Incubated absorptivity could not be measured in organic solution. Bovine serum albumin (BSA) only reacted in incubated solution with an
absorptivity of 9.24 ml mg21 cm21, reported as such since its molecular weight is too high (approximately given as 6.8 £ 104 g mol21); the
linear equation of its abs./concn plot was: A450 ¼ 9.24 £ 1023CBSA 2 4.78 £ 1023 (r ¼ 0.9996) where CBSA was in mg ml21.
The CUPRAC method 953
Downloaded By: [TÜBTAK EKUAL] At: 07:44 18 September 2009
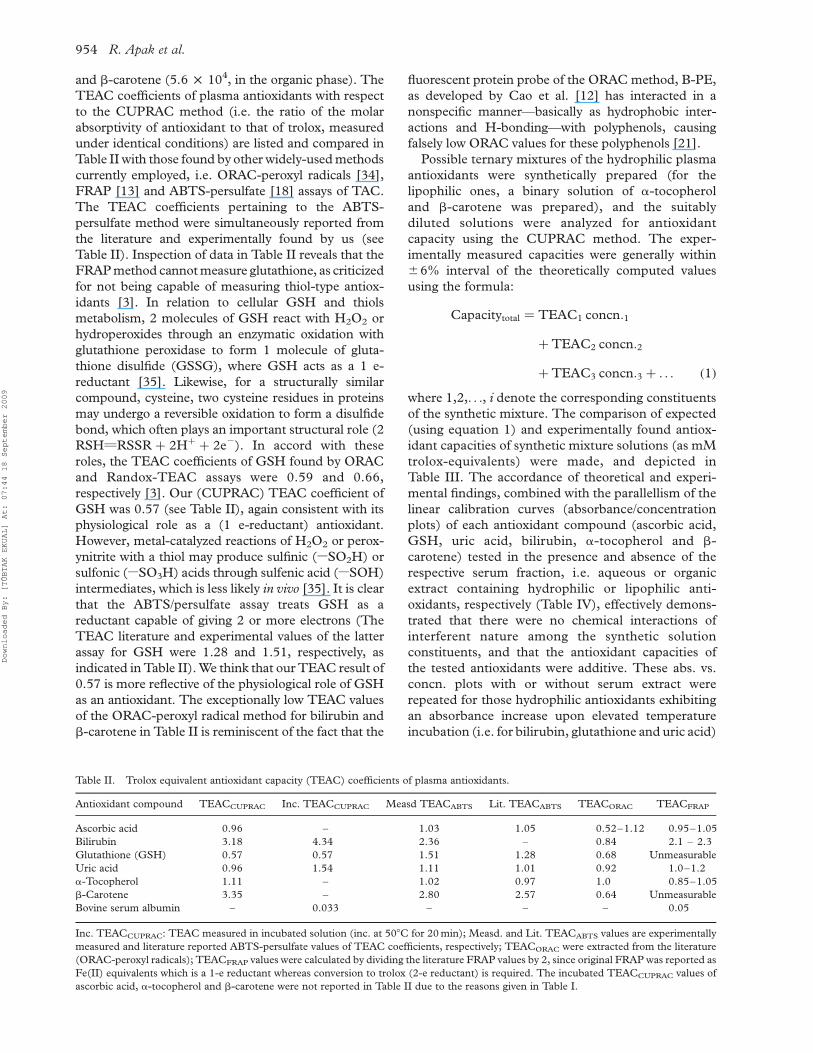
and b-carotene (5.6 £ 104, in the organic phase). The
TEAC coefficients of plasma antioxidants with respect
to the CUPRAC method (i.e. the ratio of the molar
absorptivity of antioxidant to that of trolox, measured
under identical conditions) are listed and compared in
Table II with those found by other widely-used methods
currently employed, i.e. ORAC-peroxyl radicals [34],
FRAP [13] and ABTS-persulfate [18] assays of TAC.
The TEAC coefficients pertaining to the ABTS-
persulfate method were simultaneously reported from
the literature and experimentally found by us (see
Table II). Inspection of data in Table II reveals that the
FRAP method cannot measure glutathione, as criticized
for not being capable of measuring thiol-type antiox-
idants [3]. In relation to cellular GSH and thiols
metabolism, 2 molecules of GSH react with H2O2 or
hydroperoxides through an enzymatic oxidation with
glutathione peroxidase to form 1 molecule of gluta-
thione disulfide (GSSG), where GSH acts as a 1 e-
reductant [35]. Likewise, for a structurally similar
compound, cysteine, two cysteine residues in proteins
may undergo a reversible oxidation to form a disulfide
bond, which often plays an important structural role (2
RSHvRSSR þ 2Hþ þ 2e2). In accord with these
roles, the TEAC coefficients of GSH found by ORAC
and Randox-TEAC assays were 0.59 and 0.66,
respectively [3]. Our (CUPRAC) TEAC coefficient of
GSH was 0.57 (see Table II), again consistent with its
physiological role as a (1 e-reductant) antioxidant.
However, metal-catalyzed reactions of H2O2 or perox-
ynitrite with a thiol may produce sulfinic (ZSO2H) or
sulfonic (ZSO3H) acids through sulfenic acid (ZSOH)
intermediates, which is less likely in vivo [35]. It is clear
that the ABTS/persulfate assay treats GSH as a
reductant capable of giving 2 or more electrons (The
TEAC literature and experimental values of the latter
assay for GSH were 1.28 and 1.51, respectively, as
indicated in Table II). We think that our TEAC result of
0.57 is more reflective of the physiological role of GSH
as an antioxidant. The exceptionally low TEAC values
of the ORAC-peroxyl radical method for bilirubin and
b-carotene in Table II is reminiscent of the fact that the
fluorescent protein probe of the ORAC method, B-PE,
as developed by Cao et al. [12] has interacted in a
nonspecific manner—basically as hydrophobic inter-
actions and H-bonding—with polyphenols, causing
falsely low ORAC values for these polyphenols [21].
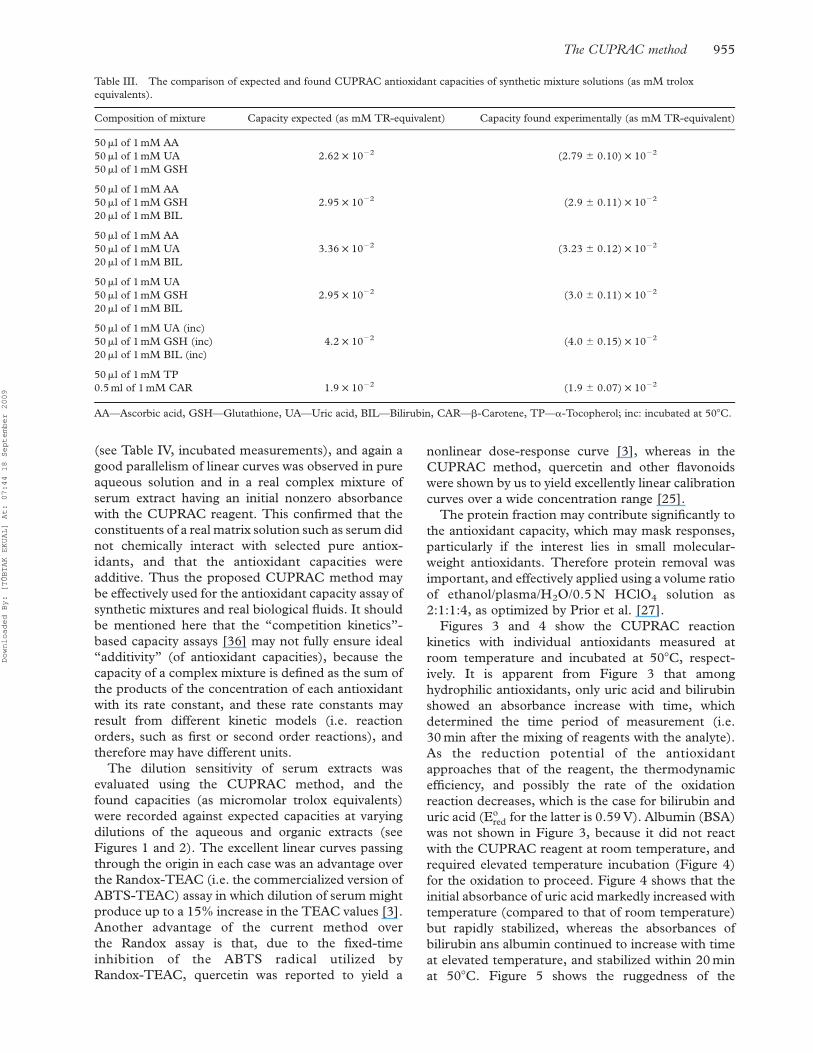
Possible ternary mixtures of the hydrophilic plasma
antioxidants were synthetically prepared (for the
lipophilic ones, a binary solution of a-tocopherol
and b-carotene was prepared), and the suitably
diluted solutions were analyzed for antioxidant
capacity using the CUPRAC method. The exper-
imentally measured capacities were generally within
^6% interval of the theoretically computed values
using the formula:
Capacitytotal ¼ TEAC1 concn:1
þ TEAC2 concn:2
þ TEAC3 concn:3 þ . . . ð1Þ
where 1,2,. . ., i denote the corresponding constituents
of the synthetic mixture. The comparison of expected
(using equation 1) and experimentally found antiox-
idant capacities of synthetic mixture solutions (as mM
trolox-equivalents) were made, and depicted in
Table III. The accordance of theoretical and experi-
mental findings, combined with the parallellism of the
linear calibration curves (absorbance/concentration
plots) of each antioxidant compound (ascorbic acid,
GSH, uric acid, bilirubin, a-tocopherol and b-
carotene) tested in the presence and absence of the
respective serum fraction, i.e. aqueous or organic
extract containing hydrophilic or lipophilic anti-
oxidants, respectively (Table IV), effectively demons-
trated that there were no chemical interactions of
interferent nature among the synthetic solution
constituents, and that the antioxidant capacities of
the tested antioxidants were additive. These abs. vs.
concn. plots with or without serum extract were
repeated for those hydrophilic antioxidants exhibiting
an absorbance increase upon elevated temperature
incubation (i.e. for bilirubin, glutathione and uric acid)
Table II. Trolox equivalent antioxidant capacity (TEAC) coefficients of plasma antioxidants.
Antioxidant compound TEACCUPRAC Inc. TEACCUPRAC Measd TEACABTS Lit. TEACABTS TEACORAC TEACFRAP
Ascorbic acid 0.96 – 1.03 1.05 0.52–1.12 0.95–1.05
Bilirubin 3.18 4.34 2.36 – 0.84 2.1 – 2.3
Glutathione (GSH) 0.57 0.57 1.51 1.28 0.68 Unmeasurable
Uric acid 0.96 1.54 1.11 1.01 0.92 1.0–1.2
a-Tocopherol 1.11 – 1.02 0.97 1.0 0.85–1.05
b-Carotene 3.35 – 2.80 2.57 0.64 Unmeasurable
Bovine serum albumin – 0.033 – – – 0.05
Inc. TEACCUPRAC: TEAC measured in incubated solution (inc. at 508C for 20 min); Measd. and Lit. TEACABTS values are experimentally
measured and literature reported ABTS-persulfate values of TEAC coefficients, respectively; TEACORAC were extracted from the literature
(ORAC-peroxyl radicals); TEACFRAP values were calculated by dividing the literature FRAP values by 2, since original FRAP was reported as
Fe(II) equivalents which is a 1-e reductant whereas conversion to trolox (2-e reductant) is required. The incubated TEACCUPRAC values of
ascorbic acid, a-tocopherol and b-carotene were not reported in Table II due to the reasons given in Table I.
R. Apak et al.954
Downloaded By: [TÜBTAK EKUAL] At: 07:44 18 September 2009
(see Table IV, incubated measurements), and again a
good parallelism of linear curves was observed in pure
aqueous solution and in a real complex mixture of
serum extract having an initial nonzero absorbance
with the CUPRAC reagent. This confirmed that the
constituents of a real matrix solution such as serum did
not chemically interact with selected pure antiox-
idants, and that the antioxidant capacities were
additive. Thus the proposed CUPRAC method may
be effectively used for the antioxidant capacity assay of
synthetic mixtures and real biological fluids. It should
be mentioned here that the “competition kinetics”-
based capacity assays [36] may not fully ensure ideal
“additivity” (of antioxidant capacities), because the
capacity of a complex mixture is defined as the sum of
the products of the concentration of each antioxidant
with its rate constant, and these rate constants may
result from different kinetic models (i.e. reaction
orders, such as first or second order reactions), and
therefore may have different units.
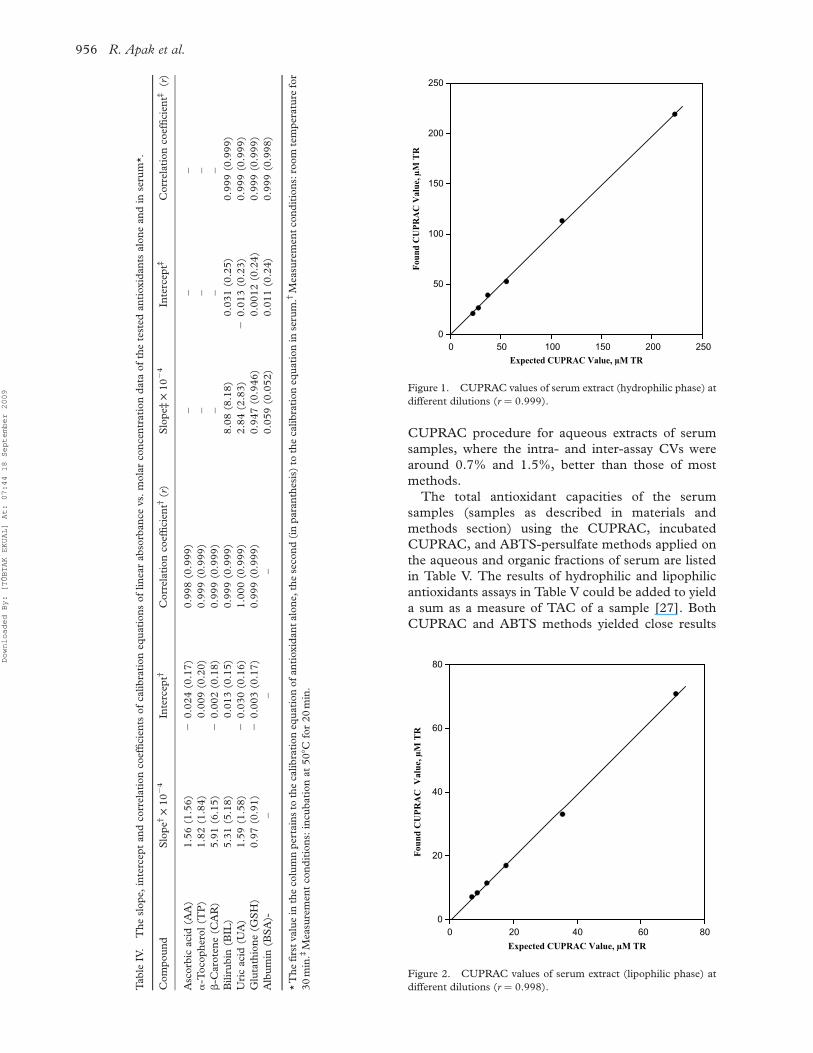
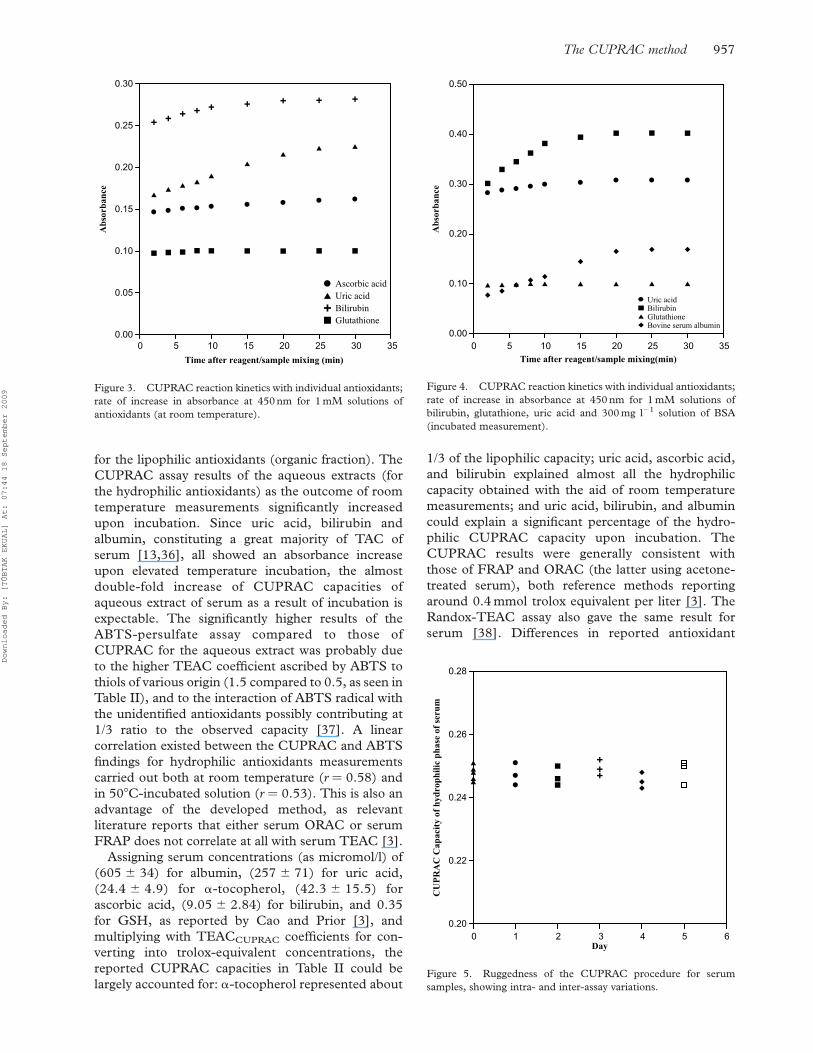
The dilution sensitivity of serum extracts was
evaluated using the CUPRAC method, and the
found capacities (as micromolar trolox equivalents)
were recorded against expected capacities at varying
dilutions of the aqueous and organic extracts (see
Figures 1 and 2). The excellent linear curves passing
through the origin in each case was an advantage over
the Randox-TEAC (i.e. the commercialized version of
ABTS-TEAC) assay in which dilution of serum might
produce up to a 15% increase in the TEAC values [3].
Another advantage of the current method over
the Randox assay is that, due to the fixed-time
inhibition of the ABTS radical utilized by
Randox-TEAC, quercetin was reported to yield a
nonlinear dose-response curve [3], whereas in the
CUPRAC method, quercetin and other flavonoids
were shown by us to yield excellently linear calibration
curves over a wide concentration range [25].
The protein fraction may contribute significantly to
the antioxidant capacity, which may mask responses,
particularly if the interest lies in small molecular-
weight antioxidants. Therefore protein removal was
important, and effectively applied using a volume ratio
of ethanol/plasma/H2O/0.5 N HClO4 solution as
2:1:1:4, as optimized by Prior et al. [27].
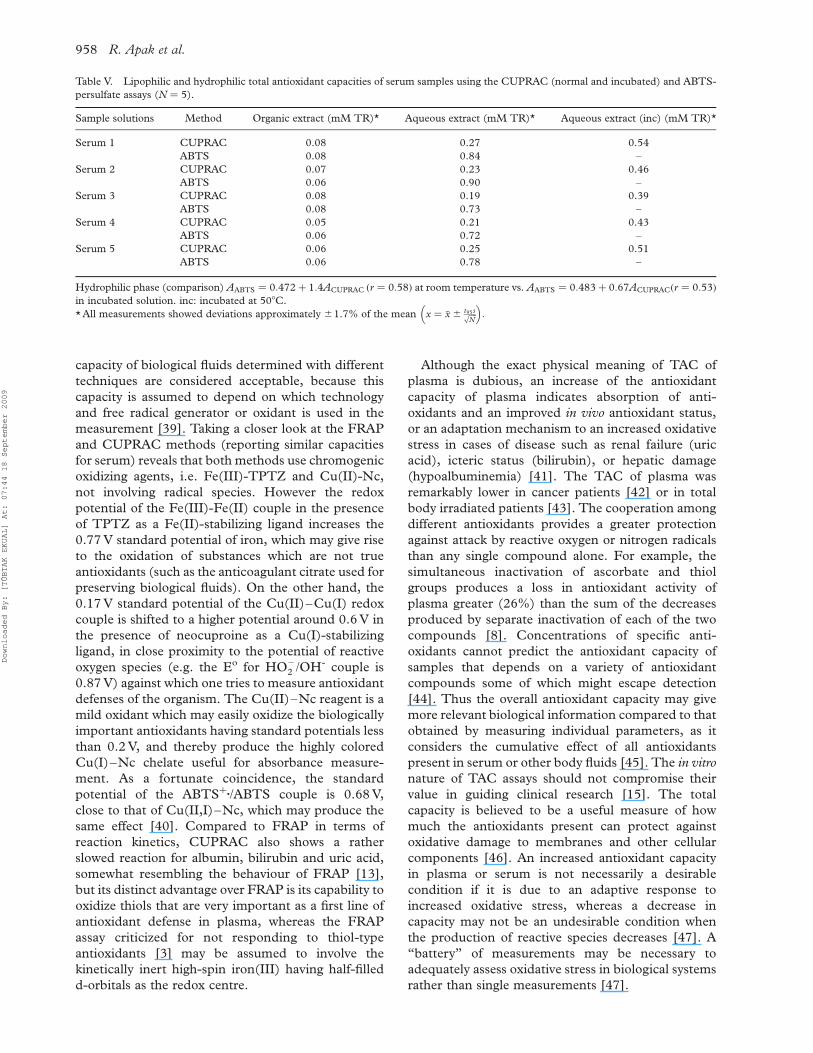
Figures 3 and 4 show the CUPRAC reaction
kinetics with individual antioxidants measured at
room temperature and incubated at 508C, respect-
ively. It is apparent from Figure 3 that among
hydrophilic antioxidants, only uric acid and bilirubin
showed an absorbance increase with time, which
determined the time period of measurement (i.e.
30 min after the mixing of reagents with the analyte).
As the reduction potential of the antioxidant
approaches that of the reagent, the thermodynamic
efficiency, and possibly the rate of the oxidation
reaction decreases, which is the case for bilirubin and
uric acid (Eored for the latter is 0.59 V). Albumin (BSA)
was not shown in Figure 3, because it did not react
with the CUPRAC reagent at room temperature, and
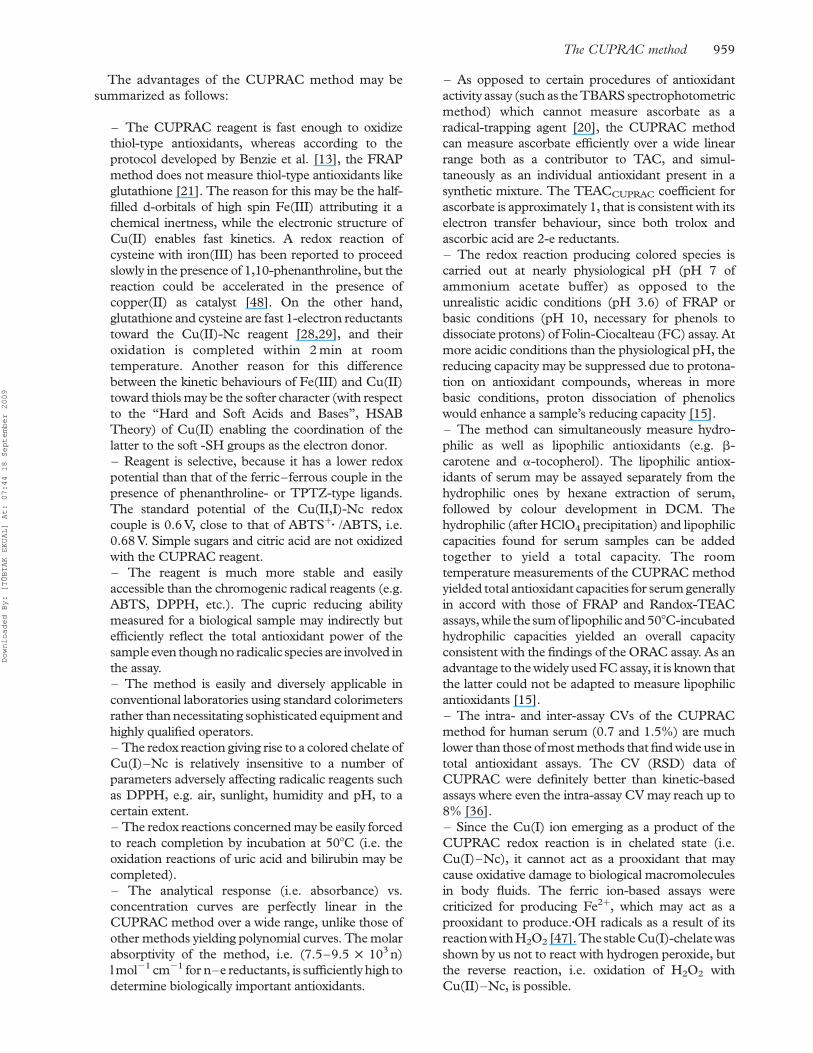
required elevated temperature incubation (Figure 4)
for the oxidation to proceed. Figure 4 shows that the
initial absorbance of uric acid markedly increased with
temperature (compared to that of room temperature)
but rapidly stabilized, whereas the absorbances of
bilirubin ans albumin continued to increase with time
at elevated temperature, and stabilized within 20 min
at 508C. Figure 5 shows the ruggedness of the
Table III. The comparison of expected and found CUPRAC antioxidant capacities of synthetic mixture solutions (as mM trolox
equivalents).
Composition of mixture Capacity expected (as mM TR-equivalent) Capacity found experimentally (as mM TR-equivalent)
50ml of 1 mM AA
50ml of 1 mM UA 2.62 £ 1022 (2.79 ^ 0.10) £ 1022
50ml of 1 mM GSH
50ml of 1 mM AA
50ml of 1 mM GSH 2.95 £ 1022 (2.9 ^ 0.11) £ 1022
20ml of 1 mM BIL
50ml of 1 mM AA
50ml of 1 mM UA 3.36 £ 1022 (3.23 ^ 0.12) £ 1022
20ml of 1 mM BIL
50ml of 1 mM UA
50ml of 1 mM GSH 2.95 £ 1022 (3.0 ^ 0.11) £ 1022
20ml of 1 mM BIL
50ml of 1 mM UA (inc)
50ml of 1 mM GSH (inc) 4.2 £ 1022 (4.0 ^ 0.15) £ 1022
20ml of 1 mM BIL (inc)
50ml of 1 mM TP
0.5 ml of 1 mM CAR 1.9 £ 1022 (1.9 ^ 0.07) £ 1022
AA—Ascorbic acid, GSH—Glutathione, UA—Uric acid, BIL—Bilirubin, CAR—b-Carotene, TP—a-Tocopherol; inc: incubated at 508C.
The CUPRAC method 955
Downloaded By: [TÜBTAK EKUAL] At: 07:44 18 September 2009
CUPRAC procedure for aqueous extracts of serum
samples, where the intra- and inter-assay CVs were
around 0.7% and 1.5%, better than those of most
methods.
The total antioxidant capacities of the serum
samples (samples as described in materials and
methods section) using the CUPRAC, incubated
CUPRAC, and ABTS-persulfate methods applied on
the aqueous and organic fractions of serum are listed
in Table V. The results of hydrophilic and lipophilic
antioxidants assays in Table V could be added to yield
a sum as a measure of TAC of a sample [27]. Both
CUPRAC and ABTS methods yielded close results
Figure 1. CUPRAC values of serum extract (hydrophilic phase) at
different dilutions (r ¼ 0.999).
Figure 2. CUPRAC values of serum extract (lipophilic phase) at
different dilutions (r ¼ 0.998).Tab
leIV
.T
he
slop
e,in
terc
ept
an
dco
rrel
ati
on
coef
fici
ents
of
calib
rati
on
equ
ati
on
sof
lin
ear
ab
sorb
an
cevs.
mola
rco
nce
ntr
ati
on
data
of
the
test
edan
tioxid
an
tsalo
ne
an
din
seru
m*.
Com
pou
nd
Slo
pe†
£102
4In
terc
ept†
Corr
elati
on
coef
fici
ent†
(r)
Slo
pe‡
£102
4In
terc
ept‡
Corr
elati
on
coef
fici
ent‡
(r)
Asc
orb
icaci
d(A
A)
1.5
6(1
.56)
20.0
24
(0.1
7)
0.9
98
(0.9
99)
––
–
a-T
oco
ph
erol
(TP
)1.8
2(1
.84)
0.0
09
(0.2
0)
0.9
99
(0.9
99)
––
–
b-C
aro
ten
e(C
AR
)5.9
1(6
.15)
20.0
02
(0.1
8)
0.9
99
(0.9
99)
––
–
Bilir
ub
in(B
IL)
5.3
1(5
.18)
0.0
13
(0.1
5)
0.9
99
(0.9
99)
8.0
8(8
.18)
0.0
31
(0.2
5)
0.9
99
(0.9
99)
Uri
caci
d(U
A)
1.5
9(1
.58)
20.0
30
(0.1
6)
1.0
00
(0.9
99)
2.8
4(2
.83)
20.0
13
(0.2
3)
0.9
99
(0.9
99)
Glu
tath
ion
e(G
SH
)0.9
7(0
.91)
20.0
03
(0.1
7)
0.9
99
(0.9
99)
0.9
47
(0.9
46)
0.0
012
(0.2
4)
0.9
99
(0.9
99)
Alb
um
in(B
SA
)-–
––
0.0
59
(0.0
52)
0.0
11
(0.2
4)
0.9
99
(0.9
98)
*T
he
firs
tvalu
ein
the
colu
mn
per
tain
sto
the
calibra
tion
equ
ati
on
ofan
tioxid
an
talo
ne,
the
seco
nd
(in
para
nth
esis
)to
the
calibra
tion
equ
ati
on
inse
rum
.†M
easu
rem
ent
con
dit
ion
s:ro
om
tem
per
atu
refo
r
30
min
.‡M
easu
rem
ent
con
dit
ion
s:in
cubati
on
at
508C
for
20
min
.
R. Apak et al.956
Downloaded By: [TÜBTAK EKUAL] At: 07:44 18 September 2009
for the lipophilic antioxidants (organic fraction). The
CUPRAC assay results of the aqueous extracts (for
the hydrophilic antioxidants) as the outcome of room
temperature measurements significantly increased
upon incubation. Since uric acid, bilirubin and
albumin, constituting a great majority of TAC of
serum [13,36], all showed an absorbance increase
upon elevated temperature incubation, the almost
double-fold increase of CUPRAC capacities of
aqueous extract of serum as a result of incubation is
expectable. The significantly higher results of the
ABTS-persulfate assay compared to those of
CUPRAC for the aqueous extract was probably due
to the higher TEAC coefficient ascribed by ABTS to
thiols of various origin (1.5 compared to 0.5, as seen in
Table II), and to the interaction of ABTS radical with
the unidentified antioxidants possibly contributing at
1/3 ratio to the observed capacity [37]. A linear
correlation existed between the CUPRAC and ABTS
findings for hydrophilic antioxidants measurements
carried out both at room temperature (r ¼ 0.58) and
in 508C-incubated solution (r ¼ 0.53). This is also an
advantage of the developed method, as relevant
literature reports that either serum ORAC or serum
FRAP does not correlate at all with serum TEAC [3].
Assigning serum concentrations (as micromol/l) of
(605 ^ 34) for albumin, (257 ^ 71) for uric acid,
(24.4 ^ 4.9) for a-tocopherol, (42.3 ^ 15.5) for
ascorbic acid, (9.05 ^ 2.84) for bilirubin, and 0.35
for GSH, as reported by Cao and Prior [3], and
multiplying with TEACCUPRAC coefficients for con-
verting into trolox-equivalent concentrations, the
reported CUPRAC capacities in Table II could be
largely accounted for: a-tocopherol represented about
1/3 of the lipophilic capacity; uric acid, ascorbic acid,
and bilirubin explained almost all the hydrophilic
capacity obtained with the aid of room temperature
measurements; and uric acid, bilirubin, and albumin
could explain a significant percentage of the hydro-
philic CUPRAC capacity upon incubation. The
CUPRAC results were generally consistent with
those of FRAP and ORAC (the latter using acetone-
treated serum), both reference methods reporting
around 0.4 mmol trolox equivalent per liter [3]. The
Randox-TEAC assay also gave the same result for
serum [38]. Differences in reported antioxidant
Figure 3. CUPRAC reaction kinetics with individual antioxidants;
rate of increase in absorbance at 450 nm for 1 mM solutions of
antioxidants (at room temperature).
Figure 4. CUPRAC reaction kinetics with individual antioxidants;
rate of increase in absorbance at 450 nm for 1 mM solutions of
bilirubin, glutathione, uric acid and 300 mg l21 solution of BSA
(incubated measurement).
Figure 5. Ruggedness of the CUPRAC procedure for serum
samples, showing intra- and inter-assay variations.
The CUPRAC method 957
Downloaded By: [TÜBTAK EKUAL] At: 07:44 18 September 2009
capacity of biological fluids determined with different
techniques are considered acceptable, because this
capacity is assumed to depend on which technology
and free radical generator or oxidant is used in the
measurement [39]. Taking a closer look at the FRAP
and CUPRAC methods (reporting similar capacities
for serum) reveals that both methods use chromogenic
oxidizing agents, i.e. Fe(III)-TPTZ and Cu(II)-Nc,
not involving radical species. However the redox
potential of the Fe(III)-Fe(II) couple in the presence
of TPTZ as a Fe(II)-stabilizing ligand increases the
0.77 V standard potential of iron, which may give rise
to the oxidation of substances which are not true
antioxidants (such as the anticoagulant citrate used for
preserving biological fluids). On the other hand, the
0.17 V standard potential of the Cu(II)–Cu(I) redox
couple is shifted to a higher potential around 0.6 V in
the presence of neocuproine as a Cu(I)-stabilizing
ligand, in close proximity to the potential of reactive
oxygen species (e.g. the Eo for HO22 /OH- couple is
0.87 V) against which one tries to measure antioxidant
defenses of the organism. The Cu(II)–Nc reagent is a
mild oxidant which may easily oxidize the biologically
important antioxidants having standard potentials less
than 0.2 V, and thereby produce the highly colored
Cu(I)–Nc chelate useful for absorbance measure-
ment. As a fortunate coincidence, the standard
potential of the ABTSþz/ABTS couple is 0.68 V,
close to that of Cu(II,I)–Nc, which may produce the
same effect [40]. Compared to FRAP in terms of
reaction kinetics, CUPRAC also shows a rather
slowed reaction for albumin, bilirubin and uric acid,
somewhat resembling the behaviour of FRAP [13],
but its distinct advantage over FRAP is its capability to
oxidize thiols that are very important as a first line of
antioxidant defense in plasma, whereas the FRAP
assay criticized for not responding to thiol-type
antioxidants [3] may be assumed to involve the
kinetically inert high-spin iron(III) having half-filled
d-orbitals as the redox centre.
Although the exact physical meaning of TAC of
plasma is dubious, an increase of the antioxidant
capacity of plasma indicates absorption of anti-
oxidants and an improved in vivo antioxidant status,
or an adaptation mechanism to an increased oxidative
stress in cases of disease such as renal failure (uric
acid), icteric status (bilirubin), or hepatic damage
(hypoalbuminemia) [41]. The TAC of plasma was
remarkably lower in cancer patients [42] or in total
body irradiated patients [43]. The cooperation among
different antioxidants provides a greater protection
against attack by reactive oxygen or nitrogen radicals
than any single compound alone. For example, the
simultaneous inactivation of ascorbate and thiol
groups produces a loss in antioxidant activity of
plasma greater (26%) than the sum of the decreases
produced by separate inactivation of each of the two
compounds [8]. Concentrations of specific anti-
oxidants cannot predict the antioxidant capacity of
samples that depends on a variety of antioxidant
compounds some of which might escape detection
[44]. Thus the overall antioxidant capacity may give
more relevant biological information compared to that
obtained by measuring individual parameters, as it
considers the cumulative effect of all antioxidants
present in serum or other body fluids [45]. The in vitro
nature of TAC assays should not compromise their
value in guiding clinical research [15]. The total
capacity is believed to be a useful measure of how
much the antioxidants present can protect against
oxidative damage to membranes and other cellular
components [46]. An increased antioxidant capacity
in plasma or serum is not necessarily a desirable
condition if it is due to an adaptive response to
increased oxidative stress, whereas a decrease in
capacity may not be an undesirable condition when
the production of reactive species decreases [47]. A
“battery” of measurements may be necessary to
adequately assess oxidative stress in biological systems
rather than single measurements [47].
Table V. Lipophilic and hydrophilic total antioxidant capacities of serum samples using the CUPRAC (normal and incubated) and ABTS-
persulfate assays (N ¼ 5).
Sample solutions Method Organic extract (mM TR)* Aqueous extract (mM TR)* Aqueous extract (inc) (mM TR)*
Serum 1 CUPRAC 0.08 0.27 0.54
ABTS 0.08 0.84 –
Serum 2 CUPRAC 0.07 0.23 0.46
ABTS 0.06 0.90 –
Serum 3 CUPRAC 0.08 0.19 0.39
ABTS 0.08 0.73 –
Serum 4 CUPRAC 0.05 0.21 0.43
ABTS 0.06 0.72 –
Serum 5 CUPRAC 0.06 0.25 0.51
ABTS 0.06 0.78 –
Hydrophilic phase (comparison) AABTS ¼ 0:472 þ 1:4ACUPRAC ðr ¼ 0:58Þ at room temperature vs. AABTS ¼ 0:483 þ 0:67ACUPRACðr ¼ 0:53Þ
in incubated solution. inc: incubated at 508C.
* All measurements showed deviations approximately ^1.7% of the mean x ¼ �x^ t95sffiffiffiffiN
p
� �:
R. Apak et al.958
Downloaded By: [TÜBTAK EKUAL] At: 07:44 18 September 2009
The advantages of the CUPRAC method may be
summarized as follows:
– The CUPRAC reagent is fast enough to oxidize
thiol-type antioxidants, whereas according to the
protocol developed by Benzie et al. [13], the FRAP
method does not measure thiol-type antioxidants like
glutathione [21]. The reason for this may be the half-
filled d-orbitals of high spin Fe(III) attributing it a
chemical inertness, while the electronic structure of
Cu(II) enables fast kinetics. A redox reaction of
cysteine with iron(III) has been reported to proceed
slowly in the presence of 1,10-phenanthroline, but the
reaction could be accelerated in the presence of
copper(II) as catalyst [48]. On the other hand,
glutathione and cysteine are fast 1-electron reductants
toward the Cu(II)-Nc reagent [28,29], and their
oxidation is completed within 2 min at room
temperature. Another reason for this difference
between the kinetic behaviours of Fe(III) and Cu(II)
toward thiols may be the softer character (with respect
to the “Hard and Soft Acids and Bases”, HSAB
Theory) of Cu(II) enabling the coordination of the
latter to the soft -SH groups as the electron donor.
– Reagent is selective, because it has a lower redox
potential than that of the ferric–ferrous couple in the
presence of phenanthroline- or TPTZ-type ligands.
The standard potential of the Cu(II,I)-Nc redox
couple is 0.6 V, close to that of ABTSþz /ABTS, i.e.
0.68 V. Simple sugars and citric acid are not oxidized
with the CUPRAC reagent.
– The reagent is much more stable and easily
accessible than the chromogenic radical reagents (e.g.
ABTS, DPPH, etc.). The cupric reducing ability
measured for a biological sample may indirectly but
efficiently reflect the total antioxidant power of the
sample even though no radicalic species are involved in
the assay.
– The method is easily and diversely applicable in
conventional laboratories using standard colorimeters
rather than necessitating sophisticated equipment and
highly qualified operators.
– The redox reaction giving rise to a colored chelate of
Cu(I)–Nc is relatively insensitive to a number of
parameters adversely affecting radicalic reagents such
as DPPH, e.g. air, sunlight, humidity and pH, to a
certain extent.
– The redox reactions concerned may be easily forced
to reach completion by incubation at 508C (i.e. the
oxidation reactions of uric acid and bilirubin may be
completed).
– The analytical response (i.e. absorbance) vs.
concentration curves are perfectly linear in the
CUPRAC method over a wide range, unlike those of
other methods yielding polynomial curves. The molar
absorptivity of the method, i.e. (7.5–9.5 £ 103 n)
l mol21 cm21 for n–e reductants, is sufficiently high to
determine biologically important antioxidants.
– As opposed to certain procedures of antioxidant
activity assay (such as the TBARS spectrophotometric
method) which cannot measure ascorbate as a
radical-trapping agent [20], the CUPRAC method
can measure ascorbate efficiently over a wide linear
range both as a contributor to TAC, and simul-
taneously as an individual antioxidant present in a
synthetic mixture. The TEACCUPRAC coefficient for
ascorbate is approximately 1, that is consistent with its
electron transfer behaviour, since both trolox and
ascorbic acid are 2-e reductants.
– The redox reaction producing colored species is
carried out at nearly physiological pH (pH 7 of
ammonium acetate buffer) as opposed to the
unrealistic acidic conditions (pH 3.6) of FRAP or
basic conditions (pH 10, necessary for phenols to
dissociate protons) of Folin-Ciocalteau (FC) assay. At
more acidic conditions than the physiological pH, the
reducing capacity may be suppressed due to protona-
tion on antioxidant compounds, whereas in more
basic conditions, proton dissociation of phenolics
would enhance a sample’s reducing capacity [15].
– The method can simultaneously measure hydro-
philic as well as lipophilic antioxidants (e.g. b-
carotene and a-tocopherol). The lipophilic antiox-
idants of serum may be assayed separately from the
hydrophilic ones by hexane extraction of serum,
followed by colour development in DCM. The
hydrophilic (after HClO4 precipitation) and lipophilic
capacities found for serum samples can be added
together to yield a total capacity. The room
temperature measurements of the CUPRAC method
yielded total antioxidant capacities for serum generally
in accord with those of FRAP and Randox-TEAC
assays, while the sum of lipophilic and 508C-incubated
hydrophilic capacities yielded an overall capacity
consistent with the findings of the ORAC assay. As an
advantage to the widely used FC assay, it is known that
the latter could not be adapted to measure lipophilic
antioxidants [15].
– The intra- and inter-assay CVs of the CUPRAC
method for human serum (0.7 and 1.5%) are much
lower than those of most methods that find wide use in
total antioxidant assays. The CV (RSD) data of
CUPRAC were definitely better than kinetic-based
assays where even the intra-assay CV may reach up to
8% [36].
– Since the Cu(I) ion emerging as a product of the
CUPRAC redox reaction is in chelated state (i.e.
Cu(I)–Nc), it cannot act as a prooxidant that may
cause oxidative damage to biological macromolecules
in body fluids. The ferric ion-based assays were
criticized for producing Fe2þ, which may act as a
prooxidant to produce.zOH radicals as a result of its
reactionwithH2O2 [47].ThestableCu(I)-chelatewas
shown by us not to react with hydrogen peroxide, but
the reverse reaction, i.e. oxidation of H2O2 with
Cu(II)–Nc, is possible.
The CUPRAC method 959
Downloaded By: [TÜBTAK EKUAL] At: 07:44 18 September 2009
– The CUPRAC antioxidant assay of biological fluids
may be expected to facilitate experimental and clinical
studies investigating the relationship among antiox-
idant status, dietary habits, and risk and progression of
diseases.
Conclusion
It has been shown in this work that copper(II)–
neocuproine (Nc) as the CUPRAC reagent effectively
oxidizes small molecular-weight plasma antioxidants;
ascorbic acid, a-tocopherol, b- carotene, reduced
glutathione (GSH), uric acid, and bilirubin, with
some oxidizing effect on albumin, regardless of
chemical type and hydrophilicity of the antioxidants
concerned, and is itself reduced in this redox reaction
to the highly colored Cu(I)–Nc chelate useful for
absorbance measurement at 450 nm. The CUPRAC
assay of TAC may be successfully applied to individual
antioxidants as well as to their mixtures and human
serum. Since the color development is relatively fast,
and the required reagents are relatively stable and
cheap, the developed method is much simpler and
expected to be more widely applicable in the near
future than the existing methods. As a distinct
advantage over other electron-transfer based assays
(e.g. Folin, FRAP, ABTS, DPPH), CUPRAC is
superior in regard to its realistic pH (close to that of
physiological pH), favourable redox potential, acces-
sibility and stability of reagents, and applicability to
lipophilic antioxidants as well as hydrophilic ones.
Acknowledgements
The authors would like to express their gratitude to
Istanbul University Research Fund for the funding of
Project YOP-4/27052004, and to State Planning
Organization of Turkey for the Advanced Research
Project of Istanbul University (2005K120430).
References
[1] Halliwell B, Gutteridge JMC. Free radicals in biology and
medicine. Oxford: Oxford University Press; 1989.
[2] Halliwell B, Aruoma OI. DNA damage by oxygen-derived
species: Its mechanisms and measurements in mammalian
systems. FEBS Lett 1991;281:9–19.
[3] Cao G, Prior RL. Comparison of different analytical methods
for assessing total antioxidant capacity of human serum. Clin
Chem 1998;44:1309–1315.
[4] De Zwart LL, Meerman JH, Commandeur JN, Vermeulen NP.
Biomarkers of free radical damage applications in experimental
animals and in humans. Free Radic Biol Med
1999;26:202–226.
[5] Yu BP. Cellular defenses against damage from reactive oxygen
species. Physiol Rev 1994;74:139–162.
[6] Wayner DD, Burton GW, Ingold KU, Locke S. Quantitative
measurement of the total peroxyl radical-trapping antioxidant
capability of human blood plasma by controlled peroxidation.
The important contribution made by plasma proteins. FEBS
Lett 1985;187:33–37.
[7] Glazer AN. Phycoerythrin fluorescence-based assay for
reactive oxygen species. Methods Enzymol 1990;
186:161–168.
[8] Ghiselli A, Serafini M, Maiani G, Assini E, Ferro-Luzzi A. A
fluorescence-based method for measuring total plasma
antioxidant capability. Free Radical Biol Med 1995;18:29–36.
[9] Miller NJ, Rice-Evans CA, Davies MJ, Gopinathan V, Milner
A. A novel method for measuring antioxidant capacity and its
application to monitoring the antioxidant status in premature
neonates. Clin Sci 1993;84:407–412.
[10] Whitehead TP, Thorpe GHG, Maxwell SRJ. Enhanced
chemiluminescent assay for antioxidant capacity in biological
fluids. Anal Chim Acta 1992;266:265–277.
[11] Cao G, Alessio HM, Cutler RG. Oxygen-radical absorbance
capacity assay for antioxidants. Free Radical Biol Med
1993;14:303–311.
[12] Cao G, Verdon CP, Wu AHB, Wang H, Prior RL. Automated
oxygen radical absorbance capacity assay using the COBAS
FARA II. Clin Chem 1995;41:1738–1744.
[13] Benzie IFF, Strain JJ. The ferric reducing ability of plasma
(FRAP) as a measure of “antioxidant power”: The FRAP
assay. Anal Biochem 1996;239:70–76.
[14] Bartosz G. Total antioxidant capacity. Adv Clin Chem
2003;37:219–292.
[15] Huang D, Ou B, Prior RL. The chemistry behind antioxidant
capacity assays. J Agric Food Chem 2005;53:1841–1856.
[16] Arnao MB. Some methodological problems in the determi-
nation of antioxidant activity using chromogen radicals: A
practical case. Trends Food Sci Technol 2000;11:419–421.
[17] Sanchez-Moreno C, Larrauri JA, Saura-Calixto F. A
procedure to measure the antiradical efficiency of polyphenols.
J Sci Food Agric 1998;76:270–276.
[18] Re R, Pellegrini N, Proteggente A, Pannala A, Yang M, Rice-
Evans C. Antioxidant activity applying an improved ABTS
radical cation decolorization assay. Free Radic Biol Med
1999;26:1231–1237.
[19] Rice-Evans CA, Miller NJ. Total antioxidant status in plasma
and body fluids. Methods Enzymol 1994;234:279–293.
[20] Koracevic D, Koracevic G, Djordjevic V, Andrejevic S,
Cosic V. Method for the measurement of antioxidant activity
in human fluids. J Clin Pathol 2001;54:356–361.
[21] Ou B, Hampsch-Woodill M, Prior RL. Development and
validation of an improved oxygen radical absorbance capacity
assay using fluorescein as the fluorescent probe. J Agric Food
Chem 2001;49:4619–4626.
[22] Janaszewska A, Bartosz G. Assay of total antioxidant capacity:
Comparison of four methods as applied to human blood
plasma. Scand J Clin Lab Invest 2002;62:231–236.
[23] Robards K, Prenzler PD, Tucker G, Swatsitang P, Glover W.
Phenolic compounds and their role in oxidative processes in
fruits. Food Chem 1999;66:401–436.
[24] Ou B, Huang D, Hampsch-Woodill M, Flanagan JA, Deemer
EK. Analysis of antioxidant activities of common vegetables
employing oxygen radical absorbance capacity (ORAC) and
ferric reducing antioxidant power (FRAP) assays: A compara-
tive study. J Agric Food Chem 2002;50:3122–3128.
[25] Apak R, Guclu K, Ozyurek M, Karademir SE. A novel total
antioxidant capacity index for dietary polyphenols, vitamin C
and E, using their cupric ion reducing capability in the
presence of neocuproine: The CUPRAC method. J Agric Food
Chem 2004;52:7970–7981.
[26] Aebischer C, Schierle J, Schuep W. Simultaneous determi-
nation of retinol, tocopherols, carotene, lycopene, and
xanthophylls in plasma by means of reversed-phase high
performance liquid chromatography. In: Packer L, editor.
Methods in enzymology. Oxidants and antioxidants. New
York: Academic Press; 1999. p 348–362.
R. Apak et al.960
Downloaded By: [TÜBTAK EKUAL] At: 07:44 18 September 2009
[27] Prior RL, Hoang H, Gu L, Wu X, Bacchiocca M, Howard L,
Hampsch-Woodill M, Huang D, Ou B, Jacob R. Assays for
hydrophilic and lipophilic antioxidant capacity (oxygen radical
absorbance capacity (ORACFL)) of plasma and other
biological and food samples. J Agric Food Chem 2003;
51:3273–3279.
[28] Tutem E, Apak R, Baykut F. Spectrophotometric determi-
nation of trace amounts of copper(I) and reducing agents with
neocuproine in the presence of copper(II). Analyst 1991;
116:89–94.
[29] Tutem E, Apak R. Simultaneous spectrophotometric deter-
mination of cystine and cysteine in amino acid mixtures using
copper(II)-neocuproine reagent. Anal Chim Acta 1991;255:
121–125.
[30] Tutem E, Apak R, Gunaydı E, Sozgen K. Spectrophotometric
determination of vitamin E (a-tocopherol) by the copper(II)-
neocuproine reagent. Talanta 1997;44:249–255.
[31] Guclu K, Sozgen K, Tutem E, Ozyurek M, Apak R.
Spectrophotometric determination of ascorbic acid using
copper(II)–neocuproine reagent in beverages and pharma-
ceuticals. Talanta 2005;65:1226–1232.
[32] Salah N, Miller NJ, Paganga G, Tijburg L, Bolwell GP, Rice-
Evans CA. Polyphenolic flavonols as scavengers of aqueous
phase radicals and as chain-breaking antioxidants. Arch
Biochem Biophys 1995;322:339–346.
[33] Pulido R, Bravo L, Saura-Calixto F. Antioxidant activity of
dietary polyphenols as determined by a modified ferric
reducing antioxidant power assay. J Agric Food Chem 2000;
48:3396–3402.
[34] Cao G, Sofic E, Prior RL. Antioxidant and prooxidant
behavior of flavonoids: Structure–activity relationships. Free
Radic Biol Med 1997;22:749–760.
[35] Dickinson DA, Forman HJ. Cellular glutathione and thiols
metabolism. Biochem Pharmacol 2002;64:1019–1026.
[36] Tubaro F, Ghiselli A, Rapuzzi P, Maiorino M, Ursini F.
Analysis of plasma antioxidant capacity by competition
kinetics. Free Radic Biol Med 1998;24:1228–1234.
[37] Tsai K, Hsu TG, Kong CW, Lin KC, Lu FJ. Is the endogenous
peroxyl-radical scavenging capacity of plasma protective in
systemic inflammatory disorders in humans? Free Radic Biol
Med 2000;28:926–933.
[38] Naguib YMA. A fluorometric method for measurement of
oxygen radical-scavenging activity of water soluble anti-
oxidants. Anal Biochem 2000;284:93–98.
[39] Halliwell B, Gutteridge JMC. The definition and measure-
ment of antioxidants in biological systems. Free Radic Biol
Med 1995;18:125–126.
[40] Scott SL, Chen W, Bakac A, Espenson J. Spectroscopic
parameters, electrode potentials, acid ionization constants,
and electron exchange rates of the 2,20-azinobis(3-ethylben-
zothiazoline-6-sulfonate) radicals and ions. J Phys Chem
1993;97:6710–6714.
[41] Kampa M, Nistikaki A, Tsaousis V, Maliaraki N, Notas G,
Castanas E. A new automated method for the determination of
the total antioxidant capacity (TAC) of human plasma, based
on crocin bleaching assay. BMC Clin Pathol 2002;2:1–16.
[42] Liu X, Zhao J, Zheng R. DNA damage of tumor-associated
lymphocytes and total antioxidant capacity in cancerous
patients. Mutat Res 2003;539:1–8.
[43] Chevion S, Or R, Berry EM. The antioxidant status of patients
subjected to total body irradiation. Biochem Mol Biol Int
1999;47:1019–1027.
[44] Labrina EP, Georgiou CA. Stopped-flow method for assess-
ment of pH and timing effect on the ABTS total antioxidant
capacity assay. Anal Chim Acta 2004;526:63–68.
[45] Ghiselli A, Serafini M, Natella F, Scaccini C. Total antioxidant
capacity as a tool to assess redox status: Critical view and
experimental data. Free Radic Biol Med 2000;29:1106–1114.
[46] Ryan M, Grayson L, Clarke DJ. The total antioxidant capacity
of human serum measured using enhanced chemilumines-
cence is almost completely accounted for by urate. Ann Clin
Biochem 1997;34:688–689.
[47] Prior RL, Cao G. In vivo total antioxidant capacity:
Comparison of different analytical methods. Free Radic Biol
Med 1999;27:1173–1181.
[48] Teshima N, Katsumata H, Kurihara M, Sakai T, Kawashima
T. Flow-injection determination of copper(II) based on its
catalysis on the redox reaction of cysteine with iron(III) in the
presence of 1,10-phenanthroline. Talanta 1999;50:41–47.
The CUPRAC method 961
Downloaded By: [TÜBTAK EKUAL] At: 07:44 18 September 2009
Related Documents


