Torrefaction of Napier Grass and Oil Palm Petiole Waste Using Drop-type Pyrolysis Reactor Syazmi Zul Arif Hakimi Saadon UTP: Universiti Teknologi PETRONAS Noridah Osman ( [email protected] ) UTP: Universiti Teknologi PETRONAS Moviin Damodaran UTP: Universiti Teknologi PETRONAS Shan En Liew UTP: Universiti Teknologi PETRONAS Research Keywords: Biomass Valorization, Napier Grass, Oil Palm Petiole, Torrefaction Posted Date: February 4th, 2021 DOI: https://doi.org/10.21203/rs.3.rs-174954/v1 License: This work is licensed under a Creative Commons Attribution 4.0 International License. Read Full License

Welcome message from author
This document is posted to help you gain knowledge. Please leave a comment to let me know what you think about it! Share it to your friends and learn new things together.
Transcript
Torrefaction of Napier Grass and Oil Palm PetioleWaste Using Drop-type Pyrolysis ReactorSyazmi Zul Arif Hakimi Saadon
UTP: Universiti Teknologi PETRONASNoridah Osman ( [email protected] )
UTP: Universiti Teknologi PETRONASMoviin Damodaran
UTP: Universiti Teknologi PETRONASShan En Liew
UTP: Universiti Teknologi PETRONAS
Research
Keywords: Biomass Valorization, Napier Grass, Oil Palm Petiole, Torrefaction
Posted Date: February 4th, 2021
DOI: https://doi.org/10.21203/rs.3.rs-174954/v1
License: This work is licensed under a Creative Commons Attribution 4.0 International License. Read Full License

PAPER
1
Torrefaction of Napier Grass and Oil Palm Petiole Waste 1
Using Drop-type Pyrolysis Reactor 2
Syazmi Zul Arif Hakimi Saadon a, b, Noridah Binti Osman*a, b, Moviin Damodaran a, Liew Shan En a 3
a Department of Chemical Engineering, Universiti Teknologi PETRONAS, Bandar Seri Iskandar, 4
32610 Perak, Malaysia 5
b HICOE – Center for Biofuel and Biochemical Research, Institute of Self-Sustainable Building, 6
Universiti Teknologi PETRONAS, 32610, Seri Iskandar, Perak, Malaysia. 7
* Corresponding author: [email protected] 8
9
1. Abstract 10
Interest in torrefaction has improved along the recent years and it has been studied extensively 11
as a mean of preparing solid fuels. Biomass to be considered as a renewable source of energy must 12
endeavor improvement continuously and where it is more sustainable going forward in which can come 13
from waste product, wild and cultivated plant. The aim of this study is to investigate the effect of 14
temperature and residence time of wild Napier grass and Oil palm petiole from waste. The torrefied 15
samples were derived by pyrolysis reactor mimicking torrefaction procedure. The temperature parameter 16
ranges between 220 and 300 ℃ while residence time parameter is from 10 minutes to 50 minutes of 17
reaction. It was found that as temperature and time increasing, moisture content and amount of O and H 18
2
atoms decreases as well as both mass and energy yield, but calorific value and the energy density increase 19
along with both two parameters. Between the two parameters, the temperature variation shows more 20
significant changes to the torrefied samples as compared time. The optimized temperature and time are 21
found to be 260 ℃ and 30 minutes, respectively. Remarkably, the usage of pyrolyzer as torrefaction 22
reaction has proved to be a good option since they share similar characteristics while can also produce 23
product with similar properties reflecting torrefaction process. 24
25
Keywords: Biomass Valorization, Napier Grass, Oil Palm Petiole, Torrefaction 26
27
2. Introduction 28
Sustainable and renewable source of energy is one of the main concerns into the upcoming years 29
as fear of depleting fossil fuel is growing. Among the promising sources of renewable energy is via biomass 30
utilization in form of solid, liquid and gas fuels. Biomass has been researched extensively for it to be 31
partnered, mixed and eventually become an alternative to fossil fuel. Even though it is promising, a few 32
challenges has to be addressed for it to be competitive with the current fossil fuels; (1) high consumption 33
of energy during feedstock collection, (2) heterogenous and inconsistent composition, (3) low calorific 34
value and (4) difficulty in transportation (Uemura et al. 2011). 35
Torrefaction is a thermochemical treatment in which it is carried out in relatively low 36
temperature of 200-300 ℃ and conducted in an inert environment. It is sometimes called as mild pyrolysis 37

3
and functions to drive out moisture, volatile matter while at same time, decompose the polysaccharide 38
chains. According to Chen et al., torrefaction possess four main advantages: (1) increases heating value 39
or energy density, (2) lowering the moisture content, hydrogen-to-carbon (H/C) and oxygen-to-carbon 40
(O/C) ratios, (3) improve resistivity against water and (4) enhance reactivity and grindability (Chen et al. 41
2015). In most of researches in torrefaction, three main conditions have been studied to affect the 42
performance of the torrefied material which are biomass properties, torrefaction temperature and 43
duration of reaction time of torrefaction but the latter two are more widely analyzed. Torrefaction has 44
widely conducted using wood-based and grass-based biomass such as oil palm fruit bunches (Uemura et 45
al. 2011), willow (Bridgeman et al. 2008), Juniper wood (Eseltine et al. 2013), bamboo (Rousset et al. 46
2011), wheat (Bridgeman et al. 2008; Satpathy et al. 2014) and rice husk (Chen et al. 2011). Torrefied 47
materials can be used for co-firing of fuel, iron-making and pollutant adsorbent and pretreated material 48
for gasification and pyrolysis (Chen et al. 2021). Despite their close thermal characteristics between 49
torrefaction and pyrolysis however to author knowledge there is no trial on utilizing pyrolysis reactor for 50
torrefaction reaction process. 51
Napier grass which is also known as elephant grass is a fast-growing plantation that can be found 52
in several regions around the globe. It is classified as herbaceous plant and belongs to the Poaceae family. 53
As researched by Mohammed et. al., Napier grass has shown to have high volatile matter contents, 54
heating value and carbon content while also having low ash, nitrogen and sulfur contents (Mohammed 55
et al. 2015). Among its other advantages are ability to minimize deforestation damage, fast cycle, high 56
productivity and high ratio of energy output to the energy input to grow the grass to be about 25:1 57
(Samson et al. 2005). Oil palm is one of the main plantations and Malaysia has been the second largest 58
producer of palm oil with 19.67 million tons of palm oil produced. Oil palm frond is one of the biomass 59
products that can be harvested from an oil palm plant. Although it is one of the highest contents of 60

4
lignocellulosic component from the oil palm harvest, it was previously considered as waste and has been 61
underutilized. Almost 46,837 kilotons of oil palm fronds along with its petiole was wasted in the year of 62
2007 (Goh et al. 2010). 63
In this study, we focused on torrefaction of Napier grass and oil palm petiole which exist in 64
abundance around Malaysia. The effect of reaction temperature and reaction time were studied with the 65
two biomass feedstocks to observe the performance on the torrefied material. Pyrolysis reactor is used 66
in this study in place for torrefaction to compare the results as compared to a standard torrefaction 67
reactor. 68
3. Experimental 69
3.1 Materials 70
Oil palm petiole (OPP) were collected from Felcra Nasaruddin, Bota Kanan, Perak while the 71
Napier grass (NG) was collected from Teluk Bakong, Perak. The samples were washed cut and let to dried 72
under sunlight for 1 week. The raw samples were dried in oven at 105 ℃ for 24 hours. The dried sample 73
is granulated to 2.5 mm in size and further grinded to about 500 μm. The lignocellulose composition of 74
both biomass sources is shown in Table 1. 75
76

5
Table 1: Composition of Napier grass and Oil palm petiole 77
Biomass sources
Percentage, %
Cellulose Hemicellulose Lignin
Napier grass 39-68 16-34 17-27
Oil palm petiole 35 18 22-25
78
3.2 Torrefaction process 79
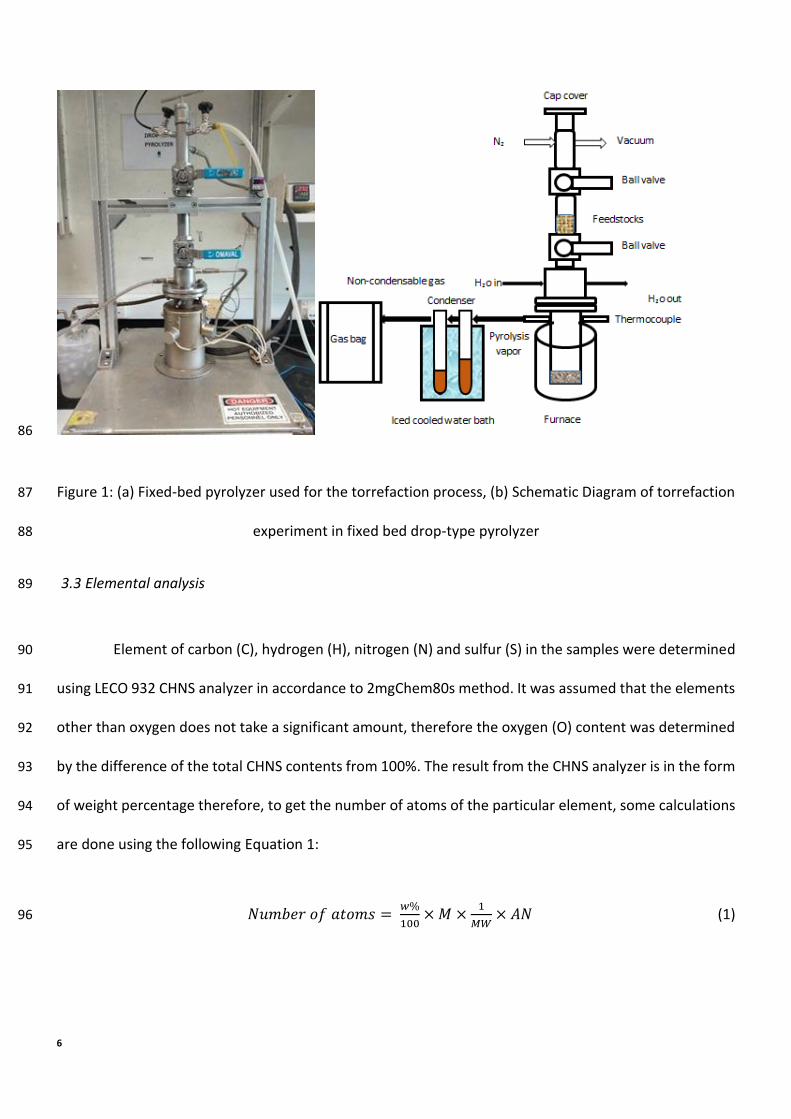
A drop-type pyrolyzer was used for the torrefaction process as shown in Figure 1. Nitrogen gas 80
was let to purge the reactor for 5 minutes to remove oxygen from the reactor in order to prevent 81
combustion. The reactor was calibrated before and after the sample was placed in the reactor. 5 runs 82
were conducted to both samples for 30 minutes of residence time with varying temperature (220 ℃, 240 83 ℃, 260 ℃, 280 ℃ and 300 ℃). Another 5 runs were conducted with fixed temperature of 260 ℃ with 84
varying residence time (10, 20, 30, 40 and 50 minutes). 85
6
86
Figure 1: (a) Fixed-bed pyrolyzer used for the torrefaction process, (b) Schematic Diagram of torrefaction 87
experiment in fixed bed drop-type pyrolyzer 88
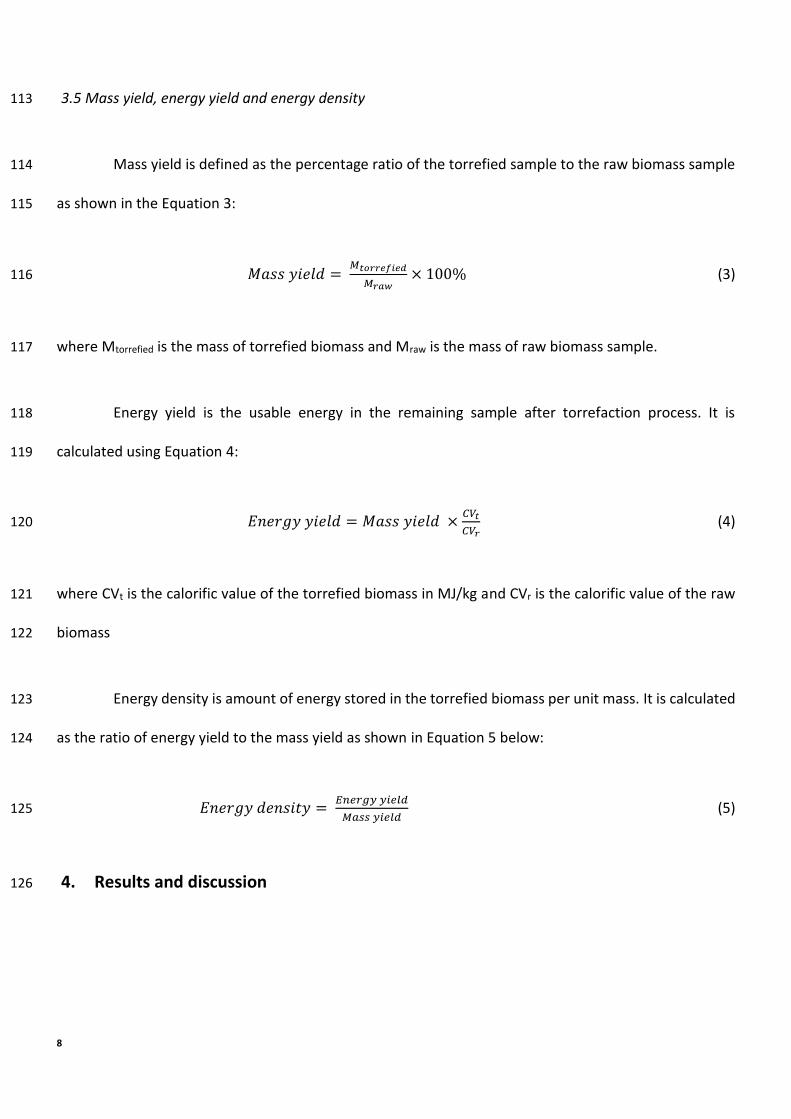
3.3 Elemental analysis 89
Element of carbon (C), hydrogen (H), nitrogen (N) and sulfur (S) in the samples were determined 90
using LECO 932 CHNS analyzer in accordance to 2mgChem80s method. It was assumed that the elements 91
other than oxygen does not take a significant amount, therefore the oxygen (O) content was determined 92
by the difference of the total CHNS contents from 100%. The result from the CHNS analyzer is in the form 93
of weight percentage therefore, to get the number of atoms of the particular element, some calculations 94
are done using the following Equation 1: 95
𝑁𝑢𝑚𝑏𝑒𝑟 𝑜𝑓 𝑎𝑡𝑜𝑚𝑠 = 𝑤%100 × 𝑀 × 1𝑀𝑊 × 𝐴𝑁 (1) 96

7
Where %w is the weight percentage of the element, M is the mass of sample, MW is the atomic weight 97
of the element and AN is the Avogadro’s number which is 6.0221×10²³ per mole. 98
3.4 Moisture content and calorific value 99
The moisture content was determined in accordance to BS EN ISO 18134-3 Solid fuels – 100
Determination of Moisture Content – Oven Dry method. 1 g of sample was placed in oven at 105 ℃ until 101
constant mass had been achieved. Constant mass is defined as the changes of mass after 1 hour not 102
exceeding 1 mg, in which up to 180 minutes of heating for drying time is required. The sample is placed 103
in a desiccator and later weighed. The moisture content is calculated using the following Equation 2: 104
𝑀𝑜𝑖𝑠𝑡𝑢𝑟𝑒 𝑐𝑜𝑛𝑡𝑒𝑛𝑡 = 𝑀2−𝑀3𝑀2−𝑀1 × 100% (2) 105
where M1 is the mass of empty dish, M2 is the mass of empty dish with test sample before drying and 106
M3 is the mass of empty dish plus test sample after drying. 107
Calorific value (CV) is defined as the energy content or the heating value released during the 108
process of complete combustion. Lower heating value is more suitable to be used as the energy content 109
since higher heating value also included the latent heat of vaporization which is not fully converted into 110
useful energy. The calorific value was determined using the BS EN ISO 18125 Solid Biofuels - Determination 111
of Calorific Value standards. 112
8
3.5 Mass yield, energy yield and energy density 113
Mass yield is defined as the percentage ratio of the torrefied sample to the raw biomass sample 114
as shown in the Equation 3: 115
𝑀𝑎𝑠𝑠 𝑦𝑖𝑒𝑙𝑑 = 𝑀𝑡𝑜𝑟𝑟𝑒𝑓𝑖𝑒𝑑𝑀𝑟𝑎𝑤 × 100% (3) 116
where Mtorrefied is the mass of torrefied biomass and Mraw is the mass of raw biomass sample. 117
Energy yield is the usable energy in the remaining sample after torrefaction process. It is 118
calculated using Equation 4: 119
𝐸𝑛𝑒𝑟𝑔𝑦 𝑦𝑖𝑒𝑙𝑑 = 𝑀𝑎𝑠𝑠 𝑦𝑖𝑒𝑙𝑑 × 𝐶𝑉𝑡𝐶𝑉𝑟 (4) 120
where CVt is the calorific value of the torrefied biomass in MJ/kg and CVr is the calorific value of the raw 121
biomass 122
Energy density is amount of energy stored in the torrefied biomass per unit mass. It is calculated 123
as the ratio of energy yield to the mass yield as shown in Equation 5 below: 124
𝐸𝑛𝑒𝑟𝑔𝑦 𝑑𝑒𝑛𝑠𝑖𝑡𝑦 = 𝐸𝑛𝑒𝑟𝑔𝑦 𝑦𝑖𝑒𝑙𝑑𝑀𝑎𝑠𝑠 𝑦𝑖𝑒𝑙𝑑 (5) 125
4. Results and discussion 126
9
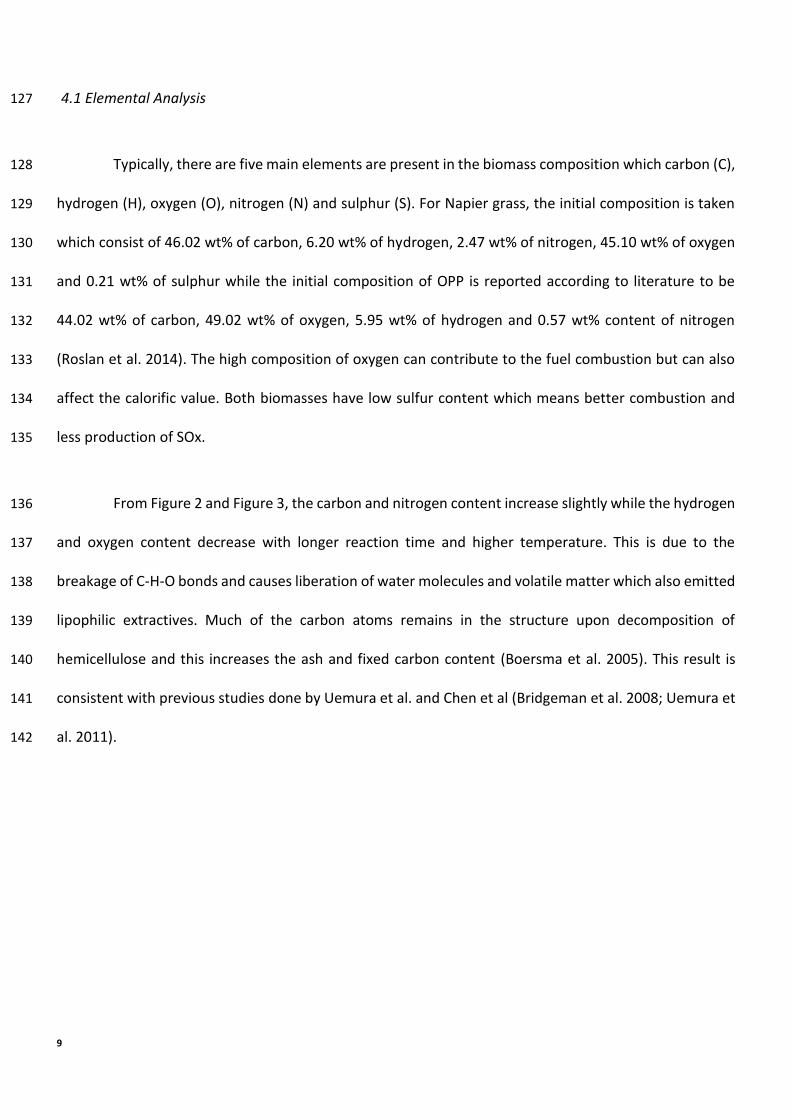
4.1 Elemental Analysis 127
Typically, there are five main elements are present in the biomass composition which carbon (C), 128
hydrogen (H), oxygen (O), nitrogen (N) and sulphur (S). For Napier grass, the initial composition is taken 129
which consist of 46.02 wt% of carbon, 6.20 wt% of hydrogen, 2.47 wt% of nitrogen, 45.10 wt% of oxygen 130
and 0.21 wt% of sulphur while the initial composition of OPP is reported according to literature to be 131
44.02 wt% of carbon, 49.02 wt% of oxygen, 5.95 wt% of hydrogen and 0.57 wt% content of nitrogen 132
(Roslan et al. 2014). The high composition of oxygen can contribute to the fuel combustion but can also 133
affect the calorific value. Both biomasses have low sulfur content which means better combustion and 134
less production of SOx. 135
From Figure 2 and Figure 3, the carbon and nitrogen content increase slightly while the hydrogen 136
and oxygen content decrease with longer reaction time and higher temperature. This is due to the 137
breakage of C-H-O bonds and causes liberation of water molecules and volatile matter which also emitted 138
lipophilic extractives. Much of the carbon atoms remains in the structure upon decomposition of 139
hemicellulose and this increases the ash and fixed carbon content (Boersma et al. 2005). This result is 140
consistent with previous studies done by Uemura et al. and Chen et al (Bridgeman et al. 2008; Uemura et 141
al. 2011). 142

10
143
144
Figure 2: Elemental analysis at reaction time of 30 minutes for (a) Napier grass and (b) oil palm petiole 145
146
46.02 47.2649.59 51.59
53.7956.55
6.20 5.75 5.68 5.60 5.415.01
2.47 2.67 2.73 2.81 3.02 3.330.21 0.22 0.22 0.22 0.22 0.22
45.10 44.1041.78 39.78
37.5634.89
0
10
20
30
40
50
60
70
80
Initial (30) 220 240 260 280 300
Pe
rce
nta
ge
by
we
igh
t (%
)
Temperature (°C)
Elemental analysis for Napier grass at 30 minutes
C H N S O
44.02
56.49
71.32
55.76
71.98
5.95 5.33 3.69 5.29 3.420.57 0.78 0.74 0.52 0.740 0.19 0.22 0.12 0.28
49.46
37.21
24.03
38.31
23.59
0
10
20
30
40
50
60
70
80
Initial 240 260 280 300
Pe
rce
nta
ge
by
we
igh
t (%
)
Temperature (°C)
Elemental analysis for Oil Palm Petiole at 30 minutes
C H N S O

11
147
148
Figure 3: Elemental analysis at reaction temperature of 260 ℃ of reaction time for (a) Napier grass and 149
(b) oil palm petiole 150
151
The changes in the elemental content can also be visualized using atomic hydrogen-to-carbon 152
(H/C) ratio and oxygen-to-carbon (O/C) ratio. Generally, the H/C ratio and O/C ratio decrease significantly 153
46.0248.28 49.85 51.59 52.58 53.42
6.2 5.77 5.69 5.60 5.57 5.522.47 2.68 2.76 2.81 2.89 2.94
0.21 0.15 0.20 0.22 0.21 0.22
45.10 43.12 41.50 39.78 38.75 37.90
0
10
20
30
40
50
60
70
80
0 10 20 30 40 50
Pe
rce
nta
ge
by
we
igh
t (%
)
Time (min)
Elemental analysis for Napier grass at 260 ℃
C H N S O
44.02
60.3962.60
71.32
61.0658.41
5.95 4.85 4.54 3.69 4.91 5.190.57 0.69 0.71 0.74 0.65 0.65
0 0.17 0.17 0.22 0.17 0.18
49.46
33.90 31.99
24.03
33.2235.57
0
10
20
30
40
50
60
70
80
0 10 20 30 40 50
Pe
rce
nta
ge
by
we
igh
t (%
)
Time (min)
Elemental analysis for Oil Palm Petiole at 260 ℃
C H N S O

12
with torrefaction from H/C of 0.135 for both biomass sample and O/C of 0.980 and 1.124 for NG and OPP 154
respectively. The change in H/C from the initial elemental content are in the ranges of 9.6-34.24% for NG 155
and 26-64% for OPP while change in O/C ranges from 4.8-37 % and 39-71 % for NG and OPP respectively. 156
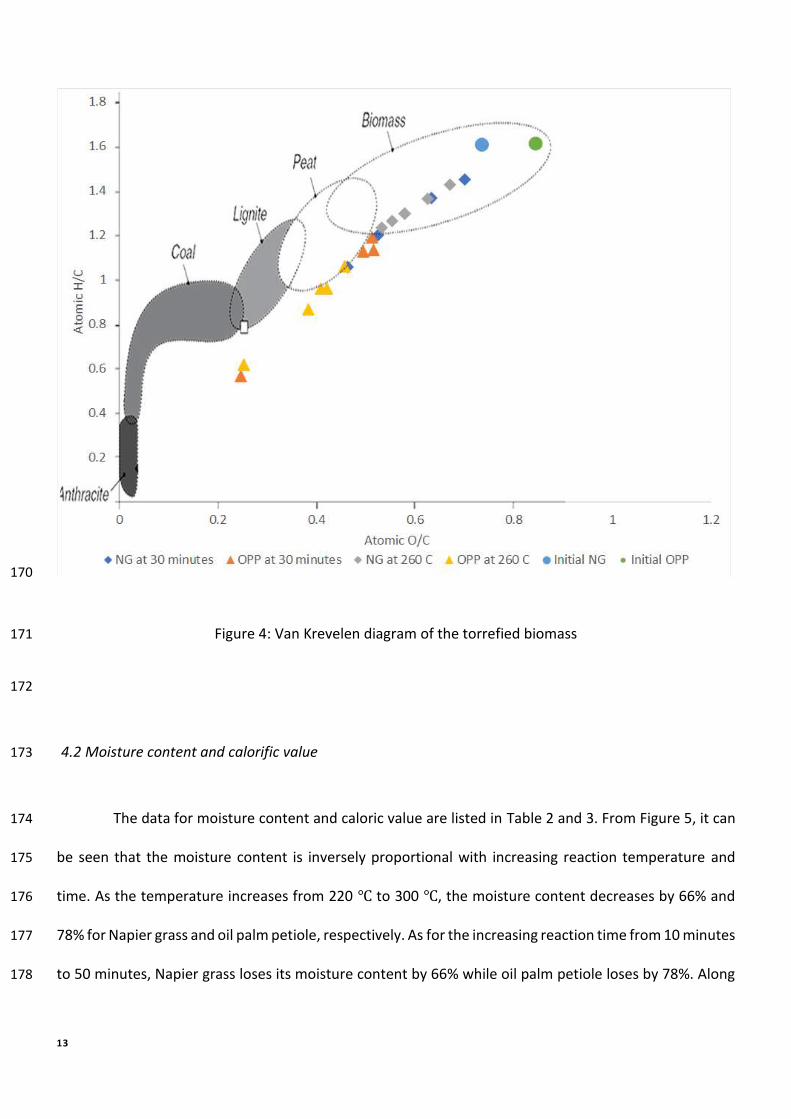
The ratios of atomic H/C and O/C can be plotted into Van Krevelen diagram to compare the loss 157
of hydrogen and oxygen by torrefaction. From Figure 4, the initial atomic ratio of H/C and O/C of NG and 158
OPP is located within the biomass region as expected. The trend is showing a decline of O/C and H/C when 159
the temperature and the reaction time rises. OPP seems to have a sharper decline in H/C and O/C where 160
the difference from the initial is quite significant and even located outside of the biomass region. For NG, 161
torrefaction only change the ratios slightly which the ratios of O/C and H/C for the torrefied NG still lies 162
in the biomass region. It can also be seen that the effect of temperature is more notable than effect of 163
reaction time. This is shown by the more widely disperse points on the Van Krevelen diagram when 164
temperature is varied. As temperature and time increase, much more hydrogen and oxygen are released 165
as water, leaving only more carbon in which makes them closer to coal. This observation is similar to 166
Granados et al. (Granados et al. 2017) and Poudel et al. (Poudel et al. 2018) using poplar wood and waste 167
wood respectively. This shows that the potential of torrefied NG is relatively low since it can be matched 168
by other raw biomass feedstocks. 169
13
170
Figure 4: Van Krevelen diagram of the torrefied biomass 171
172
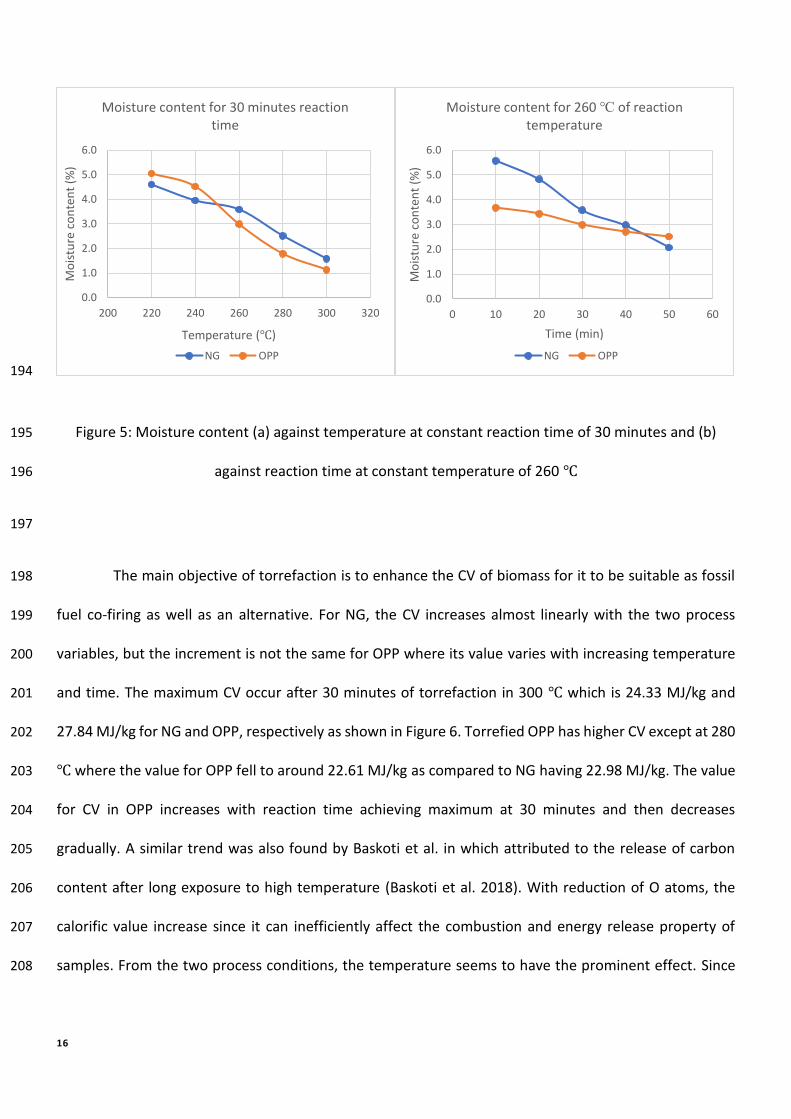
4.2 Moisture content and calorific value 173
The data for moisture content and caloric value are listed in Table 2 and 3. From Figure 5, it can 174
be seen that the moisture content is inversely proportional with increasing reaction temperature and 175
time. As the temperature increases from 220 ℃ to 300 ℃, the moisture content decreases by 66% and 176
78% for Napier grass and oil palm petiole, respectively. As for the increasing reaction time from 10 minutes 177
to 50 minutes, Napier grass loses its moisture content by 66% while oil palm petiole loses by 78%. Along 178

14
the increment in temperature above 200 ℃, hemicellulose decomposed, C-H-O bonds are broken, and 179
water molecules are formed via condensation reaction. When the temperature rises above 270 ℃, more 180
devolatilization and carbonization of hemicellulose which leads to more water molecules are released. 181
This is evident in the slow reduction of moisture from 220 ℃ to 260 ℃ but rapidly decline after 260 ℃. 182
Table 2: The physical properties of torrefied NG and OPP at constant reaction time of 30 minutes 183
Temp.
(℃)
Moisture
content, %
Calorific value
(MJ/kg)
Mass yield, % Energy yield, %
Energy
Density
NG OPP NG OPP NG OPP NG OPP NG OPP
220 4.608 5.047 18.69 22.36 81.74 84.90 87.04 98.67 1.06 1.16
240 3.956 4.521 19.96 22.23 75.22 72.80 85.56 84.12 1.14 1.16
260 3.587 2.995 21.23 26.23 68.62 64.55 83.03 88.03 1.21 1.36
280 2.511 1.787 22.98 21.61 53.71 53.20 70.35 59.77 1.31 1.12
300 1.589 1.134 24.33 27.84 49.06 43.90 68.02 63.52 1.39 1.45
184

15
Table 3: The physical properties of torrefied biomass at constant reaction temperature of 260 °C 185
Reaction
time (min)
Moisture
content, %
Calorific value,
(MJ/kg)
Mass yield, % Energy yield, %
Energy
Density
NG OPP NG OPP NG OPP NG OPP NG OPP
10 5.571 3.683 20.57 23.45 72.19 67.25 84.61 81.97 1.17 1.22
20 4.826 3.439 20.80 24.14 70.34 65.40 83.37 82.08 1.19 1.26
30 3.587 2.995 21.23 26.23 68.62 64.55 83.03 88.03 1.21 1.36
40 2.982 2.717 21.76 25.15 65.31 62.90 81.00 82.23 1.24 1.31
50 2.075 2.515 22.32 22.28 60.57 61.05 77.05 70.70 1.27 1.16
186
After the torrefaction process is done, hydroxyl groups are destroyed, preventing the formation 187
of hydrogen bonding which makes the torrefied biomass to be more hydrophobic. This hydrophobicity 188
effect is likely due to the hydroxyl group removal and formation of micropores on the surface as reported 189
by Chen et al. (Chen et al. 2014). The reduction in moisture content was also attributed by tar 190
condensation within the torrefied biomass which also prevent moisture absorption as reported by Felfli 191
et al (Felfli et al. 2005). Similar effect can also be found when other biomasses are used such as Marula 192
seeds, blue gum wood (Mamvura et al. 2018) and rice husk (Chen et al. 2012). 193
16
194
Figure 5: Moisture content (a) against temperature at constant reaction time of 30 minutes and (b) 195
against reaction time at constant temperature of 260 ℃ 196
197
The main objective of torrefaction is to enhance the CV of biomass for it to be suitable as fossil 198
fuel co-firing as well as an alternative. For NG, the CV increases almost linearly with the two process 199
variables, but the increment is not the same for OPP where its value varies with increasing temperature 200
and time. The maximum CV occur after 30 minutes of torrefaction in 300 ℃ which is 24.33 MJ/kg and 201
27.84 MJ/kg for NG and OPP, respectively as shown in Figure 6. Torrefied OPP has higher CV except at 280 202 ℃ where the value for OPP fell to around 22.61 MJ/kg as compared to NG having 22.98 MJ/kg. The value 203
for CV in OPP increases with reaction time achieving maximum at 30 minutes and then decreases 204
gradually. A similar trend was also found by Baskoti et al. in which attributed to the release of carbon 205
content after long exposure to high temperature (Baskoti et al. 2018). With reduction of O atoms, the 206
calorific value increase since it can inefficiently affect the combustion and energy release property of 207
samples. From the two process conditions, the temperature seems to have the prominent effect. Since 208
0.0
1.0
2.0
3.0
4.0
5.0
6.0
200 220 240 260 280 300 320
Mo
istu
re c
on
ten
t (%
)
Temperature (℃)
Moisture content for 30 minutes reaction
time
NG OPP
0.0
1.0
2.0
3.0
4.0
5.0
6.0
0 10 20 30 40 50 60
Mo
istu
re c
on
ten
t (%
)
Time (min)
Moisture content for 260 ℃ of reaction
temperature
NG OPP

17
OPP generally has higher CV than NG, it shows its potential to be further process to be a viable fuel source. 209
Table 4 compares the results obtained to indicative commercial solid fuels. 210
211
Figure 6: Calorific value of torrefied biomasses (a) against temperature at constant reaction time of 30 212
minutes and (b) against reaction time at constant temperature of 260 ℃ 213
15.0
17.0
19.0
21.0
23.0
25.0
27.0
29.0
200 220 240 260 280 300 320
Ca
lori
fic
valu
e
(M
J/k
g)
Temperature (℃)
Calorific value for 30 minutes of reaction
time
NG OPP
15.0
17.0
19.0
21.0
23.0
25.0
27.0
29.0
0 10 20 30 40 50 60C
alo
rifi
c va
lue
(
MJ/
kg
)
Time (min)
Calorific value for 260 ℃ of reaction
temperature
NG OPP
18
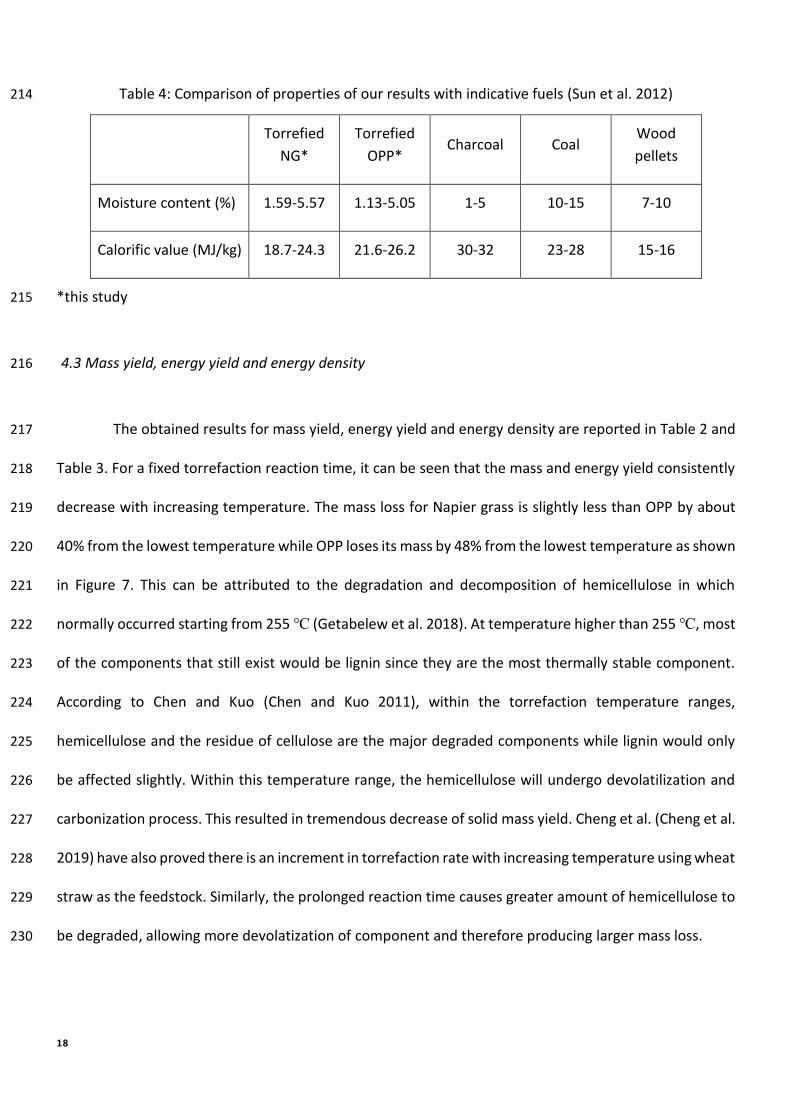
Table 4: Comparison of properties of our results with indicative fuels (Sun et al. 2012) 214
Torrefied
NG*
Torrefied
OPP* Charcoal Coal
Wood
pellets
Moisture content (%) 1.59-5.57 1.13-5.05 1-5 10-15 7-10
Calorific value (MJ/kg) 18.7-24.3 21.6-26.2 30-32 23-28 15-16
*this study 215
4.3 Mass yield, energy yield and energy density 216
The obtained results for mass yield, energy yield and energy density are reported in Table 2 and 217
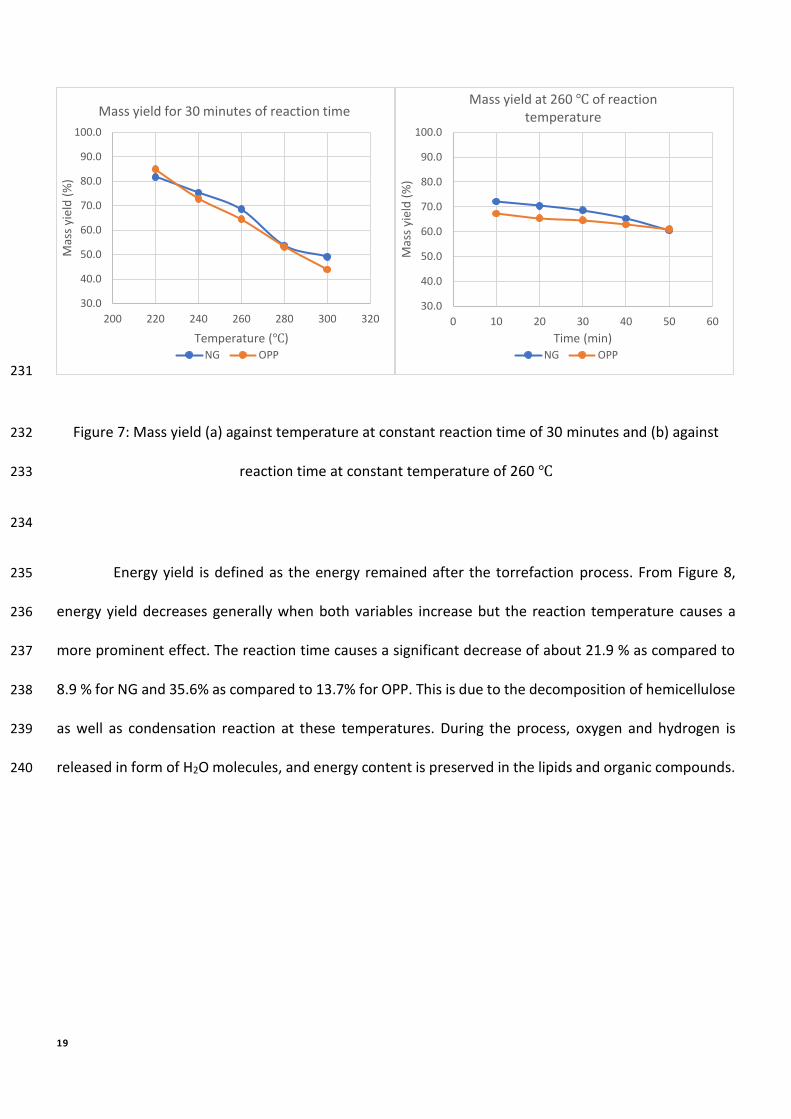
Table 3. For a fixed torrefaction reaction time, it can be seen that the mass and energy yield consistently 218
decrease with increasing temperature. The mass loss for Napier grass is slightly less than OPP by about 219
40% from the lowest temperature while OPP loses its mass by 48% from the lowest temperature as shown 220
in Figure 7. This can be attributed to the degradation and decomposition of hemicellulose in which 221
normally occurred starting from 255 ℃ (Getabelew et al. 2018). At temperature higher than 255 ℃, most 222
of the components that still exist would be lignin since they are the most thermally stable component. 223
According to Chen and Kuo (Chen and Kuo 2011), within the torrefaction temperature ranges, 224
hemicellulose and the residue of cellulose are the major degraded components while lignin would only 225
be affected slightly. Within this temperature range, the hemicellulose will undergo devolatilization and 226
carbonization process. This resulted in tremendous decrease of solid mass yield. Cheng et al. (Cheng et al. 227
2019) have also proved there is an increment in torrefaction rate with increasing temperature using wheat 228
straw as the feedstock. Similarly, the prolonged reaction time causes greater amount of hemicellulose to 229
be degraded, allowing more devolatization of component and therefore producing larger mass loss. 230
19
231
Figure 7: Mass yield (a) against temperature at constant reaction time of 30 minutes and (b) against 232
reaction time at constant temperature of 260 ℃ 233
234
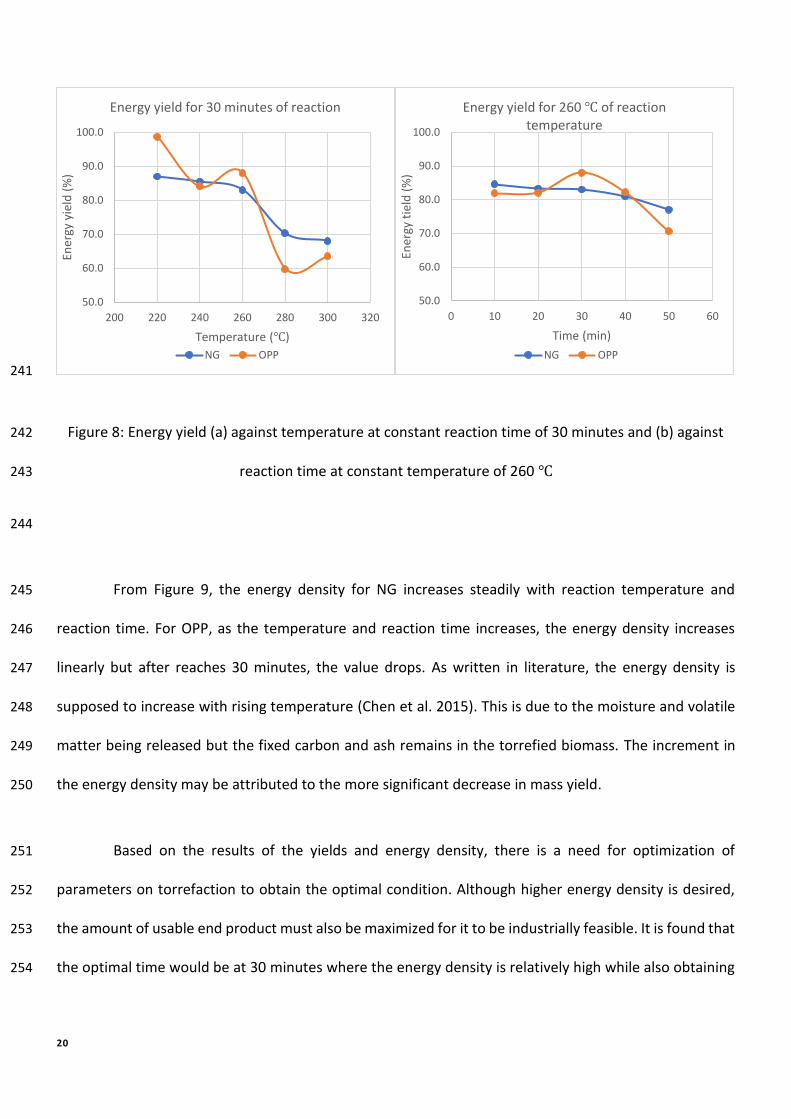
Energy yield is defined as the energy remained after the torrefaction process. From Figure 8, 235
energy yield decreases generally when both variables increase but the reaction temperature causes a 236
more prominent effect. The reaction time causes a significant decrease of about 21.9 % as compared to 237
8.9 % for NG and 35.6% as compared to 13.7% for OPP. This is due to the decomposition of hemicellulose 238
as well as condensation reaction at these temperatures. During the process, oxygen and hydrogen is 239
released in form of H2O molecules, and energy content is preserved in the lipids and organic compounds. 240
30.0
40.0
50.0
60.0
70.0
80.0
90.0
100.0
200 220 240 260 280 300 320
Ma
ss y
ield
(%
)
Temperature (℃)
Mass yield for 30 minutes of reaction time
NG OPP
30.0
40.0
50.0
60.0
70.0
80.0
90.0
100.0
0 10 20 30 40 50 60
Ma
ss y
ield
(%
)
Time (min)
Mass yield at 260 ℃ of reaction
temperature
NG OPP
20
241
Figure 8: Energy yield (a) against temperature at constant reaction time of 30 minutes and (b) against 242
reaction time at constant temperature of 260 ℃ 243
244
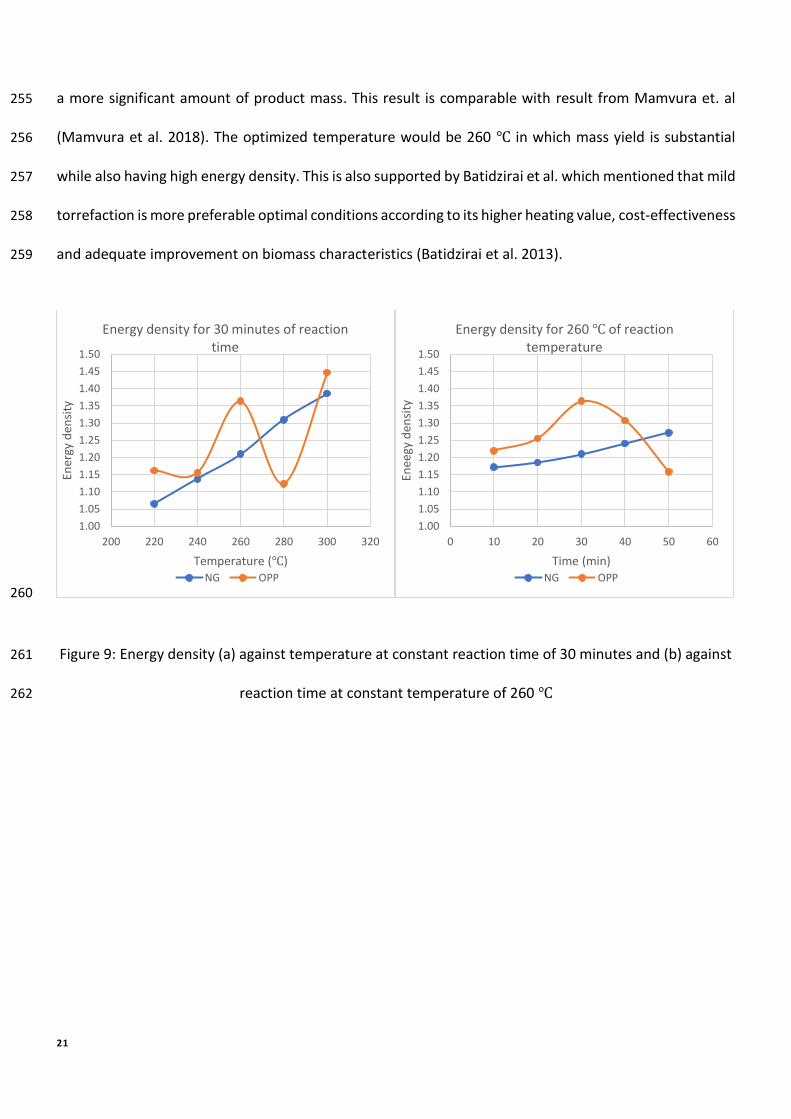
From Figure 9, the energy density for NG increases steadily with reaction temperature and 245
reaction time. For OPP, as the temperature and reaction time increases, the energy density increases 246
linearly but after reaches 30 minutes, the value drops. As written in literature, the energy density is 247
supposed to increase with rising temperature (Chen et al. 2015). This is due to the moisture and volatile 248
matter being released but the fixed carbon and ash remains in the torrefied biomass. The increment in 249
the energy density may be attributed to the more significant decrease in mass yield. 250
Based on the results of the yields and energy density, there is a need for optimization of 251
parameters on torrefaction to obtain the optimal condition. Although higher energy density is desired, 252
the amount of usable end product must also be maximized for it to be industrially feasible. It is found that 253
the optimal time would be at 30 minutes where the energy density is relatively high while also obtaining 254
50.0
60.0
70.0
80.0
90.0
100.0
200 220 240 260 280 300 320
En
erg
y y
ield
(%
)
Temperature (℃)
Energy yield for 30 minutes of reaction
NG OPP
50.0
60.0
70.0
80.0
90.0
100.0
0 10 20 30 40 50 60
En
erg
y t
ield
(%
)
Time (min)
Energy yield for 260 ℃ of reaction
temperature
NG OPP
21
a more significant amount of product mass. This result is comparable with result from Mamvura et. al 255
(Mamvura et al. 2018). The optimized temperature would be 260 ℃ in which mass yield is substantial 256
while also having high energy density. This is also supported by Batidzirai et al. which mentioned that mild 257
torrefaction is more preferable optimal conditions according to its higher heating value, cost-effectiveness 258
and adequate improvement on biomass characteristics (Batidzirai et al. 2013). 259
260
Figure 9: Energy density (a) against temperature at constant reaction time of 30 minutes and (b) against 261
reaction time at constant temperature of 260 ℃ 262
1.00
1.05
1.10
1.15
1.20
1.25
1.30
1.35
1.40
1.45
1.50
200 220 240 260 280 300 320
En
erg
y d
en
sity
Temperature (℃)
Energy density for 30 minutes of reaction
time
NG OPP
1.00
1.05
1.10
1.15
1.20
1.25
1.30
1.35
1.40
1.45
1.50
0 10 20 30 40 50 60
En
ee
gy
de
nsi
ty
Time (min)
Energy density for 260 ℃ of reaction
temperature
NG OPP

22
4.4 Using pyrolyzer for torrefaction 263
As mentioned by Chen et al. (Chen et al. 2021), torrefaction is considered as mild pyrolysis but 264
using lower range of temperature and with the purpose of upgrading biomass into coal-like material. Since 265
these two technologies shared similar properties, the same equipment can be used for both processes. 266
Similar results can also be obtained from Mamvura et al (Mamvura et al. 2018) where usage of tube 267
furnace was employed to do torrefaction process onto marula seeds and blue gum wood and resulted in 268
275 °C and 20 minutes. Almost similar results were found by Bridgeman et al. using reed canary grass, 269
wheat straw and willow using torrefaction reactor. 270
Torrefaction is considered to be one of the pretreatment methods for production of bio-oil from 271
pyrolysis reaction. By using pyrolyzer for torrefaction, there is no need for additional step between the 272
two process. By doing so, it eliminates the need for re-purging the reaction chamber with gases. This can 273
possibly lead to energy, time and cost saving when the same reactor is used for both processes. Winjobi 274
et al. has proven that employing torrefaction before a fast pyrolysis does not add up to the bio-oil 275
production cost when net present value is zero (Winjobi et al. 2016) which supported the reason for using 276
the same reactor for both process. 277
The only drawback of using pyrolyzer as torrefaction reactor is the need for modification to 278
accommodate the temperature and heating rate in accordance to torrefaction properties. Since 279
torrefaction occur at temperature lower than pyrolysis, the reactor has to be fitted in order to maintain 280
the temperature range. Despite this, modification onto pyrolyzer is fairly minor to be upgraded as 281
compared to the purchasing cost of torrefaction reactor. The scale-up cost for industrial use is speculated 282
to be not severe since only temperature and heating control must be upgraded. 283

23
5. Conclusions 284
Adding value into biomass to serve as raw material for end-uses application including fuel 285
production has been the focus towards renewable and sustainable energy. Therefore, the feasibility of 286
torrefaction to upgrade biomass properties as a feedstock has been evaluated. In this study, torrefaction 287
of Napier grass and oil palm petiole with varying reaction temperature and time is exhibited. The 288
elemental analysis has shown that the reduction of hydrogen and oxygen while carbon content seems to 289
be preserved with the increasing temperature and time. As compared with other feedstock from Van 290
Krevelen diagram, it is found that the torrefaction decreases the oxygen and more notably, the hydrogen. 291
With increasing temperature and time, moisture content was significantly reduced, making the torrefied 292
biomass to be more hydrophobic. The calorific values increase linearly for NG reaching maximum of24.33 293
MJ/kg at 300 ℃ and 30 minutes. As for OPP, the value varies with temperature where it increases until 294
260 ℃, go down and up again by 300 ℃ while the torrefied OPP’s calorific value reaches maximum 30 295
minutes reaction before decrease gradually as time increases. Mass yield and energy yield after 296
torrefaction also decreases steadily but more prominent effect can be seen with varying temperature. 297
The energy density of the torrefied NG increase linearly with both conditions. For OPP, the energy density 298
increases but drops at 280 ℃ and rise again to maximum of 1.45 at 300 ℃ while with increasing time, the 299
energy density increases to a maximum of 1.36 at 260 ℃ followed by gradual decline. This study shows 300
that torrefaction can be used as biomass treatment to enhance its fuel properties. Generally, temperature 301
has more pronounced effect where the degradation of structure is more severe. Higher temperature 302
seems to produce better physicochemical properties but also returning low yields, therefore optimization 303
is needed to maximize the advantages. There is a need for optimization using both temperature and time 304
which resulting to be optimized temperature and residence time are 260 ℃ and 30 minutes respectively. 305

24
Usage of pyrolysis reactor for torrefaction is feasible as the retrieved products exhibited properties of 306
expected and predicted torrefied samples. 307
6. Abbreviations 308
CHNS analyzer Carbon-hydrogen-nitrogen-sulfur analyzer
CHNS contents Carbon-hydrogen-nitrogen-sulfur contents
CV Calorific value
H/C ratio Hydrogen-to-carbon ratio
NG Napier grass
O/C ratio Oxygen-to-carbon ratio
OPP Oil Palm Petiole
309
7. Acknowledgements 310
The support for the experimental and analysis in the project from Department of Chemical 311
Engineering is highly appreciated. In addition, support from Ministry of Education Malaysia through HICoE 312
award to CBBR is duly acknowledged. 313

25
8. Ethics declarations 314
8.1 Ethics approval and consent to participate 315
Not applicable. 316
8.2 Consent for publication 317
Not applicable. 318
8.3 Competing interests 319
Not applicable. 320
8.4 Availability of data and materials 321
All the datasets obtained in this study are included in this article. 322
9. Funding 323
This research was partially funded by the Department of Chemical Engineering (ChE), Universiti 324
Teknologi PETRONAS and the analysis was partially supported by Higher Institution Centres of Excellence, 325
(HICoE) Grant 015MA0-052 under Dr. Noridah Binti Osman’s allocation. 326

26
10. Authors' information 327
10.1 Affliations 328
Department of Chemical Engineering, Universiti Teknologi PETRONAS, Bandar Seri Iskandar, 329
32610 Perak, Malaysia. 330
Syazmi Zul Arif Hakimi Saadon, Noridah Osman, Moviin Damodaran & Liew Shan En 331
HICOE – Center for Biofuel and Biochemical Research, Institute of Self-Sustainable Building, 332
Universiti Teknologi PETRONAS, 32610, Seri Iskandar, Perak, Malaysia. 333
Noridah Binti Osman, Syazmi Zul Arif Hakimi Saadon, Moviin Damodaran & Liew Shan En 334
10.2 Authors' contributions 335
SZAHS involved in data curation, writing and edit the manuscript. NBO contributed in 336
conceptualization, methodology, supervision, validation, writing and editing the manuscript. MD and LSE 337
contributed in data collection, data curation and writing original draft. All authors. All authors contributed 338
significantly and have approved the final manuscript 339
11. References 340
Baskoti N, Dhital HC, Aryal A (2018) Study of Effects of Temperature and Residence Time on Calorific 341
Value of Torrefied Biomass. Int J Res Eng Technol 07:31–35. 342
https://doi.org/10.15623/ijret.2018.0710006 343
Batidzirai B, Mignot APR, Schakel WB, et al (2013) Biomass torrefaction technology: Techno-economic 344

27
status and future prospects. Energy. https://doi.org/10.1016/j.energy.2013.09.035 345
Boersma A, Zwart R, Technology SR, Kiel JHA (2005) Torrefaction for Biomass Co-Firing in Existing Coal-346
Fired Power Stations Torrefaction for 347
Bridgeman TG, Jones JM, Shield I, Williams PT (2008) Torrefaction of reed canary grass, wheat straw and 348
willow to enhance solid fuel qualities and combustion properties. Fuel 87:844–856. 349
https://doi.org/10.1016/j.fuel.2007.05.041 350
Chen W, Kuo P (2011) Torrefaction and co-torrefaction characterization of hemicellulose , cellulose and 351
lignin as well as torrefaction of some basic constituents in biomass. Energy 36:803–811. 352
https://doi.org/10.1016/j.energy.2010.12.036 353
Chen WH, Cheng WY, Lu KM, Huang YP (2011) An evaluation on improvement of pulverized biomass 354
property for solid fuel through torrefaction. Appl Energy 88:3636–3644. 355
https://doi.org/10.1016/j.apenergy.2011.03.040 356
Chen WH, Du SW, Tsai CH, Wang ZY (2012) Torrefied biomasses in a drop tube furnace to evaluate their 357
utility in blast furnaces. Bioresour Technol 111:433–438. 358
https://doi.org/10.1016/j.biortech.2012.01.163 359
Chen WH, Lin BJ, Lin YY, et al (2021) Progress in biomass torrefaction: Principles, applications and 360
challenges. Prog. Energy Combust. Sci. 361
Chen WH, Peng J, Bi XT (2015) A state-of-the-art review of biomass torrefaction, densification and 362
applications. Renew. Sustain. Energy Rev. 44:847–866 363
Chen Y, Liu B, Yang H, et al (2014) Evolution of functional groups and pore structure during cotton and 364

28
corn stalks torrefaction and its correlation with hydrophobicity. Fuel. 365
https://doi.org/10.1016/j.fuel.2014.07.036 366
Cheng X, Huang Z, Wang Z, et al (2019) A novel on-site wheat straw pretreatment method: Enclosed 367
torrefaction. Bioresour Technol 281:48–55. https://doi.org/10.1016/j.biortech.2019.02.075 368
Eseltine D, Thanapal SS, Annamalai K, Ranjan D (2013) Torrefaction of woody biomass (Juniper and 369
Mesquite) using inert and non-inert gases. Fuel 113:379–388. 370
https://doi.org/10.1016/j.fuel.2013.04.085 371
Felfli FF, Luengo CA, Suárez JA, Beatón PA (2005) Wood briquette torrefaction. Energy Sustain Dev 9:19–372
22. https://doi.org/10.1016/S0973-0826(08)60519-0 373
Getabelew A, G Ni, B B (2018) Improvement of the Energy Density of Rice Husk Using Dry and Chemical 374
Treated Torrefaction. J Adv Chem Eng 08: https://doi.org/10.4172/2090-4568.1000185 375
Goh CS, Tan KT, Lee KT, Bhatia S (2010) Bio-ethanol from lignocellulose : Status , perspectives and 376
challenges in Malaysia. Bioresour Technol 101:4834–4841. 377
https://doi.org/10.1016/j.biortech.2009.08.080 378
Granados DA, Basu P, Chejne F, Nhuchhen DR (2017) Detailed investigation into torrefaction of wood in 379
a two-stage inclined rotary torrefier. Energy and Fuels. 380
https://doi.org/10.1021/acs.energyfuels.6b02524 381
Mamvura TA, Pahla G, Muzenda E (2018) Torrefaction of waste biomass for application in energy 382
production in South Africa. South African J Chem Eng 25:1–12. 383
https://doi.org/10.1016/j.sajce.2017.11.003 384

29
Mohammed IY, Abakr YA, Kazi FK, et al (2015) Comprehensive characterization of Napier grass as a 385
feedstock for thermochemical conversion. Energies 8:3403–3417. 386
https://doi.org/10.3390/en8053403 387
Poudel J, Karki S, Oh SC (2018) Valorization of waste wood as a solid fuel by torrefaction. Energies 11:. 388
https://doi.org/10.3390/en11071641 389
Roslan AMR, Ahmad M, Mohd K (2014) Investigation of Oil Palm Frond Properties for Use as 390
Biomaterials and Biofuels. Trop Agric Dev 58:26–29. https://doi.org/10.11248/jsta.58.26 391
Rousset P, Aguiar C, Labbé N, Commandré JM (2011) Enhancing the combustible properties of bamboo 392
by torrefaction. Bioresour Technol 102:8225–8231. https://doi.org/10.1016/j.biortech.2011.05.093 393
Samson R, Mani S, Boddey R, et al (2005) The potential of C4 perennial grasses for developing a global 394
BIOHEAT Industry. CRC Crit Rev Plant Sci 24:461–495. 395
https://doi.org/10.1080/07352680500316508 396
Satpathy SK, Tabil LG, Meda V, et al (2014) Torrefaction of wheat and barley straw after microwave 397
heating. Fuel 124:269–278. https://doi.org/10.1016/j.fuel.2014.01.102 398
Sun Y, Jiang J, Zhao S, et al (2012) Review of torrefaction reactor technology. In: Advanced Materials 399
Research 400
Uemura Y, Omar WN, Tsutsui T, Yusup SB (2011) Torrefaction of oil palm wastes. Fuel 90:2585–2591. 401
https://doi.org/10.1016/j.fuel.2011.03.021 402
Winjobi O, Shonnard DR, Bar-Ziv E, Zhou W (2016) Techno-economic assessment of the effect of 403
torrefaction on fast pyrolysis of pine. Biofuels, Bioprod Biorefining. 404

30
https://doi.org/10.1002/bbb.1624 405
406

Figures
Figure 1
(a) Fixed-bed pyrolyzer used for the torrefaction process, (b) Schematic Diagram of torrefactionexperiment in �xed bed drop-type pyrolyzer
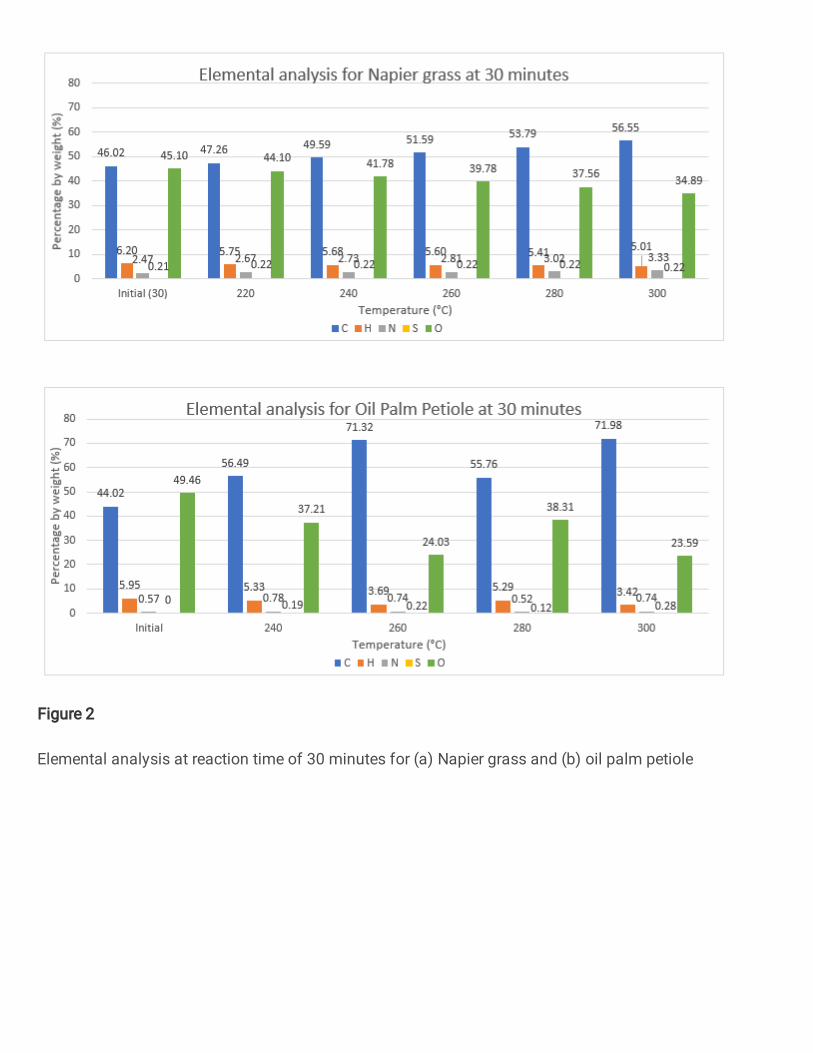
Figure 2
Elemental analysis at reaction time of 30 minutes for (a) Napier grass and (b) oil palm petiole

Figure 3
Elemental analysis at reaction temperature of 260 of reaction time for (a) Napier grass and (b) oil palmpetiole
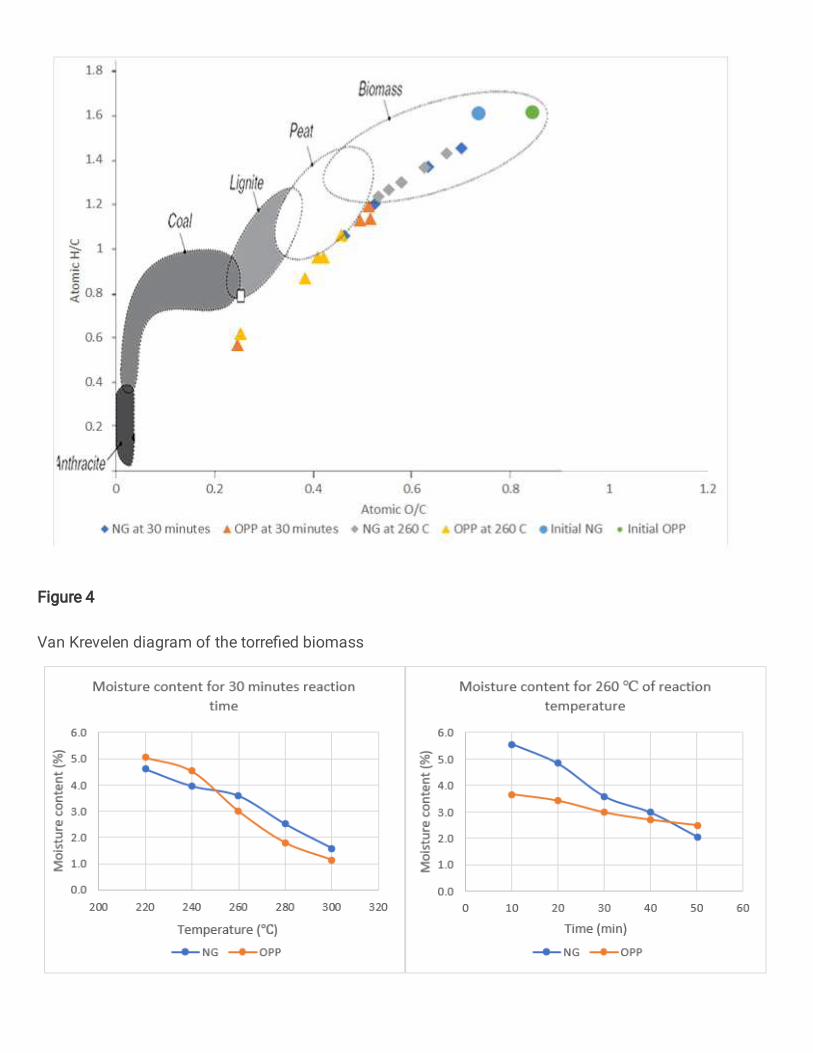
Figure 4
Van Krevelen diagram of the torre�ed biomass

Figure 5
Moisture content (a) against temperature at constant reaction time of 30 minutes and (b) againstreaction time at constant temperature of 260
Figure 6
Calori�c value of torre�ed biomasses (a) against temperature at constant reaction time of 30 minutesand (b) against reaction time at constant temperature of 260
Figure 7
Mass yield (a) against temperature at constant reaction time of 30 minutes and (b) against reaction timeat constant temperature of 260
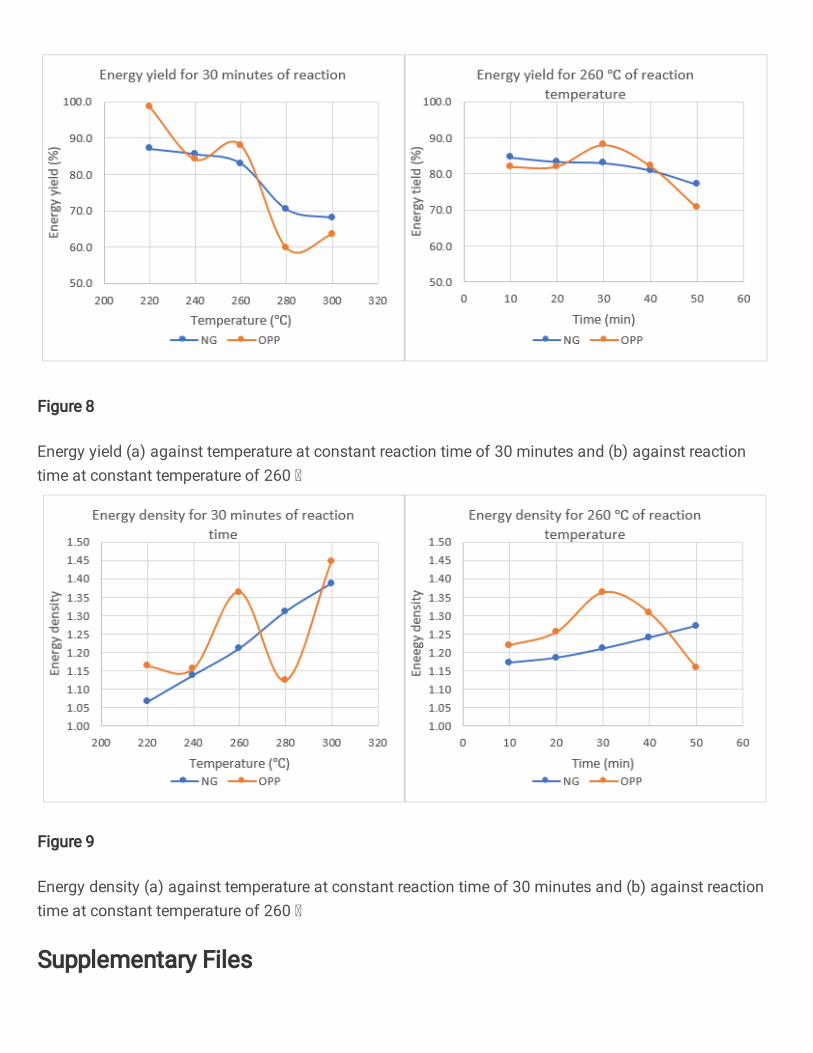
Figure 8
Energy yield (a) against temperature at constant reaction time of 30 minutes and (b) against reactiontime at constant temperature of 260
Figure 9
Energy density (a) against temperature at constant reaction time of 30 minutes and (b) against reactiontime at constant temperature of 260
Supplementary Files

This is a list of supplementary �les associated with this preprint. Click to download.
BioresourcesandBioprocessingGraphicalabstract.png
Related Documents


![5a. BIOPALIWA 1 h [tryb zgodno [ci]fluid.wme.pwr.wroc.pl › ~spalanie › dydaktyka › spalanie... · Toryfikacja biomasy (torrefaction) Toryfikacja (torrefaction) polega na traktowaniu](https://static.cupdf.com/doc/110x72/5f1e44597d33705ff735f910/5a-biopaliwa-1-h-tryb-zgodno-cifluidwmepwrwrocpl-a-spalanie-a-dydaktyka.jpg)