Economic Impact Study Toronto, Ontario June 24-July 3, 2011 2011 TD TORONTO JAZZ FESTIVAL

Welcome message from author
This document is posted to help you gain knowledge. Please leave a comment to let me know what you think about it! Share it to your friends and learn new things together.
Transcript
Economic Impact Study Toronto, Ontario June 24-July 3, 2011
2011 TD TORONTO JAZZ FESTIVAL
2011 Enigma Research Corporation® Page 1
2011 TD Toronto Jazz Festival Economic Impact Study
Contents
HIGHLIGHTS 3
SECTION 1: ECONOMIC BENEFITS 5
SECTION 2: TRAVEL AND TOURISM 11
SECTION 3: SPONSORSHIP 14
SECTION 4: MARKETING AND OPERATIONS 21
SECTION 5: DEMOGRAPHICS 28
SECTION 6: RESPONDENTS’ COMMENTS 35
2011 Enigma Research Corporation® Page 2
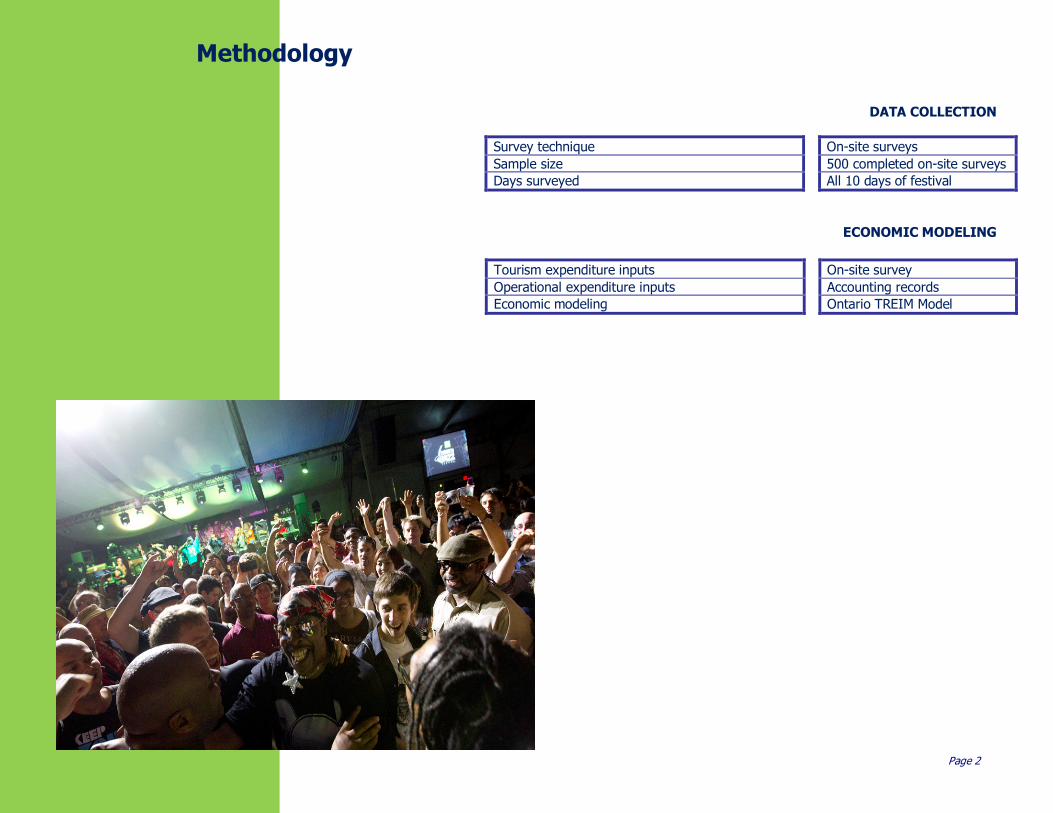
Methodology
DATA COLLECTION
Survey technique On-site surveys
Sample size 500 completed on-site surveys
Days surveyed All 10 days of festival
ECONOMIC MODELING
Tourism expenditure inputs On-site survey
Operational expenditure inputs Accounting records
Economic modeling Ontario TREIM Model
2011 Enigma Research Corporation® Page 3
Highlights
1. Total economic impact of festival estimated at $22.7M
• Impact derived from spending by non-locals and event operations • Estimate includes direct, indirect and induced impacts
2. Local employment supported by event
• Festival-related spending supported equivalent of 298 full-year jobs
• Spending also supported tax revenue at all three levels of government 3. Festival attracts tourists from many regions
• Approximately one-third of attendees resided beyond 40km
• Among non-locals 12% resided outside Ontario
4. Local residents spent $20.5M related to event
• While not economic impact, demonstrates local support for festival
• Locals spent $5.8M on restaurants, bars, and clubs
5. Celebrate Ontario funding resulted in additional $2.6M spending in region
• Aretha Franklin concert, festival mobile website and restaurant and club guide influenced many non-locals to attend • Spending by these attendees who attended specifically for these programs contributed to increase
2011 Enigma Research Corporation® Page 4
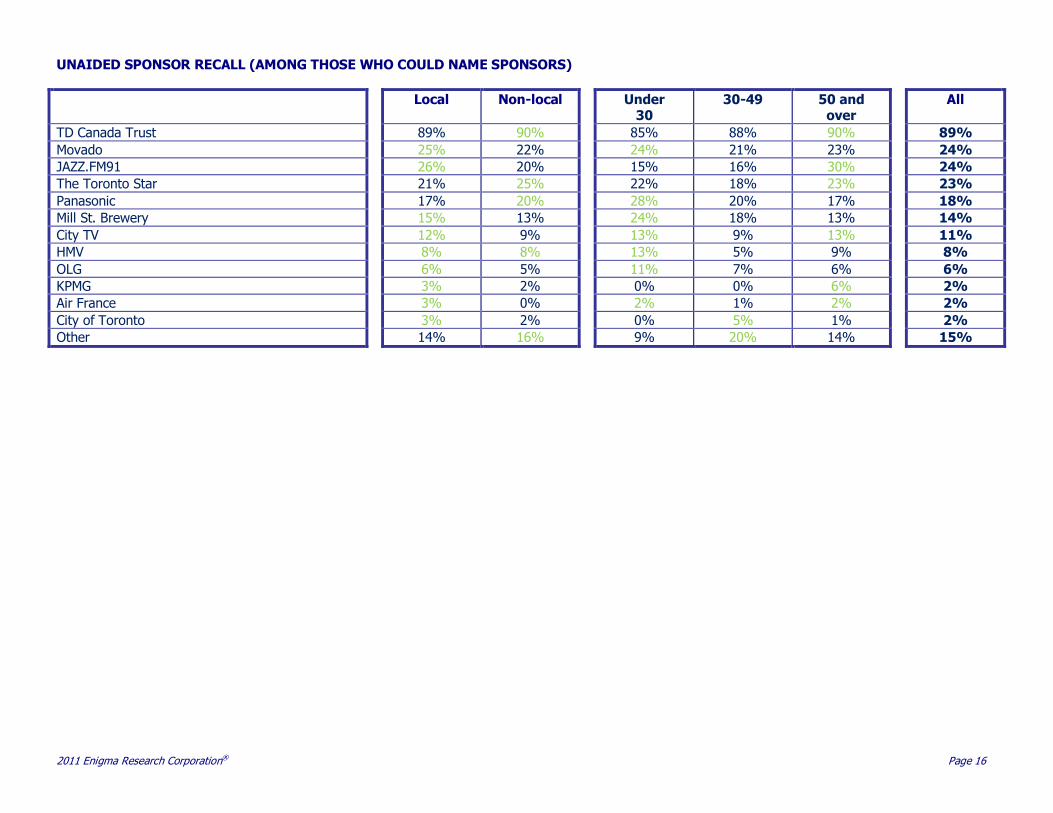
6. Sponsors recalled and appreciated by attendees
• TD Canada Trust by far most recalled sponsor • Movado, JAZZ.FM91 and The Toronto Star also recalled by almost one-quarter of attendees
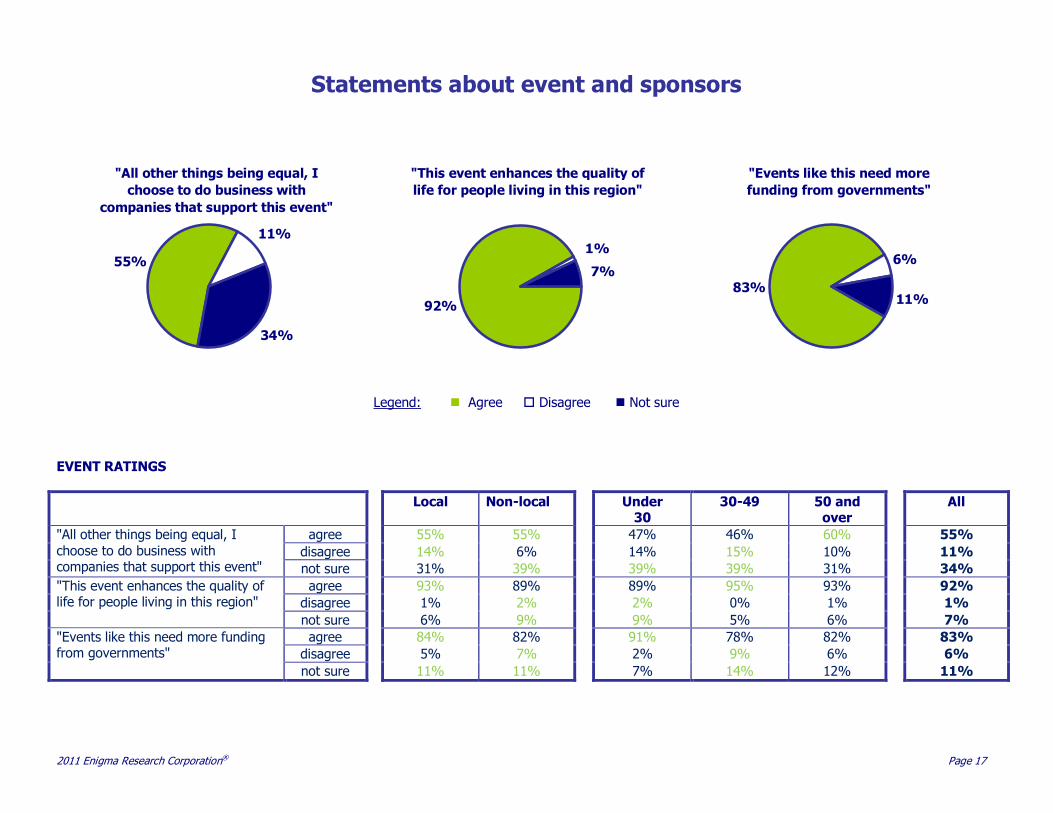
7. Attendees believe event enhances quality of life and deserves government funding
• 92% agree event enhances quality of life for residents • Vast majority feel event deserves additional government funding
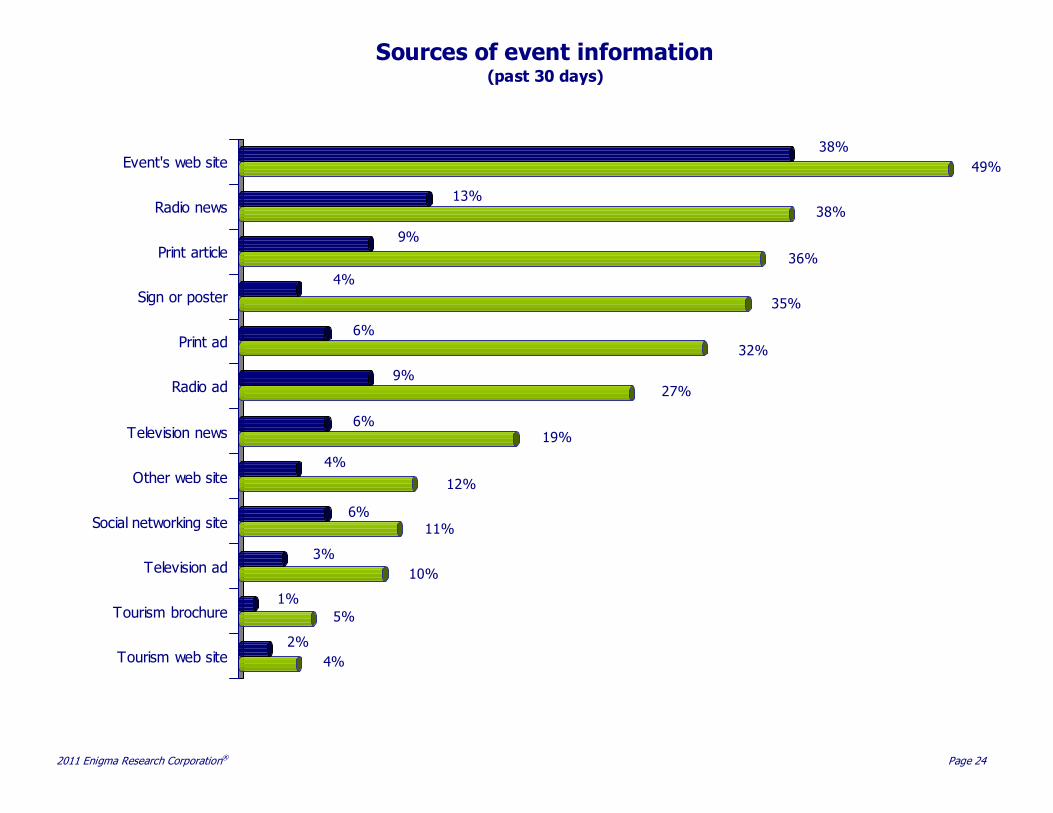
8. Festival's web site, radio, print articles/ads and signs or posters most popular information sources
• Almost half consulted the festival's website
• Approximately one-third obtained information from radio news, print articles, signs or posters and print ads
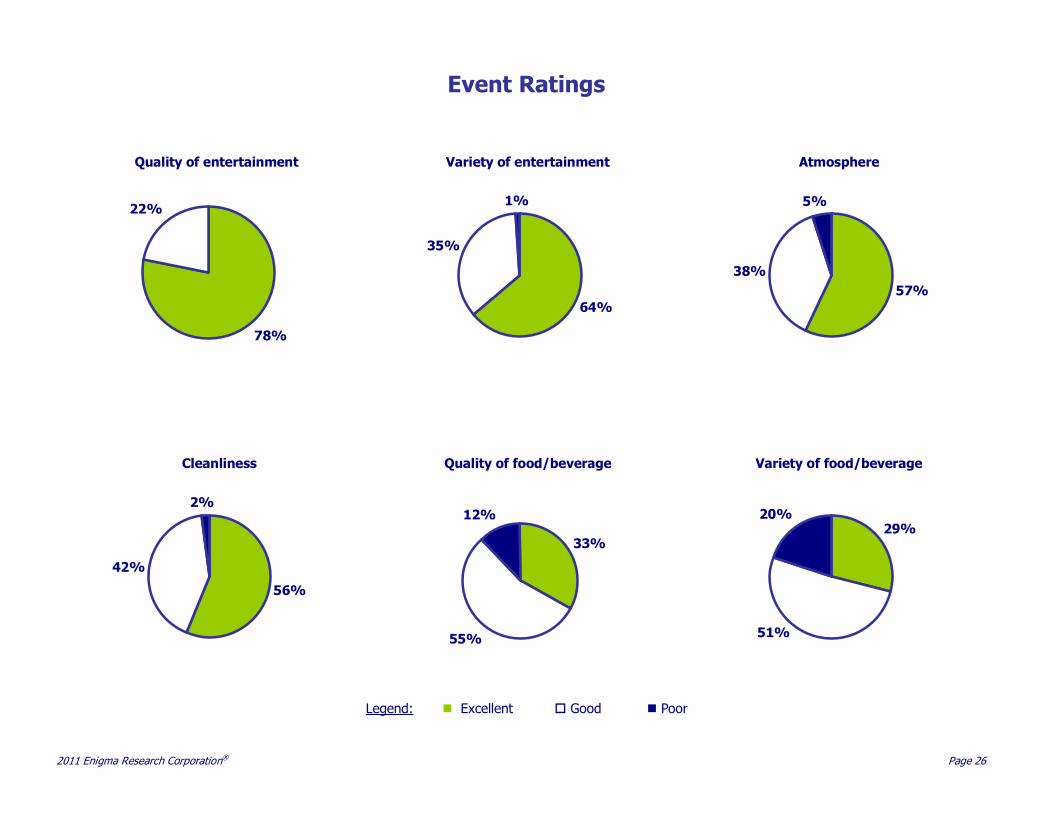
9. Event highly rated by attendees
• Majority rated quality and variety of entertainment, atmosphere and cleanliness as excellent
• Sponsors support an event with exceptional visitor satisfaction
2011 Enigma Research Corporation® Page 5
2011 TD Toronto Jazz Festival Economic Impact Study
Section 1: Economic Benefits
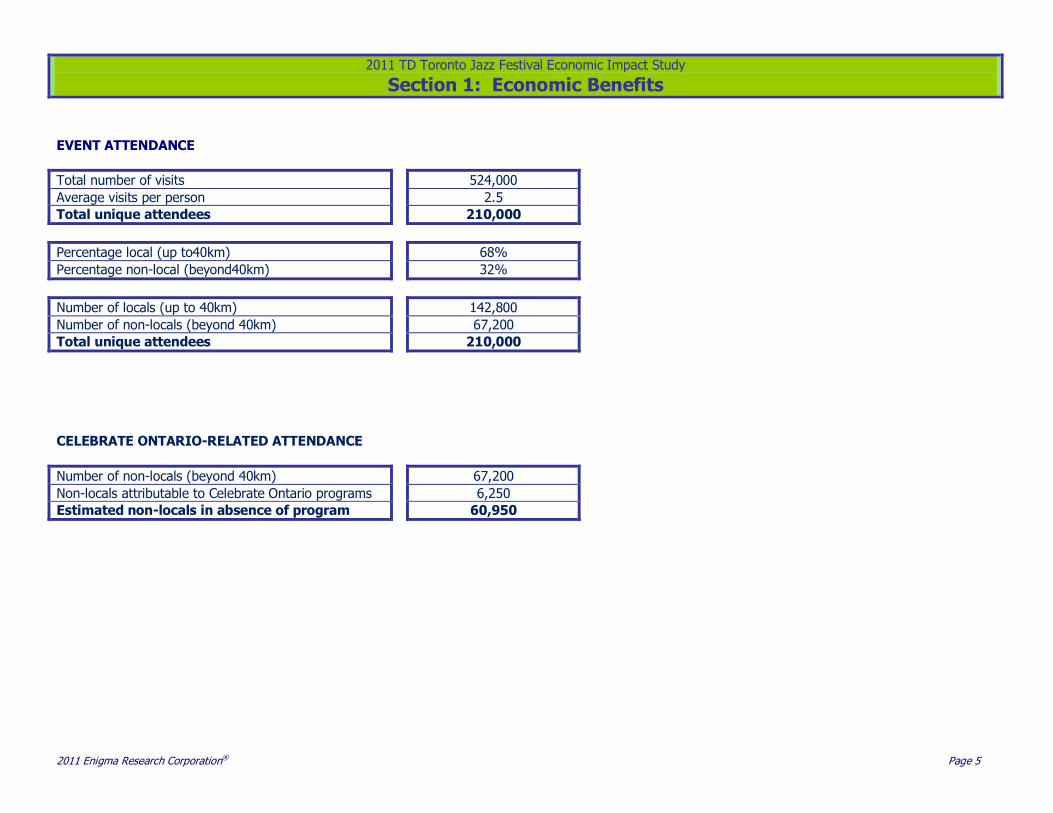
EVENT ATTENDANCE
Total number of visits 524,000
Average visits per person 2.5
Total unique attendees 210,000
Percentage local (up to40km) 68%
Percentage non-local (beyond40km) 32%
Number of locals (up to 40km) 142,800
Number of non-locals (beyond 40km) 67,200
Total unique attendees 210,000
CELEBRATE ONTARIO-RELATED ATTENDANCE
Number of non-locals (beyond 40km) 67,200
Non-locals attributable to Celebrate Ontario programs 6,250
Estimated non-locals in absence of program 60,950
2011 Enigma Research Corporation® Page 6
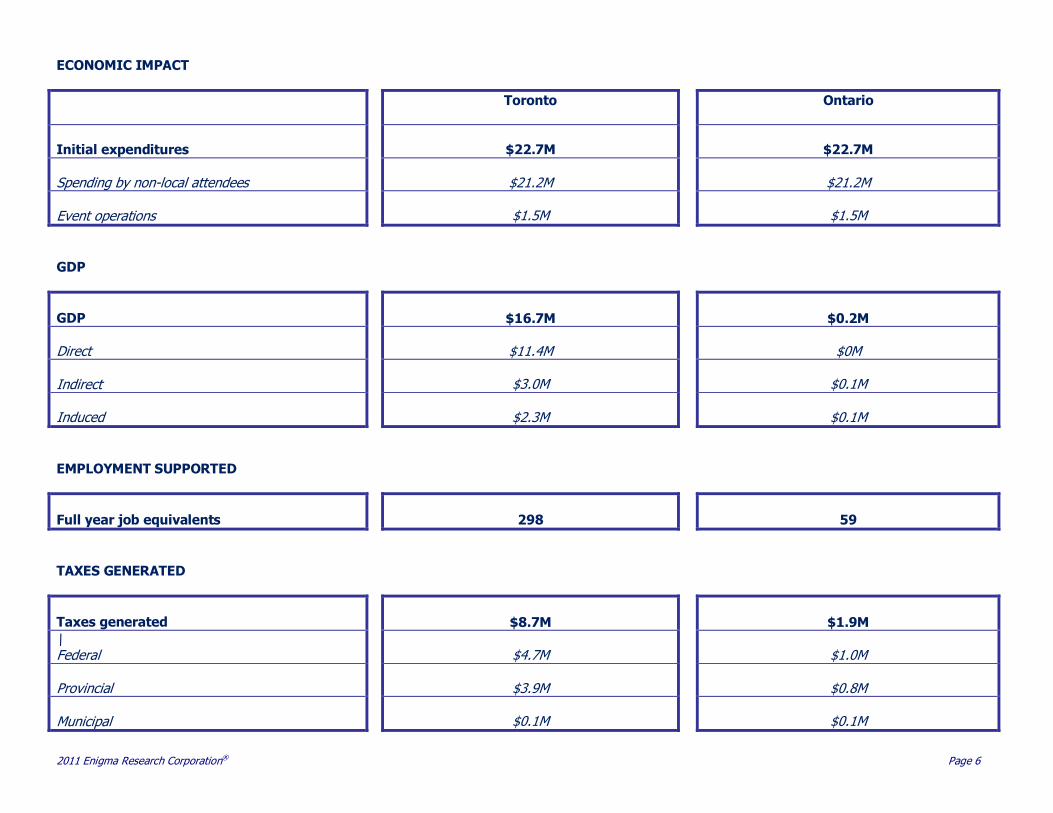
ECONOMIC IMPACT
Toronto
Ontario
Initial expenditures
$22.7M
$22.7M
Spending by non-local attendees
$21.2M
$21.2M
Event operations
$1.5M
$1.5M
GDP
GDP
$16.7M
$0.2M
Direct
$11.4M
$0M
Indirect
$3.0M
$0.1M
Induced
$2.3M
$0.1M
EMPLOYMENT SUPPORTED
Full year job equivalents
298
59
TAXES GENERATED
Taxes generated
$8.7M
$1.9M
\ Federal
$4.7M
$1.0M
Provincial
$3.9M
$0.8M
Municipal
$0.1M
$0.1M
2011 Enigma Research Corporation® Page 7
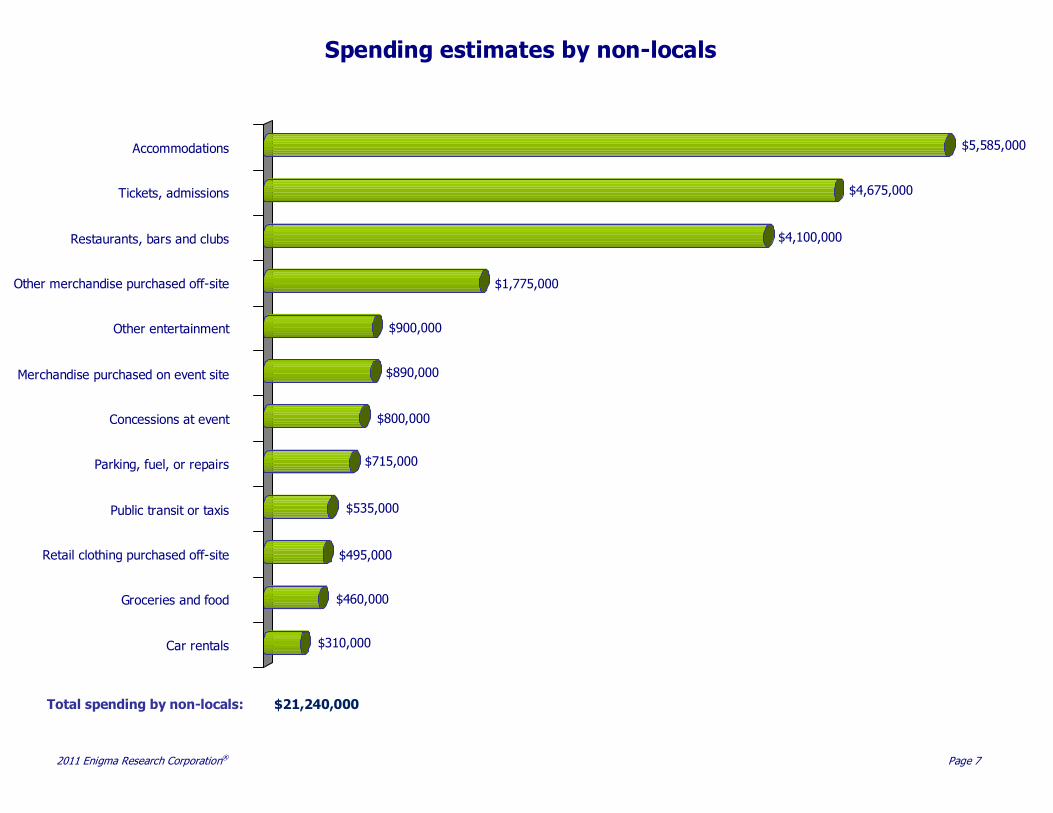
Total spending by non-locals: $21,240,000
$310,000
$460,000
$495,000
$535,000
$715,000
$800,000
$890,000
$900,000
$1,775,000
$4,100,000
$4,675,000
$5,585,000
Car rentals
Groceries and food
Retail clothing purchased off-site
Public transit or taxis
Parking, fuel, or repairs
Concessions at event
Merchandise purchased on event site
Other entertainment
Other merchandise purchased off-site
Restaurants, bars and clubs
Tickets, admissions
Accommodations
Spending estimates by non-locals
2011 Enigma Research Corporation® Page 8
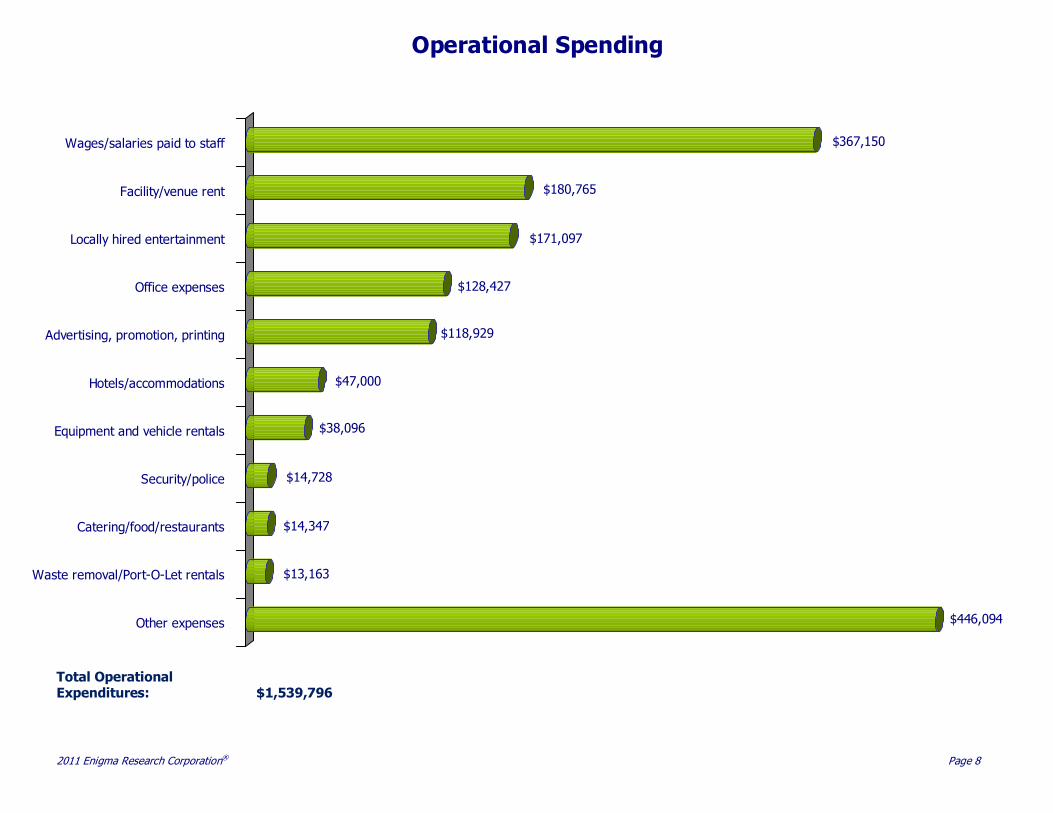
Total Operational Expenditures: $1,539,796
$446,094
$13,163
$14,347
$14,728
$38,096
$47,000
$118,929
$128,427
$171,097
$180,765
$367,150
Other expenses
Waste removal/Port-O-Let rentals
Catering/food/restaurants
Security/police
Equipment and vehicle rentals
Hotels/accommodations
Advertising, promotion, printing
Office expenses
Locally hired entertainment
Facility/venue rent
Wages/salaries paid to staff
Operational Spending
2011 Enigma Research Corporation® Page 9
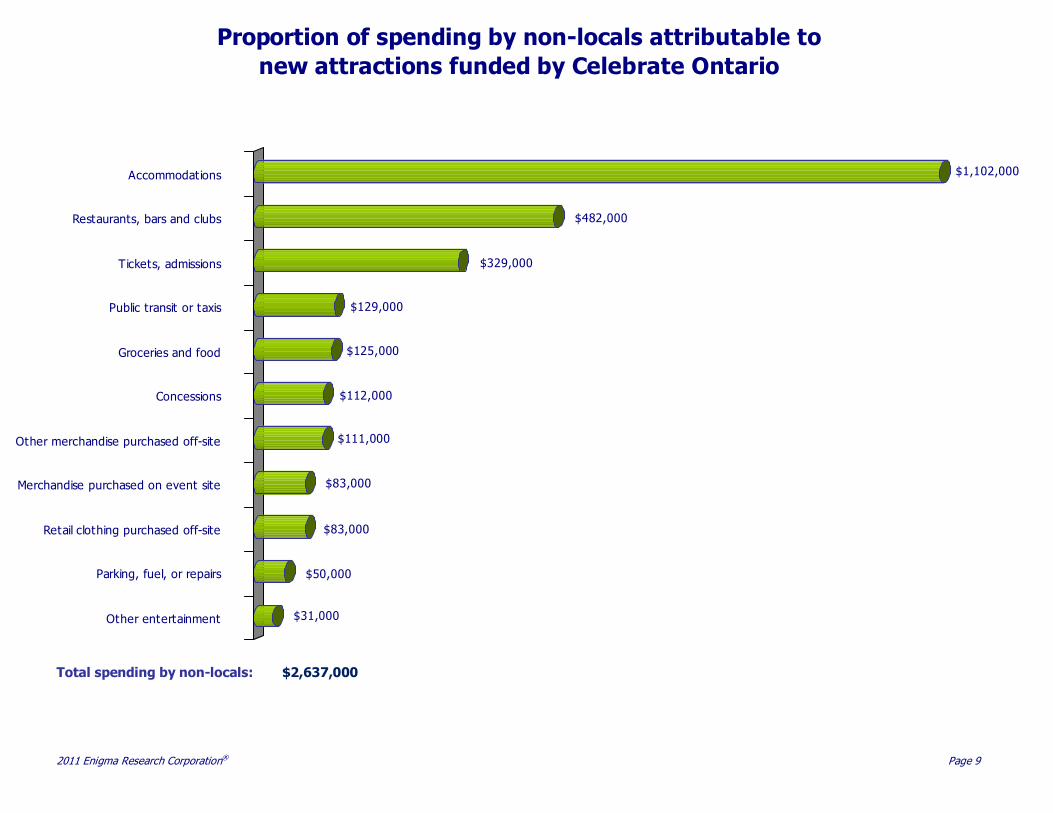
Total spending by non-locals: $2,637,000
$31,000
$50,000
$83,000
$83,000
$111,000
$112,000
$125,000
$129,000
$329,000
$482,000
$1,102,000
Other entertainment
Parking, fuel, or repairs
Retail clothing purchased off-site
Merchandise purchased on event site
Other merchandise purchased off-site
Concessions
Groceries and food
Public transit or taxis
Tickets, admissions
Restaurants, bars and clubs
Accommodations
Proportion of spending by non-locals attributable to
new attractions funded by Celebrate Ontario
2011 Enigma Research Corporation® Page 10
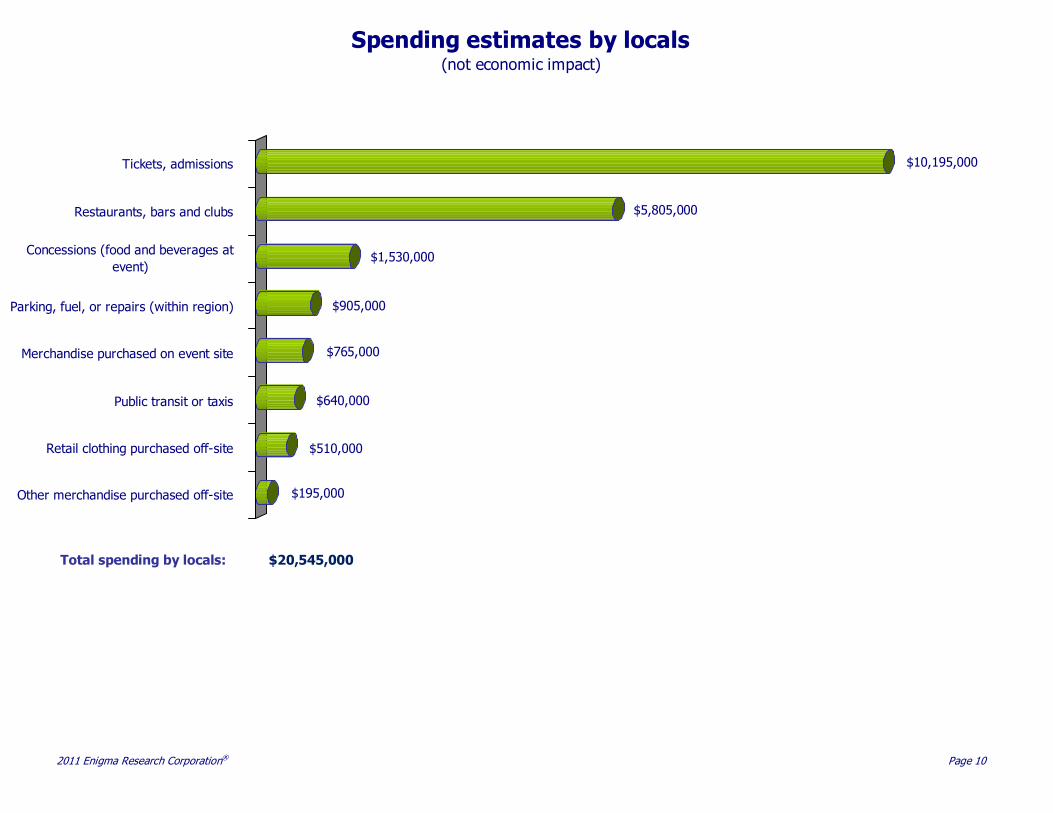
Total spending by locals: $20,545,000
$195,000
$510,000
$640,000
$765,000
$905,000
$1,530,000
$5,805,000
$10,195,000
Other merchandise purchased off-site
Retail clothing purchased off-site
Public transit or taxis
Merchandise purchased on event site
Parking, fuel, or repairs (within region)
Concessions (food and beverages at
event)
Restaurants, bars and clubs
Tickets, admissions
Spending estimates by locals(not economic impact)
2011 Enigma Research Corporation® Page 11
2011 TD Toronto Jazz Festival Economic Impact Study
Section 2: Travel and Tourism
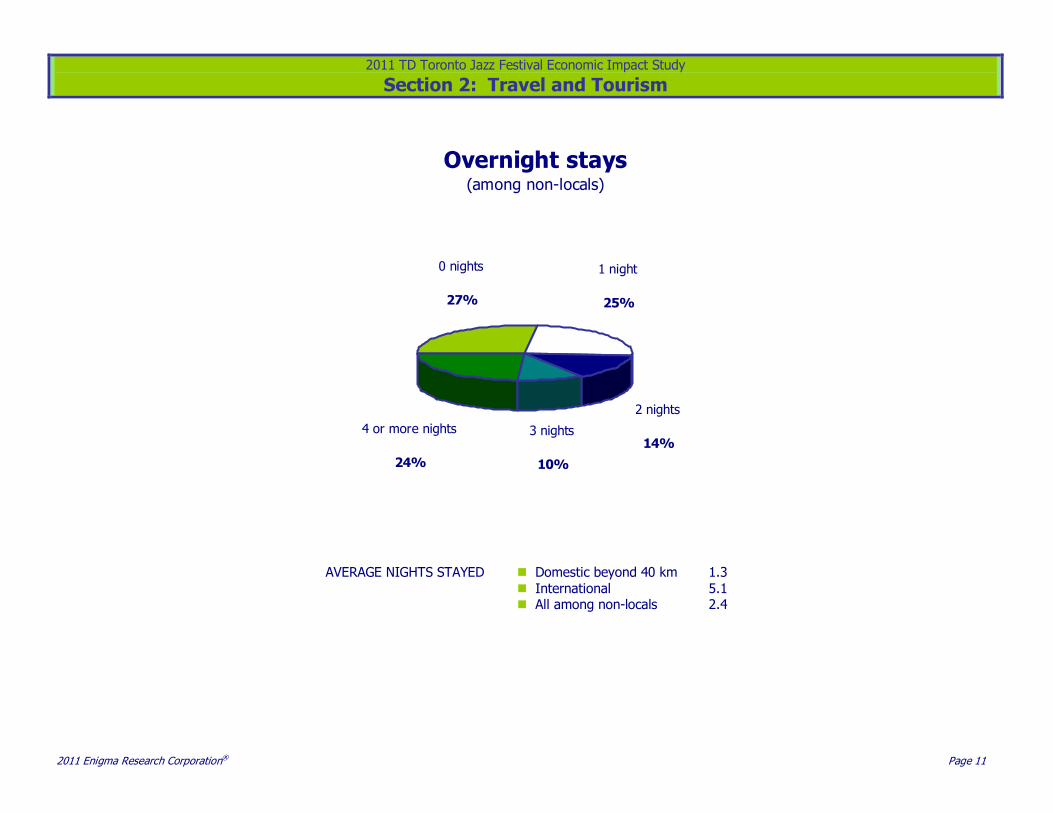
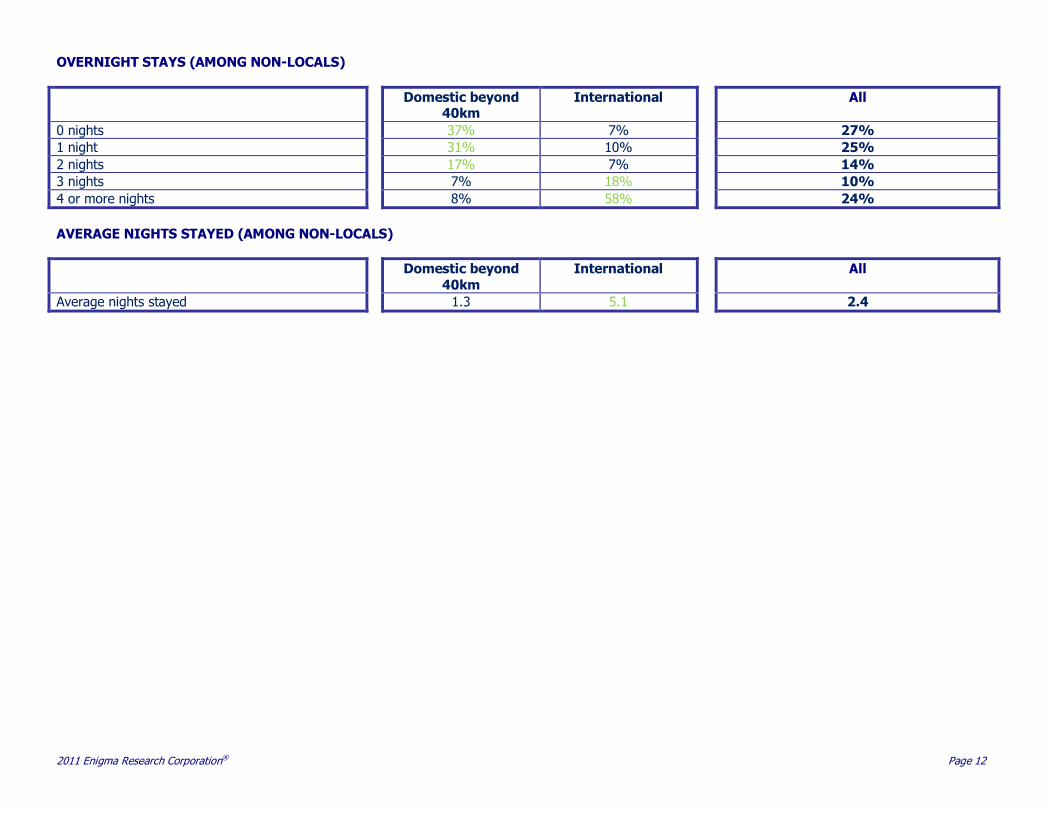
AVERAGE NIGHTS STAYED � Domestic beyond 40 km 1.3 � International 5.1 � All among non-locals 2.4
Overnight stays(among non-locals)
4 or more nights
24%
3 nights
10%
2 nights
14%
1 night
25%
0 nights
27%
2011 Enigma Research Corporation® Page 12
OVERNIGHT STAYS (AMONG NON-LOCALS)
Domestic beyond 40km
International
All
0 nights 37% 7% 27%
1 night 31% 10% 25%
2 nights 17% 7% 14%
3 nights 7% 18% 10%
4 or more nights 8% 58% 24%
AVERAGE NIGHTS STAYED (AMONG NON-LOCALS)
Domestic beyond 40km
International
All
Average nights stayed 1.3 5.1 2.4
2011 Enigma Research Corporation® Page 13
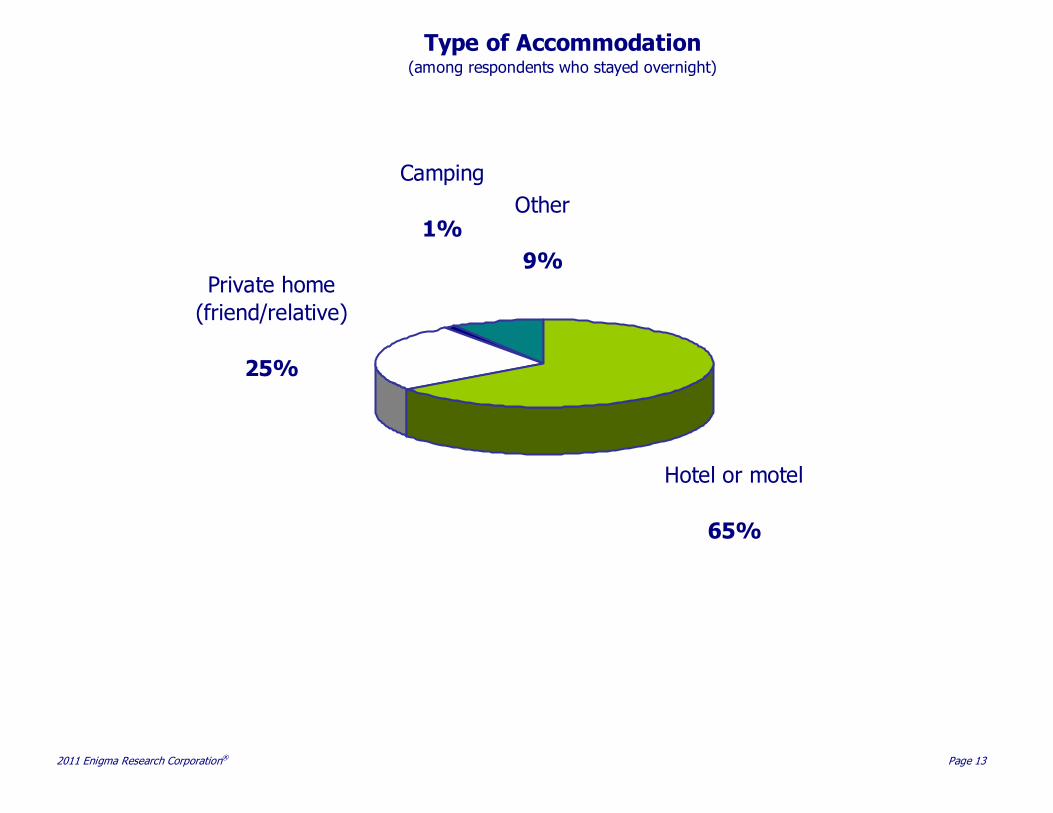
Type of Accommodation (among respondents who stayed overnight)
Other
9%
Camping
1%
Private home
(friend/relative)
25%
Hotel or motel
65%
2011 Enigma Research Corporation® Page 14
2011 TD Toronto Jazz Festival Economic Impact Study
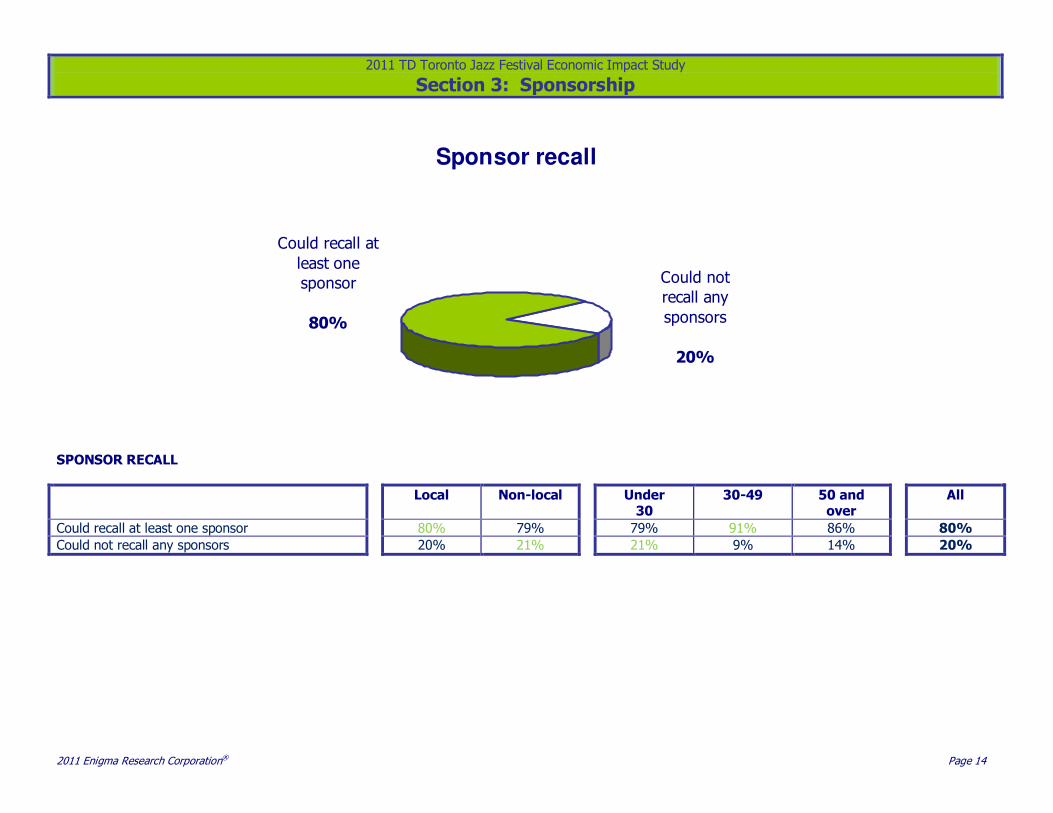
Section 3: Sponsorship SPONSOR RECALL
Local Non-local Under 30
30-49 50 and over
All
Could recall at least one sponsor 80% 79% 79% 91% 86% 80%
Could not recall any sponsors 20% 21% 21% 9% 14% 20%
Sponsor recall
Could recall at
least one
sponsor
80%
Could not
recall any
sponsors
20%
2011 Enigma Research Corporation® Page 15
15%
2%
2%
2%
6%
8%
11%
14%
18%
23%
24%
24%
89%
Other
City of Toronto
AirFrance
KPMG
OLG
HMV
City TV
Mill St. Brewery
Panasonic
The Toronto Star
JAZZ.FM91
Movado
TD Canada Trust
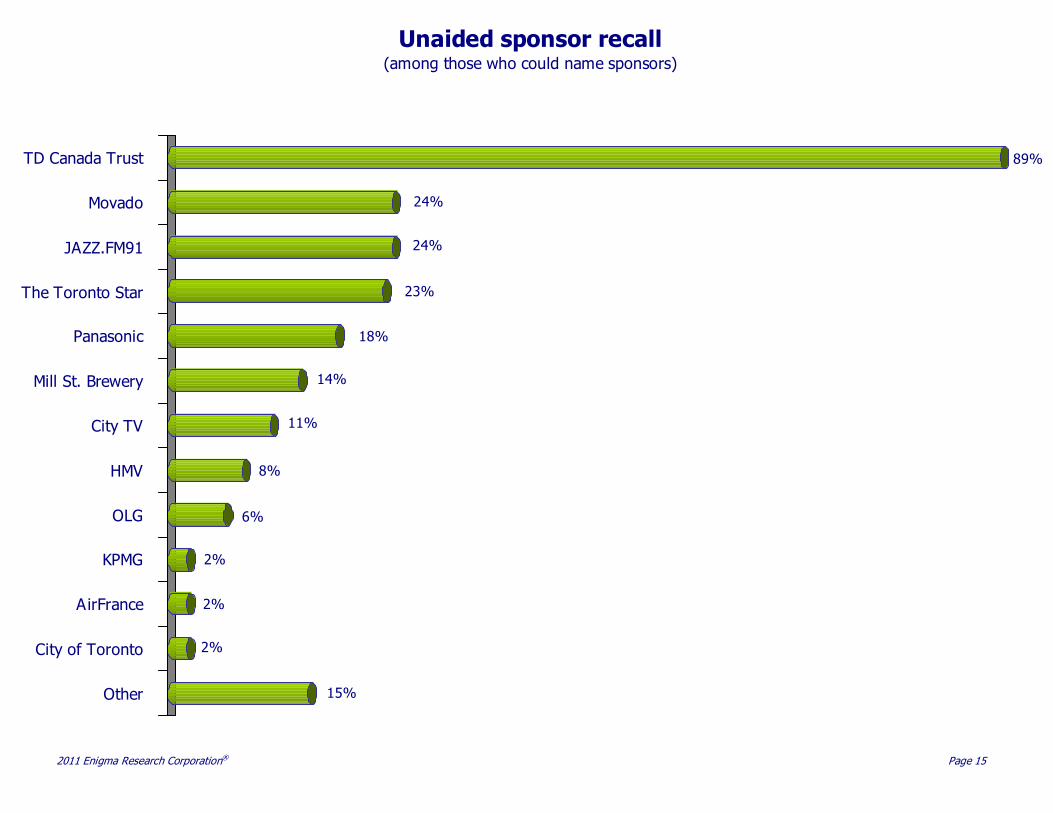
Unaided sponsor recall(among those who could name sponsors)
2011 Enigma Research Corporation® Page 16
UNAIDED SPONSOR RECALL (AMONG THOSE WHO COULD NAME SPONSORS)
Local Non-local Under 30
30-49 50 and over
All
TD Canada Trust 89% 90% 85% 88% 90% 89%
Movado 25% 22% 24% 21% 23% 24%
JAZZ.FM91 26% 20% 15% 16% 30% 24%
The Toronto Star 21% 25% 22% 18% 23% 23%
Panasonic 17% 20% 28% 20% 17% 18%
Mill St. Brewery 15% 13% 24% 18% 13% 14%
City TV 12% 9% 13% 9% 13% 11%
HMV 8% 8% 13% 5% 9% 8%
OLG 6% 5% 11% 7% 6% 6%
KPMG 3% 2% 0% 0% 6% 2%
Air France 3% 0% 2% 1% 2% 2%
City of Toronto 3% 2% 0% 5% 1% 2%
Other 14% 16% 9% 20% 14% 15%
2011 Enigma Research Corporation® Page 17
Statements about event and sponsors
"All other things being equal, I
choose to do business with
companies that support this event"
34%
55%
11%
"This event enhances the quality of
life for people living in this region"
1%
92%
7%
"Events like this need more
funding from governments"
6%
83%11%
Legend: � Agree � Disagree � Not sure EVENT RATINGS
Local Non-local Under 30
30-49 50 and over
All
agree 55% 55% 47% 46% 60% 55%
disagree 14% 6% 14% 15% 10% 11%
"All other things being equal, I choose to do business with companies that support this event" not sure 31% 39% 39% 39% 31% 34%
agree 93% 89% 89% 95% 93% 92%
disagree 1% 2% 2% 0% 1% 1%
"This event enhances the quality of life for people living in this region" not sure 6% 9% 9% 5% 6% 7%
agree 84% 82% 91% 78% 82% 83%
disagree 5% 7% 2% 9% 6% 6%
"Events like this need more funding from governments" not sure 11% 11% 7% 14% 12% 11%
2011 Enigma Research Corporation® Page 18
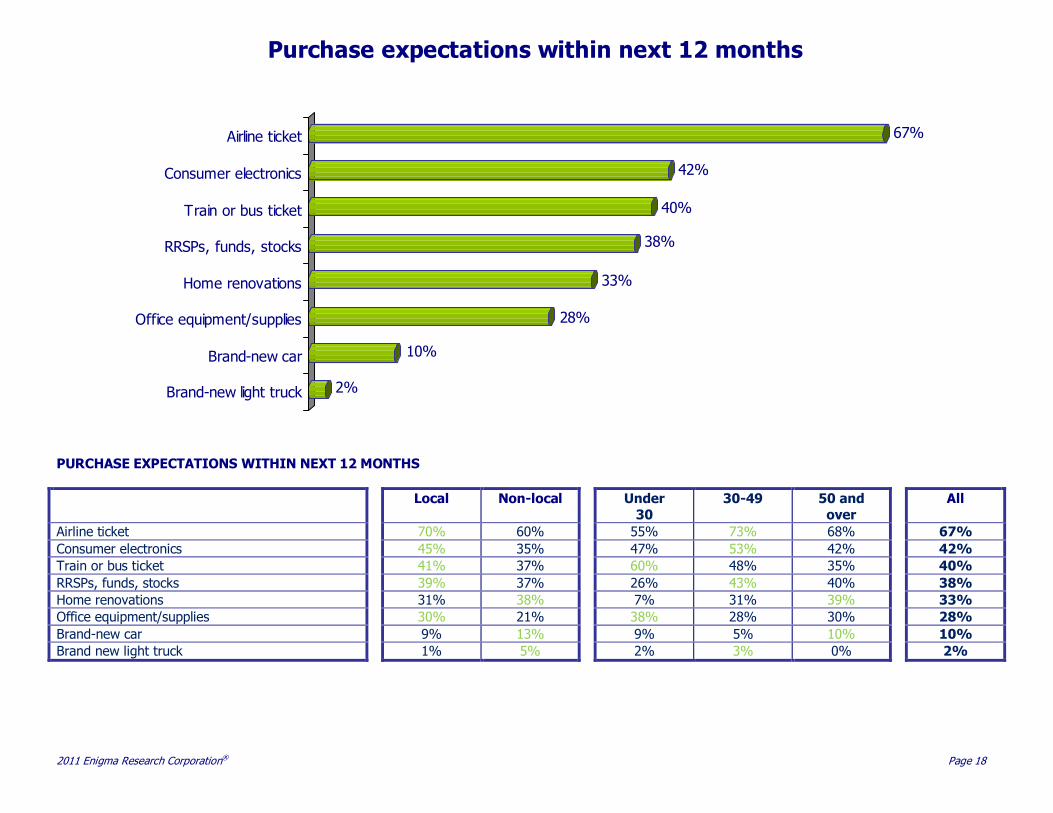
PURCHASE EXPECTATIONS WITHIN NEXT 12 MONTHS
Local Non-local Under 30
30-49 50 and over
All
Airline ticket 70% 60% 55% 73% 68% 67%
Consumer electronics 45% 35% 47% 53% 42% 42%
Train or bus ticket 41% 37% 60% 48% 35% 40%
RRSPs, funds, stocks 39% 37% 26% 43% 40% 38%
Home renovations 31% 38% 7% 31% 39% 33%
Office equipment/supplies 30% 21% 38% 28% 30% 28%
Brand-new car 9% 13% 9% 5% 10% 10%
Brand new light truck 1% 5% 2% 3% 0% 2%
2%
10%
28%
33%
38%
40%
42%
67%
Brand-new light truck
Brand-new car
Office equipment/supplies
Home renovations
RRSPs, funds, stocks
Train or bus ticket
Consumer electronics
Airline ticket
Purchase expectations within next 12 months
2011 Enigma Research Corporation® Page 19
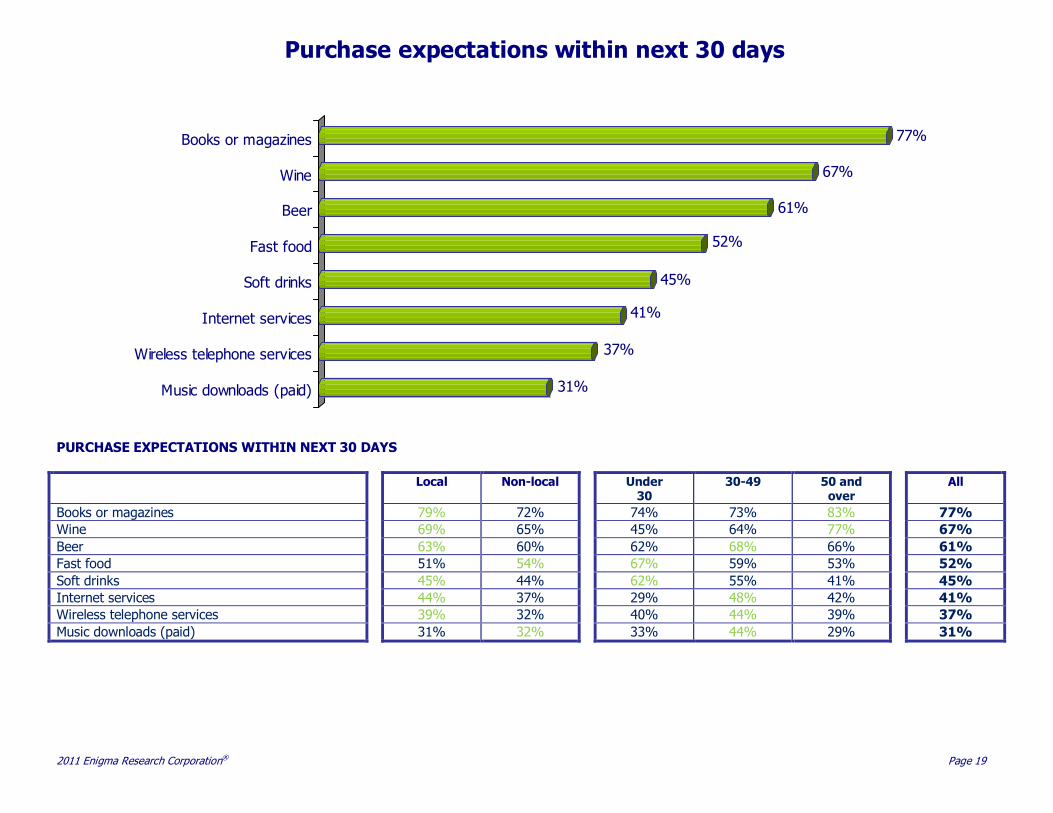
PURCHASE EXPECTATIONS WITHIN NEXT 30 DAYS
Local Non-local Under 30
30-49 50 and over
All
Books or magazines 79% 72% 74% 73% 83% 77%
Wine 69% 65% 45% 64% 77% 67%
Beer 63% 60% 62% 68% 66% 61%
Fast food 51% 54% 67% 59% 53% 52%
Soft drinks 45% 44% 62% 55% 41% 45%
Internet services 44% 37% 29% 48% 42% 41%
Wireless telephone services 39% 32% 40% 44% 39% 37%
Music downloads (paid) 31% 32% 33% 44% 29% 31%
31%
37%
41%
45%
52%
61%
67%
77%
Music downloads (paid)
Wireless telephone services
Internet services
Soft drinks
Fast food
Beer
Wine
Books or magazines
Purchase expectations within next 30 days
2011 Enigma Research Corporation® Page 20
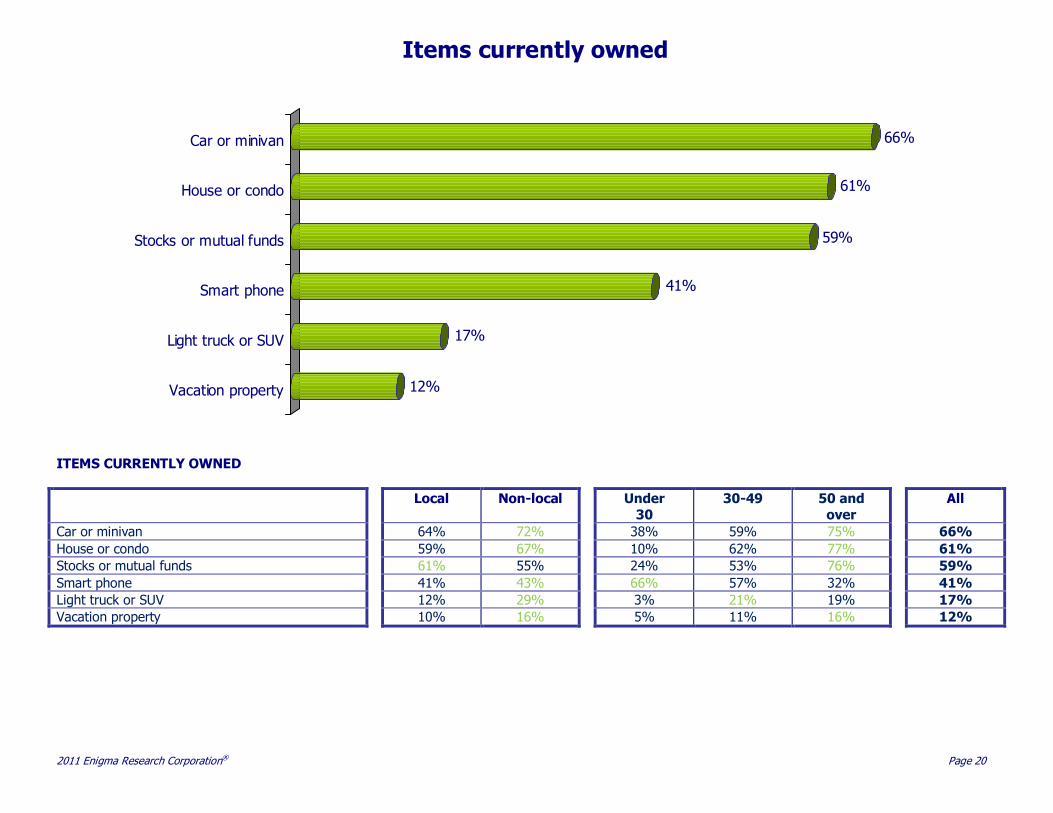
ITEMS CURRENTLY OWNED
Local Non-local Under 30
30-49 50 and over
All
Car or minivan 64% 72% 38% 59% 75% 66%
House or condo 59% 67% 10% 62% 77% 61%
Stocks or mutual funds 61% 55% 24% 53% 76% 59%
Smart phone 41% 43% 66% 57% 32% 41%
Light truck or SUV 12% 29% 3% 21% 19% 17%
Vacation property 10% 16% 5% 11% 16% 12%
12%
17%
41%
59%
61%
66%
Vacation property
Light truck or SUV
Smart phone
Stocks or mutual funds
House or condo
Car or minivan
Items currently owned
2011 Enigma Research Corporation® Page 21
2011 TD Toronto Jazz Festival Economic Impact Study
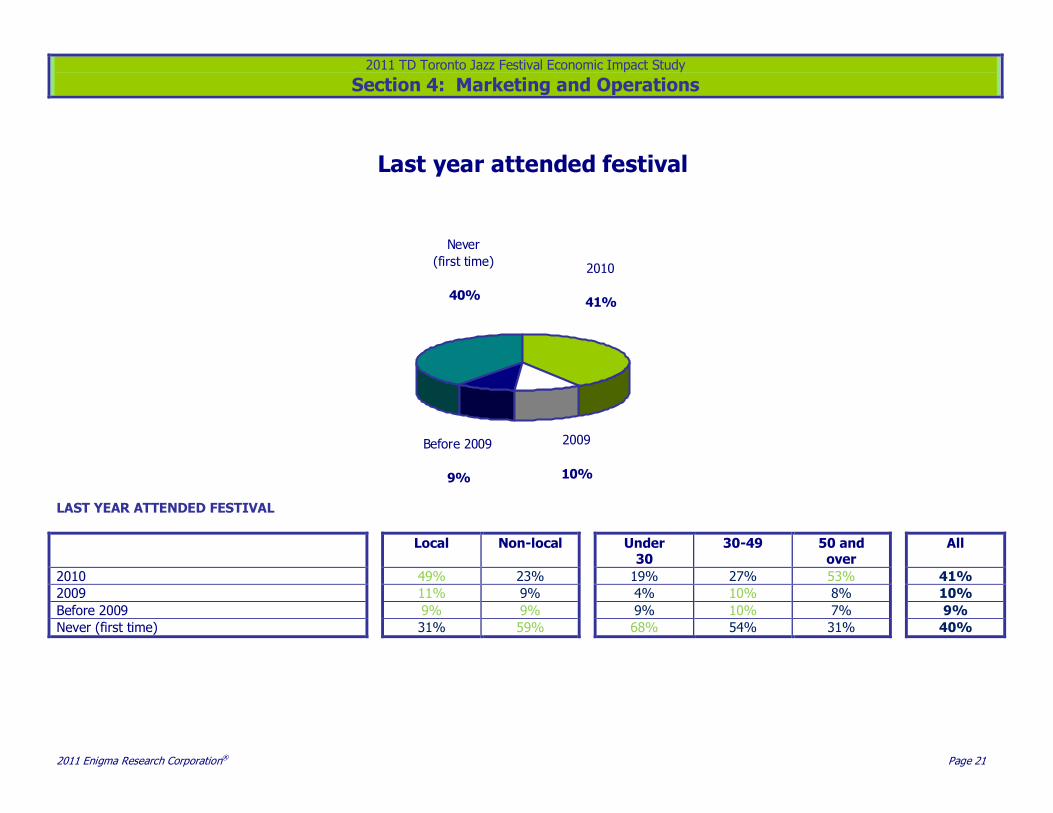
Section 4: Marketing and Operations LAST YEAR ATTENDED FESTIVAL
Local Non-local Under 30
30-49 50 and over
All
2010 49% 23% 19% 27% 53% 41%
2009 11% 9% 4% 10% 8% 10%
Before 2009 9% 9% 9% 10% 7% 9%
Never (first time) 31% 59% 68% 54% 31% 40%
Last year attended festival
2010
41%
2009
10%
Before 2009
9%
Never
(first time)
40%
2011 Enigma Research Corporation® Page 22
3%
0%
4%
0%
6%
1%
13%
1%
15%
0%
26%
0%
64%
27%
84%
70%
Panasonic 3D HDTV Experience
Centre
TD Pedal for Power
Educational Events
JAZZ.FM91 Broadcast Centre
HMV Retail Store
Food and Beverage kiosk
Free Concerts
Ticketed Concerts
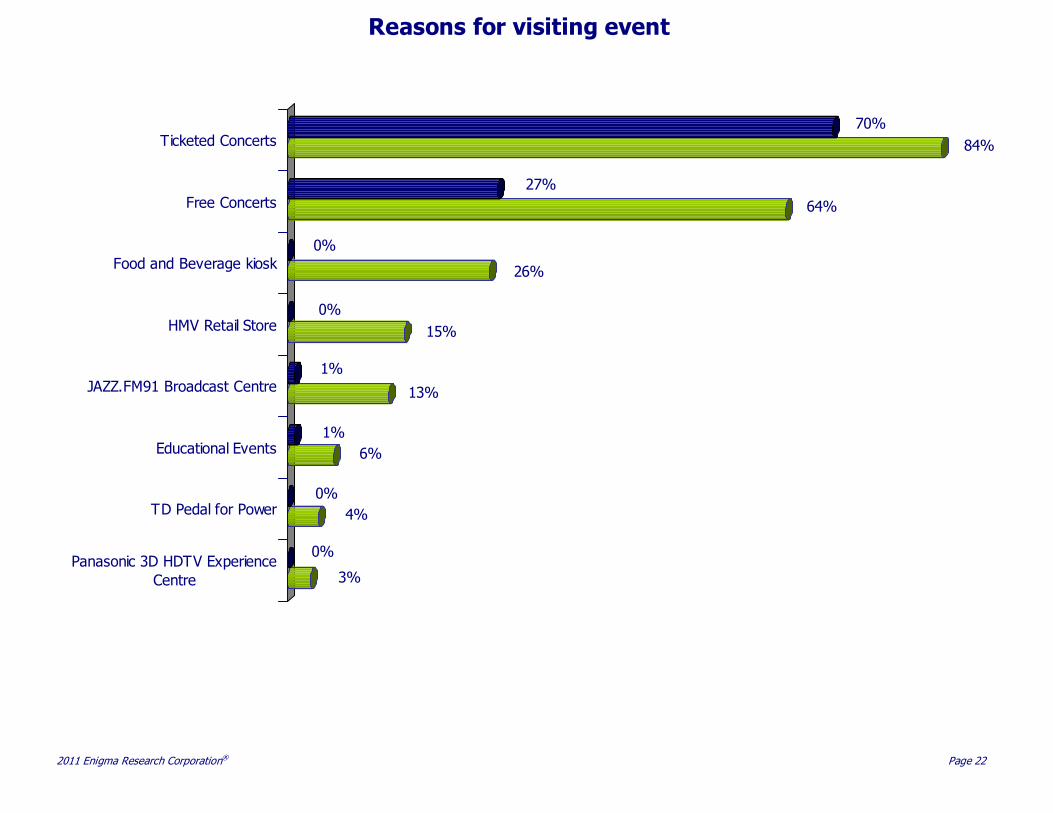
Reasons for visiting event
2011 Enigma Research Corporation® Page 23
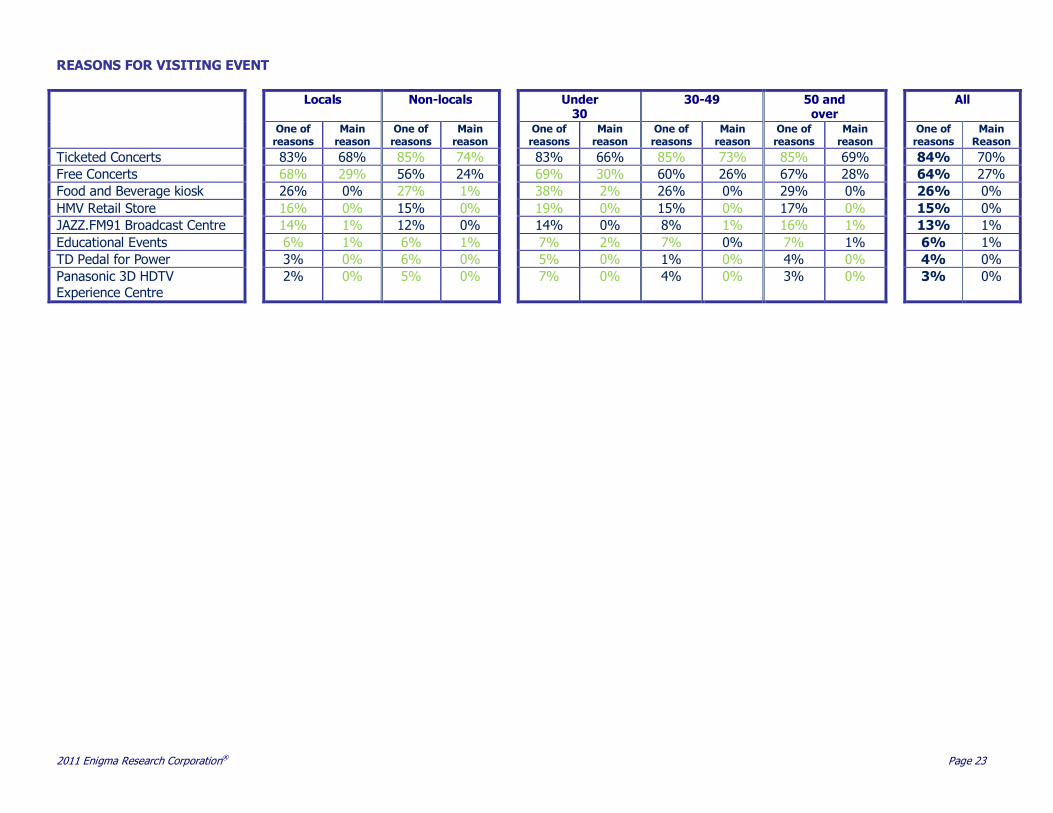
REASONS FOR VISITING EVENT
Locals Non-locals Under 30
30-49 50 and over
All
One of reasons
Main reason
One of reasons
Main reason
One of reasons
Main reason
One of reasons
Main reason
One of reasons
Main reason
One of reasons
Main Reason
Ticketed Concerts 83% 68% 85% 74% 83% 66% 85% 73% 85% 69% 84% 70%
Free Concerts 68% 29% 56% 24% 69% 30% 60% 26% 67% 28% 64% 27%
Food and Beverage kiosk 26% 0% 27% 1% 38% 2% 26% 0% 29% 0% 26% 0%
HMV Retail Store 16% 0% 15% 0% 19% 0% 15% 0% 17% 0% 15% 0%
JAZZ.FM91 Broadcast Centre 14% 1% 12% 0% 14% 0% 8% 1% 16% 1% 13% 1%
Educational Events 6% 1% 6% 1% 7% 2% 7% 0% 7% 1% 6% 1%
TD Pedal for Power 3% 0% 6% 0% 5% 0% 1% 0% 4% 0% 4% 0%
Panasonic 3D HDTV Experience Centre
2% 0% 5% 0% 7% 0% 4% 0% 3% 0% 3% 0%
2011 Enigma Research Corporation® Page 24
4%
2%
5%
1%
10%
3%
11%6%
12%
4%
19%6%
27%9%
32%
6%
35%
4%
36%
9%
38%13%
49%
38%
Tourism web site
Tourism brochure
Television ad
Social networking site
Other web site
Television news
Radio ad
Print ad
Sign or poster
Print article
Radio news
Event's web site
Sources of event information(past 30 days)
2011 Enigma Research Corporation® Page 25
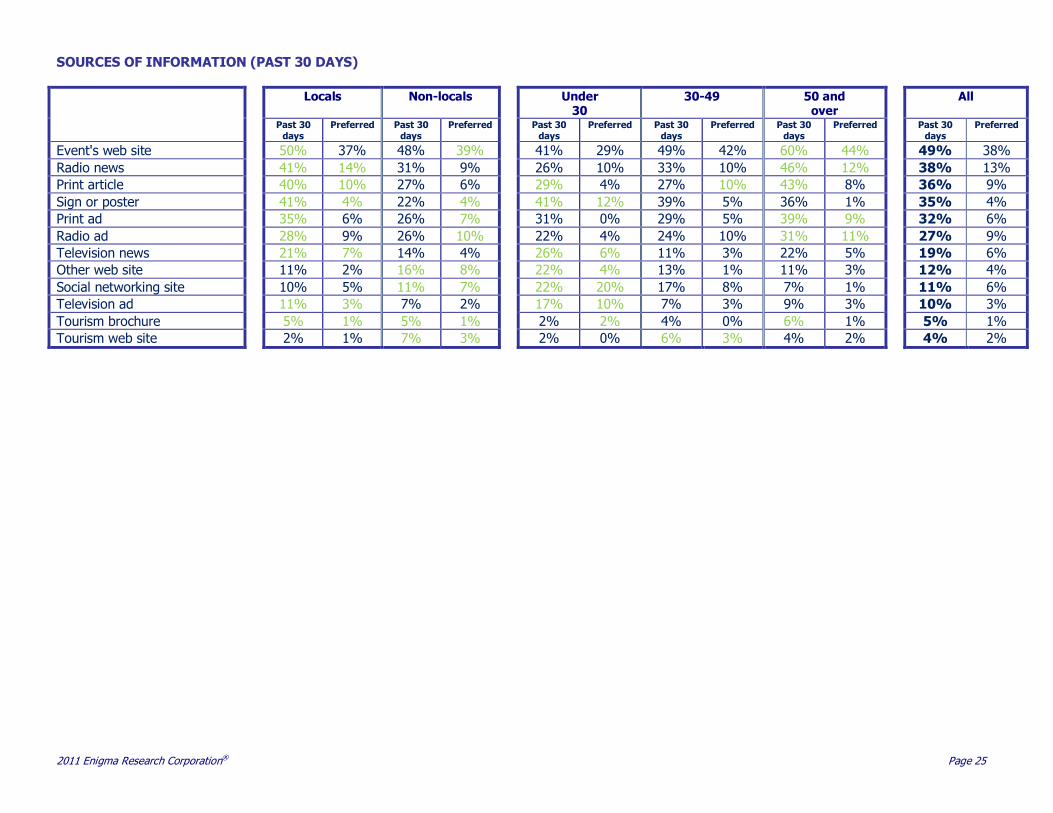
SOURCES OF INFORMATION (PAST 30 DAYS)
Locals Non-locals Under 30
30-49 50 and over
All
Past 30 days
Preferred Past 30 days
Preferred Past 30 days
Preferred Past 30 days
Preferred Past 30 days
Preferred Past 30 days
Preferred
Event's web site 50% 37% 48% 39% 41% 29% 49% 42% 60% 44% 49% 38%
Radio news 41% 14% 31% 9% 26% 10% 33% 10% 46% 12% 38% 13%
Print article 40% 10% 27% 6% 29% 4% 27% 10% 43% 8% 36% 9%
Sign or poster 41% 4% 22% 4% 41% 12% 39% 5% 36% 1% 35% 4%
Print ad 35% 6% 26% 7% 31% 0% 29% 5% 39% 9% 32% 6%
Radio ad 28% 9% 26% 10% 22% 4% 24% 10% 31% 11% 27% 9%
Television news 21% 7% 14% 4% 26% 6% 11% 3% 22% 5% 19% 6%
Other web site 11% 2% 16% 8% 22% 4% 13% 1% 11% 3% 12% 4%
Social networking site 10% 5% 11% 7% 22% 20% 17% 8% 7% 1% 11% 6%
Television ad 11% 3% 7% 2% 17% 10% 7% 3% 9% 3% 10% 3%
Tourism brochure 5% 1% 5% 1% 2% 2% 4% 0% 6% 1% 5% 1%
Tourism web site 2% 1% 7% 3% 2% 0% 6% 3% 4% 2% 4% 2%
2011 Enigma Research Corporation® Page 26
Event Ratings
Quality of entertainment
22%
78%
Variety of entertainment
35%
64%
1%
Atmosphere
38%
57%
5%
Cleanliness
42%
56%
2%
Quality of food/beverage
55%
33%
12%
Variety of food/beverage
29%
51%
20%
Legend: � Excellent � Good � Poor
2011 Enigma Research Corporation® Page 27
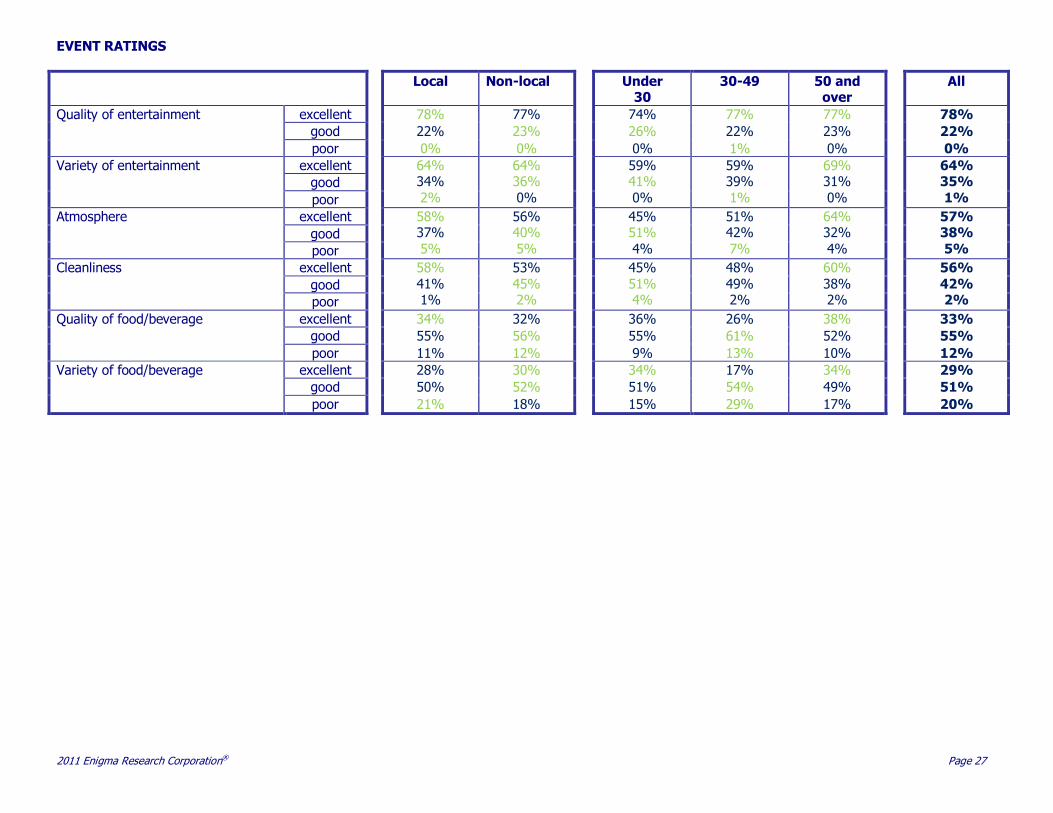
EVENT RATINGS
Local Non-local Under 30
30-49 50 and over
All
excellent 78% 77% 74% 77% 77% 78%
good 22% 23% 26% 22% 23% 22%
Quality of entertainment
poor 0% 0% 0% 1% 0% 0%
excellent
good
Variety of entertainment
poor
64% 34% 2%
64% 36% 0%
59% 41% 0%
59% 39% 1%
69% 31% 0%
64% 35% 1%
excellent
good
Atmosphere
poor
58% 37% 5%
56% 40% 5%
45% 51% 4%
51% 42% 7%
64% 32% 4%
57% 38% 5%
excellent
good
Cleanliness
poor
58% 41% 1%
53% 45% 2%
45% 51% 4%
48% 49% 2%
60% 38% 2%
56% 42% 2%
excellent 34% 32% 36% 26% 38% 33%
good 55% 56% 55% 61% 52% 55%
Quality of food/beverage
poor 11% 12% 9% 13% 10% 12%
excellent 28% 30% 34% 17% 34% 29%
good 50% 52% 51% 54% 49% 51%
Variety of food/beverage
poor 21% 18% 15% 29% 17% 20%

2011 Enigma Research Corporation® Page 28
2011 TD Toronto Jazz Festival Economic Impact Study
Section 5: Demographics GENDER
Local Non-local Under 30
30-49 50 and over
All
Male 52% 54% 61% 52% 50% 53%
Female 48% 46% 39% 48% 50% 47%
Note: gender includes respondent and members of party
Gender
Female
47%
Male
53%
2011 Enigma Research Corporation® Page 29
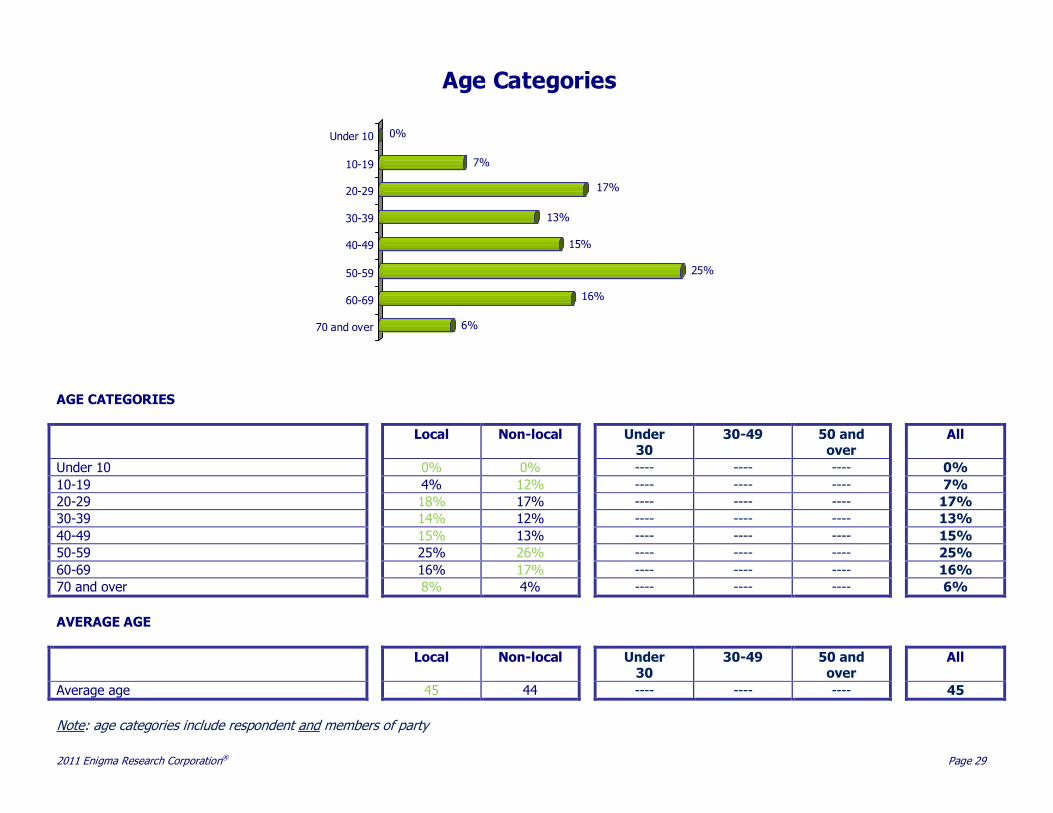
AGE CATEGORIES
Local Non-local Under 30
30-49 50 and over
All
Under 10 0% 0% ---- ---- ---- 0%
10-19 4% 12% ---- ---- ---- 7%
20-29 18% 17% ---- ---- ---- 17%
30-39 14% 12% ---- ---- ---- 13%
40-49 15% 13% ---- ---- ---- 15%
50-59 25% 26% ---- ---- ---- 25%
60-69 16% 17% ---- ---- ---- 16%
70 and over 8% 4% ---- ---- ---- 6%
AVERAGE AGE
Local Non-local Under 30
30-49 50 and over
All
Average age 45 44 ---- ---- ---- 45
Note: age categories include respondent and members of party
6%
16%
25%
15%
13%
17%
7%
0%
70 and over
60-69
50-59
40-49
30-39
20-29
10-19
Under 10
Age Categories
2011 Enigma Research Corporation® Page 30
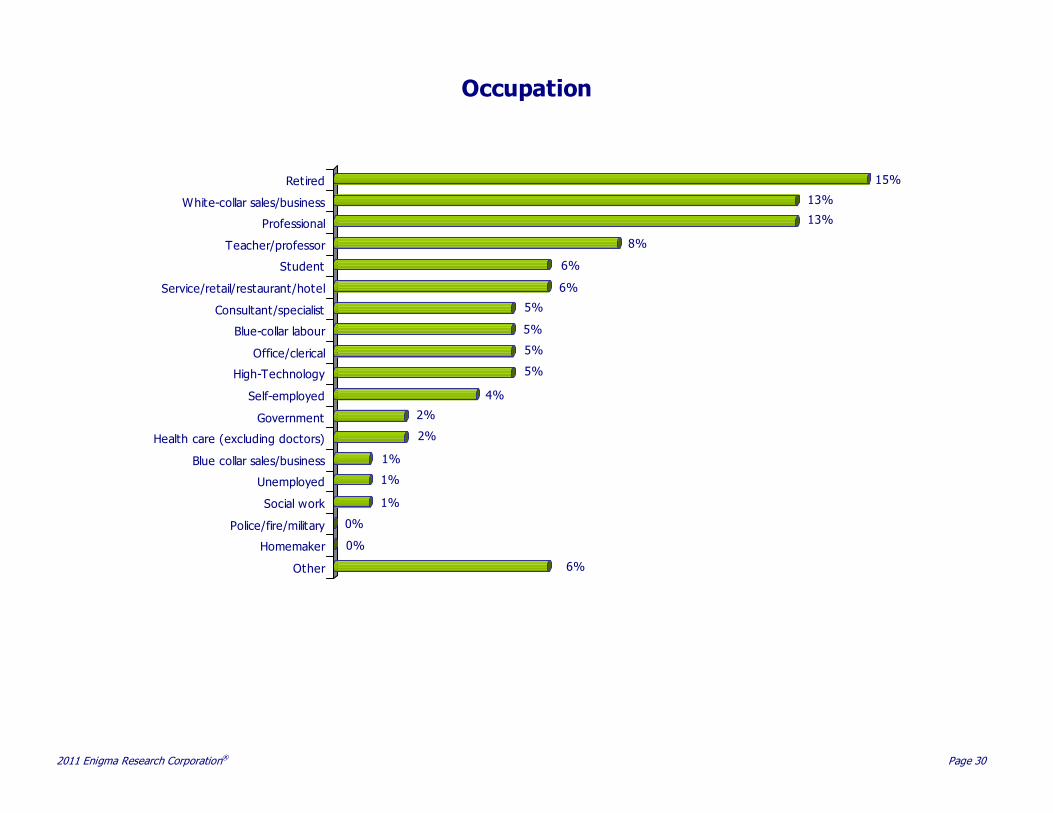
6%
0%
0%
1%
1%
1%
2%
2%
4%
5%
5%
5%
5%
6%
6%
8%
13%
13%
15%
Other
Homemaker
Police/fire/military
Social work
Unemployed
Blue collar sales/business
Health care (excluding doctors)
Government
Self-employed
High-Technology
Office/clerical
Blue-collar labour
Consultant/specialist
Service/retail/restaurant/hotel
Student
Teacher/professor
Professional
White-collar sales/business
Retired
Occupation
2011 Enigma Research Corporation® Page 31
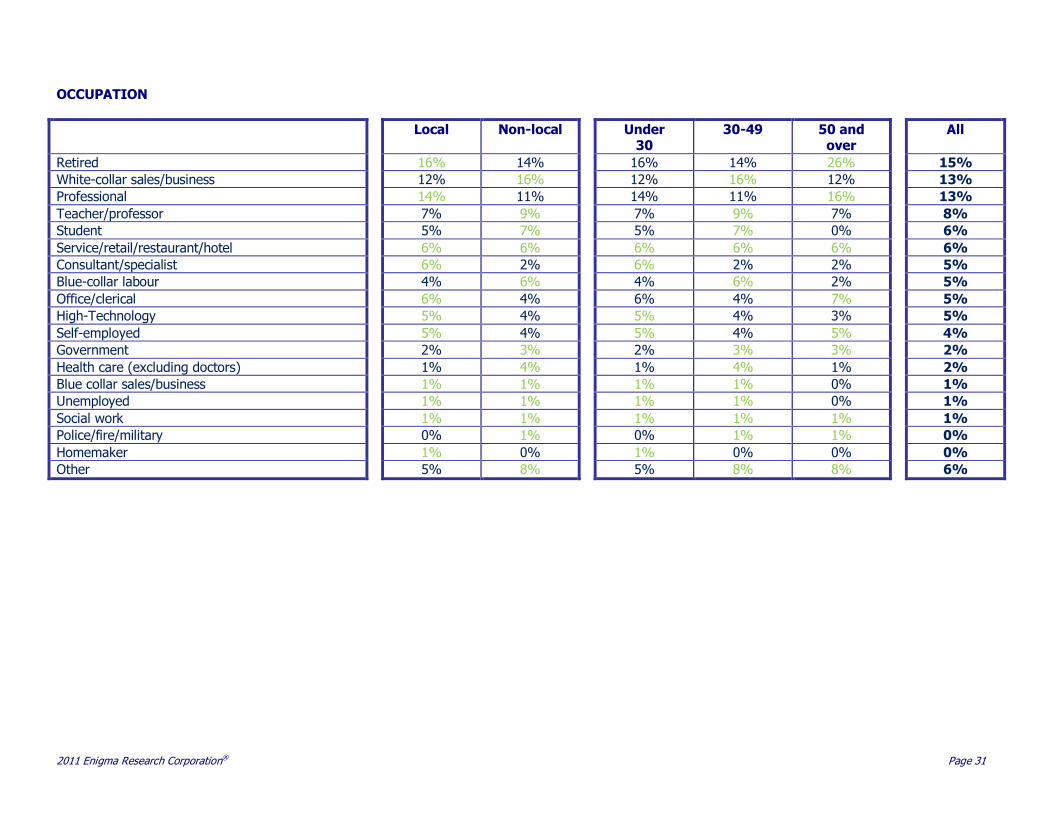
OCCUPATION
Local Non-local Under 30
30-49 50 and over
All
Retired 16% 14% 16% 14% 26% 15%
White-collar sales/business 12% 16% 12% 16% 12% 13%
Professional 14% 11% 14% 11% 16% 13%
Teacher/professor 7% 9% 7% 9% 7% 8%
Student 5% 7% 5% 7% 0% 6%
Service/retail/restaurant/hotel 6% 6% 6% 6% 6% 6%
Consultant/specialist 6% 2% 6% 2% 2% 5%
Blue-collar labour 4% 6% 4% 6% 2% 5%
Office/clerical 6% 4% 6% 4% 7% 5%
High-Technology 5% 4% 5% 4% 3% 5%
Self-employed 5% 4% 5% 4% 5% 4%
Government 2% 3% 2% 3% 3% 2%
Health care (excluding doctors) 1% 4% 1% 4% 1% 2%
Blue collar sales/business 1% 1% 1% 1% 0% 1%
Unemployed 1% 1% 1% 1% 0% 1%
Social work 1% 1% 1% 1% 1% 1%
Police/fire/military 0% 1% 0% 1% 1% 0%
Homemaker 1% 0% 1% 0% 0% 0%
Other 5% 8% 5% 8% 8% 6%
2011 Enigma Research Corporation® Page 32
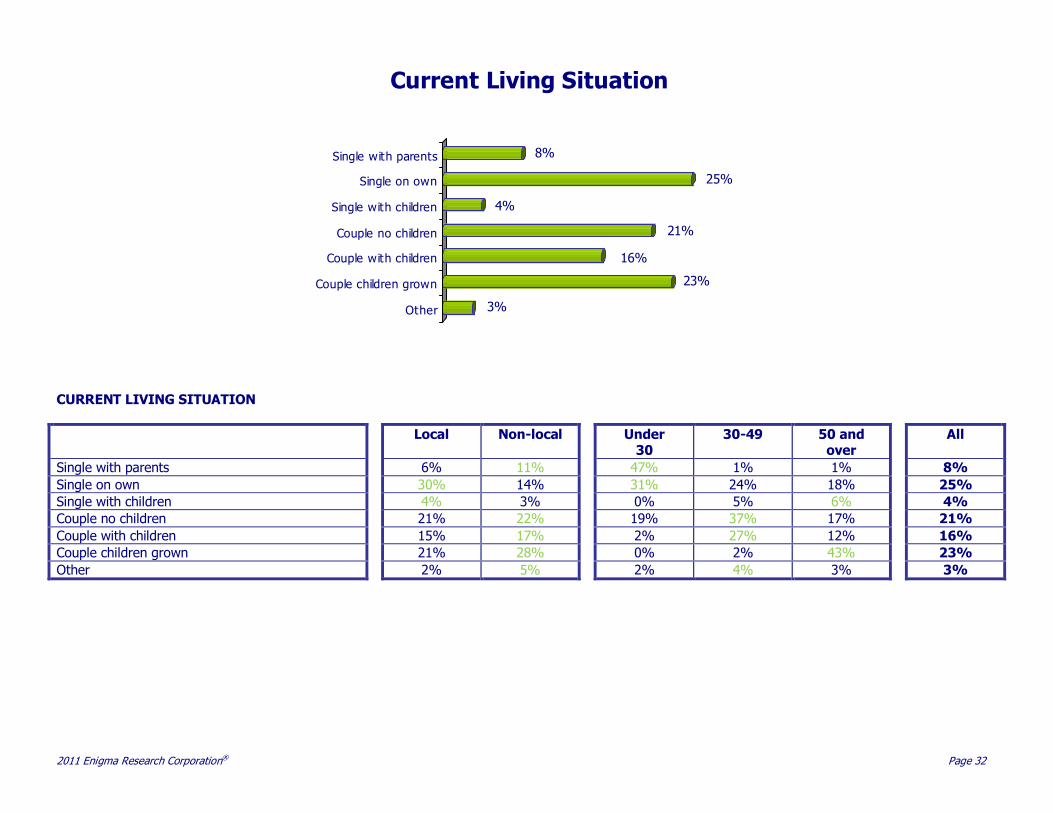
CURRENT LIVING SITUATION
Local Non-local Under 30
30-49 50 and over
All
Single with parents 6% 11% 47% 1% 1% 8%
Single on own 30% 14% 31% 24% 18% 25%
Single with children 4% 3% 0% 5% 6% 4%
Couple no children 21% 22% 19% 37% 17% 21%
Couple with children 15% 17% 2% 27% 12% 16%
Couple children grown 21% 28% 0% 2% 43% 23%
Other 2% 5% 2% 4% 3% 3%
3%
23%
16%
21%
4%
25%
8%
Other
Couple children grown
Couple with children
Couple no children
Single with children
Single on own
Single with parents
Current Living Situation
2011 Enigma Research Corporation® Page 33
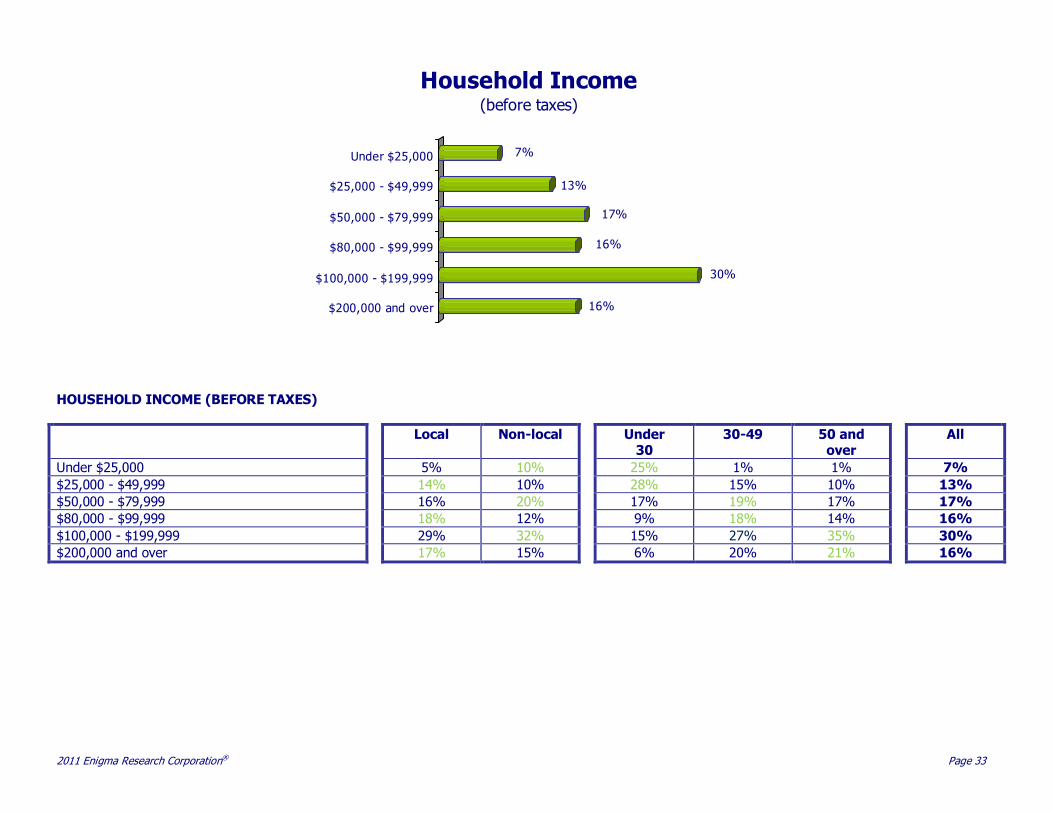
HOUSEHOLD INCOME (BEFORE TAXES)
Local Non-local Under 30
30-49 50 and over
All
Under $25,000 5% 10% 25% 1% 1% 7%
$25,000 - $49,999 14% 10% 28% 15% 10% 13%
$50,000 - $79,999 16% 20% 17% 19% 17% 17%
$80,000 - $99,999 18% 12% 9% 18% 14% 16%
$100,000 - $199,999 29% 32% 15% 27% 35% 30%
$200,000 and over 17% 15% 6% 20% 21% 16%
16%
30%
16%
17%
13%
7%
$200,000 and over
$100,000 - $199,999
$80,000 - $99,999
$50,000 - $79,999
$25,000 - $49,999
Under $25,000
Household Income (before taxes)

2011 Enigma Research Corporation® Page 34
DISTANCE RESIDING FROM FESTIVAL SITE
Local Non-local Under 30
30-49 50 and over
All
Less than 40km 100% 0% 60% 74% 66% 68%
40km to 80km 0% 43% 23% 8% 13% 14%
More than 80km 0% 57% 18% 18% 21% 18%
Distance Residing from Festival Site
Less than
40km
68%
More than
80km
18%
40km to 80km
14%
2011 Enigma Research Corporation® Page 35
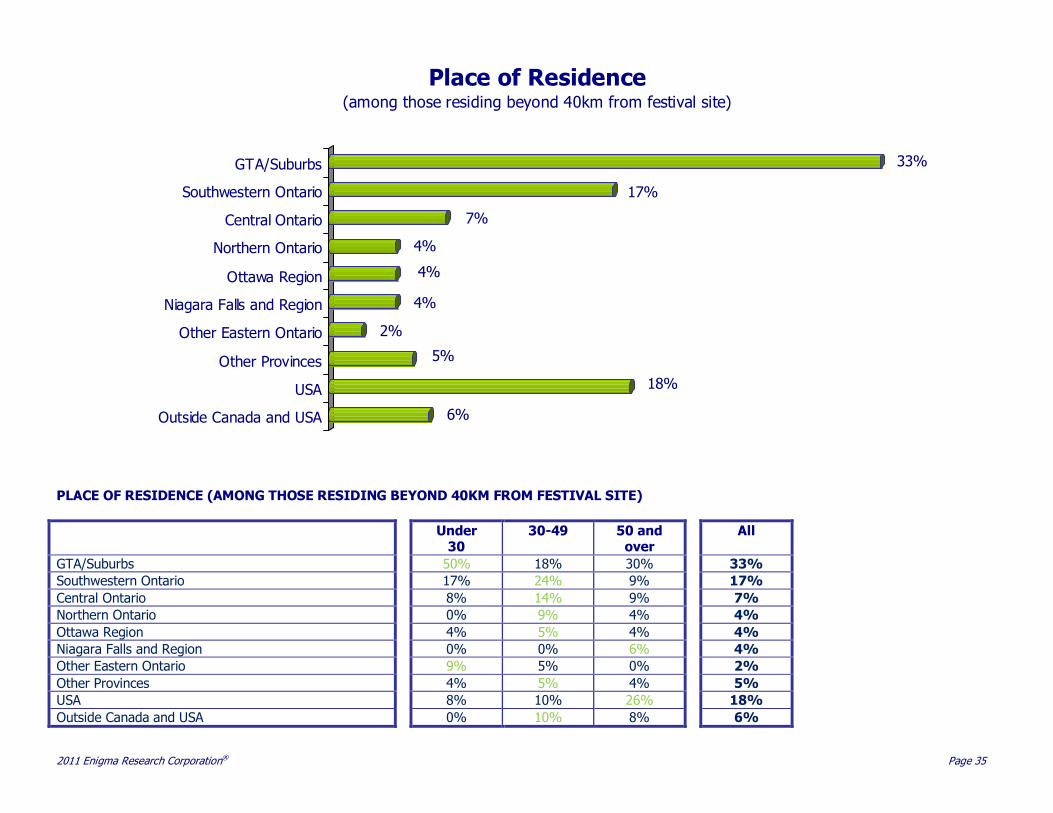
PLACE OF RESIDENCE (AMONG THOSE RESIDING BEYOND 40KM FROM FESTIVAL SITE)
Under 30
30-49 50 and over
All
GTA/Suburbs 50% 18% 30% 33%
Southwestern Ontario 17% 24% 9% 17%
Central Ontario 8% 14% 9% 7%
Northern Ontario 0% 9% 4% 4%
Ottawa Region 4% 5% 4% 4%
Niagara Falls and Region 0% 0% 6% 4%
Other Eastern Ontario 9% 5% 0% 2%
Other Provinces 4% 5% 4% 5%
USA 8% 10% 26% 18%
Outside Canada and USA 0% 10% 8% 6%
6%
18%
5%
2%
4%
4%
4%
7%
17%
33%
Outside Canada and USA
USA
Other Provinces
Other Eastern Ontario
Niagara Falls and Region
Ottawa Region
Northern Ontario
Central Ontario
Southwestern Ontario
GTA/Suburbs
Place of Residence(among those residing beyond 40km from festival site)
Related Documents