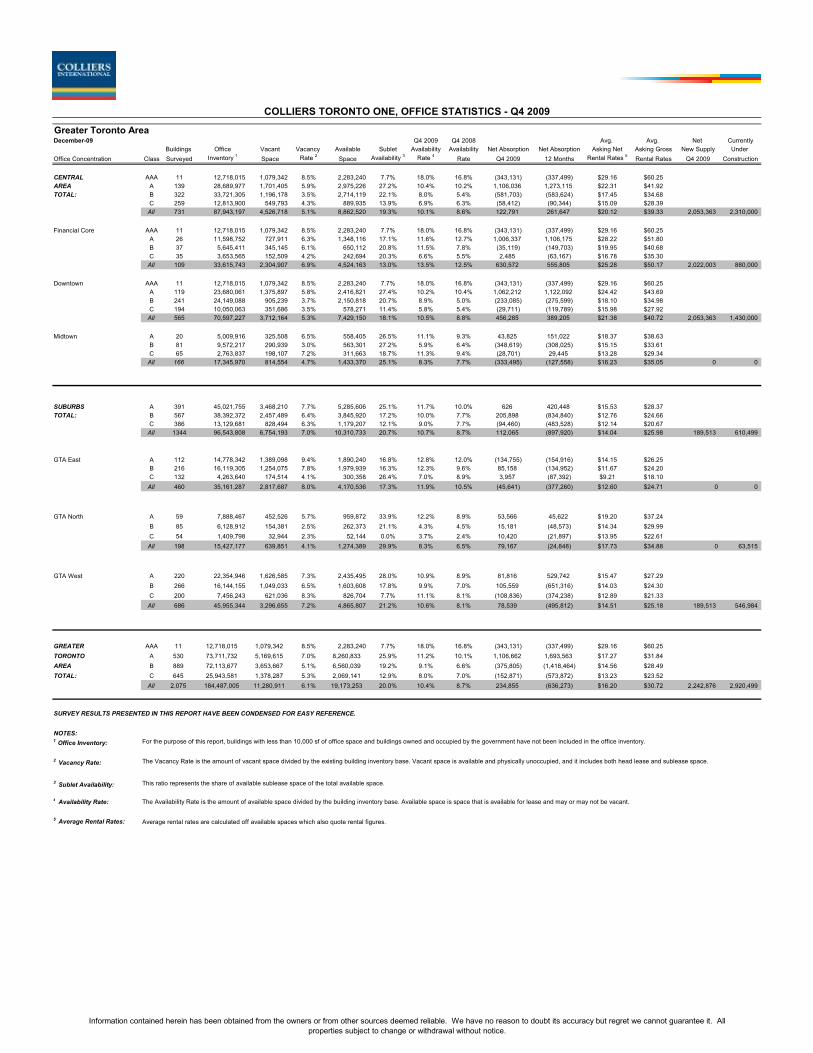
Greater Toronto Area December-09 Q4 2009 Q4 2008 Avg. Avg. Net Currently Buildings Office Vacant Vacancy Available Sublet Availability Availability Net Absorption Net Absorption Asking Net Asking Gross New Supply Under Office Concentration Class Surveyed Inventory 1 Space Rate 2 Space Availability 3 Rate 4 Rate Q4 2009 12 Months Rental Rates 5 Rental Rates Q4 2009 Construction CENTRAL AAA 11 12,718,015 1,079,342 8.5% 2,283,240 7.7% 18.0% 16.8% (343,131) (337,499) $29.16 $60.25 AREA A 139 28,689,977 1,701,405 5.9% 2,975,226 27.2% 10.4% 10.2% 1,106,036 1,273,115 $22.31 $41.92 TOTAL: B 322 33,721,305 1,196,178 3.5% 2,714,119 22.1% 8.0% 5.4% (581,703) (583,624) $17.45 $34.68 C 259 12,813,900 549,793 4.3% 889,935 13.9% 6.9% 6.3% (58,412) (90,344) $15.09 $28.39 All 731 87,943,197 4,526,718 5.1% 8,862,520 19.3% 10.1% 8.6% 122,791 261,647 $20.12 $39.33 2,053,363 2,310,000 Financial Core AAA 11 12,718,015 1,079,342 8.5% 2,283,240 7.7% 18.0% 16.8% (343,131) (337,499) $29.16 $60.25 A 26 11,598,752 727,911 6.3% 1,348,116 17.1% 11.6% 12.7% 1,006,337 1,106,175 $28.22 $51.80 B 37 5,645,411 345,145 6.1% 650,112 20.8% 11.5% 7.8% (35,119) (149,703) $19.95 $40.68 C 35 3,653,565 152,509 4.2% 242,694 20.3% 6.6% 5.5% 2,485 (63,167) $16.78 $35.30 All 109 33,615,743 2,304,907 6.9% 4,524,163 13.0% 13.5% 12.5% 630,572 555,805 $25.28 $50.17 2,022,003 880,000 Downtown AAA 11 12,718,015 1,079,342 8.5% 2,283,240 7.7% 18.0% 16.8% (343,131) (337,499) $29.16 $60.25 A 119 23,680,061 1,375,897 5.8% 2,416,821 27.4% 10.2% 10.4% 1,062,212 1,122,092 $24.42 $43.69 B 241 24,149,088 905,239 3.7% 2,150,818 20.7% 8.9% 5.0% (233,085) (275,599) $18.10 $34.98 C 194 10,050,063 351,686 3.5% 578,271 11.4% 5.8% 5.4% (29,711) (119,789) $15.98 $27.92 All 565 70,597,227 3,712,164 5.3% 7,429,150 18.1% 10.5% 8.8% 456,285 389,205 $21.38 $40.72 2,053,363 1,430,000 Midtown A 20 5,009,916 325,508 6.5% 558,405 26.5% 11.1% 9.3% 43,825 151,022 $18.37 $38.63 B 81 9,572,217 290,939 3.0% 563,301 27.2% 5.9% 6.4% (348,619) (308,025) $15.15 $33.61 C 65 2,763,837 198,107 7.2% 311,663 18.7% 11.3% 9.4% (28,701) 29,445 $13.28 $29.34 All 166 17,345,970 814,554 4.7% 1,433,370 25.1% 8.3% 7.7% (333,495) (127,558) $16.23 $35.05 0 0 SUBURBS A 391 45,021,755 3,468,210 7.7% 5,285,606 25.1% 11.7% 10.0% 626 420,448 $15.53 $28.37 TOTAL: B 567 38,392,372 2,457,489 6.4% 3,845,920 17.2% 10.0% 7.7% 205,898 (834,840) $12.76 $24.66 C 386 13,129,681 828,494 6.3% 1,179,207 12.1% 9.0% 7.7% (94,460) (483,528) $12.14 $20.67 All 1344 96,543,808 6,754,193 7.0% 10,310,733 20.7% 10.7% 8.7% 112,065 (897,920) $14.04 $25.98 189,513 610,499 GTA East A 112 14,778,342 1,389,098 9.4% 1,890,240 16.8% 12.8% 12.0% (134,755) (154,916) $14.15 $26.25 B 216 16,119,305 1,254,075 7.8% 1,979,939 16.3% 12.3% 9.6% 85,158 (134,952) $11.67 $24.20 C 132 4,263,640 174,514 4.1% 300,358 26.4% 7.0% 8.9% 3,957 (87,392) $9.21 $18.10 All 460 35,161,287 2,817,687 8.0% 4,170,536 17.3% 11.9% 10.5% (45,641) (377,260) $12.60 $24.71 0 0 GTA North A 59 7,888,467 452,526 5.7% 959,872 33.9% 12.2% 8.9% 53,566 45,622 $19.20 $37.24 B 85 6,128,912 154,381 2.5% 262,373 21.1% 4.3% 4.5% 15,181 (48,573) $14.34 $29.99 C 54 1,409,798 32,944 2.3% 52,144 0.0% 3.7% 2.4% 10,420 (21,897) $13.95 $22.61 All 198 15,427,177 639,851 4.1% 1,274,389 29.9% 8.3% 6.5% 79,167 (24,848) $17.73 $34.88 0 63,515 COLLIERS TORONTO ONE, OFFICE STATISTICS - Q4 2009 All 198 15,427,177 639,851 4.1% 1,274,389 29.9% 8.3% 6.5% 79,167 (24,848) $17.73 $34.88 0 63,515 GTA West A 220 22,354,946 1,626,585 7.3% 2,435,495 28.0% 10.9% 8.9% 81,816 529,742 $15.47 $27.29 B 266 16,144,155 1,049,033 6.5% 1,603,608 17.8% 9.9% 7.0% 105,559 (651,316) $14.03 $24.30 C 200 7,456,243 621,036 8.3% 826,704 7.7% 11.1% 8.1% (108,836) (374,238) $12.89 $21.33 All 686 45,955,344 3,296,655 7.2% 4,865,807 21.2% 10.6% 8.1% 78,539 (495,812) $14.51 $25.18 189,513 546,984 GREATER AAA 11 12,718,015 1,079,342 8.5% 2,283,240 7.7% 18.0% 16.8% (343,131) (337,499) $29.16 $60.25 TORONTO A 530 73,711,732 5,169,615 7.0% 8,260,833 25.9% 11.2% 10.1% 1,106,662 1,693,563 $17.27 $31.84 AREA B 889 72,113,677 3,653,667 5.1% 6,560,039 19.2% 9.1% 6.6% (375,805) (1,418,464) $14.56 $28.49 TOTAL: C 645 25,943,581 1,378,287 5.3% 2,069,141 12.9% 8.0% 7.0% (152,871) (573,872) $13.23 $23.52 All 2,075 184,487,005 11,280,911 6.1% 19,173,253 20.0% 10.4% 8.7% 234,855 (636,273) $16.20 $30.72 2,242,876 2,920,499 SURVEY RESULTS PRESENTED IN THIS REPORT HAVE BEEN CONDENSED FOR EASY REFERENCE. NOTES: 1 Office Inventory: 2 Vacancy Rate: 3 Sublet Availability: This ratio represents the share of available sublease space of the total available space. 4 Availability Rate: 5 Average Rental Rates: Average rental rates are calculated off available spaces which also quote rental figures. The Vacancy Rate is the amount of vacant space divided by the existing building inventory base. Vacant space is available and physically unoccupied, and it includes both head lease and sublease space. The Availability Rate is the amount of available space divided by the building inventory base. Available space is space that is available for lease and may or may not be vacant. For the purpose of this report, buildings with less than 10,000 sf of office space and buildings owned and occupied by the government have not been included in the office inventory. Information contained herein has been obtained from the owners or from other sources deemed reliable. We have no reason to doubt its accuracy but regret we cannot guarantee it. All properties subject to change or withdrawal without notice.

Toronto Commercial Real Estate - Brokers reports
Mar 30, 2016
Toronto Commercial Real Estate - Brokers reports
Welcome message from author
This document is posted to help you gain knowledge. Please leave a comment to let me know what you think about it! Share it to your friends and learn new things together.
Transcript
Greater Toronto AreaDecember-09 Q4 2009 Q4 2008 Avg. Avg. Net Currently
Buildings Office Vacant Vacancy Available Sublet Availability Availability Net Absorption Net Absorption Asking Net Asking Gross New Supply Under
Office Concentration Class Surveyed Inventory 1 Space Rate 2 Space Availability 3 Rate 4 Rate Q4 2009 12 Months Rental Rates 5 Rental Rates Q4 2009 Construction
CENTRAL AAA 11 12,718,015 1,079,342 8.5% 2,283,240 7.7% 18.0% 16.8% (343,131) (337,499) $29.16 $60.25
AREA A 139 28,689,977 1,701,405 5.9% 2,975,226 27.2% 10.4% 10.2% 1,106,036 1,273,115 $22.31 $41.92
TOTAL: B 322 33,721,305 1,196,178 3.5% 2,714,119 22.1% 8.0% 5.4% (581,703) (583,624) $17.45 $34.68
C 259 12,813,900 549,793 4.3% 889,935 13.9% 6.9% 6.3% (58,412) (90,344) $15.09 $28.39
All 731 87,943,197 4,526,718 5.1% 8,862,520 19.3% 10.1% 8.6% 122,791 261,647 $20.12 $39.33 2,053,363 2,310,000
Financial Core AAA 11 12,718,015 1,079,342 8.5% 2,283,240 7.7% 18.0% 16.8% (343,131) (337,499) $29.16 $60.25
A 26 11,598,752 727,911 6.3% 1,348,116 17.1% 11.6% 12.7% 1,006,337 1,106,175 $28.22 $51.80
B 37 5,645,411 345,145 6.1% 650,112 20.8% 11.5% 7.8% (35,119) (149,703) $19.95 $40.68
C 35 3,653,565 152,509 4.2% 242,694 20.3% 6.6% 5.5% 2,485 (63,167) $16.78 $35.30
All 109 33,615,743 2,304,907 6.9% 4,524,163 13.0% 13.5% 12.5% 630,572 555,805 $25.28 $50.17 2,022,003 880,000
Downtown AAA 11 12,718,015 1,079,342 8.5% 2,283,240 7.7% 18.0% 16.8% (343,131) (337,499) $29.16 $60.25
A 119 23,680,061 1,375,897 5.8% 2,416,821 27.4% 10.2% 10.4% 1,062,212 1,122,092 $24.42 $43.69
B 241 24,149,088 905,239 3.7% 2,150,818 20.7% 8.9% 5.0% (233,085) (275,599) $18.10 $34.98
C 194 10,050,063 351,686 3.5% 578,271 11.4% 5.8% 5.4% (29,711) (119,789) $15.98 $27.92
All 565 70,597,227 3,712,164 5.3% 7,429,150 18.1% 10.5% 8.8% 456,285 389,205 $21.38 $40.72 2,053,363 1,430,000
Midtown A 20 5,009,916 325,508 6.5% 558,405 26.5% 11.1% 9.3% 43,825 151,022 $18.37 $38.63
B 81 9,572,217 290,939 3.0% 563,301 27.2% 5.9% 6.4% (348,619) (308,025) $15.15 $33.61
C 65 2,763,837 198,107 7.2% 311,663 18.7% 11.3% 9.4% (28,701) 29,445 $13.28 $29.34
All 166 17,345,970 814,554 4.7% 1,433,370 25.1% 8.3% 7.7% (333,495) (127,558) $16.23 $35.05 0 0
SUBURBS A 391 45,021,755 3,468,210 7.7% 5,285,606 25.1% 11.7% 10.0% 626 420,448 $15.53 $28.37
TOTAL: B 567 38,392,372 2,457,489 6.4% 3,845,920 17.2% 10.0% 7.7% 205,898 (834,840) $12.76 $24.66
C 386 13,129,681 828,494 6.3% 1,179,207 12.1% 9.0% 7.7% (94,460) (483,528) $12.14 $20.67
All 1344 96,543,808 6,754,193 7.0% 10,310,733 20.7% 10.7% 8.7% 112,065 (897,920) $14.04 $25.98 189,513 610,499
GTA East A 112 14,778,342 1,389,098 9.4% 1,890,240 16.8% 12.8% 12.0% (134,755) (154,916) $14.15 $26.25
B 216 16,119,305 1,254,075 7.8% 1,979,939 16.3% 12.3% 9.6% 85,158 (134,952) $11.67 $24.20
C 132 4,263,640 174,514 4.1% 300,358 26.4% 7.0% 8.9% 3,957 (87,392) $9.21 $18.10
All 460 35,161,287 2,817,687 8.0% 4,170,536 17.3% 11.9% 10.5% (45,641) (377,260) $12.60 $24.71 0 0
GTA North A 59 7,888,467 452,526 5.7% 959,872 33.9% 12.2% 8.9% 53,566 45,622 $19.20 $37.24
B 85 6,128,912 154,381 2.5% 262,373 21.1% 4.3% 4.5% 15,181 (48,573) $14.34 $29.99
C 54 1,409,798 32,944 2.3% 52,144 0.0% 3.7% 2.4% 10,420 (21,897) $13.95 $22.61
All 198 15,427,177 639,851 4.1% 1,274,389 29.9% 8.3% 6.5% 79,167 (24,848) $17.73 $34.88 0 63,515
COLLIERS TORONTO ONE, OFFICE STATISTICS - Q4 2009
All 198 15,427,177 639,851 4.1% 1,274,389 29.9% 8.3% 6.5% 79,167 (24,848) $17.73 $34.88 0 63,515
GTA West A 220 22,354,946 1,626,585 7.3% 2,435,495 28.0% 10.9% 8.9% 81,816 529,742 $15.47 $27.29
B 266 16,144,155 1,049,033 6.5% 1,603,608 17.8% 9.9% 7.0% 105,559 (651,316) $14.03 $24.30
C 200 7,456,243 621,036 8.3% 826,704 7.7% 11.1% 8.1% (108,836) (374,238) $12.89 $21.33
All 686 45,955,344 3,296,655 7.2% 4,865,807 21.2% 10.6% 8.1% 78,539 (495,812) $14.51 $25.18 189,513 546,984
GREATER AAA 11 12,718,015 1,079,342 8.5% 2,283,240 7.7% 18.0% 16.8% (343,131) (337,499) $29.16 $60.25
TORONTO A 530 73,711,732 5,169,615 7.0% 8,260,833 25.9% 11.2% 10.1% 1,106,662 1,693,563 $17.27 $31.84
AREA B 889 72,113,677 3,653,667 5.1% 6,560,039 19.2% 9.1% 6.6% (375,805) (1,418,464) $14.56 $28.49
TOTAL: C 645 25,943,581 1,378,287 5.3% 2,069,141 12.9% 8.0% 7.0% (152,871) (573,872) $13.23 $23.52
All 2,075 184,487,005 11,280,911 6.1% 19,173,253 20.0% 10.4% 8.7% 234,855 (636,273) $16.20 $30.72 2,242,876 2,920,499
SURVEY RESULTS PRESENTED IN THIS REPORT HAVE BEEN CONDENSED FOR EASY REFERENCE.
NOTES:1 Office Inventory:
2 Vacancy Rate:
3 Sublet Availability: This ratio represents the share of available sublease space of the total available space.
4 Availability Rate:
5 Average Rental Rates: Average rental rates are calculated off available spaces which also quote rental figures.
The Vacancy Rate is the amount of vacant space divided by the existing building inventory base. Vacant space is available and physically unoccupied, and it includes both head lease and sublease space.
The Availability Rate is the amount of available space divided by the building inventory base. Available space is space that is available for lease and may or may not be vacant.
For the purpose of this report, buildings with less than 10,000 sf of office space and buildings owned and occupied by the government have not been included in the office inventory.
Information contained herein has been obtained from the owners or from other sources deemed reliable. We have no reason to doubt its accuracy but regret we cannot guarantee it. All
properties subject to change or withdrawal without notice.

Downtown
December-09 Q4 2009 Q4 2008 Avg. Avg. Net Currently
Buildings Office Vacant Vacancy Available Sublet Availability Availability Net Absorption Net Absorption Asking Net Asking Gross New Supply Under
Concentration Class Surveyed Inventory Space Rate Space Availability Rate Rate Q4 2009 12 Months Rental Rates Rental Rates Q4 2009 Construction
DOWNTOWN A 119 23,680,061 1,375,897 5.8% 2,416,821 27.4% 10.2% 10.4% 1,062,212 1,122,092 $24.42 $43.69
TOTAL: AAA 11 12,718,015 1,079,342 8.5% 2,283,240 7.7% 18.0% 16.8% (343,131) (337,499) $29.16 $60.25
B 241 24,149,088 905,239 3.7% 2,150,818 20.7% 8.9% 5.0% (233,085) (275,599) $18.10 $34.98
C 194 10,050,063 351,686 3.5% 578,271 11.4% 5.8% 5.4% (29,711) (119,789) $15.98 $27.92
All 565 70,597,227 3,712,164 5.3% 7,429,150 18.1% 10.5% 8.8% 456,285 389,205 $21.38 $40.72 2,053,363 1,430,000
Financial Core AAA 11 12,718,015 1,079,342 8.5% 2,283,240 7.7% 18.0% 16.8% (343,131) (337,499) $29.16 $60.25
A 26 11,598,752 727,911 6.3% 1,348,116 17.1% 11.6% 12.7% 1,006,337 1,106,175 $28.22 $51.80
B 37 5,645,411 345,145 6.1% 650,112 20.8% 11.5% 7.8% (35,119) (149,703) $19.95 $40.68
C 35 3,653,565 152,509 4.2% 242,694 20.3% 6.6% 5.5% 2,485 (63,167) $16.78 $35.30
All 109 33,615,743 2,304,907 6.9% 4,524,163 13.0% 13.5% 12.5% 630,572 555,805 $25.28 $50.17 2,022,003 880,000
Downtown East A 26 1,227,383 82,909 6.8% 123,694 19.8% 10.1% 6.9% 9,391 32,279 $14.93 $31.01
B 54 2,024,145 90,055 4.4% 325,714 8.8% 16.1% 5.4% (7,013) (54,077) $17.53 $31.28
C 28 807,115 61,396 7.6% 75,370 3.8% 9.3% 9.8% (2,268) 16,799 $13.75 $4.27
All 108 4,058,643 234,359 5.8% 524,778 10.7% 12.9% 6.7% 110 (5,000) $16.74 $27.10 31,360 550,000
Downtown North A 14 5,659,400 152,613 2.7% 341,367 55.6% 6.0% 5.9% 1,021 25,988 $15.46 $36.60
B 31 6,520,918 157,147 2.4% 260,610 37.6% 4.0% 3.3% (178,473) (155,405) $16.30 $34.94
C 29 2,579,978 27,513 1.1% 58,980 10.7% 2.3% 2.6% 9,697 24,661 $14.35 $31.32
All 74 14,760,296 337,274 2.3% 660,957 44.5% 4.5% 4.2% (167,756) (104,757) $15.94 $34.59 0
Downtown South A 3 949,922 52,658 5.5% 92,563 46.6% 9.7% 3.6% (12,518) (46,666) $29.50 $51.33
B 4 1,197,050 40,119 3.4% 151,832 65.3% 12.7% 11.2% 2,040 11,316 $18.17 $34.30
C 7 283,859 - 0.0% - #DIV/0! 0.0% 0.0% (14,000) (14,000) $0.00 $0.00
All 14 2,430,831 92,776 3.8% 244,395 58.2% 10.1% 7.0% (24,478) (49,349) $21.71 $39.61 0
Downtown West A 46 4,154,594 359,806 8.7% 503,552 34.6% 12.1% 14.1% 61,207 7,543 $18.78 $30.08
B 102 8,476,779 256,701 3.0% 743,743 11.5% 8.8% 3.5% (14,520) 91,702 $18.00 $33.33
C 68 1,801,971 57,503 3.2% 145,463 5.0% 8.1% 6.1% 12,072 (37,788) $16.29 $24.15
All 216 14,433,344 674,011 4.7% 1,392,758 19.2% 9.6% 6.8% 58,759 61,457 $18.08 $31.58 0
COLLIERS TORONTO ONE, OFFICE STATISTICS - Q4 2009
Toronto West A 4 90,010 - 0.0% 7,529 0.0% 8.4% 0.0% (3,227) (3,227) $11.75 $22.75
B 13 284,785 16,072 5.6% 18,807 0.0% 6.6% 4.6% 0 (19,432) $8.64 $21.85
C 27 923,575 52,765 5.7% 55,764 0.0% 6.0% 9.7% (37,696) (46,293) $15.53 $24.31
All 44 1,298,370 68,837 5.3% 82,100 0.0% 6.3% 7.9% (40,923) (68,951) $12.26 $23.11 0
Information contained herein has been obtained from the owners or from other sources deemed reliable. We have no reason to doubt its accuracy but regret we cannot guarantee it. All
properties subject to change or withdrawal without notice.

Midtown
December-09 Q4 2009 Q4 2008 Avg. Avg. Net Currently
Buildings Office Vacant Vacancy Available Sublet Availability Availability Net Absorption Net Absorption Asking Net Asking Gross New Supply Under
Concentration Class Surveyed Inventory Space Rate Space Availability Rate Rate Q4 2009 12 Months Rental Rates Rental Rates Q4 2009 Construction
MIDTOWN A 20 5,009,916 325,508 6.5% 558,405 26.5% 11.1% 9.3% 43,825 151,022 $18.37 $38.63
TOTAL: B 81 9,572,217 290,939 3.0% 563,301 27.2% 5.9% 6.4% (348,619) (308,025) $15.15 $33.61
C 65 2,763,837 198,107 7.2% 311,663 18.7% 11.3% 9.4% (28,701) 29,445 $13.28 $29.34
All 166 17,345,970 814,554 4.7% 1,433,370 25.1% 8.3% 7.7% (333,495) (127,558) $16.23 $35.05 0 0
Yonge-Bloor A 8 2,653,810 174,041 6.6% 268,200 35.2% 10.1% 8.3% 21,206 105,350 $20.01 $39.77
B 37 5,631,289 138,827 2.5% 230,673 26.3% 4.1% 5.2% (314,645) (356,968) $16.02 $36.38
C 28 1,414,301 106,382 7.5% 170,705 9.7% 12.1% 10.9% 8,682 30,893 $12.88 $30.33
All 73 9,699,400 419,250 4.3% 669,578 25.6% 6.9% 6.9% (284,757) (220,725) $16.77 $35.96 0 0
Yonge-Eglinton A 8 1,554,762 97,684 6.3% 204,339 14.0% 13.1% 14.3% 33,659 70,412 $16.10 $36.18
B 26 2,378,068 126,247 5.3% 197,415 18.0% 8.3% 9.8% (23,313) 30,924 $14.10 $31.85
C 22 841,529 50,605 6.0% 99,838 1.6% 11.9% 10.5% (9,383) 28,619 $14.82 $25.48
All 56 4,774,359 274,537 5.8% 501,592 13.1% 10.5% 11.4% 962 129,955 $15.09 $33.24 0 0
Yonge-St.Clair A 4 801,344 53,783 6.7% 85,866 28.9% 10.7% 2.9% (11,040) (24,740) $19.34 $41.28
B 18 1,562,860 25,864 1.7% 135,214 42.2% 8.7% 5.6% (10,660) 18,018 $15.77 $33.41
C 15 508,007 41,120 8.1% 41,120 97.3% 8.1% 3.4% (28,000) (30,066) $13.50 $28.65
All 37 2,872,211 120,767 4.2% 262,200 46.5% 9.1% 4.4% (49,700) (36,789) $17.14 $36.42 0 0
COLLIERS TORONTO ONE, OFFICE STATISTICS - Q4 2009
Information contained herein has been obtained from the owners or from other sources deemed reliable. We have no reason to doubt its accuracy but regret we cannot guarantee it.
All properties subject to change or withdrawal without notice.

GTA NorthDecember-09 Q4 2009 Q4 2008 Avg. Avg. Net Currently
Buildings Office Vacant Vacancy Available Sublet Availability Availability Net Absorption Net Absorption Asking Net Asking Gross New Supply Under
Concentration Class Surveyed Inventory Space Rate Space Availability Rate Rate Q4 2009 12 Months Rental Rates Rental Rates Q4 2009 Construction
GTA NORTH A 59 7,888,467 452,526 5.7% 959,872 33.9% 12.2% 8.9% 53,566 45,622 $19.20 $37.24
TOTAL: B 85 6,128,912 154,381 2.5% 262,373 21.1% 4.3% 4.5% 15,181 (48,573) $14.34 $29.99
C 54 1,409,798 32,944 2.3% 52,144 0.0% 3.7% 2.4% 10,420 (21,897) $13.95 $22.61
All 198 15,427,177 639,851 4.1% 1,274,389 29.9% 8.3% 6.5% 79,167 (24,848) $17.73 $34.88 0 63,515
Dufferin/Finch A 3 42,500 - 0.0% - #DIV/0! 0.0% 32.9% 0 0 $0.00 $0.00
B 15 930,644 7,640 0.8% 24,329 4.6% 2.6% 4.4% (660) (2,090) $9.50 $25.12
C 11 243,016 2,400 1.0% 16,400 0.0% 6.7% 1.2% (400) 0 $7.95 $18.09
All 29 1,216,160 10,040 0.8% 40,729 2.7% 3.3% 4.7% (1,060) (2,090) $9.36 $24.49 0 0
North Yonge A 24 6,052,727 314,296 5.2% 814,646 40.0% 13.5% 8.2% 47,511 (66,874) $19.43 $39.56
Corridor B 26 2,546,517 107,874 4.2% 160,034 30.7% 6.3% 6.9% 14,865 10,056 $15.71 $33.65
C 16 293,061 - 0.0% - #DIV/0! 0.0% 0.6% 640 1,680 $0.00 $0.00
All 66 8,892,305 422,170 4.7% 974,680 0 11.0% 7.6% 63,016 (55,138) $18.55 $38.16 0 0
Richmond Hill A 2 369,705 11,950 3.2% 15,071 0.0% 4.1% 1.2% 0 (11,950) $17.00 $29.00
B 7 230,118 2,280 1.0% 2,280 0.0% 1.0% 4.1% 1,323 (2,280) $14.00 $23.00
C 2 40,000 - 0.0% - #DIV/0! 0.0% 0.0% 0 0 $0.00 $0.00
All 11 639,823 14,230 2.2% 17,351 0.0% 2.7% 2.2% 1,323 (14,230) $16.61 $28.21 0 0
Vaughan/Woodbridge A 20 930,204 106,321 11.4% 110,195 0.0% 11.8% 19.6% 6,055 110,646 $19.49 $30.77
B 26 1,312,610 20,499 1.6% 56,380 8.9% 4.3% 1.9% 5,440 (24,997) $14.12 $24.45
C 14 479,996 16,544 3.4% 21,744 0.0% 4.5% 2.1% 2,080 (14,977) $16.00 $24.00
All 60 2,722,810 143,364 5.3% 188,320 2.7% 6.9% 7.3% 13,575 70,671 $17.52 $28.21 0 63,515
Keele Hwy 401/Yorkdale A 10 493,331 19,960 4.0% 19,960 0.0% 4.0% 4.2% 0 13,800 $14.00 $24.95
B 11 1,109,023 16,088 1.5% 19,350 0.0% 1.7% 2.2% (5,788) (29,262) $9.89 $24.62
C 11 353,725 14,000 4.0% 14,000 0.0% 4.0% 5.5% 8,100 (8,600) $3.95 $16.35
All 32 1,956,079 50,048 2.6% 53,310 0.0% 2.7% 3.3% 2,313 (24,062) $11.80 $24.35 0 0
COLLIERS TORONTO ONE, OFFICE STATISTICS - Q4 2009
Information contained herein has been obtained from the owners or from other sources deemed reliable. We have no reason to doubt its accuracy but regret we cannot guarantee it. All
properties subject to change or withdrawal without notice.

GTA East
December-09 Q4 2009 Q4 2008 Avg. Avg. Net Currently
Buildings Office Vacant Vacancy Available Sublet Availability Availability Net Absorption Net Absorption Asking Net Asking Gross New Supply Under
Concentration Class Surveyed Inventory Space Rate Space Availability Rate Rate Q4 2009 12 Months Rental Rates Rental Rates Q4 2009 Construction
GTA EAST A 112 14,778,342 1,389,098 9.4% 1,890,240 17% 13% 12% (134,755) (154,916) $14.15 $26.25
TOTAL: B 216 16,119,305 1,254,075 7.8% 1,979,939 16% 12% 10% 85,158 (134,952) $11.67 $24.20
C 132 4,263,640 174,514 4.1% 300,358 26% 7% 9% 3,957 (87,392) $9.21 $18.10
All 460 35,161,287 2,817,687 8.0% 4,170,536 17% 12% 11% (45,641) (377,260) $12.60 $24.71 0 0
Consumers Road A 6 1,305,506 100,215 7.7% 119,381 16% 9% 10% 1,369 (24,241) $13.34 $29.62
B 16 1,970,719 163,979 8.3% 265,480 8% 13% 12% 11,392 7,752 $11.77 $23.03
C 8 430,465 31,764 7.4% 34,044 0% 8% 2% (4,853) (8,962) $11.08 $19.95
All 30 3,706,690 295,958 8.0% 418,905 10% 11% 10% 7,908 (25,451) $12.16 $24.66 0 0
Duncan Mill A 5 585,107 18,671 3.2% 30,305 38% 5% 42% 0 (1,216) $14.29 $28.86
B 21 1,434,305 77,596 5.4% 135,762 33% 9% 3% (14,723) (2,597) $9.07 $23.13
C 13 279,478 - 0.0% 41,000 0% 15% 0% 0 0 $0.00 $0.00
All 39 2,298,890 96,266 4.2% 207,067 47% 9% 13% (14,723) (3,813) $10.35 $24.53 0 0
Don Mills A 7 1,091,936 39,306 3.6% 78,828 31% 7% 4% 0 69,496 $12.00 $28.12
B 38 3,919,804 599,639 15.3% 812,442 20% 21% 17% 29,135 (81,747) $11.69 $25.71
C 17 543,632 25,879 4.8% 28,879 0% 5% 3% 0 1,725 $8.68 $21.07
All 62 5,555,372 664,824 12.0% 920,148 21% 17% 13% 29,135 (10,525) $11.61 $25.77 0 0
Highway 404 A 37 4,339,074 467,282 10.8% 595,058 29% 14% 13% (11,497) (134,612) $16.72 $27.58
Corridor B 45 2,535,980 140,621 5.5% 292,733 5% 12% 8% 26,428 (5,392) $14.33 $25.61
C 43 1,494,387 74,780 5.0% 146,469 26% 10% 12% 8,159 (62,874) $9.06 $15.69
All 125 8,369,441 682,683 8.2% 1,034,260 22% 12% 11% 23,090 (202,877) $14.95 $25.42 0 0
Woodbine & Steeles A 16 3,328,669 217,644 6.5% 395,433 20% 12% 8% 7,195 (32,364) $13.91 $28.60
B 20 1,419,638 80,578 5.7% 170,454 19% 12% 10% 1,967 (30,708) $10.63 $19.04
C 14 347,131 12,314 3.5% 13,664 0% 4% 3% 0 350 $10.40 $19.16
All 50 5,095,438 310,535 6.1% 579,551 19% 11% 8% 9,161 (62,722) $12.55 $24.67 0 0
COLLIERS TORONTO ONE, OFFICE STATISTICS - Q4 2009
All 50 5,095,438 310,535 6.1% 579,551 19% 11% 8% 9,161 (62,722) $12.55 $24.67 0 0
Markham A 13 1,273,233 122,628 9.6% 178,770 4% 14% 16% 3,829 119,626 $14.15 $20.47
B 22 1,724,126 27,898 1.6% 61,411 49% 4% 2% 3,010 (8,965) $12.56 $24.92
C 8 183,832 6,736 3.7% 9,361 0% 5% 6% 0 (4,591) $8.99 $17.73
All 43 3,181,191 157,262 4.9% 249,542 15% 8% 8% 6,839 106,069 $13.68 $21.01 0 0
Pickering-Oshawa A 10 844,095 - 0.0% 56,569 0% 7% 0% 1,967 1,967 $14.00 $27.02
B 14 519,373 17,649 3.4% 17,649 0% 3% 4% 20,644 3,651 $12.00 $21.50
C 6 186,620 - 0.0% - #DIV/0! 0% 16% 0 (10,663) $0.00 $0.00
All 30 1,550,088 17,649 1.1% 74,218 0% 5% 4% 22,611 (5,046) $13.70 $26.19 0 0
Scarborough A 15 1,745,072 423,353 24.3% 435,896 1% 25% 17% (137,618) (153,572) $12.03 $23.95
Town Centre B 27 1,669,589 113,737 6.8% 191,628 8% 11% 9% 11,191 23,566 $9.94 $22.94
C 18 652,216 6,842 1.0% 10,742 0% 2% 16% 650 (1,178) $8.27 $23.11
All 60 4,066,877 543,931 13.4% 638,266 3% 16% 13% (125,777) (131,184) $11.29 $23.61 0 0
Toronto East A 3 265,650 - 0.0% - #DIV/0! 0% 0% 0 0 $0.00 $0.00
B 13 925,771 32,379 3.5% 32,379 0% 3% 4% (3,886) (40,512) $9.65 $23.74
C 5 145,879 16,200 11.1% 16,200 0% 11% 10% 0 (1,200) $7.00 $20.43
All 21 1,337,300 48,579 3.6% 48,579 0.0% 4% 4% (3,886) (41,712) $8.77 $22.64 0 0
Information contained herein has been obtained from the owners or from other sources deemed reliable. We have no reason to doubt its accuracy but regret we cannot guarantee it. All
properties subject to change or withdrawal without notice.
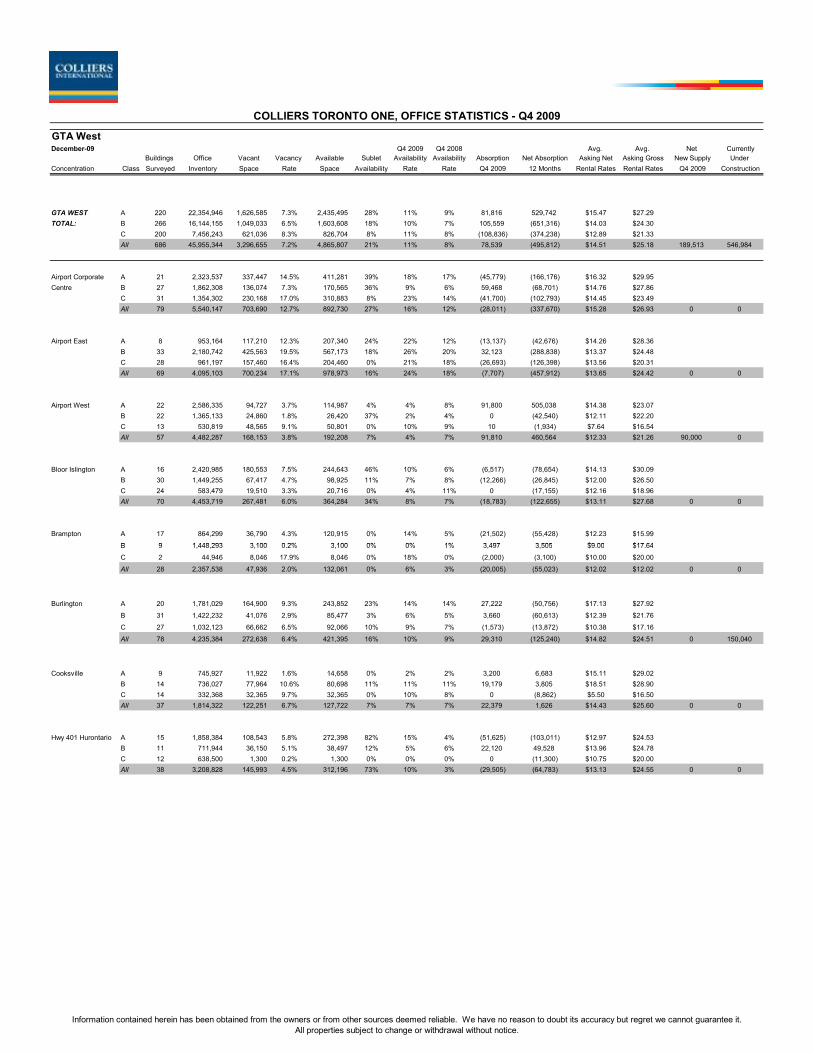
GTA West
December-09 Q4 2009 Q4 2008 Avg. Avg. Net Currently
Buildings Office Vacant Vacancy Available Sublet Availability Availability Absorption Net Absorption Asking Net Asking Gross New Supply Under
Concentration Class Surveyed Inventory Space Rate Space Availability Rate Rate Q4 2009 12 Months Rental Rates Rental Rates Q4 2009 Construction
GTA WEST A 220 22,354,946 1,626,585 7.3% 2,435,495 28% 11% 9% 81,816 529,742 $15.47 $27.29
TOTAL: B 266 16,144,155 1,049,033 6.5% 1,603,608 18% 10% 7% 105,559 (651,316) $14.03 $24.30
C 200 7,456,243 621,036 8.3% 826,704 8% 11% 8% (108,836) (374,238) $12.89 $21.33
All 686 45,955,344 3,296,655 7.2% 4,865,807 21% 11% 8% 78,539 (495,812) $14.51 $25.18 189,513 546,984
Airport Corporate A 21 2,323,537 337,447 14.5% 411,281 39% 18% 17% (45,779) (166,176) $16.32 $29.95
Centre B 27 1,862,308 136,074 7.3% 170,565 36% 9% 6% 59,468 (68,701) $14.76 $27.86
C 31 1,354,302 230,168 17.0% 310,883 8% 23% 14% (41,700) (102,793) $14.45 $23.49
All 79 5,540,147 703,690 12.7% 892,730 27% 16% 12% (28,011) (337,670) $15.28 $26.93 0 0
Airport East A 8 953,164 117,210 12.3% 207,340 24% 22% 12% (13,137) (42,676) $14.26 $28.36
B 33 2,180,742 425,563 19.5% 567,173 18% 26% 20% 32,123 (288,838) $13.37 $24.48
C 28 961,197 157,460 16.4% 204,460 0% 21% 18% (26,693) (126,398) $13.56 $20.31
All 69 4,095,103 700,234 17.1% 978,973 16% 24% 18% (7,707) (457,912) $13.65 $24.42 0 0
Airport West A 22 2,586,335 94,727 3.7% 114,987 4% 4% 8% 91,800 505,038 $14.38 $23.07
B 22 1,365,133 24,860 1.8% 26,420 37% 2% 4% 0 (42,540) $12.11 $22.20
C 13 530,819 48,565 9.1% 50,801 0% 10% 9% 10 (1,934) $7.64 $16.54
All 57 4,482,287 168,153 3.8% 192,208 7% 4% 7% 91,810 460,564 $12.33 $21.26 90,000 0
Bloor Islington A 16 2,420,985 180,553 7.5% 244,643 46% 10% 6% (6,517) (78,654) $14.13 $30.09
B 30 1,449,255 67,417 4.7% 98,925 11% 7% 8% (12,266) (26,845) $12.00 $26.50
C 24 583,479 19,510 3.3% 20,716 0% 4% 11% 0 (17,155) $12.16 $18.96
All 70 4,453,719 267,481 6.0% 364,284 34% 8% 7% (18,783) (122,655) $13.11 $27.68 0 0
Brampton A 17 864,299 36,790 4.3% 120,915 0% 14% 5% (21,502) (55,428) $12.23 $15.99
B 9 1,448,293 3,100 0.2% 3,100 0% 0% 1% 3,497 3,505 $9.00 $17.64
COLLIERS TORONTO ONE, OFFICE STATISTICS - Q4 2009
B 9 1,448,293 3,100 0.2% 3,100 0% 0% 1% 3,497 3,505 $9.00 $17.64
C 2 44,946 8,046 17.9% 8,046 0% 18% 0% (2,000) (3,100) $10.00 $20.00
All 28 2,357,538 47,936 2.0% 132,061 0% 6% 3% (20,005) (55,023) $12.02 $12.02 0 0
Burlington A 20 1,781,029 164,900 9.3% 243,852 23% 14% 14% 27,222 (50,756) $17.13 $27.92
B 31 1,422,232 41,076 2.9% 85,477 3% 6% 5% 3,660 (60,613) $12.39 $21.76
C 27 1,032,123 66,662 6.5% 92,066 10% 9% 7% (1,573) (13,872) $10.38 $17.16
All 78 4,235,384 272,638 6.4% 421,395 16% 10% 9% 29,310 (125,240) $14.82 $24.51 0 150,040
Cooksville A 9 745,927 11,922 1.6% 14,658 0% 2% 2% 3,200 6,683 $15.11 $29.02
B 14 736,027 77,964 10.6% 80,698 11% 11% 11% 19,179 3,805 $18.51 $28.90
C 14 332,368 32,365 9.7% 32,365 0% 10% 8% 0 (8,862) $5.50 $16.50
All 37 1,814,322 122,251 6.7% 127,722 7% 7% 7% 22,379 1,626 $14.43 $25.60 0 0
Hwy 401 Hurontario A 15 1,858,384 108,543 5.8% 272,398 82% 15% 4% (51,625) (103,011) $12.97 $24.53
B 11 711,944 36,150 5.1% 38,497 12% 5% 6% 22,120 49,528 $13.96 $24.78
C 12 638,500 1,300 0.2% 1,300 0% 0% 0% 0 (11,300) $10.75 $20.00
All 38 3,208,828 145,993 4.5% 312,196 73% 10% 3% (29,505) (64,783) $13.13 $24.55 0 0
Information contained herein has been obtained from the owners or from other sources deemed reliable. We have no reason to doubt its accuracy but regret we cannot guarantee it.
All properties subject to change or withdrawal without notice.

GTA West
December-09 Q4 2009 Q4 2008 Avg. Avg. Net Currently
Buildings Office Vacant Vacancy Available Sublet Availability Availability Absorption Net Absorption Asking Net Asking Gross New Supply Under
Concentration Class Surveyed Inventory Space Rate Space Availability Rate Rate Q4 2009 12 Months Rental Rates Rental Rates Q4 2009 Construction
COLLIERS TORONTO ONE, OFFICE STATISTICS - Q4 2009
Mississauga A 27 3,367,723 185,105 5.5% 269,219 8% 8% 8% (5,123) 98,898 $17.54 $33.03
City Centre B 9 396,735 4,934 1.2% 14,567 0% 4% 5% (1,429) (1,306) $15.57 $27.07
C 0 - - 0.0% - 0% 0% 0% 0 0 $0.00 $0.00
All 36 3,764,458 190,039 5.0% 283,786 7% 8% 8% (6,552) 97,593 $17.38 $32.55 0 0
Meadowvale A 14 2,608,148 93,728 3.6% 130,878 28% 5% 4% 96,125 310,935 $15.24 $24.90
B 33 2,199,084 38,826 1.8% 58,557 36% 3% 6% (1,096) (79,250) $15.57 $27.03
C 29 1,263,183 10,771 0.9% 10,771 73% 1% 3% (25,920) (66,431) $14.70 $26.00
All 76 6,070,415 143,325 2.4% 200,206 33% 3% 4% 69,109 165,253 $15.30 $25.83 99,513 375,700
Oakville A 13 1,167,628 71,298 6.1% 101,603 0% 9% 11% 7,153 50,252 $16.97 $29.04
B 22 1,026,449 32,518 3.2% 83,118 7% 8% 8% 43,571 (37,861) $14.47 $18.07
C 11 409,662 6,750 1.6% 9,996 0% 2% 2% (10,961) (8,563) $13.69 $26.49
All 65 3,301,770 165,735 5.0% 402,289 24% 12% 8% 39,763 3,828 $15.63 $23.48 0 0
Sheridan A 7 392,049 48,535 12.4% 78,044 0% 20% 17% 0 54,638 $18.95 $30.75
B 22 1,333,685 42,531 3.2% 89,188 0% 7% 2% (63,269) (102,201) $12.37 $21.85
C 9 372,365 17,019 4.6% 17,019 0% 5% 1% 0 (13,830) $8.55 $16.89
All 38 2,098,099 108,085 5.2% 184,251 0% 9% 4% (63,269) (61,392) $14.66 $24.97 0 21,244
Information contained herein has been obtained from the owners or from other sources deemed reliable. We have no reason to doubt its accuracy but regret we cannot guarantee it.
All properties subject to change or withdrawal without notice.

© 2010 CB Richard Ellis Limited, Real Estate Brokerage
Toronto OfficeFourth Quarter 2009www.cbre.ca/research
CB RICHARD ELLIS
� Over 4.0 million SF of new supply was completed in 2009; a new single year record for the GTA.
� A statistical anomaly occurred in the third and fourth quarters in terms of absorption, however, over the next two to four quarters this important demand benchmark should normalize.
� The Suburban market has given more space back in the last four quarters than what was absorbed throughout 2008.
Hot Topics
Quick Stats
1,225,623
692,884
$17.35
9.4%
Current Yr.
Completions (SF)
Net Absorption (SF)
Net Rent (psf)
Vacancy
Qtr.
Change from last
*The arrows are trend indicators over the specified time period and do not represent a positive or negative value. (e.g., absorption could be negative, but still represent a positive trend over a specified period.)
There were two significant turning points for the
Greater Toronto Area (GTA) office market in
the fourth quarter of 2009: the end of the
Canadian recession; and the delivery of
another major office tower in the Downtown
market, meaning that the bulk of the new office
developments in the GTA have been delivered
to market. Statistics Canada confirmed in the
fourth quarter that Canada came out of the
recession in September with a 0.4% increase in
Gross Domestic Product (GDP), followed with a
gain of 0.2% in October. While this growth is
encouraging, the economy is still 3.2% smaller
than in the same period of 2008.
With the delivery of Menkes� Telus Tower at 25
York Street, the Downtown Toronto market has
now received 3.1 million SF of the 4.6 million
SF which has been under construction. The
remaining 1.5 million SF will be delivered
through Maple Leaf Square (200,000 SF), the
TEDCO Corus Building (450,000 SF), 18 York
Street (641,000 SF) and 111 Richmond Street
West (225,000 SF). With the majority of new
construction (69.0%) successfully delivered to
market and a further 657,000 SF expected in
the first quarter of 2010, it seems that this
recession will not mirror the 1991-1992 period
that was hallmarked by the failure of the
original Bay-Adelaide Centre.
The statistical anomaly in absorption that was
reported in the third quarter continues to occur
and has resulted in 692,884 SF of positive
quarterly net absorption for the GTA. The
anomaly is rooted in the methodology used to
calculate absorption* which includes pre-leased
new construction completions as positive
absorption despite the fact that tenants have
* CB Richard Ellis measures absorption by subtracting the change in inventory quarter-over-quarter (q/q) from the change in occupied space (q/q).
not vacated their previous premises. This
anomaly will work itself out in the coming
quarters with exaggerated negative
absorption as tenants vacate their old
space.
The new inventory has helped to push the
GTA vacancy rate up 30 basis points (bps)
to 9.4%, a level not seen since the third
quarter of 2006 and there is no indication
that the vacancy level has topped out. Rising
vacancy rates were the prevailing story
across the GTA with the exception of GTA
North, which experienced declining vacancy
in all submarkets, and GTA West, which was
virtually flat quarter-over-quarter.
In general, the Suburban markets
outperformed the Central market in the
fourth quarter with vacancy increasing less
than 10 bps and asking rents increasing
$0.10 psf, whereas the Central market
experienced a 50 bps increase in vacancy
and a $0.53 psf decline in rental rates. The
biggest asking rate decline was in the
Downtown Class A segment, which saw
almost an 8.0% decline in rates. This is
directly due to the supply-demand equation
shifting strongly in favour of supply with the
new office towers coming into play.
The market fundamentals all point to
continuing weakness in the GTA office
market; however, the pace of the decline
has been much slower than thought due to
better job preservation than expected. There
will need to be significant job creation over
the next few years for the market to fully
digest the new inventory. In the meantime,
consolidation, refurbishment, and
realignment will be the industry buzzwords
in 2010.

Ma
rketV
iew
Toro
nto
Office
Fourth Quarter 20
09
© 2010 CB Richard Ellis Limited, Real Estate Brokerage
Page 2
$17.352,494,045692,88422.7%9.4%146,448,134GTA
$14.60869,015439,38522.0%11.6%31,852,180West
$16.76127,03084,07830.1%7.0%11,551,502North
$12.920-154,64116.8%13.9%25,050,589East
$16.620-100,41126.1%8.3%14,664,104Midtown
$24.081,498,000424,47325.4%7.1%63,329,759Downtown
Net Rental Rate ($ psf/yr)
4Q09 UnderConstruction (SF)
4Q09 Net Absorption (SF)
Sublease % of Vacancy
VacancyRate
InventorySubmarket
New Construction
Economic Trends
CentralSuburbs
GDP % Change
Employment % Change
Market Statistics
0
500
1,000
1,500
2,000
2,500
4Q08 1Q09 2Q09 3Q09 4Q09
SF (0
00's)
-2.0%
-1.0%
0.0%
1.0%
2.0%
3Q09 4Q09 1Q10* 2Q10* 3Q10*
Source: Conference Board of Canada
* Forecasted
The total GTA inventory rose by 1.0% this quarter, the majority of which was delivered through the completion of the Menkes Telus Tower at 25 York Street (780,000 SF) in the Downtown South market. Of the major new builds in the Downtown market, only 15 York Street (207,000 SF), 18 York Street (641,000 SF), and the TEDCO Corus Building (450,000 SF) have yet to be completed. The remaining space was delivered in the GTA West with five new completions: Meadowvale saw the most activity with three completions totaling 275,000 SF; Mississauga South saw the completion of 100,000 SF project at 2699 Speakman Drive; and a 70,720 SF project was completed in the Highway 10 � Highway 401 Corridor at 75 Courtneypark Drive.
The Toronto economy continues to struggle, even in light of recent good news for the Ontario economy. The unemployment rate in Toronto settled at 9.7% in the fourth quarter, up from 9.2% in the previous quarter, while the rate in Ontario rose to 9.3% from 9.2% last quarter. Much of the provincial job losses are thought to be in manufacturing and construction which would have been the primary beneficiaries of stimulus spending and bailouts. The fourth quarter also marked the third consecutive quarter of GDP growth for Toronto and a return to levels not seen since the fourth quarter of 2008.

Ma
rketV
iew
Toro
nto
Office
Fourth Quarter 20
09
© 2010 CB Richard Ellis Limited, Real Estate Brokerage
Page 3
Vacancy Rate
Net Rental Rates Suburbs
Central
Absorption
-800
-400
0
400
800
1,200
1,600
4Q08 1Q09 2Q09 3Q09 4Q09
SF (0
00's)
$5.00
$10.00
$15.00
$20.00
$25.00
4Q08 1Q09 2Q09 3Q09 4Q09
$ ps
f
2%
4%
6%
8%
10%
12%
4Q08 1Q09 2Q09 3Q09 4Q09
Suburbs
Central
Suburbs
Central
The overall GTA vacancy rate climbed another 30 bps in the fourth quarter to 9.4%. This is a full 260 bps higher and 4.1 million SF more vacant space than in the fourth quarter of 2008. Without a major unforeseen event, the vacancy rate will almost certainly enter into double-digit territory in the first quarter of 2010, a level not seen since 2005. Vacancy levels actually bucked the trend and dropped in all GTA North markets, and some GTA West markets. As a result, the Suburban markets look virtually flat in terms of vacancy rate growth, while the Central markets saw a 50 bps increase in the overall rate to 7.3%. This increase is principally due to the continued delivery of new product to the Downtown market.
The fourth quarter of 2009 saw net rental rates begin to retreat in line with the rising vacancy rate in some markets. Most significantly, it appears as though the new supply and 1.5 million SF of sublease space in the Central market has finally caught up with rental rates as they fell 2.3%, or $0.53 psf, to $22.44 psf. Nowhere was this more pronounced than in the Downtown Class A category where a $2.40 psfdrop was recorded, or almost 8.0%, to $27.63 psf, virtually the same level as this time last year. The Suburban markets edged up slightly by $0.10 psf, but rates are expected to decrease in 2010.
The Central market posted 324,062 SF of positive net absorption in the fourth quarter, but if you take out the 669,278 SF of positive absorption in the Downtown South Class A (Telus Tower), the story would be much the same as the third quarter with very little leasing activity and a large amount of negative absorption. The Suburbanmarket recorded positive 368,822 SF of absorption in the fourth quarter, which breaks the streak of three consecutive quarters of negative net absorption. Absorption for the GTA as a whole was flat with only 131,756 SF of positive net absorption for the year.
Ma
rketV
iew
Toro
nto
Office
Fourth Quarter 20
09
© 2010 CB Richard Ellis Limited, Real Estate Brokerage
Page 4
Greater Core Financial Core
Central Toronto Midtown Market
Similar to the Greater Core, the Financial Core changed course after the third quarter. Net rental rates fell $1.08 psf to $28.01 psf, the lowest level since the end of 2007. Similarly, after positive absorption in the third quarter due to the opening of the Bay-Adelaide Centre, the absorption number for the fourth quarter came in at negative 208,161 SF, in line with the rest of the City and expectations.
The vacancy rate continued to climb, up 80 bps to 7.8%. This number is expected to climb further in the coming quarters as the market struggles with slow growth.
Significant Financial Core transactions this quarter include:
�Beard Winter LLP renewed their lease of 40,000 SF at 130 Adelaide Street West
�Deloitte & Touche renewed their lease of 42,000 SF at 121 King Street West
�MacQuarrie Bank Ltd. leased 34,000 SF at 181 Bay Street
The Midtown market posted 100,411 SF of negative absorption in the fourth quarter. This came on the heels of the first quarter of positive absorption for the Midtown market since the beginning of 2008. All three submarkets experienced negative absorption, although as a percentage of total inventory the St. Clair/Yonge market lost the most with negative 24,429 SF. The vacancy rate rose from 7.7% in the third quarter to 8.3%, the same level as in the second quarter of 2009.
Despite the negative absorption, the overall quoted asking net rental rate rose for the first time in 2009, ending the quarter up $0.09 psf at $16.62 psf.
Significant Midtown market transactions this quarter include:
�Systemware Innovation Corp. leased 21,278 SF at 2300 Yonge Street
�Ontario Education Collaborative Marketplace leased 12,000 SF at 90 Eglinton Avenue West
�DIGI Group Inc. leased 6,171 SF at 1200 Bay Street
Notwithstanding the completion of the Telus Tower, it was another poor quarter for the Central market. If you strip out the 669,278 SF of positive absorption that was contributed by the Telus Tower, the result would be significant negative absorption. The new buildings masked the weak fundamentals that currently exist in the Central market. The vacancy rate climbed 50 bps to 7.3%, which is the highest rate since the fourth quarter of 2006. Sublet availabilities continued to increase as an additional 117,058 SF come onto the market in the third quarter.
The overall quoted asking net rental rate closed the quarter at $22.44 psf, down $0.53 psf from the third quarter. This remains close to the historical high for the Central market thanks to large block availabilities in Toronto�s new marquee towers.
Significant Central market transactions this quarter include:
�Baker & McKenzie LLP renewed 38,000 SF at 181 Bay Street
�Department of Justice subleased 25,450 SF at 130 King Street West
�Allianz Group leased 30,000 SF at 130 Adelaide Street West
The statistical jumps that occurred in the Greater Core as a result of the opening of the RBC Centre last quarter were erased in the fourth quarter. Absorption had surged by 839,132 SF in the third quarter, but fell back to negative 56,238 SF in the fourth quarter. Net rental rates, which rose by an astonishing $3.87 psfin the third quarter, dropped $3.24 psf in the fourth quarter to end at $21.93 psf. Vacancy continued to rise, but at a more moderate pace of 30 bps to 7.0%. The market will take a few quarters to fully absorb the space in the new RBC Centre, which still has 320,000 SF available.
The Class B market fared the best this quarter, as both vacancy (6.5%) and net rental rates ($17.24 psf) dropped, while absorption remained positive. This resiliency is most likely due to economic considerations.
Significant Greater Core transactions this quarter include:
�The Insurance Institute of Canada leased 22,361 SF at 18 King Street East
�Genest Murray LLP leased 7,500 SF at 200 King Street West

Ma
rketV
iew
Toro
nto
Office
Fourth Quarter 20
09
© 2010 CB Richard Ellis Limited, Real Estate Brokerage
Page 5
East Market West Market
Suburban Toronto North Market
After three difficult quarters, the West market showed some life in the fourth quarter. Almost 450,000 SF of new space was delivered this quarter, which resulted in 439,385 SF of positive absorption. Most of the absorption was located in the Meadowvale submarket where three new buildings totaling 275,000 SF were completed. Only Brampton and the 427 Corridor recorded negative absorption. As a result of this, the overall vacancy rate dropped 20 bps to 11.6%, the first decline in 12 months, but vacancy remains near a five year high.
Net rental rates increased by $0.43 psf this quarter to $14.60 psf, which is down from the same time last year and reflects the worst annual performance for the West since 2003.
Significant West market transactions include:
�S.P. Richards Company renewed for 66,779 SF at 1325 Clarke Street, Brampton
�Newell Industries Canada Inc. subleased 42,788 SF at 178 South Service Road, Oakville
�NCR Canada Ltd. leased 34,313 SF at 6865 Century Avenue, Mississauga
The North market built upon the gains reported in the third quarter with the second straight quarter of positive absorption, at 84,078 SF in the fourth quarter. Vacancy rates dropped from 7.7% to 7.0% and the net rental rate increased $0.04 psf to $16.76 psf. Again, similar to the third quarter, most of the leasing activity took place in the Class B market with the vacancy rate dropping 180 bps to 2.4%. This was driven by 64,998 SF of positive absorption in the North Yonge Class B market, which brought the North market as a whole to virtually flat absorption for 2009 at negative 472 SF, which is positive news in light of the economic environment.
Significant North market transactions include:
�Toronto Transit Commission subleased 33,000 SF at 5160 Yonge Street, Toronto
�Ontario Realty Corporation leased 16,000 SF at 5001 Yonge Street, Toronto
In 2009, the Suburban market shed 100,000 SF more than it absorbed throughout all of 2008. Net absorption was positive 368,822 SF for the fourth quarter. This was largely due to 439,385 SF of absorption in the West. This was tempered by loses in the East, and a minor gain in the North. This caused the vacancy rate to remain virtually unchanged, up only 10 bps to 11.7%; the highest Suburban vacancy rate since the third quarter of 2005.
The overall quoted asking net rental rate rose a nominal $0.10 psf to close the quarter at $14.00 psf.
Significant Suburban market transactions this quarter include:
� Royal Bank of Canada renewed 37,000 SF at 3300 Highway 7 West, Vaughan
� Ontario Lottery and Gaming Corporation renewed 77,000 SF at 4120 Yonge Street, Toronto
� Just Energy Corporation leased 46,236 SF at 6345 Dixie Road, Mississauga.
The East market was a reflection of the GTA market as a whole this quarter. The vacancy rate rose 70 bps to a GTA high of 13.9% due to 154,641 SF of negative absorption and net rental rates dropped $0.07 psf to $12.92 psf. The malaise felt in the East market is symptomatic of conditions in the City at large. All submarkets experienced negative absorption, save minimal growth in Consumers Road and East York/Don Mills South.
The largest positive change came in the sublet market, as sublet space as a percentage of total vacant space fell from 22.5% to 16.8%.
Significant East market transactions this quarter include:
�FinancialLinx renewed their 40,000 SF lease at 2001 Sheppard Avenue East, Toronto
�DMTI Spatial Inc. subleased 25,500 SF at 15 Allstate Parkway, Markham
�CAA South Central Ontario subleased 25,000 SF at 100 Commerce Valley Drive, Markham

MarketView Toronto Office
This disclaimer shall apply to CB Richard Ellis Limited, a real estate brokerage, and its Canadian affiliates, CB Richard Ellis Alberta Limited, CB Richard Ellis Manitoba Limited, CB Richard Ellis Advisory Services Inc., and CB Richard Ellis Québec Limitée (collectively �CBRE�).
© 2010 CB Richard Ellis Limited, Real Estate Brokerage. The information set out herein (the "Information") is intended for informational purposes only. CBRE has not verified the Information and does not represent, warrant or guarantee the accuracy, correctness and completeness of the Information. CBRE does not accept or assume any responsibility or liability of any kind in connection with the Information and the recipient�s reliance upon the Information. The recipient of the Information should take such steps as the recipient may deem necessary to verify the Information prior to placing any reliance upon the Information. The Information may change and any property described in the Information may be withdrawn from the market at any time without notice or obligation to the recipient from CBRE.
Average Asking Lease RateRate determined by multiplying the asking net lease rate for each building by its available space, summing the products, then dividing by the sum of the available space with net leases for all buildings in the summary.
Net LeasesIncludes all lease types whereby the tenant pays an agreed rent plus most, or all, of the operating expenses and taxes for the property, including utilities, insurance and/or maintenance expenses.
Market CoverageIncludes all competitive office buildings 10,000 square feet and greater in size.
Net AbsorptionThe change in occupied square feet from one period to the next.
Net Rentable AreaThe gross building square footage minus the elevator core, flues, pipe shafts, vertical ducts, balconies, and stairwell areas.
Occupied Square FeetBuilding area not considered vacant.
Under ConstructionBuildings which have begun construction as evidenced by site excavation or foundation work.
Available Square FeetAvailable Building Area which is either physically vacant or occupied.
Availability RateAvailable Square Feet divided by the Net Rentable Area.
Vacant Square FeetExisting Building Area which is physically vacant or immediately available.
Vacancy RateVacant Building Square Feet divided by the Net Rentable Area.
NormalizationDue to a reclassification of the market, the base, number and square footage of buildings of previous quarters have been adjusted to match the current base. Availability and Vacancy figures for those buildings have been adjusted in previous quarters.
For more information regarding the MarketView, please contact: Ian M. Thompson, Senior Research AnalystCB Richard Ellis 145 King Street West, Suite 600Toronto ON M5H 1J8T. 416.815.2346 F. [email protected]
146.5 million SF of office spaceGTA
31.9 million SF of office space representing 21.8% of the GTA office marketWest
25.1 million SF of office space representing 17.1% of the GTA office marketEast
11.6 million SF of office space representing 7.9% of the GTA office marketNorth
78.0 million SF of office space representing 53.3% of the GTA office marketCentral
Market Area Descriptions
Submarket Map

Toronto Office Statistics - Q4 2009
YTD
completion (sf) Inventory (sf)
Total net
absorption
(sf)
YTD total net
absorption
(sf)
YTD total net
absorption
(% of stock)
Direct
vacancy (sf)
Direct
vacancy (%)
Total vacancy
(sf) Total vacancy (%)
Average asking rent
($ psf)
Under
construction /
renovation (sf)
Downtown
Class A 3,066,335 42,736,765 598,883 486,355 1.2% 2,618,512 6.1% 4,199,036 10.1% $50.92 1,754,176
Class B 0 17,024,126 -29,405 -153,119 -0.9% 836,477 4.9% 1,037,143 5.9% $37.16 0
Class C 0 8,170,582 189,106 124,569 1.5% 591,260 7.2% 677,067 4.8% $28.20 0
Totals 3,066,335 67,931,473 758,584 457,805 0.7% 4,046,249 6.0% 5,913,246 8.4% $44.74 1,754,176
Midtown
Class A 0 6,588,756 -65,494 -119,125 -1.8% 365,855 5.6% 676,652 10.3% $39.09 0
Class B 0 8,395,905 23,497 -26,047 -0.3% 455,012 5.4% 542,851 6.5% $33.69 0
Class C 0 1,470,850 6,859 7,926 0.5% 529,973 36.0% 538,798 36.6% $28.47 0
Totals 0 16,455,511 -35,138 -137,246 -0.8% 1,350,840 8.2% 1,758,301 10.7% $32.84 0
Suburban
Class A 1,334,706 49,219,514 240,929 -114,782 -0.2% 3,644,785 7.4% 5,247,716 10.7% $30.11 1,067,451
Class B 0 26,517,973 -417,001 -776,579 -2.9% 2,731,888 10.3% 3,481,272 13.1% $25.61 0
Class C 0 7,746,460 -23,105 11,104 0.1% 748,173 9.7% 839,213 10.8% $20.46 0
Totals 1,334,706 83,483,947 -199,177 -880,257 -1.1% 7,124,846 8.5% 9,568,201 11.5% $27.79 1,067,451
Market Totals
Class A 4,401,041 98,545,035 774,318 252,448 0.3% 6,629,152 6.7% 10,123,404 10.3% $39.74 2,821,627
Class B 0 51,938,004 -422,909 -955,745 -1.8% 4,023,377 7.7% 5,061,266 9.7% $30.70 0
Class C 0 17,387,892 172,860 143,599 0.8% 1,869,406 10.8% 2,055,078 11.8% $24.78 0
Totals 4,401,041 167,870,931 524,269 -559,698 -0.3% 12,521,935 7.5% 17,239,748 10.3% $35.39 2,821,627
© 2009 Jones Lang LaSalle IP, Inc. All rights reserved.
/pulse/Americas Research
Kristian Halkias Senior National Research Analyst
tel +1 416 304 6047 fax +1 416 304 6001 [email protected]

Downtown
YTD
completion (sf) Inventory (sf)
Total net
absorption
(sf)
YTD total net
absorption
(sf)
YTD total net
absorption
(% of stock)
Direct
vacancy (sf)
Direct
vacancy (%)
Total vacancy
(sf) Total vacancy (%)
Average asking rent
($ psf)
Under
construction /
renovation (sf)
Financial Core
Class A 1,100,000 26,153,109 130,777 -15,082 -0.1% 1,707,239 6.5% 2,364,324 9.0% $56.52 0
Class B 0 6,365,052 -1,580 -112,581 -1.8% 361,090 5.7% 450,253 7.1% $45.35 0
Class C 0 1,388,830 167,692 146,546 10.6% 91,101 6.6% 97,994 7.1% $33.72 0
Totals 1,100,000 33,906,991 296,889 18,883 0.1% 2,159,430 6.4% 2,912,571 7.1% $53.49 0
Downtown East
Class A 14,735 678,463 -27,760 -20,673 -3.1% 61,631 9.1% 72,114 10.6% $38.31 0
Class B 0 997,092 28,705 2,456 0.2% 169,836 17.0% 211,326 21.2% $32.63 0
Class C 0 1,105,578 747 -26,281 -2.4% 178,477 16.1% 191,651 17.3% $29.87 0
Totals 14,735 2,781,133 1,692 -44,498 -1.6% 409,944 14.7% 475,091 7.6% $32.92 0
Downtown North
Class A 0 5,532,458 646 -1,289 0.0% 71,272 1.3% 132,276 2.4% $39.85 400,000
Class B 0 5,969,355 10,271 -8,540 -0.1% 87,904 1.5% 104,140 1.7% $33.31 0
Class C 0 964,869 -10,207 -18,726 -1.9% 83,885 8.7% 101,514 10.5% $27.08 0
Totals 0 12,466,682 710 -28,555 -0.2% 243,061 1.9% 337,930 2.6% $35.73 400,000
Downtown West
Class A 1,200,000 7,447,495 512,709 499,640 8.0% 448,271 6.0% 545,540 7.3% $41.97 0
Class B 0 2,556,460 -47,596 -38,618 -1.5% 171,250 6.7% 186,036 7.3% $30.37 0
Class C 0 2,627,810 1,871 14,268 0.5% 157,021 6.0% 196,390 7.5% $28.62 0
Totals 1,200,000 12,631,765 466,984 475,290 4.2% 776,542 6.1% 927,966 12.5% $36.85 0
Downtown South
Class A 751,600 2,255,754 218 -19,778 -1.3% 171,033 7.6% 877,359 38.9% $52.52 1,354,176
Class B 0 650,448 -18,874 -14,316 -2.2% 17,191 2.6% 51,682 7.9% $35.54 0
Class C 0 50,000 -10,275 -10,275 -20.6% 15,297 30.6% 15,297 30.6% $26.50 0
Totals 751,600 2,956,202 -28,931 -44,369 -2.0% 203,521 6.9% 944,338 29.7% $48.34 1,354,176
© 2009 Jones Lang LaSalle IP, Inc. All rights reserved.
Pulse • Toronto Office Statistics - Q4 2009 • 2
Kristian Halkias Senior National Research Analyst
tel +1 416 304 6047 fax +1 416 304 6001 [email protected]

Downtown (continued)
YTD
completion (sf) Inventory (sf)
Total net
absorption
(sf)
YTD total net
absorption
(sf)
YTD total net
absorption
(% of stock)
Direct
vacancy (sf)
Direct
vacancy (%)
Total vacancy
(sf) Total vacancy (%)
Average asking rent
($ psf)
Under
construction /
renovation (sf)
King & Dufferin
Class A 0 669,486 -17,707 43,537 6.5% 159,066 23.8% 207,423 31.0% $30.73 0
Class B 0 485,719 -331 18,480 3.8% 29,206 6.0% 33,706 6.9% $24.27 0
Class C 0 2,033,495 39,278 19,037 0.9% 65,479 3.2% 74,221 3.6% $23.56 0
Totals 0 3,188,700 21,240 81,054 2.5% 253,751 8.0% 315,350 9.2% $25.17 0
Market Totals
Class A 3,066,335 42,736,765 598,883 486,355 1.2% 2,618,512 6.1% 4,199,036 10.1% $50.92 1,754,176
Class B 0 17,024,126 -29,405 -153,119 -0.9% 836,477 4.9% 1,037,143 5.9% $37.16 0
Class C 0 8,170,582 189,106 124,569 1.5% 591,260 7.2% 677,067 4.8% $28.20 0
Totals 3,066,335 67,931,473 758,584 457,805 0.7% 4,046,249 6.0% 5,913,246 8.4% $44.74 1,754,176
© 2009 Jones Lang LaSalle IP, Inc. All rights reserved.
Pulse • Toronto Office Statistics - Q4 2009 • 3
Kristian Halkias Senior National Research Analyst
tel +1 416 304 6047 fax +1 416 304 6001 [email protected]

Midtown
YTD
completion (sf) Inventory (sf)
Total net
absorption
(sf)
YTD total net
absorption
(sf)
YTD total net
absorption
(% of stock)
Direct
vacancy (sf)
Direct
vacancy (%)
Total vacancy
(sf) Total vacancy (%)
Average asking rent
($ psf)
Under
construction /
renovation (sf)
Bloor
Class A 0 4,210,699 -21,163 -81,202 -1.9% 224,618 5.3% 447,759 10.6% $40.84 0
Class B 0 4,149,951 -19,791 -70,084 -1.7% 214,379 5.2% 271,137 6.5% $35.03 0
Class C 0 748,887 5,019 -1,273 -0.2% 53,705 7.2% 57,602 7.7% $29.50 0
Totals 0 9,109,537 -35,935 -152,559 -1.7% 492,702 5.4% 776,498 8.5% $37.26 0
Eglinton
Class A 0 1,515,301 -56,852 -48,237 -3.2% 99,088 6.5% 137,545 9.1% $34.79 0
Class B 0 2,667,444 50,785 47,821 1.8% 183,233 6.9% 197,556 7.4% $31.54 0
Class C 0 625,362 1,840 9,199 1.5% 49,268 7.9% 54,196 8.7% $26.79 0
Totals 0 4,808,107 -4,227 8,783 0.2% 331,589 6.9% 389,297 8.1% $31.95 0
St. Clair
Class A 0 862,756 12,521 10,314 1.2% 42,149 4.9% 91,348 10.6% $38.09 0
Class B 0 1,578,510 -7,497 -3,784 -0.2% 57,400 3.6% 74,158 4.7% $33.81 0
Class C 0 96,601 0 0 0.0% 427,000 442.0% 427,000 442.0% $31.35 0
Totals 0 2,537,867 5,024 6,530 0.3% 526,549 20.7% 592,506 23.3% $35.17 0
Market Totals
Class A 0 6,588,756 -65,494 -119,125 -1.8% 365,855 5.6% 676,652 10.3% $39.09 0
Class B 0 8,395,905 23,497 -26,047 -0.3% 455,012 5.4% 542,851 6.5% $33.69 0
Class C 0 1,470,850 6,859 7,926 0.5% 529,973 36.0% 538,798 36.6% $28.47 0
Totals 0 16,455,511 -35,138 -137,246 -0.8% 1,350,840 8.2% 1,758,301 10.7% $32.84 0
© 2009 Jones Lang LaSalle IP, Inc. All rights reserved.
Pulse • Toronto Office Statistics - Q4 2009 • 4
Kristian Halkias Senior National Research Analyst
tel +1 416 304 6047 fax +1 416 304 6001 [email protected]

Suburban
YTD
completion (sf) Inventory (sf)
Total net
absorption
(sf)
YTD total net
absorption
(sf)
YTD total net
absorption
(% of stock)
Direct
vacancy (sf)
Direct
vacancy (%)
Total vacancy
(sf) Total vacancy (%)
Average asking rent
($ psf)
Under
construction /
renovation (sf)
East
Class A 157,200 17,152,563 3,599 28,218 0.2% 1,647,613 9.6% 2,190,987 12.8% $28.37 0
Class B 0 10,431,360 -218,119 -281,613 -2.7% 1,312,484 12.6% 1,787,095 17.1% $24.92 0
Class C 0 2,789,422 8,471 26,187 0.9% 199,716 7.2% 233,882 8.4% $19.99 0
Totals 157,200 30,373,345 -206,049 -227,208 -0.8% 3,159,813 10.4% 4,211,964 13.9% $26.42 0
North
Class A 102,923 9,084,362 -117,333 -201,787 -2.2% 531,661 5.9% 805,099 8.9% $35.90 273,515
Class B 0 3,430,950 10,179 -5,793 -0.2% 102,211 3.0% 164,821 4.8% $30.85 0
Class C 0 1,018,767 10,605 41,101 4.0% 79,316 7.8% 79,316 7.8% $20.35 0
Totals 102,923 13,534,079 -96,549 -166,479 -1.2% 713,188 5.3% 1,049,236 7.8% $33.45 273,515
West
Class A 1,074,583 22,982,589 354,663 58,787 0.3% 1,465,511 6.4% 2,251,630 9.8% $29.13 793,936
Class B 0 12,655,663 -209,061 -489,173 -3.9% 1,317,193 10.4% 1,529,356 12.1% $24.75 0
Class C 0 3,938,271 -42,181 -56,184 -1.4% 469,141 11.9% 526,015 13.4% $20.83 0
Totals 1,074,583 39,576,523 103,421 -486,570 -1.3% 3,251,845 8.2% 4,307,001 10.9% $26.90 793,936
Market Totals
Class A 1,334,706 49,219,514 240,929 -114,782 -0.2% 3,644,785 7.4% 5,247,716 10.7% $30.11 1,067,451
Class B 0 26,517,973 -417,001 -776,579 -2.9% 2,731,888 10.3% 3,481,272 13.1% $25.61 0
Class C 0 7,746,460 -23,105 11,104 0.1% 748,173 9.7% 839,213 10.8% $20.46 0
Totals 1,334,706 83,483,947 -199,177 -880,257 -1.1% 7,124,846 8.5% 9,568,201 11.5% $27.79 1,067,451
Pulse • Toronto Office Statistics - Q4 2009 • 5
Kristian Halkias Senior National Research Analyst
tel +1 416 304 6047 fax +1 416 304 6001 [email protected]
© 2009 Jones Lang LaSalle IP, Inc. All rights reserved.

Average Rental RatesCBD Q2 2009 Q3 2009 Q4 2009
Suburban Q2 2009 Q3 2009 Q4 2009
Class A Office $56.60 $57.01 $56.52
Class B Office $44.91 $45.18 $45.35
Class A Office $30.01 $29.95 $30.11
Class B Office $25.53 $25.46 $25.62
Prepared By CresaPartners
170 University Avenue, Suite 1100
Toronto, Ontario M5H 3B3
416.862.2666 www.cresapartners.com
Major TransactionsTenant/Buyer Size Type Lease/Sale
Ubisoft Toronto Inc. 134,845 Office Lease
Stream International Canada 89,237 Office Lease
Mosaic Sales Solutions Canada 40,859 Office Lease
Service Employees Int’l Union 39,455 Office Sale
FinanciaLinx Corporation 37,454 Office Lease
Toronto Central Community 32,796 Office Lease
Care Access Centre
Securitas Canada Limited 15,736 Office Lease
Build Toronto 14,125 Office Lease
Meyers Norris Penny LLP 13,827 Office Lease
Breckles Insurance Brokers Ltd. 12,538 Office Lease
Vacancy Rate
Overview
Market Trends
Tenant's Perspective
The final quarter of 2009 saw a continuing increase in availability
rates and decrease in average occupancy costs per SF across the
Greater Toronto Area (GTA). Overall availability rates for the city
rose to 11.4% from 11.2% in the previous quarter. All areas of
the city followed the same trend with regards to availability with
the North District seeing the largest percentage increase from
8.5% in Q3 to 9.0% in Q4. Conversely, the West District remained
almost flat with less than a 0.1% increase in availability.
Availability in the CBD rose from 12.4% to 12.7% over the last
quarter, though class A availability actually dropped from 13.6% to
13.1%. This decrease was offset primarily by class C space,
where the availability rate leapt from 7.0% in Q3 to 24.6% in Q4
due to the remarketing of an entire 190,000 SF building. While
the class C market in the CBD is relatively small in absolute terms,
the increase in available square footage in this class still more than
offsets the decrease in class A properties.
As illustrated in the Q3 market report, average gross rental rates
are becoming increasingly misleading since landlords are offering
increased inducements in order to keep rates high. While this
practice continues, it can't fully mask the fact that average rates
are dropping. Average rates across the GTA fell by $0.26/SF in the
last quarter to $34.40/SF. The drop was even larger in the CBD,
with rates declining from $53.69/SF in Q3 to $52.96/SF by the end
of the year.
While the overall availability rate has increased, the availability
rate for class A properties declined in Q4 2009, indicating a
flight to quality.
After rapidly rising throughout late 2008 and most of 2009,
the amount of sublease space available decreased by nearly
100,000 SF.
The commercial real estate outlook for 2010 remains murky as the
new year begins. Most analysts are predicting that availability
rates will continue to rise for at least the next two quarters, while
rental rates should continue to fall. However, given that certain
building classes in certain areas are outperforming others, it is
important that tenants be armed with as much information as
possible before considering their next move.
�
�
Toronto, OntarioT e n a n t ’ s G u i d e N o r t h A m e r i c a n M a r k e t s F o u r t h Q u a r t e r 2 0 0 9
0%
5%
10%
15%
Class A
CBD
Class B
CBD
Class A
Suburban
Class B
Suburban
Q2 2009 Q3 2009 Q4 2009

GREATER TORONTO AREA OFFICE REPORT 3Q09 1
3Q09
ECONOMY Ontario is feeling the brunt of the global recession, with its overall unemployment rate up to a 15-year high of 9.4%. The Toronto Census Metropolitan Area (CMA) has an unemployment rate of 10.2%. Canada-wide, total employment has fallen by 387,000 jobs since October 2008, with 207,000 of those jobs�or 53% of the total�lost in Ontario. Manufacturing and construction took the greatest hits, with the ripple effect extending to the office sector, as evidenced by the number of tenants who have taken measures to reduce their occupancy. GDP growth for 2009 is expected to contract by 2.3%; however, employment has stabilized and some job growth was experienced in August 2009.
OVERVIEW GTA office markets saw absorption nudge its way into positive territory in the third quarter, providing some hope that the impact of the downturn will not be as severe as initially predicted. While the increase in absorption is a positive signal for GTA landlords, demand is expected to remain weak well into 2010 as a result of the severely impacted US economy.
Tenants were more active in the marketplace in the third quarter, although they remain focused on the preservation of capital and minimizing cash outflow. This is resulting in a greater proportion of renewals and strong incentive to consolidate in cases where tenants have multiple locations. Overall, tenants are contracting, although there is evidence of some expansions in the government, banking and professional services sectors. While the amount of sublet space returning to market slowed over the third quarter, that could change should business continue to be pressured by weak economic fundamentals.
Two significant office towers were completed in Downtown Toronto in the third quarter. Cadillac Fairview�s RBC Centre brings 1.25 million square feet (msf) of inventory to market, and Brookfield Properties� Bay Adelaide Centre adds 1.16 msf. These buildings are approximately 73% leased, although a significant amount of space will be displaced as tenants relocate from existing buildings into these new locations.
Suburban markets have been hit much harder during this downturn�relative to the first year of the 2001 contraction�from an absorption perspective. One reason for this is the close connection that many suburban businesses have to the US markets.
OUTLOOK Demand is expected to remain weak in the foreseeable future as tenants continue to take the measures necessary to limit capital expenditures and cash outflow. Tenants who address occupancy decisions will be more likely to contract than expand, and to take advantage of early renewals to either negotiate more favourable leases or relocate into new buildings. Menkes� 680,000-square foot (sf) development located at 25 York Street in the Downtown south will open in the fourth quarter, with other smaller developments following in the coming quarters. These completions, along with the displacement of space resulting from the shifting of tenants from older to newer buildings, will result in high downtown vacancy rates for premium space in the next year. With over 2.1 msf of new development yet to be completed, vacancy will decrease only when existing businesses begin to expand and market conditions become more conducive to new business development.
BEAT ON THE STREET
�Tenants may be back on the street, addressing their occupancy decisions, but the likely outcome of those decisions will continue to be contractions for some time to come. With rental rates now shifting downward, the market is being perceived as much more of an opportunity � from a tenant perspective.�
- Paul Morse, Senior Managing Director, Office Leasing
ECONOMIC INDICATORS 2007 2008 2009F GDP Growth 2.3% 0.4% -2.3%
CPI Growth 1.8% 2.4% 0.2%
Unemployment 6.4% 6.2% 8.4% Employment Growth 1.5% 1.4% -1.7%
Source: TD Bank Financial � TD Economics Quarterly Economic Forecast
MARKET FORECAST
VACANCY will continued to rise based on projected space returning to market.
ABSORPTION will weaken below third quarter results over the next few quarters.
SUBLET SPACE will increase at a slower rate over the next few quarters.
OVERALL RENT VS. VACANCY
$10
$15
$20
$25
2005 2006 2007 2008 3Q09
psf/y
r
0%
3%
6%
9%
12%
15%
CBD-Rent Non-CBD-RentCBD-Vacancy Non-CBD-Vacancy
GREATER TORONTO AREA OFFICE REPORT
2
GTA OFFICE REPORT 3Q09
OVERALL GTA Vacancy All Classes
6,000
7,500
9,000
10,500
12,000
3Q08 4Q08 1Q09 2Q09 3Q09
(000
's o
f sf)
3.0%
4.0%
5.0%
6.0%
7.0%
8.0%
Vacancy SF Vacancy Rate
OVERALL GTA Leasing Activity All Classes
1,000
1,500
2,000
2,500
3,000
3,500
4,000
3Q08 4Q08 1Q09 2Q09 3Q09
(000
's o
f sf)
Leasing Activity
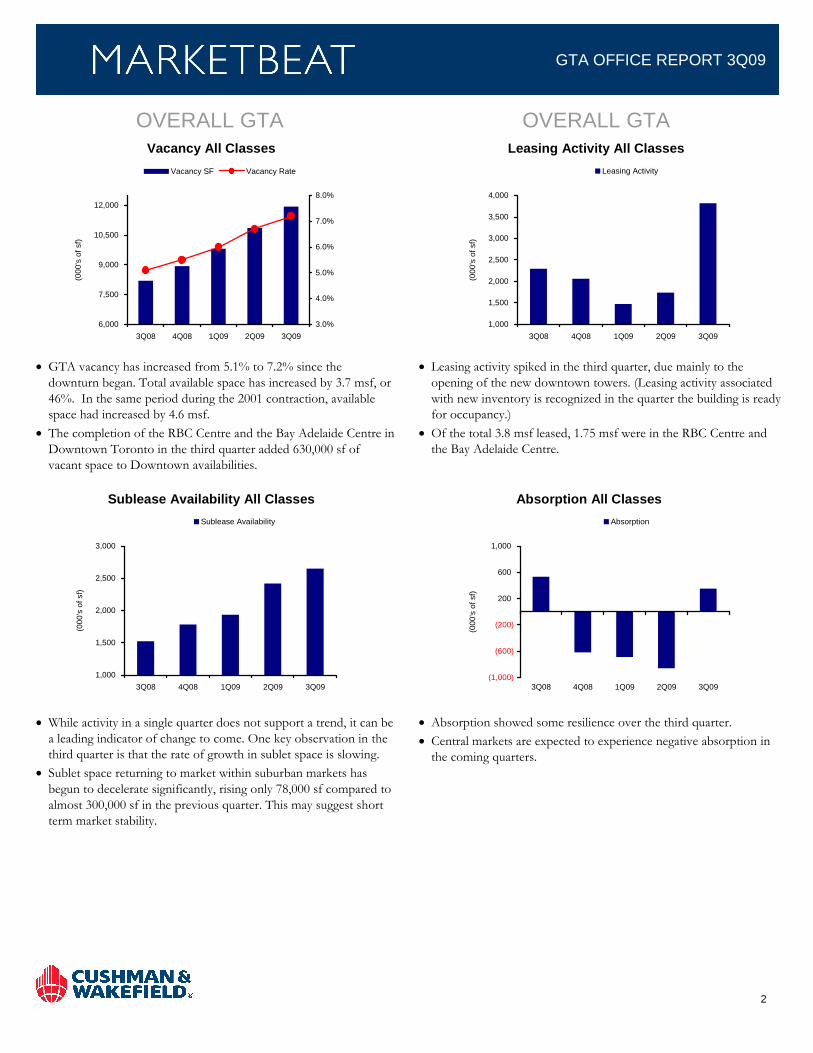
GTA vacancy has increased from 5.1% to 7.2% since the downturn began. Total available space has increased by 3.7 msf, or 46%. In the same period during the 2001 contraction, available space had increased by 4.6 msf.
The completion of the RBC Centre and the Bay Adelaide Centre in Downtown Toronto in the third quarter added 630,000 sf of vacant space to Downtown availabilities.
Leasing activity spiked in the third quarter, due mainly to the opening of the new downtown towers. (Leasing activity associated with new inventory is recognized in the quarter the building is ready for occupancy.)
Of the total 3.8 msf leased, 1.75 msf were in the RBC Centre and the Bay Adelaide Centre.
Sublease Availability All Classes
1,000
1,500
2,000
2,500
3,000
3Q08 4Q08 1Q09 2Q09 3Q09
(000
's o
f sf)
Sublease Availability
Absorption All Classes
(1,000)
(600)
(200)
200
600
1,000
3Q08 4Q08 1Q09 2Q09 3Q09
(000
's o
f sf)
Absorption
While activity in a single quarter does not support a trend, it can be a leading indicator of change to come. One key observation in the third quarter is that the rate of growth in sublet space is slowing.
Sublet space returning to market within suburban markets has begun to decelerate significantly, rising only 78,000 sf compared to almost 300,000 sf in the previous quarter. This may suggest short term market stability.
Absorption showed some resilience over the third quarter.
Central markets are expected to experience negative absorption in the coming quarters.

3
GTA OFFICE REPORT 3Q09
FINANCIAL CORE Vacancy All Classes
500
1,000
1,500
2,000
2,500
3Q08 4Q08 1Q09 2Q09 3Q09
(000
's o
f sf)
2.0%
3.0%
4.0%
5.0%
6.0%
7.0%
8.0%
Vacancy SF Vacancy Rate
Available space has increased by approximately 1 msf during the
past recessionary year. Of this increase, approximately 30% represents new available space introduced by the Bay Adelaide Centre.
As the remaining tenants relocate into the Bay Adelaide Centre, a significant amount of space will be displaced, driving the vacancy rate up significantly in the next few quarters.
Sublease Availability All Classes
200
300
400
500
600
3Q08 4Q08 1Q09 2Q09 3Q09
(000
's o
f sf)
Sublease Availability
Sublet space continued to rise over the quarter, coming to rest at
about 580,000 sf. A significant new sublet to market was 56,000 sf at 33 Yonge Street. This space was originally leased by EDS and comes to market six months after Hewlett Packard�s acquisition of EDS.
It is very possible more sublet availabilities will hit the market before total sublet space finds its peak.
FINANCIAL CORE Leasing Activity All Classes
300
450
600
750
900
1,050
1,200
1,350
3Q08 4Q08 1Q09 2Q09 3Q09
(000
's o
f sf)
Leasing Activity
Leasing activity relating to tenants relocating into the Bay Adelaide
Centre was recognized in the third quarter, as this development is now complete.
Tenants became more active, as competitive opportunities and realigned business strategies are enticing them back to the negotiating table.
The Laurentian Bank of Canada renewed and expanded at 130 Adelaide Street West, locking down some 90,000 sf for a 10-year term.
Absorption All Classes
(300)
(200)
(100)
0
100
200
3Q08 4Q08 1Q09 2Q09 3Q09
(000
's o
f sf)
Absorption
The most significant downward pressure on occupied space in the
third quarter was caused by a return of space resulting from the relocation of RBC staff into the new newly completed RBC Centre and the 56,000-sf EDS sublet at 33 Yonge Street.
During the 2001 downturn, over the 11-quarter down cycle, absorption in the financial core averaged negative 110,000 sf per quarter in premium space buildings. The market is now four quarters into this current recessionary cycle, and demand has been slightly stronger at an average of negative 68,000 sf per quarter.
4
GTA OFFICE REPORT 3Q09
DOWNTOWN FRINGE Vacancy All Classes
500
800
1,100
1,400
1,700
3Q08 4Q08 1Q09 2Q09 3Q09
(000
's o
f sf)
0.0%
1.0%
2.0%
3.0%
4.0%
5.0%
6.0%
Vacancy SF Vacancy Rate
DOWNTOWN FRINGE Leasing Activity All Classes
0
200
400
600
800
1,000
1,200
1,400
3Q08 4Q08 1Q09 2Q09 3Q09
(000
's o
f sf)
Leasing Activity
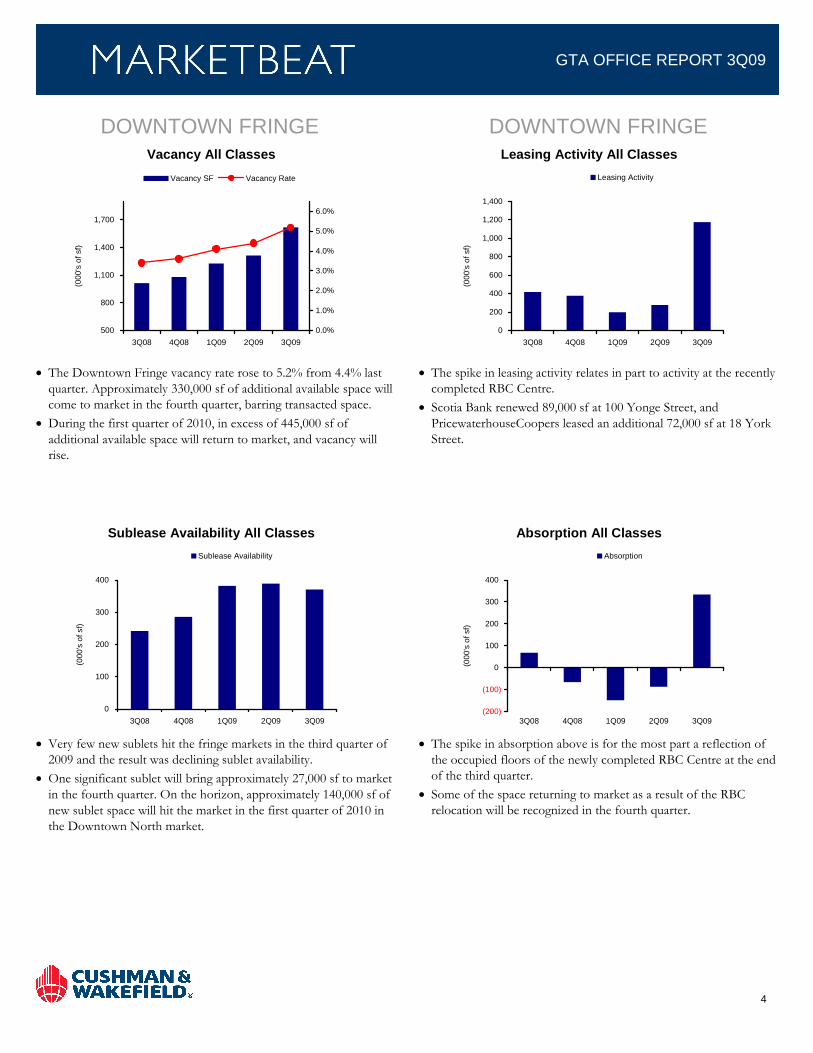
The Downtown Fringe vacancy rate rose to 5.2% from 4.4% last quarter. Approximately 330,000 sf of additional available space will come to market in the fourth quarter, barring transacted space.
During the first quarter of 2010, in excess of 445,000 sf of additional available space will return to market, and vacancy will rise.
The spike in leasing activity relates in part to activity at the recently completed RBC Centre.
Scotia Bank renewed 89,000 sf at 100 Yonge Street, and PricewaterhouseCoopers leased an additional 72,000 sf at 18 York Street.
Sublease Availability All Classes
0
100
200
300
400
3Q08 4Q08 1Q09 2Q09 3Q09
(000
's o
f sf)
Sublease Availability
Absorption All Classes
(200)
(100)
0
100
200
300
400
3Q08 4Q08 1Q09 2Q09 3Q09
(000
's o
f sf)
Absorption
Very few new sublets hit the fringe markets in the third quarter of
2009 and the result was declining sublet availability.
One significant sublet will bring approximately 27,000 sf to market in the fourth quarter. On the horizon, approximately 140,000 sf of new sublet space will hit the market in the first quarter of 2010 in the Downtown North market.
The spike in absorption above is for the most part a reflection of the occupied floors of the newly completed RBC Centre at the end of the third quarter.
Some of the space returning to market as a result of the RBC relocation will be recognized in the fourth quarter.
5
GTA OFFICE REPORT 3Q09
MIDTOWN Vacancy All Classes
0
200
400
600
800
1,000
1,200
1,400
3Q08 4Q08 1Q09 2Q09 3Q09
(000
's o
f sf)
2.0%
3.0%
4.0%
5.0%
6.0%
7.0%
8.0%
Vacancy SF Vacancy Rate
MIDTOWN Leasing Activity All Classes
0
50
100
150
200
250
3Q08 4Q08 1Q09 2Q09 3Q09
(000
's o
f sf)
Leasing Activity
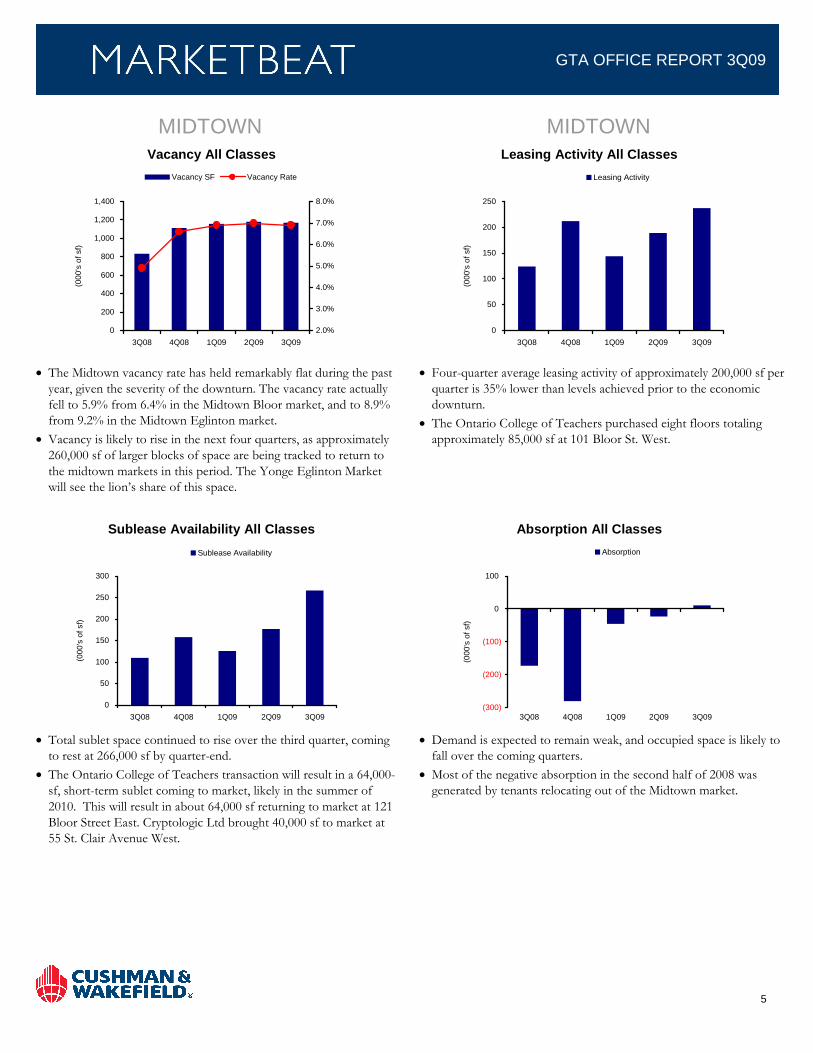
The Midtown vacancy rate has held remarkably flat during the past year, given the severity of the downturn. The vacancy rate actually fell to 5.9% from 6.4% in the Midtown Bloor market, and to 8.9% from 9.2% in the Midtown Eglinton market.
Vacancy is likely to rise in the next four quarters, as approximately 260,000 sf of larger blocks of space are being tracked to return to the midtown markets in this period. The Yonge Eglinton Market will see the lion�s share of this space.
Four-quarter average leasing activity of approximately 200,000 sf per quarter is 35% lower than levels achieved prior to the economic downturn.
The Ontario College of Teachers purchased eight floors totaling approximately 85,000 sf at 101 Bloor St. West.
Sublease Availability All Classes
0
50
100
150
200
250
300
3Q08 4Q08 1Q09 2Q09 3Q09
(000
's o
f sf)
Sublease Availability
Absorption All Classes
(300)
(200)
(100)
0
100
3Q08 4Q08 1Q09 2Q09 3Q09
(000
's o
f sf)
Absorption
Total sublet space continued to rise over the third quarter, coming
to rest at 266,000 sf by quarter-end.
The Ontario College of Teachers transaction will result in a 64,000-sf, short-term sublet coming to market, likely in the summer of 2010. This will result in about 64,000 sf returning to market at 121 Bloor Street East. Cryptologic Ltd brought 40,000 sf to market at 55 St. Clair Avenue West.
Demand is expected to remain weak, and occupied space is likely to fall over the coming quarters.
Most of the negative absorption in the second half of 2008 was generated by tenants relocating out of the Midtown market.
6
GTA OFFICE REPORT 3Q09
GTA EAST Vacancy All Classes
2,000
2,300
2,600
2,900
3,200
3Q08 4Q08 1Q09 2Q09 3Q09
(000
's o
f sf)
4.0%
6.0%
8.0%
10.0%
12.0%
Vacancy SF Vacancy Rate
GTA EAST Leasing Activity All Classes
0
200
400
600
800
3Q08 4Q08 1Q09 2Q09 3Q09
(000
's o
f sf)
Leasing Activity
Overall vacancy fell to 9.3% during the quarter, driven by leasing activity in class B space, which drove down vacancy in this asset class to 8.1% from 9.6% last quarter.
Approximately 400,000 sf in significant blocks will be returning to market, putting upward pressure on vacancy over the next four quarters.
Leasing activity is picking up in the GTA East, as evidenced by 470,000 sf completed in the third quarter.
Thales Canada Inc. leased approximately 195,000 sf at 105 Moatfield Drive and will occupy the majority of the building beginning in the second quarter of 2010. It is expected that they will displace some 165,000 sf at 1235 Ormont Drive.
Sublease Availability All Classes
0
100
200
300
400
500
600
3Q08 4Q08 1Q09 2Q09 3Q09
(000
's o
f sf)
Sublease Availability
Absorption All Classes
(300)
(200)
(100)
0
100
200
300
400
3Q08 4Q08 1Q09 2Q09 3Q09
(000
's o
f sf)
Absorption
It is expected that 30,000 sf of space displaced as a result of the
relocation of Global Credit and Collection will return to market in the second quarter of 2010.
Sublet availability is hitting its stride and will rise or fall based on transaction momentum in the quarters to come.
The completion of key transactions, some of which are highlighted above, helped push absorption into positive territory in the third quarter.
With a large amount of available space expected to return to market in the next three quarters, absorption is likely to shift back into negative territory, although there is a renewed strength in tenant activity in the GTA East.

7
GTA OFFICE REPORT 3Q09
GTA NORTH Vacancy All Classes
400
500
600
700
800
900
1,000
3Q08 4Q08 1Q09 2Q09 3Q09
(000
's o
f sf)
2.0%
3.0%
4.0%
5.0%
6.0%
7.0%
8.0%
Vacancy SF Vacancy Rate
GTA NORTH Leasing Activity All Classes
0
100
200
300
3Q08 4Q08 1Q09 2Q09 3Q09
(000
's o
f sf)
Leasing Activity
The GTA North vacancy rate remains very tight at 6.6%, up from 5.8% last quarter.
Approximately 170,000 sf in significant blocks of available space will return to market during the next two quarters, and this will continue to put upward pressure on vacancy.
Leasing activity of 142,000 sf this quarter indicates that the GTA North is not yet experiencing a significant improvement in tenant activity.
Chaitons LLP completed a 22,000-sf lease transaction at 5000 Yonge Street and will be relocating at the end of the first quarter of 2010.
Collective Point of Sale Solutions leased 14,200 sf at 4576 Yonge Street and will be taking occupancy during the first quarter of 2010.
Sublease Availability All Classes
0
100
200
300
400
3Q08 4Q08 1Q09 2Q09 3Q09
(000
's o
f sf)
Sublease Availability
Absorption All Classes
(100)
(50)
0
50
100
150
3Q08 4Q08 1Q09 2Q09 3Q09
(000
's o
f sf)
Absorption
Sublet space continued to rise in the third quarter, coming to rest
at 320,000 sf.
There is little on the horizon in terms of additional blocks of sublet space expected to return to market.
Absorption was negative 40,000 sf during the quarter, slightly above the four-quarter average of negative 53,000 sf.
Some smaller transactions were completed, but the amount of space returning to market outweighed the completed transactions in the third quarter.
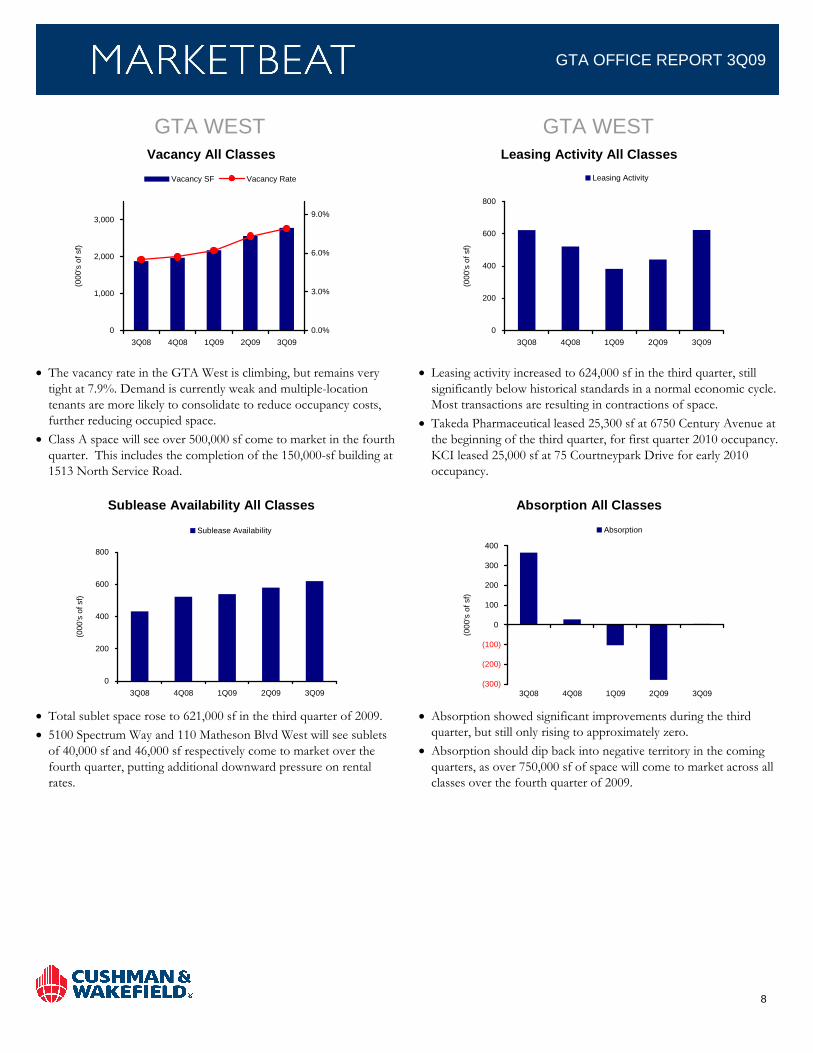
8
GTA OFFICE REPORT 3Q09
GTA WEST Vacancy All Classes
0
1,000
2,000
3,000
3Q08 4Q08 1Q09 2Q09 3Q09
(000
's o
f sf)
0.0%
3.0%
6.0%
9.0%
Vacancy SF Vacancy Rate
GTA WEST Leasing Activity All Classes
0
200
400
600
800
3Q08 4Q08 1Q09 2Q09 3Q09
(000
's o
f sf)
Leasing Activity
The vacancy rate in the GTA West is climbing, but remains very tight at 7.9%. Demand is currently weak and multiple-location tenants are more likely to consolidate to reduce occupancy costs, further reducing occupied space.
Class A space will see over 500,000 sf come to market in the fourth quarter. This includes the completion of the 150,000-sf building at 1513 North Service Road.
Leasing activity increased to 624,000 sf in the third quarter, still significantly below historical standards in a normal economic cycle. Most transactions are resulting in contractions of space.
Takeda Pharmaceutical leased 25,300 sf at 6750 Century Avenue at the beginning of the third quarter, for first quarter 2010 occupancy. KCI leased 25,000 sf at 75 Courtneypark Drive for early 2010 occupancy.
Sublease Availability All Classes
0
200
400
600
800
3Q08 4Q08 1Q09 2Q09 3Q09
(000
's o
f sf)
Sublease Availability
Absorption All Classes
(300)
(200)
(100)
0
100
200
300
400
3Q08 4Q08 1Q09 2Q09 3Q09
(000
's o
f sf)
Absorption
Total sublet space rose to 621,000 sf in the third quarter of 2009.
5100 Spectrum Way and 110 Matheson Blvd West will see sublets of 40,000 sf and 46,000 sf respectively come to market over the fourth quarter, putting additional downward pressure on rental rates.
Absorption showed significant improvements during the third quarter, but still only rising to approximately zero.
Absorption should dip back into negative territory in the coming quarters, as over 750,000 sf of space will come to market across all classes over the fourth quarter of 2009.

GTA OFFICE REPORT 3Q09
This report contains information available to the public and has been relied upon by Cushman & Wakefield Ltd. on the basis that it is accurate and complete. Cushman & Wakefield Ltd. accepts no responsibility if this should prove not to be the case. No warranty or representation, express or implied, is made to the accuracy or completeness of the information contained herein, and same is submitted subject to errors, omissions, change of price, rental or other conditions, withdrawal without notice, and to any special listing conditions imposed by our principals. ©2009 Cushman & Wakefield Ltd. All rights reserved.
For industry-leading intelligence to support your real estate and business decisions, go to Cushman & Wakefield�s Knowledge
Center at www.cushmanwakefield.com/knowledge Cushman & Wakefield Ltd. 33 Yonge Street Toronto, ON M5E 1S9 (416) 862-0611
MARKET/SUBMARKET STATISTICS Overall Direct YTD YTD YTD Direct Wtd. Avg.
No. of Vacancy Vacancy Leasing Under Construction Overall Class A Net
Market/Submarket Inventory Bldgs. Rate Rate Activity Construction Completions Absorption Rental Rate*
CENTRAL AREA 82,327,305 488 6.2% 4.7% 4,177,546 2,136,126 2,408,000 (521,350) $24.22
Downtown 65,503,862 353 6.0% 4.5% 3,606,850 2,136,126 2,408,000 (464,513) $25.34
Financial Core 34,359,930 116 6.7% 5.0% 1,954,398 0 1,159,000 (564,466) $27.93
Downtown Fringe 31,143,932 237 5.2% 4.0% 1,652,452 2,136,126 1,249,000 99,953 $20.31
Midtown 16,823,443 135 6.9% 5.3% 570,696 0 0 (56,837) $18.39
SUBURBAN AREA 83,321,038 850 8.2% 6.5% 2,860,786 980,940 752,769 (669,187) $15.54
GTA East 33,272,514 321 9.3% 7.8% 1,046,289 0 160,000 (150,853) $13.48
GTA North 14,738,070 131 6.6% 4.4% 367,532 57,330 162,538 (141,993) $17.52
GTA West 35,210,454 398 7.9% 6.1% 1,446,965 923,610 430,231 (376,341) $16.54
GTA Total 165,648,343 1,338 7.2% 5.6% 7,038,332 3,117,066 3,160,769 (1,190,537) $19.78 * Rental rates reflect $psq. ft./year
MARKET HIGHLIGHTS
SIGNIFICANT 3Q09 NEW LEASE TRANSACTIONS BUILDING SUBMARKET TENANT SQ FT BLDG CLASS
105 Moatfield Drive GTA East Thales Canada Inc. 195,000 B
100 Yonge Street Financial Core Bank of Nova Scotia 89,000 A 1790-1820-1830 Matheson Boulevard GTA West CCSI Technology Solutions Corp. 47,000 A
SIGNIFICANT 3Q09 SALE TRANSACTIONS BUILDING SUBMARKET BUYER SQ FT PURCHASE PRICE
101 Bloor Street West Midtown The Ontario College of Teachers 85,000 $28,700,000
SIGNIFICANT 3Q09 CONSTRUCTION COMPLETIONS BUILDING SUBMARKET MAJOR TENANT SQ FT COMPLETION DATE
333 Bay Street Financial Core KPMG Inc. 1,159,000 3Q 09
155 Wellington Street West Downtown Fringe RBC/RBC Dexia Investor Services 1,249,000 3Q 09
SIGNIFICANT PROJECTS UNDER CONSTRUCTION BUILDING SUBMARKET MAJOR TENANTS SQ FT COMPLETION DATE
25 York Street Downtown Fringe TELUS 780,000 4Q 09
125 Queen�s Quay East Downtown Fringe Corus Entertainment 476,000 4Q 09
1315 North Service Road GTA West Liuna 150,000 4Q 09
2465 Argentia Road GTA West Bank of Montreal 248,110 1Q 10
Aerocentre V (5550 Explorer Drive) GTA West (Pre-leasing) 227,000 2Q 10
15 York Street (Maple Leaf Square) Downtown Fringe (Pre-leasing) 208,000 2Q 10
18 York Street Downtown Fringe PricewaterhouseCoopers 657,000 3Q 11
Related Documents