Topsoil moisture patterns on arid hillsides – Micro-scale mapping by thermal infrared images I. Katra a , D.G. Blumberg b , H. Lavee a , P. Sarah a, * a Department of Geography and Environment, Bar-Ilan University, Ramat-Gan, Israel b Department of Geography and Environmental Development, Ben-Gurion University of the Negev, Israel Received 11 November 2005; received in revised form 10 October 2006; accepted 12 October 2006 KEYWORDS Hillside aspect; Micro-topography; Shrub; Sink area; Source area Summary In arid hillsides the topsoil moisture is a key factor in understanding environ- mental processes such as overland flow generation and soil–plant interactions. The reported research focused on the effects of hillside aspect and micro-topography on the spatial distribution of topsoil moisture on the shrub microenvironment scale, and on the diminution pattern of the moisture content after rain events. Data were acquired by close-range thermal infrared (TIR) imaging and processed with a model in which spatially consecutive TIR data are converted into soil moisture values and high-resolution maps. The results indicate a dynamic pattern of topsoil moisture in shrub microenvironments on arid hillsides. The pattern consists of a moist patch that is spatially associated with the shrub canopy projection. The changes in the spatial characteristics over time depend upon the micro-topography and the hillside aspect, north (N) or south (S). The main differ- ences are in the soil moisture content (N > S), its rates of change (S > N), the size of the moist patch relative to the shrub canopy projection (N > S), and in the displacement of the moist patch relative to the shrub canopy projection (downslope on N and upslope on S). The results may provide a better understanding of the time variation of surface water resources on the shrub scale, and also of surface water redistribution during rainfall. ª 2006 Elsevier B.V. All rights reserved. Introduction Arid areas are characterized by sparse shrubby vegetation patterns. These patterns consist of alternating areas of veg- etation and bare soil that differ in scale and shape, depend- ing on surface slope and rainfall (Rietkerk et al., 2002; Shnerb et al., 2003). Individual shrubs in such areas are known as ‘‘fertile patches’’ maintained by the concentra- tion of water and nutrients during water flows (Anderson and Hodgkinson, 1997). The shrubs are usually characterized by the presence of micro-relief in the form of a mound on their upslope margin, so the area under the shrub is a con- caved part of the hillside. These mounds are formed mainly 0022-1694/$ - see front matter ª 2006 Elsevier B.V. All rights reserved. doi:10.1016/j.jhydrol.2006.10.023 * Corresponding author. Tel.: +972 3 5318724; fax: +972 3 5344430. E-mail address: [email protected] (P. Sarah). Journal of Hydrology (2007) 334, 359– 367 available at www.sciencedirect.com journal homepage: www.elsevier.com/locate/jhydrol

Welcome message from author
This document is posted to help you gain knowledge. Please leave a comment to let me know what you think about it! Share it to your friends and learn new things together.
Transcript
Journal of Hydrology (2007) 334, 359–367
ava i lab le a t www.sc iencedi rec t . com
journal homepage: www.elsevier .com/ locate / jhydrol
Topsoil moisture patterns on arid hillsides –Micro-scale mapping by thermal infrared images
I. Katra a, D.G. Blumberg b, H. Lavee a, P. Sarah a,*
a Department of Geography and Environment, Bar-Ilan University, Ramat-Gan, Israelb Department of Geography and Environmental Development, Ben-Gurion University of the Negev, Israel
Received 11 November 2005; received in revised form 10 October 2006; accepted 12 October 2006
00do
*
53
KEYWORDSHillside aspect;Micro-topography;Shrub;Sink area;Source area
22-1694/$ - see front mattei:10.1016/j.jhydrol.2006.10
Corresponding author. T44430.E-mail address: pariens@m
r ª 200.023
el.: +972
ail.biu.a
Summary In arid hillsides the topsoil moisture is a key factor in understanding environ-mental processes such as overland flow generation and soil–plant interactions. Thereported research focused on the effects of hillside aspect and micro-topography on thespatial distribution of topsoil moisture on the shrub microenvironment scale, and onthe diminution pattern of the moisture content after rain events. Data were acquired byclose-range thermal infrared (TIR) imaging and processed with a model in which spatiallyconsecutive TIR data are converted into soil moisture values and high-resolution maps.The results indicate a dynamic pattern of topsoil moisture in shrub microenvironmentson arid hillsides. The pattern consists of a moist patch that is spatially associated withthe shrub canopy projection. The changes in the spatial characteristics over time dependupon the micro-topography and the hillside aspect, north (N) or south (S). The main differ-ences are in the soil moisture content (N > S), its rates of change (S > N), the size of themoist patch relative to the shrub canopy projection (N > S), and in the displacement ofthe moist patch relative to the shrub canopy projection (downslope on N and upslope onS). The results may provide a better understanding of the time variation of surface waterresources on the shrub scale, and also of surface water redistribution during rainfall.ª 2006 Elsevier B.V. All rights reserved.
Introduction
Arid areas are characterized by sparse shrubby vegetationpatterns. These patterns consist of alternating areas of veg-
6 Elsevier B.V. All rights reserved
3 5318724; fax: +972 3
c.il (P. Sarah).
etation and bare soil that differ in scale and shape, depend-ing on surface slope and rainfall (Rietkerk et al., 2002;Shnerb et al., 2003). Individual shrubs in such areas areknown as ‘‘fertile patches’’ maintained by the concentra-tion of water and nutrients during water flows (Andersonand Hodgkinson, 1997). The shrubs are usually characterizedby the presence of micro-relief in the form of a mound ontheir upslope margin, so the area under the shrub is a con-caved part of the hillside. These mounds are formed mainly
.
360 I. Katra et al.
of sediments and stones, and they affect the continuity ofoverland flow (Parsons et al., 1992; Sanchez and Puigdefab-regas, 1994). The favorable micro-climatic and micro-topo-graphical conditions that are established in thesemicroenvironments through biophysical feedback enhancethe pedo-hydrological properties of the soil beneath theshrub, so that the absorption of water is more efficientand the rate of water loss lower than those in the bare soilsurrounding it (Bergkamp et al., 1996; Bhark and Small,2003; Calvo-cases et al., 2003; Li and Sarah, 2003; Zwikel,2004; Boix-Fayos et al., 2005). Therefore, an arid hillsidecan be regarded as a mosaic of micro-scale source and sinkareas for overland flow, in which the bare soil, which ischaracterized by rapid generation of overland flow, func-tions as a source area, and the soil under the shrubs (a con-cave area) functions as a sink area for this water(Schlesinger et al., 1990; Anderson and Hodgkinson, 1997;Lavee et al., 1998; Bochet et al., 1999).
The water redistribution during rainfall and overlandflow affects the spatial distribution of the topsoil moisturecontent. Zaslavski and Sinai (1981) and Philip (1991) haveshowed, numerically and analytically, surface water redis-tribution in concave/convex topographies. Accordingly, lat-eral flow and moisture concentration in concave spotscontinue long after the rain has stopped (Zaslavski and Si-nai, 1981). Sarah (2002) found that on south-facing arid hill-sides radial and downslope gradients of soil moisture (i.e.the difference between water contents per unit distance)in the vicinity of a shrub persist for several days after rain-fall events. The radial gradient is characterized by decliningsoil moisture in all directions, from the shrub center to thebare soil; the downslope gradient is characterized by greatersoil moisture content in the bare soil upslope of the shrubthan in that downslope of the shrub.
The present paper deals with the effect of micro-topog-raphy and hillside aspect on the spatial distribution of top-soil moisture in the vicinity of a shrub, and on its decay inthe period from the end of a rain event until the soil isair-dry. In light of theoretical considerations, one may char-acterize the dynamics of the spatial distribution of soilmoisture over four main stages.
1. Prior to the onset of rain: the soil is in an air-dry stateover the entire shrub space (on the assumption thatthe previous rainfall event had occurred a relatively longtime previously).
2. From the onset of rainfall until the development ofoverland flow: a relatively high percentage of the rainis intercepted by the canopy and evaporates; a relatively
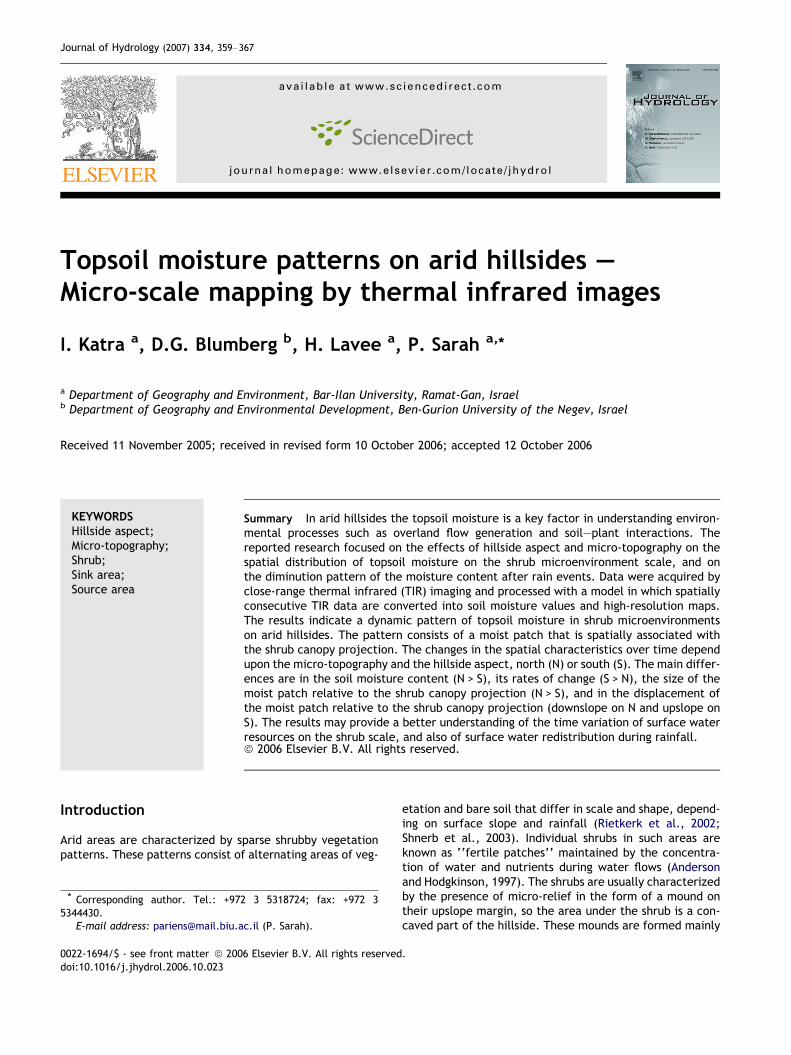
Figure 1 Characteristic sun’s rays angle (marked by dashed linesand north-facing (N) hillsides sloping at 15�. The gray areas repreprojections on the surface.
small proportion of it reaches the soil beneath the shrubas a result of throughfall and stemflow. In contrast, allthe rain reaches the bare soil between the shrubs. There-fore, at this stage, there is an increasing gradient of in-soil moisture from the soil under the shrub towards thebare soil.
3. From the onset until the termination of overland flow:the overland flow that develops on bare soil reachesthe shrub and is easily absorbed by the soil under it,because of the micro-topography (mound) and the rela-tively high infiltration rate under the shrub. Under thesecircumstances, there is a relatively rapid increase in soilmoisture under the shrub, and the spatial variations ofsoil moisture become smaller or negligible; it is even pos-sible that the soil moisture gradient will reverse, i.e.,the soil moisture content under the shrub will be greaterthan that of the bare soil.
4. At the end of the rainfall and overland flow: the loss ofwater from the soil under the shrub is relatively smallbecause of its better water-holding capacity and owingto the shadow effect. The result is that within a shorttime, the soil moisture gradient reverses itself, if it hasnot already done so.
A basic assumption of the present study is that the top-soil moisture gradients change continuously in the shrubmicroenvironment during the drying phase (stage 4), inaccordance with the eco-geomorphic characteristics (e.g.,type of shrub, soil properties, micro-topography). More-over, the characteristics of the gradients are affected bythe hillside aspect, because of variations in the amount ofsolar radiation received per unit area and the angle at whichthe sun’s rays reach the ground surface. In the middle lati-tudes of the northern hemisphere, this amount is smaller onthe north-facing hillsides than on the south-facing ones withsimilar slopes. These differences between the north andsouth aspects are expressed, for example, in differences be-tween: their soil water and temperature regimes, their soilproperties, and the types and spatial distributions of vege-tation (Kadmon et al., 1989; Kutiel et al., 1998; Shoshany,2002). In Fig. 1, one may see that as a result of the incomingradiation angle and the hillside slope and azimuth, the ex-pected differences between south- and north-facing hill-sides around midday are (1) the location of the shadedarea adjacent to the shrub is located upslope of the shrubin a south-facing location, and downslope of the shrub in anorth-facing location; and (2) the ratio between the amountof radiation reaching the back of the mound and that reach-ing the exposed areas surrounding the shrub is smaller than
) in the study area (32� at midday in March), in south-facing (S)sent the shrub mounds and the black lines indicate the shade
Topsoil moisture patterns on arid hillsides – Micro-scale mapping by thermal infrared images 361
1 on a south-facing hillside, and greater than 1 on a north-facing one. In light of these considerations, we assumedthat the aforementioned downslope gradient of topsoilmoisture on south-facing hillsides (Sarah, 2002) would be re-placed by upslope gradient on north-facing hillsides. Wealso assumed that the time variations of the gradients wouldalso be different.
The use of temporally and spatially consecutive data asan aid to the understanding the dynamic patch mosaic oftopsoil moisture during the first days after rainfall, whichis a crucial period of time in the hydrological cycle of aridareas, is an important area of hydrology, geomorphologyand ecology studies. The present paper demonstrates theuse of a high-resolution database that obtained by close-range thermal infrared (TIR) imaging, to analyze the behav-ior of the topsoil moisture on a shrub microenvironmentalscale. This may provide insight into micro-scale eco-geo-morphic processes and water redistribution on arid hillsides.
The central objectives were to: (1) compare the spatialdistributions of topsoil moisture in the vicinity of shrubson a south-facing hillside with that on a north-facing hillsidein an arid zone during the first days after rainfall, and untilthe soil became air-dry; and (2) analyze the rates of changebetween those days in those hillsides.
Study area
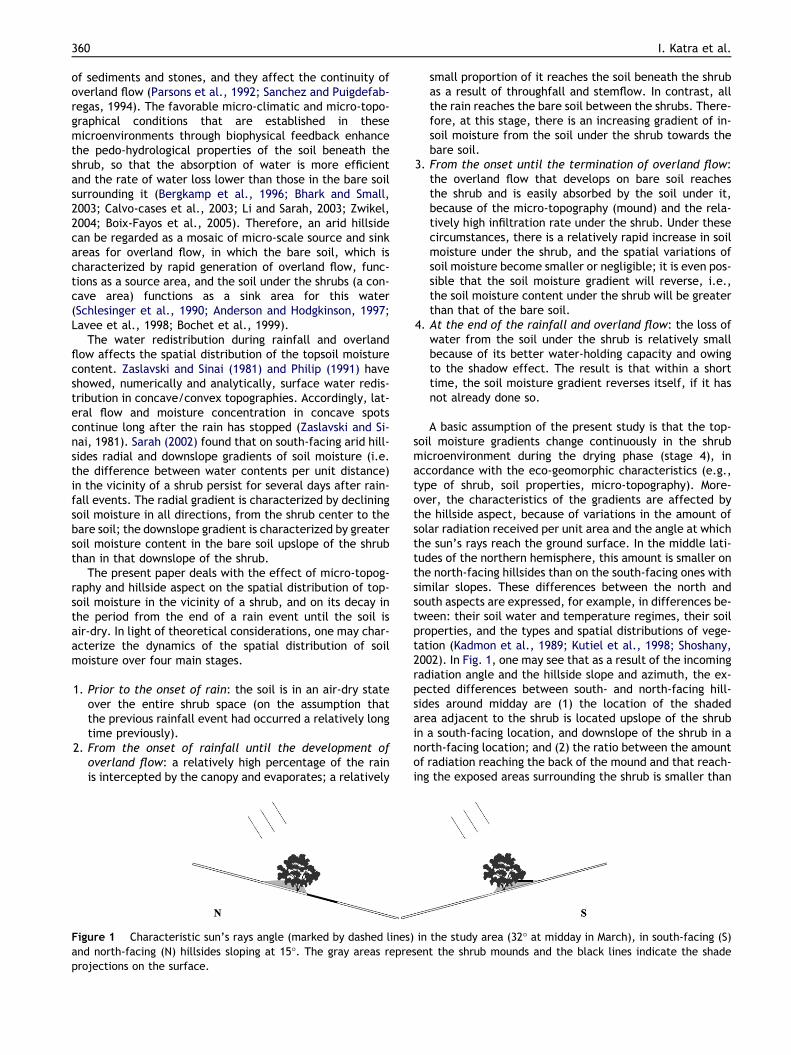
The research was conducted in a hilly arid area (30�78 0N,34�75 0E) in the Negev Desert, Israel (Fig. 2). The mean an-nual precipitation is 91 mm, most of which falls during thecold season (November–April). The mean annual air tem-perature is 19.0 �C. The mean annual relative humidity is57% and the potential evaporation is 7.8 mm d�1. The eleva-
Figure 2 A map of
tion of the study area is about 500 m above sea level and thelithology is hard calcareous. The soil is yellow loess lithosolwith sandy-loam texture (53% sand, 39% silt, 8% clay), 31.9%calcium carbonate and organic matter content of0.30 mol kg�1 (Zwikel, 2004). The hillsides are character-ized by extensive bare soil cover and sparse shrubby vegeta-tion. The shrub cover is about 6%, and the flora chorotype isMediterranean/Saharo-Arabian.
Materials and methods
Micro-plots
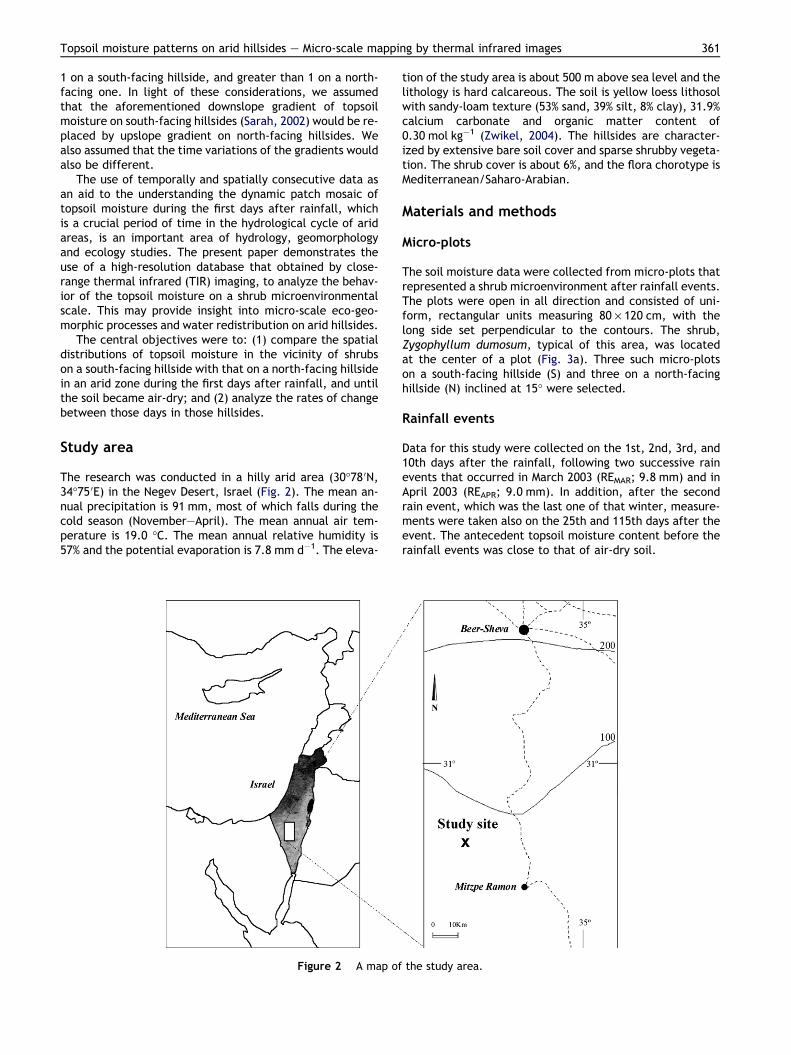
The soil moisture data were collected from micro-plots thatrepresented a shrub microenvironment after rainfall events.The plots were open in all direction and consisted of uni-form, rectangular units measuring 80 · 120 cm, with thelong side set perpendicular to the contours. The shrub,Zygophyllum dumosum, typical of this area, was locatedat the center of a plot (Fig. 3a). Three such micro-plotson a south-facing hillside (S) and three on a north-facinghillside (N) inclined at 15� were selected.
Rainfall events
Data for this study were collected on the 1st, 2nd, 3rd, and10th days after the rainfall, following two successive rainevents that occurred in March 2003 (REMAR; 9.8 mm) and inApril 2003 (REAPR; 9.0 mm). In addition, after the secondrain event, which was the last one of that winter, measure-ments were taken also on the 25th and 115th days after theevent. The antecedent topsoil moisture content before therainfall events was close to that of air-dry soil.
the study area.
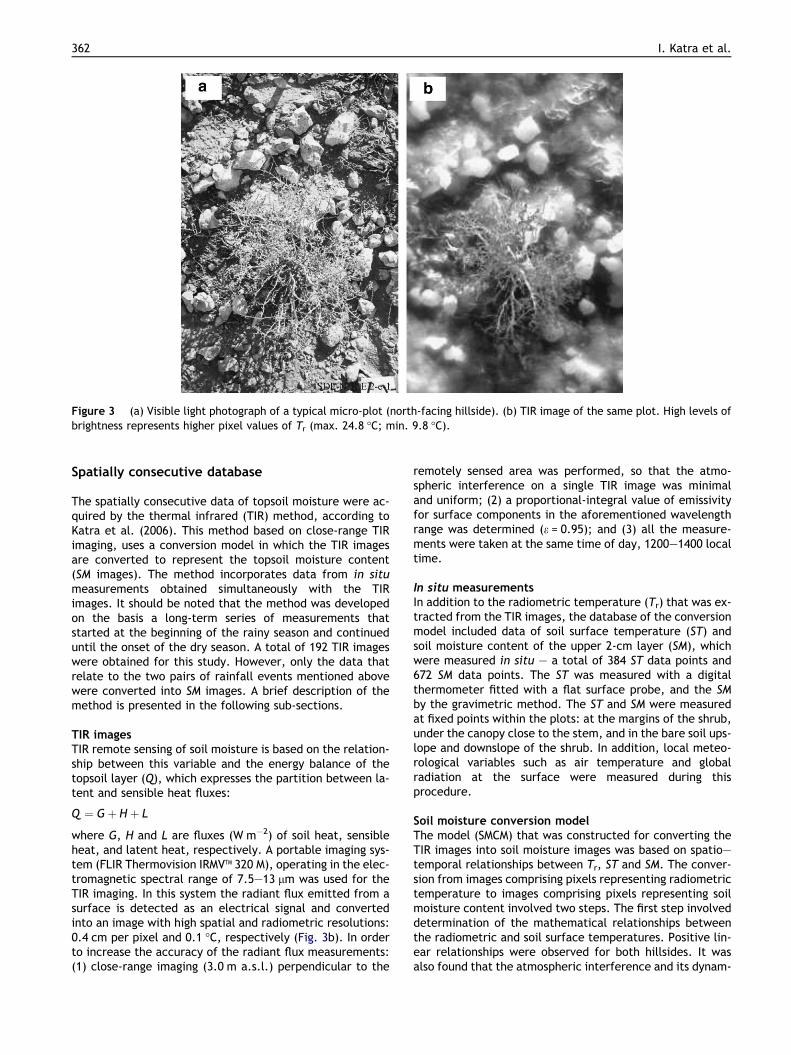
Figure 3 (a) Visible light photograph of a typical micro-plot (north-facing hillside). (b) TIR image of the same plot. High levels ofbrightness represents higher pixel values of Tr (max. 24.8 �C; min. 9.8 �C).
362 I. Katra et al.
Spatially consecutive database
The spatially consecutive data of topsoil moisture were ac-quired by the thermal infrared (TIR) method, according toKatra et al. (2006). This method based on close-range TIRimaging, uses a conversion model in which the TIR imagesare converted to represent the topsoil moisture content(SM images). The method incorporates data from in situmeasurements obtained simultaneously with the TIRimages. It should be noted that the method was developedon the basis a long-term series of measurements thatstarted at the beginning of the rainy season and continueduntil the onset of the dry season. A total of 192 TIR imageswere obtained for this study. However, only the data thatrelate to the two pairs of rainfall events mentioned abovewere converted into SM images. A brief description of themethod is presented in the following sub-sections.
TIR imagesTIR remote sensing of soil moisture is based on the relation-ship between this variable and the energy balance of thetopsoil layer (Q), which expresses the partition between la-tent and sensible heat fluxes:
Q ¼ Gþ H þ L
where G, H and L are fluxes (W m�2) of soil heat, sensibleheat, and latent heat, respectively. A portable imaging sys-tem (FLIR Thermovision IRMVTM 320 M), operating in the elec-tromagnetic spectral range of 7.5–13 lm was used for theTIR imaging. In this system the radiant flux emitted from asurface is detected as an electrical signal and convertedinto an image with high spatial and radiometric resolutions:0.4 cm per pixel and 0.1 �C, respectively (Fig. 3b). In orderto increase the accuracy of the radiant flux measurements:(1) close-range imaging (3.0 m a.s.l.) perpendicular to the
remotely sensed area was performed, so that the atmo-spheric interference on a single TIR image was minimaland uniform; (2) a proportional-integral value of emissivityfor surface components in the aforementioned wavelengthrange was determined (e = 0.95); and (3) all the measure-ments were taken at the same time of day, 1200–1400 localtime.
In situ measurementsIn addition to the radiometric temperature (Tr) that was ex-tracted from the TIR images, the database of the conversionmodel included data of soil surface temperature (ST) andsoil moisture content of the upper 2-cm layer (SM), whichwere measured in situ – a total of 384 ST data points and672 SM data points. The ST was measured with a digitalthermometer fitted with a flat surface probe, and the SMby the gravimetric method. The ST and SM were measuredat fixed points within the plots: at the margins of the shrub,under the canopy close to the stem, and in the bare soil ups-lope and downslope of the shrub. In addition, local meteo-rological variables such as air temperature and globalradiation at the surface were measured during thisprocedure.
Soil moisture conversion modelThe model (SMCM) that was constructed for converting theTIR images into soil moisture images was based on spatio–temporal relationships between Tr, ST and SM. The conver-sion from images comprising pixels representing radiometrictemperature to images comprising pixels representing soilmoisture content involved two steps. The first step involveddetermination of the mathematical relationships betweenthe radiometric and soil surface temperatures. Positive lin-ear relationships were observed for both hillsides. It wasalso found that the atmospheric interference and its dynam-
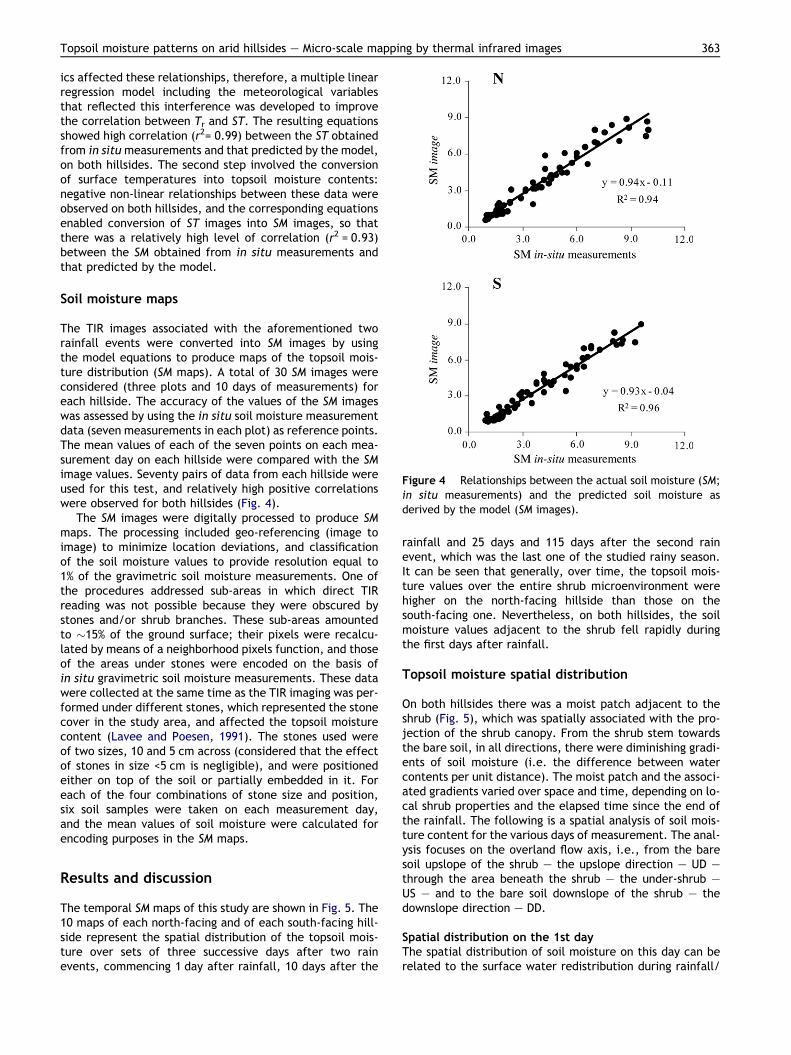
Figure 4 Relationships between the actual soil moisture (SM;in situ measurements) and the predicted soil moisture asderived by the model (SM images).
Topsoil moisture patterns on arid hillsides – Micro-scale mapping by thermal infrared images 363
ics affected these relationships, therefore, a multiple linearregression model including the meteorological variablesthat reflected this interference was developed to improvethe correlation between Tr and ST. The resulting equationsshowed high correlation (r2= 0.99) between the ST obtainedfrom in situmeasurements and that predicted by the model,on both hillsides. The second step involved the conversionof surface temperatures into topsoil moisture contents:negative non-linear relationships between these data wereobserved on both hillsides, and the corresponding equationsenabled conversion of ST images into SM images, so thatthere was a relatively high level of correlation (r2 = 0.93)between the SM obtained from in situ measurements andthat predicted by the model.
Soil moisture maps
The TIR images associated with the aforementioned tworainfall events were converted into SM images by usingthe model equations to produce maps of the topsoil mois-ture distribution (SM maps). A total of 30 SM images wereconsidered (three plots and 10 days of measurements) foreach hillside. The accuracy of the values of the SM imageswas assessed by using the in situ soil moisture measurementdata (seven measurements in each plot) as reference points.The mean values of each of the seven points on each mea-surement day on each hillside were compared with the SMimage values. Seventy pairs of data from each hillside wereused for this test, and relatively high positive correlationswere observed for both hillsides (Fig. 4).
The SM images were digitally processed to produce SMmaps. The processing included geo-referencing (image toimage) to minimize location deviations, and classificationof the soil moisture values to provide resolution equal to1% of the gravimetric soil moisture measurements. One ofthe procedures addressed sub-areas in which direct TIRreading was not possible because they were obscured bystones and/or shrub branches. These sub-areas amountedto �15% of the ground surface; their pixels were recalcu-lated by means of a neighborhood pixels function, and thoseof the areas under stones were encoded on the basis ofin situ gravimetric soil moisture measurements. These datawere collected at the same time as the TIR imaging was per-formed under different stones, which represented the stonecover in the study area, and affected the topsoil moisturecontent (Lavee and Poesen, 1991). The stones used wereof two sizes, 10 and 5 cm across (considered that the effectof stones in size <5 cm is negligible), and were positionedeither on top of the soil or partially embedded in it. Foreach of the four combinations of stone size and position,six soil samples were taken on each measurement day,and the mean values of soil moisture were calculated forencoding purposes in the SM maps.
Results and discussion
The temporal SM maps of this study are shown in Fig. 5. The10 maps of each north-facing and of each south-facing hill-side represent the spatial distribution of the topsoil mois-ture over sets of three successive days after two rainevents, commencing 1 day after rainfall, 10 days after the
rainfall and 25 days and 115 days after the second rainevent, which was the last one of the studied rainy season.It can be seen that generally, over time, the topsoil mois-ture values over the entire shrub microenvironment werehigher on the north-facing hillside than those on thesouth-facing one. Nevertheless, on both hillsides, the soilmoisture values adjacent to the shrub fell rapidly duringthe first days after rainfall.
Topsoil moisture spatial distribution
On both hillsides there was a moist patch adjacent to theshrub (Fig. 5), which was spatially associated with the pro-jection of the shrub canopy. From the shrub stem towardsthe bare soil, in all directions, there were diminishing gradi-ents of soil moisture (i.e. the difference between watercontents per unit distance). The moist patch and the associ-ated gradients varied over space and time, depending on lo-cal shrub properties and the elapsed time since the end ofthe rainfall. The following is a spatial analysis of soil mois-ture content for the various days of measurement. The anal-ysis focuses on the overland flow axis, i.e., from the baresoil upslope of the shrub – the upslope direction – UD –through the area beneath the shrub – the under-shrub –US – and to the bare soil downslope of the shrub – thedownslope direction – DD.
Spatial distribution on the 1st dayThe spatial distribution of soil moisture on this day can berelated to the surface water redistribution during rainfall/
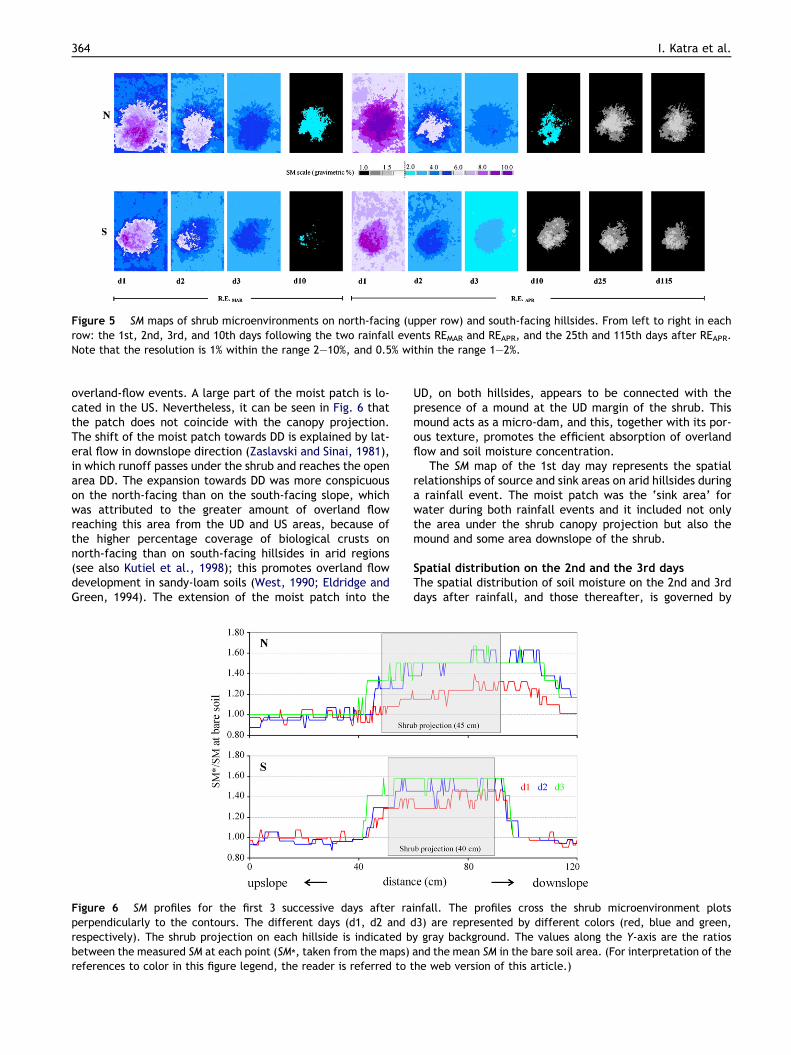
Figure 5 SM maps of shrub microenvironments on north-facing (upper row) and south-facing hillsides. From left to right in eachrow: the 1st, 2nd, 3rd, and 10th days following the two rainfall events REMAR and REAPR, and the 25th and 115th days after REAPR.Note that the resolution is 1% within the range 2–10%, and 0.5% within the range 1–2%.
364 I. Katra et al.
overland-flow events. A large part of the moist patch is lo-cated in the US. Nevertheless, it can be seen in Fig. 6 thatthe patch does not coincide with the canopy projection.The shift of the moist patch towards DD is explained by lat-eral flow in downslope direction (Zaslavski and Sinai, 1981),in which runoff passes under the shrub and reaches the openarea DD. The expansion towards DD was more conspicuouson the north-facing than on the south-facing slope, whichwas attributed to the greater amount of overland flowreaching this area from the UD and US areas, because ofthe higher percentage coverage of biological crusts onnorth-facing than on south-facing hillsides in arid regions(see also Kutiel et al., 1998); this promotes overland flowdevelopment in sandy-loam soils (West, 1990; Eldridge andGreen, 1994). The extension of the moist patch into the
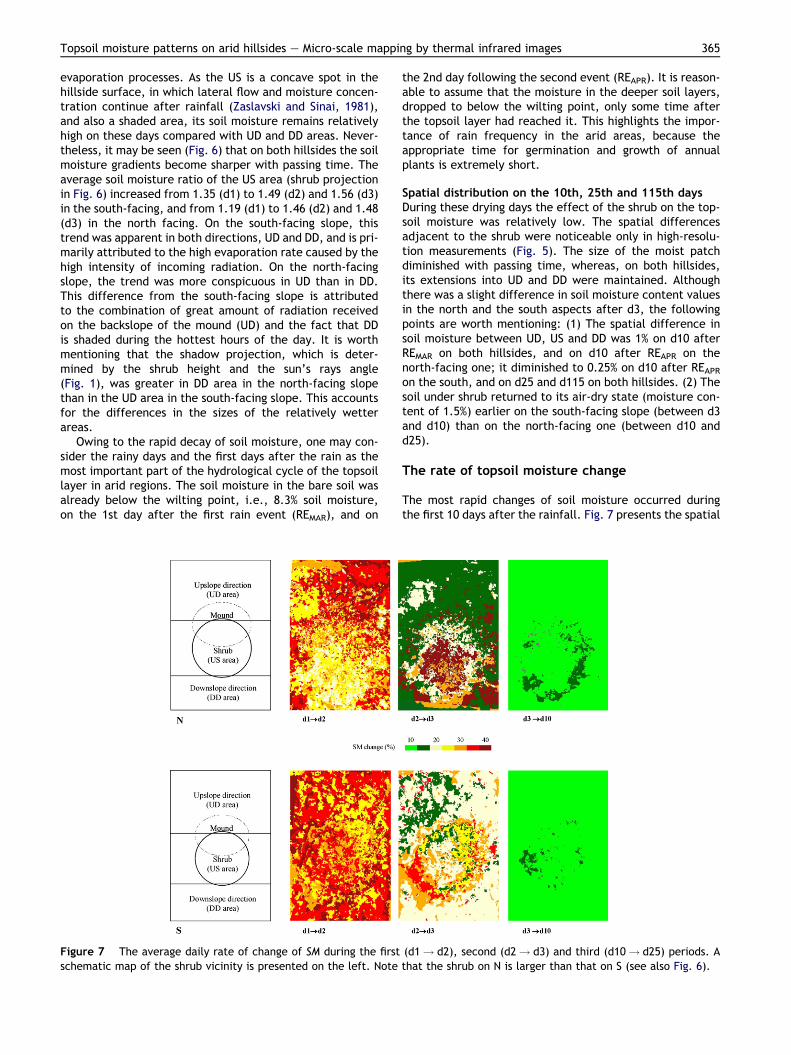
Figure 6 SM profiles for the first 3 successive days after raperpendicularly to the contours. The different days (d1, d2 andrespectively). The shrub projection on each hillside is indicated bbetween the measured SM at each point (SM*, taken from the maps)references to color in this figure legend, the reader is referred to
UD, on both hillsides, appears to be connected with thepresence of a mound at the UD margin of the shrub. Thismound acts as a micro-dam, and this, together with its por-ous texture, promotes the efficient absorption of overlandflow and soil moisture concentration.
The SM map of the 1st day may represents the spatialrelationships of source and sink areas on arid hillsides duringa rainfall event. The moist patch was the ‘sink area’ forwater during both rainfall events and it included not onlythe area under the shrub canopy projection but also themound and some area downslope of the shrub.
Spatial distribution on the 2nd and the 3rd daysThe spatial distribution of soil moisture on the 2nd and 3rddays after rainfall, and those thereafter, is governed by
infall. The profiles cross the shrub microenvironment plotsd3) are represented by different colors (red, blue and green,y gray background. The values along the Y-axis are the ratiosand the mean SM in the bare soil area. (For interpretation of thethe web version of this article.)
Topsoil moisture patterns on arid hillsides – Micro-scale mapping by thermal infrared images 365
evaporation processes. As the US is a concave spot in thehillside surface, in which lateral flow and moisture concen-tration continue after rainfall (Zaslavski and Sinai, 1981),and also a shaded area, its soil moisture remains relativelyhigh on these days compared with UD and DD areas. Never-theless, it may be seen (Fig. 6) that on both hillsides the soilmoisture gradients become sharper with passing time. Theaverage soil moisture ratio of the US area (shrub projectionin Fig. 6) increased from 1.35 (d1) to 1.49 (d2) and 1.56 (d3)in the south-facing, and from 1.19 (d1) to 1.46 (d2) and 1.48(d3) in the north facing. On the south-facing slope, thistrend was apparent in both directions, UD and DD, and is pri-marily attributed to the high evaporation rate caused by thehigh intensity of incoming radiation. On the north-facingslope, the trend was more conspicuous in UD than in DD.This difference from the south-facing slope is attributedto the combination of great amount of radiation receivedon the backslope of the mound (UD) and the fact that DDis shaded during the hottest hours of the day. It is worthmentioning that the shadow projection, which is deter-mined by the shrub height and the sun’s rays angle(Fig. 1), was greater in DD area in the north-facing slopethan in the UD area in the south-facing slope. This accountsfor the differences in the sizes of the relatively wetterareas.
Owing to the rapid decay of soil moisture, one may con-sider the rainy days and the first days after the rain as themost important part of the hydrological cycle of the topsoillayer in arid regions. The soil moisture in the bare soil wasalready below the wilting point, i.e., 8.3% soil moisture,on the 1st day after the first rain event (REMAR), and on
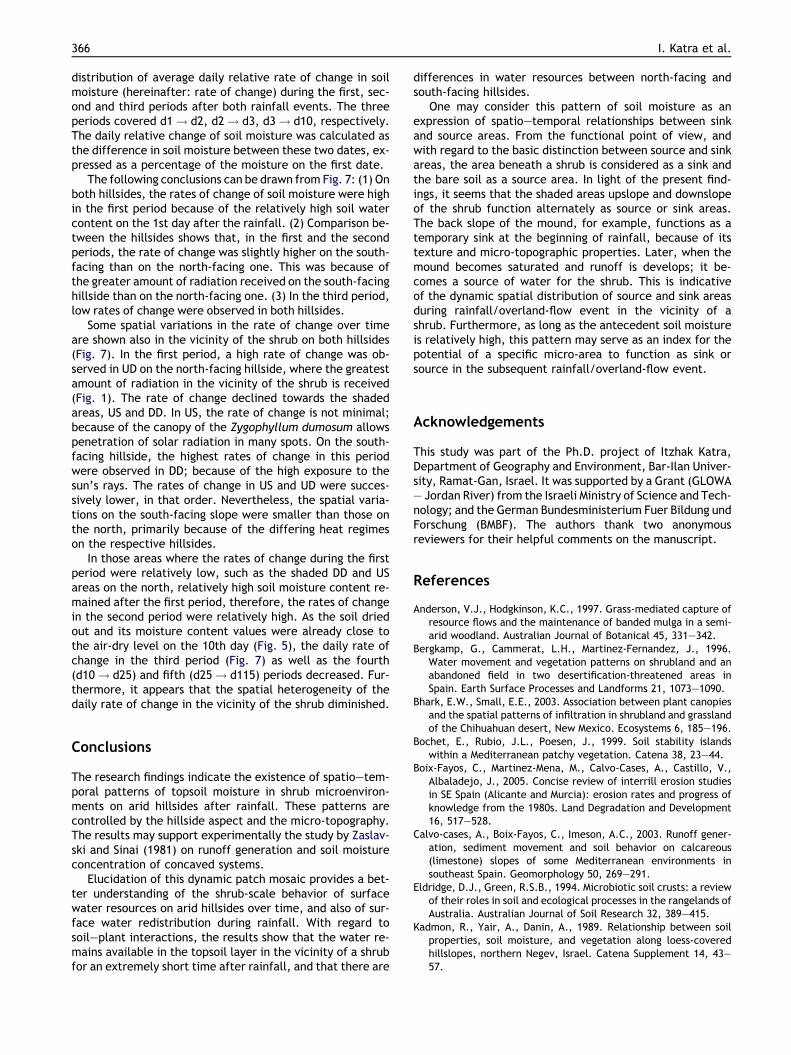
Figure 7 The average daily rate of change of SM during the firstschematic map of the shrub vicinity is presented on the left. Note
the 2nd day following the second event (REAPR). It is reason-able to assume that the moisture in the deeper soil layers,dropped to below the wilting point, only some time afterthe topsoil layer had reached it. This highlights the impor-tance of rain frequency in the arid areas, because theappropriate time for germination and growth of annualplants is extremely short.
Spatial distribution on the 10th, 25th and 115th daysDuring these drying days the effect of the shrub on the top-soil moisture was relatively low. The spatial differencesadjacent to the shrub were noticeable only in high-resolu-tion measurements (Fig. 5). The size of the moist patchdiminished with passing time, whereas, on both hillsides,its extensions into UD and DD were maintained. Althoughthere was a slight difference in soil moisture content valuesin the north and the south aspects after d3, the followingpoints are worth mentioning: (1) The spatial difference insoil moisture between UD, US and DD was 1% on d10 afterREMAR on both hillsides, and on d10 after REAPR on thenorth-facing one; it diminished to 0.25% on d10 after REAPRon the south, and on d25 and d115 on both hillsides. (2) Thesoil under shrub returned to its air-dry state (moisture con-tent of 1.5%) earlier on the south-facing slope (between d3and d10) than on the north-facing one (between d10 andd25).
The rate of topsoil moisture change
The most rapid changes of soil moisture occurred duringthe first 10 days after the rainfall. Fig. 7 presents the spatial
(d1! d2), second (d2! d3) and third (d10! d25) periods. Athat the shrub on N is larger than that on S (see also Fig. 6).
366 I. Katra et al.
distribution of average daily relative rate of change in soilmoisture (hereinafter: rate of change) during the first, sec-ond and third periods after both rainfall events. The threeperiods covered d1! d2, d2! d3, d3! d10, respectively.The daily relative change of soil moisture was calculated asthe difference in soil moisture between these two dates, ex-pressed as a percentage of the moisture on the first date.
The following conclusions can be drawn from Fig. 7: (1) Onboth hillsides, the rates of change of soil moisture were highin the first period because of the relatively high soil watercontent on the 1st day after the rainfall. (2) Comparison be-tween the hillsides shows that, in the first and the secondperiods, the rate of change was slightly higher on the south-facing than on the north-facing one. This was because ofthe greater amount of radiation received on the south-facinghillside than on the north-facing one. (3) In the third period,low rates of change were observed in both hillsides.
Some spatial variations in the rate of change over timeare shown also in the vicinity of the shrub on both hillsides(Fig. 7). In the first period, a high rate of change was ob-served in UD on the north-facing hillside, where the greatestamount of radiation in the vicinity of the shrub is received(Fig. 1). The rate of change declined towards the shadedareas, US and DD. In US, the rate of change is not minimal;because of the canopy of the Zygophyllum dumosum allowspenetration of solar radiation in many spots. On the south-facing hillside, the highest rates of change in this periodwere observed in DD; because of the high exposure to thesun’s rays. The rates of change in US and UD were succes-sively lower, in that order. Nevertheless, the spatial varia-tions on the south-facing slope were smaller than those onthe north, primarily because of the differing heat regimeson the respective hillsides.
In those areas where the rates of change during the firstperiod were relatively low, such as the shaded DD and USareas on the north, relatively high soil moisture content re-mained after the first period, therefore, the rates of changein the second period were relatively high. As the soil driedout and its moisture content values were already close tothe air-dry level on the 10th day (Fig. 5), the daily rate ofchange in the third period (Fig. 7) as well as the fourth(d10! d25) and fifth (d25! d115) periods decreased. Fur-thermore, it appears that the spatial heterogeneity of thedaily rate of change in the vicinity of the shrub diminished.
Conclusions
The research findings indicate the existence of spatio–tem-poral patterns of topsoil moisture in shrub microenviron-ments on arid hillsides after rainfall. These patterns arecontrolled by the hillside aspect and the micro-topography.The results may support experimentally the study by Zaslav-ski and Sinai (1981) on runoff generation and soil moistureconcentration of concaved systems.
Elucidation of this dynamic patch mosaic provides a bet-ter understanding of the shrub-scale behavior of surfacewater resources on arid hillsides over time, and also of sur-face water redistribution during rainfall. With regard tosoil–plant interactions, the results show that the water re-mains available in the topsoil layer in the vicinity of a shrubfor an extremely short time after rainfall, and that there are
differences in water resources between north-facing andsouth-facing hillsides.
One may consider this pattern of soil moisture as anexpression of spatio–temporal relationships between sinkand source areas. From the functional point of view, andwith regard to the basic distinction between source and sinkareas, the area beneath a shrub is considered as a sink andthe bare soil as a source area. In light of the present find-ings, it seems that the shaded areas upslope and downslopeof the shrub function alternately as source or sink areas.The back slope of the mound, for example, functions as atemporary sink at the beginning of rainfall, because of itstexture and micro-topographic properties. Later, when themound becomes saturated and runoff is develops; it be-comes a source of water for the shrub. This is indicativeof the dynamic spatial distribution of source and sink areasduring rainfall/overland-flow event in the vicinity of ashrub. Furthermore, as long as the antecedent soil moistureis relatively high, this pattern may serve as an index for thepotential of a specific micro-area to function as sink orsource in the subsequent rainfall/overland-flow event.
Acknowledgements
This study was part of the Ph.D. project of Itzhak Katra,Department of Geography and Environment, Bar-Ilan Univer-sity, Ramat-Gan, Israel. It was supported by a Grant (GLOWA– Jordan River) from the Israeli Ministry of Science and Tech-nology; and the German Bundesministerium Fuer Bildung undForschung (BMBF). The authors thank two anonymousreviewers for their helpful comments on the manuscript.
References
Anderson, V.J., Hodgkinson, K.C., 1997. Grass-mediated capture ofresource flows and the maintenance of banded mulga in a semi-arid woodland. Australian Journal of Botanical 45, 331–342.
Bergkamp, G., Cammerat, L.H., Martinez-Fernandez, J., 1996.Water movement and vegetation patterns on shrubland and anabandoned field in two desertification-threatened areas inSpain. Earth Surface Processes and Landforms 21, 1073–1090.
Bhark, E.W., Small, E.E., 2003. Association between plant canopiesand the spatial patterns of infiltration in shrubland and grasslandof the Chihuahuan desert, New Mexico. Ecosystems 6, 185–196.
Bochet, E., Rubio, J.L., Poesen, J., 1999. Soil stability islandswithin a Mediterranean patchy vegetation. Catena 38, 23–44.
Boix-Fayos, C., Martinez-Mena, M., Calvo-Cases, A., Castillo, V.,Albaladejo, J., 2005. Concise review of interrill erosion studiesin SE Spain (Alicante and Murcia): erosion rates and progress ofknowledge from the 1980s. Land Degradation and Development16, 517–528.
Calvo-cases, A., Boix-Fayos, C., Imeson, A.C., 2003. Runoff gener-ation, sediment movement and soil behavior on calcareous(limestone) slopes of some Mediterranean environments insoutheast Spain. Geomorphology 50, 269–291.
Eldridge, D.J., Green, R.S.B., 1994. Microbiotic soil crusts: a reviewof their roles in soil and ecological processes in the rangelands ofAustralia. Australian Journal of Soil Research 32, 389–415.
Kadmon, R., Yair, A., Danin, A., 1989. Relationship between soilproperties, soil moisture, and vegetation along loess-coveredhillslopes, northern Negev, Israel. Catena Supplement 14, 43–57.

Topsoil moisture patterns on arid hillsides – Micro-scale mapping by thermal infrared images 367
Katra, I., Blumberg, D.G., Lavee, H., Sarah, P., 2006. A method forestimating the spatial distribution of soil moisture of aridmicroenvironments by close range thermal infrared imaging.International Journal of Remote Sensing 27, 2599–2611.
Kutiel, P., Lavee, H., Ackermann, O., 1998. Spatial distribution ofsoil surface coverage on north and south hillslopes along aMediterranean to extreme arid climatic gradient. Geomorphol-ogy 23, 245–256.
Lavee, H., Poesen, J., 1991. Overland flow generation and conti-nuity on stone-cover soil surfaces. Hydrological Processes 5,345–360.
Lavee, H., Imeson, A.C., Pariente, S., 1998. The impact of climatechange on geomorphology and desertification along a Mediter-ranean-arid transect. Land Degradation and Development 9,407–422.
Li, X., Sarah, P., 2003. Arylsulfatase activity of soil microbialbiomass along a Mediterranean-arid transect. Soil Biology &Biochemistry 35, 925–934.
Parsons, A.J., Abrahams, A.D., Simanton, J.R., 1992. Microtopog-raphy and soil-surface materials on semi-arid piedmont hills-lopes, southern Arizona. Journal of Arid Environments 22, 107–115.
Philip, J.R., 1991. Infiltration and downslope unsaturated flows inconcave and convex topographies. Water Resources Research27, 1041–1048.
Rietkerk, M., Boerlijst, M.C., van Langevelde, F., HilleRisLambers,R., van de Koppel, J., Kumar, L., Prins, H.H.T., de Roos, A.M.,
2002. Self-organization of vegetation in arid ecosystems. TheAmerican Naturalist 160, 524–530.
Sanchez, G., Puigdefabregas, J., 1994. Interactions of plant growthand sediment movement on slopes in semi-arid environment.Geomorphology 9, 243–260.
Sarah, P., 2002. Spatial patterns of soil moisture as affected byshrubs, in different climatic conditions. Environmental Monitor-ing and Assessment 73, 237–251.
Schlesinger, W.H., Fonteyn, P.J., Marion, G.M., Reiners, W.A.,1990. Biological feedbacks in global desertification. Science 247,1043–1048.
Shoshany, M., 2002. Landscape fragmentation and soil coverchanges on south-and north-facing slopes during ecosystemsrecovery: an analysis from multi-date air photographs. Geomor-phology 45, 3–20.
Shnerb, N.M., Sarah, P., Lavee, H., Solomon, S., 2003. Reactiveglass and vegetation patterns. Physical Review Letters 90,0381011–0381014.
West, N.E., 1990. Microphytic soil crust. Advances in EcologicalResearch 20, 179–223.
Zaslavski, D., Sinai, G., 1981. Surface hydrology: III – causes oflateral flow. ASCE Journal of Hydraulics Division 107, 37–52.
Zwikel, S., 2004. Spatial Patterns of Soil Properties, Which AffectWater Regime (Rainfall–overland Flow Relationships) in Eco-geomorphic Systems along a Climatic Transect, from the NegevHighland to the Galilee Mountains. Ph.D. Thesis, Bar-IlanUniversity, Ramat-Gan, Israel (in Hebrew).
Related Documents