Topologies of innovation networks in knowledge-intensive sectors: Sectoral differences in the access to knowledge and complementary assets through formal and informal ties Isabel Salavisa a,n , Cristina Sousa a , Margarida Fontes b a Instituto Universita ´rio de Lisboa (ISCTE-IUL), DIN ˆ AMIA’CET-IUL, Ed. ISCTE, Av. Forcas Armadas, 1649-026 Lisboa, Portugal b LNEG – Laborato ´rio Nacional de Engenharia e Geologia and DIN ˆ AMIA’CET-IUL, Estrada do Pac - o do Lumiar, 1649-038 Lisboa, Portugal article info Available online 12 April 2012 Keywords: Innovation network Social network Formal network Informal network Knowledge-intensive sector Biotechnology Software abstract This paper contributes to a better understanding of the sources of networking variety in knowledge- intensive sectors, focusing on molecular biotechnology and software for telecommunications. These sectors differ in the nature of the knowledge exploited and in the organisation of the innovation processes. Our argument is that the sectoral differences affect the type, the sources and the modes of access to resources necessary for innovation and therefore firms’ networking behaviour. The empirical research was based on extensive interviews with the entrepreneurs of 46 young firms of the two sectors in Portugal, complemented with documentary data. Networks were reconstructed and social network analysis was applied, distinguishing between the formal and informal relationships established to access both knowledge and complementary assets. The results show differences in the topology of networks within and across sectors, providing support to our argument. The differences become particularly evident regarding: (i) the formal access to complementary assets, reflecting distinct dynamics of the environment where firms pursue their activities; (ii) the informal access to knowledge, associated with differences in knowledge bases. The comparative approach permitted to obtain a more comprehensive picture of firms’ networking activities and a deeper understanding of the mechanisms behind the distinct sectoral network topologies. & 2012 Elsevier Ltd. All rights reserved. 0. Introduction The objective of this paper is to address the potential hetero- geneity in the architecture of the networks built by entrepreneurial firms to access the resources necessary for innovation in two distinct knowledge-intensive sectors – biotechnology and software. Networks are generally presented in the literature as critical to the innovation process in knowledge-intensive sectors; this is particularly so in young small firms operating in these sectors, given the added difficulties these firms experience in accessing the range of resources necessary for innovation due to their youth (liabilities of newness) and size (need to search externally for a substantial proportion of the resources required). However, there is little discussion on the potential variety in the actual functions played by networks for resource access in different knowledge- intensive sectors, which will lead to distinct network building strategies and thus to diverse network configurations (topologies). Empirical research contrasting networking behaviour in dif- ferent knowledge intensive-sectors is relatively scarce; and is not concerned with the systematic search for diversity in the sectoral networks and the reasons underlying that diversity. Studies that address network characteristics usually focus on a single specific sector, or consider technology-intensive firms generally, combin- ing firms from several sectors. The latter studies offer insights into aspects of networking behaviour that are likely to be common to technology-intensive companies, but overlook variety and its sectoral causes. However, knowledge-intensive sectors are by no means homogeneous in their process of innovation and therefore it is important to understand how this heterogeneity influences the architecture of the innovation networks built by the firms. The main objective of this research is precisely to address this gap, contributing to an understanding of the sources of network- ing variety in knowledge-intensive sectors. For this purpose we address two knowledge-intensive sectors – biotechnology and software – where young entrepreneurial firms play an important Contents lists available at SciVerse ScienceDirect journal homepage: www.elsevier.com/locate/technovation Technovation 0166-4972/$ - see front matter & 2012 Elsevier Ltd. All rights reserved. doi:10.1016/j.technovation.2012.02.003 n Corresponding author. Tel.: þ351 217 938 638; fax: þ351 217 940 042. E-mail addresses: [email protected] (I. Salavisa), [email protected] (C. Sousa), [email protected] (M. Fontes). Technovation 32 (2012) 380–399

Welcome message from author
This document is posted to help you gain knowledge. Please leave a comment to let me know what you think about it! Share it to your friends and learn new things together.
Transcript
Technovation 32 (2012) 380–399
Contents lists available at SciVerse ScienceDirect
Technovation
0166-49
doi:10.1
n Corr
E-m
cristina
journal homepage: www.elsevier.com/locate/technovation
Topologies of innovation networks in knowledge-intensive sectors: Sectoraldifferences in the access to knowledge and complementary assets throughformal and informal ties
Isabel Salavisa a,n, Cristina Sousa a, Margarida Fontes b
a Instituto Universitario de Lisboa (ISCTE-IUL), DINAMIA’CET-IUL, Ed. ISCTE, Av. Forcas Armadas, 1649-026 Lisboa, Portugalb LNEG – Laboratorio Nacional de Engenharia e Geologia and DINAMIA’CET-IUL, Estrada do Pac-o do Lumiar, 1649-038 Lisboa, Portugal
a r t i c l e i n f o
Available online 12 April 2012
Keywords:
Innovation network
Social network
Formal network
Informal network
Knowledge-intensive sector
Biotechnology
Software
72/$ - see front matter & 2012 Elsevier Ltd. A
016/j.technovation.2012.02.003
esponding author. Tel.: þ351 217 938 638; f
ail addresses: [email protected] (I. Salav
[email protected] (C. Sousa), margarida.fontes@
a b s t r a c t
This paper contributes to a better understanding of the sources of networking variety in knowledge-
intensive sectors, focusing on molecular biotechnology and software for telecommunications. These
sectors differ in the nature of the knowledge exploited and in the organisation of the innovation
processes. Our argument is that the sectoral differences affect the type, the sources and the modes of
access to resources necessary for innovation and therefore firms’ networking behaviour.
The empirical research was based on extensive interviews with the entrepreneurs of 46 young firms
of the two sectors in Portugal, complemented with documentary data. Networks were reconstructed
and social network analysis was applied, distinguishing between the formal and informal relationships
established to access both knowledge and complementary assets.
The results show differences in the topology of networks within and across sectors, providing
support to our argument. The differences become particularly evident regarding: (i) the formal access
to complementary assets, reflecting distinct dynamics of the environment where firms pursue their
activities; (ii) the informal access to knowledge, associated with differences in knowledge bases. The
comparative approach permitted to obtain a more comprehensive picture of firms’ networking
activities and a deeper understanding of the mechanisms behind the distinct sectoral network
topologies.
& 2012 Elsevier Ltd. All rights reserved.
0. Introduction
The objective of this paper is to address the potential hetero-geneity in the architecture of the networks built by entrepreneurialfirms to access the resources necessary for innovation in two distinctknowledge-intensive sectors – biotechnology and software.
Networks are generally presented in the literature as critical tothe innovation process in knowledge-intensive sectors; this isparticularly so in young small firms operating in these sectors,given the added difficulties these firms experience in accessing therange of resources necessary for innovation due to their youth(liabilities of newness) and size (need to search externally for asubstantial proportion of the resources required). However, there islittle discussion on the potential variety in the actual functionsplayed by networks for resource access in different knowledge-
ll rights reserved.
ax: þ351 217 940 042.
isa),
lneg.pt (M. Fontes).
intensive sectors, which will lead to distinct network buildingstrategies and thus to diverse network configurations (topologies).
Empirical research contrasting networking behaviour in dif-ferent knowledge intensive-sectors is relatively scarce; and is notconcerned with the systematic search for diversity in the sectoralnetworks and the reasons underlying that diversity. Studies thataddress network characteristics usually focus on a single specificsector, or consider technology-intensive firms generally, combin-ing firms from several sectors. The latter studies offer insightsinto aspects of networking behaviour that are likely to becommon to technology-intensive companies, but overlook varietyand its sectoral causes. However, knowledge-intensive sectors areby no means homogeneous in their process of innovation andtherefore it is important to understand how this heterogeneityinfluences the architecture of the innovation networks built bythe firms.
The main objective of this research is precisely to address thisgap, contributing to an understanding of the sources of network-ing variety in knowledge-intensive sectors. For this purpose weaddress two knowledge-intensive sectors – biotechnology andsoftware – where young entrepreneurial firms play an important
I. Salavisa et al. / Technovation 32 (2012) 380–399 381
role in the innovative activities and often constitute the majorityof the population and thus, according to social network literature,where there is bound to be an extensive reliance on externalnetworking to gain access to key resources that are not availablein-house. The rationale behind our approach is that, despite thissimilarity, there are important differences between the twosectors in the nature of the knowledge being exploited and inthe organisation of the innovation processes (McKelvey, 2005). Itis argued that these dissimilarities are reflected in: (i) the type ofresources necessary for innovation and, in particular, the externalresources searched by the firms; (ii) the sources for theseresources and the modes of access to them. Thus differences inthe nature of resources being accessed are expected to have animpact upon the composition (actors that are mobilised) andstructure (types of relationship that are established) of the net-works built by biotechnology and by software firms, resulting indistinctions in the topology of networks present in both sectors.
In order to capture and understand this diversity in network-ing behaviour, we combine contributions from the innovation andthe social network literature to: (a) identify the main differencesin innovative behaviour between biotechnology and softwarefirms and their implications in terms of the nature of resourcessearched; (b) discuss the relevance of networks in the access todifferent types of resources and the nature of the relationshipsestablished for that purpose; (c) empirically investigate theimpact of differences in the nature of resources on the architec-ture of innovation networks.
Since innovation in knowledge-intensive companies is con-cerned with the transformation of scientific and technologicalknowledge into marketable technologies, products or services weaddress resource access networking in an integrated way; that is,we encompass the search for both knowledge and other non-technological resources necessary for innovation and requiringthe mobilisation of both formal contractual relationships andinformal personal ties. In so doing, we deal with a gap in thetreatment of resources and modes of access of these resources insocial network research. In fact, empirical studies tend to focuson the role of networks in the access to specific resources –frequently knowledge – rarely addressing simultaneously andcomparing knowledge and other (non-technological) resourcesnecessary for innovation. However, not only the success ofinnovation requires firms to gain access and combine a varietyof resources with diverse characteristics, but it is also possiblethat there is some overlap in terms of their sources.
Similarly, extant research tends to address separately formaland informal networks, frequently focusing on formal ones.However, both formal and informal relationships have been foundto be mobilised in resource access – even if they sometimes playdifferent functions – and they are often intertwined (Cassi andMorrison, 2007). Therefore, an actual understanding of the net-working behaviour of entrepreneurial firms requires the com-bined consideration of both types of resources and both types ofchannels, which is the approach adopted in our research. Inaddition, we intend to take full advantage of the vast array oftools of social network analysis to build, interpret and comparethe various networks involved.
Finally, we also address the contextual dimension. The processof resource mobilisation for innovation is influenced by thecontext where firms are embedded, not only in terms of quantity,quality and variety of resources available, but also in terms of thenature of the relationships that need to be established to accessthese resources (Hoang and Antoncic, 2003). The context maytherefore introduce particular constraints on the access to sometypes of resources, which can be sector specific or transversal toall knowledge-intensive firms. As these constraints require firmsto adjust their networking behaviour accordingly, they are
expected to give the configuration of the innovation networksspecific traits. The vast majority of empirical research on net-working behaviour in knowledge-intensive sectors is focused onadvanced countries and there is limited consideration of theimpact of context-related factors on the resource mobilisationprocess outside them. In this paper we focus on the less fre-quently studied case of an intermediate developed economy andattempt to understand whether the architecture of the networksis influenced by specific environmental features. Thus we con-tribute to a better understanding of the networking behaviour ofknowledge-intensive firms in this kind of context.
The paper is organised as follows. We start by identifying thekey features of each sector’s innovative behaviour that are likelyto lead to differences in firms’ resource access strategies. Then wediscuss the role of networks in the search for different types ofresources and put forward some expectations concerning theimplications of sectoral variety in resource requirements for thearchitecture of the sectoral networks. Finally, we conduct anempirical analysis on the composition and structure of the net-works built by Portuguese firms operating in biotechnology(molecular biology) and software (for telecommunications), basedon a reconstruction of actual formal and informal networksmobilised to access different types of resources. The remainderof the paper is devoted to the discussion of the results and theconclusions.
1. Background
1.1. Differences between biotechnology and software in their
innovative behaviour
It is well established that innovation is sector specific. Anumber of studies have analysed innovation in biotechnologyand in software, and comparative analyses of the two sectors(or of biotechnology and computing) have been conducted(McKelvey, 2005; Swann and Prevezer, 1996; Weterings andPonds, 2009; Rampersad et al., 2009; Luukkonen and Palmberg,2007). Although none of these studies has specifically comparedfirms’ networking strategies, they provide some insights into theorganisation of the sectors and the innovative behaviour of thefirms that can guide our discussion.
Both sectors are highly knowledge-intensive, but differencescan be found in terms of the nature of knowledge being exploitedand also the role and location of scientific and technologicalknowledge, as compared with non-technological resources. Thesedifferences are likely to influence the nature and sources oftechnological opportunities and hence the innovation processesconducted by the firms and the resources and competencesnecessary to pursue them (Malerba and Orsenigo, 1993).
1.1.1. Main differences between the two sectors
Biotechnology exhibits two distinctive features that influencethe nature of the activities pursued for its industrial exploitation:it is a science-based technology characterised by a close proxi-mity between scientific principles and their industrial applica-tions (Orsenigo, 1989); it is a horizontal technology (or set oftechnologies) that can be used across a wide set of applications indifferent industries (OECD, 2009).
The science-based nature of biotechnology has a number ofimplications. Biotechnology originated from new scientific dis-coveries and its development continues to draw extensively onscientific research (McKelvey et al., 2004; Zucker et al., 2002).Knowledge originating from academic research tends to begeneric in nature (Klevorick et al., 1995), creating extensivetechnological opportunities at a very fast pace. But for these
I. Salavisa et al. / Technovation 32 (2012) 380–399382
opportunities to be converted into actual applications, the newknowledge will still require more or less extensive transforma-tions, preferably performed by people who were involved in itsearly development (Autio, 1997). Generic technologies also tendto be pervasive, offering a ‘‘platform’’ that can support a contin-uous stream of new developments. This can be a source ofcompetitiveness in a fast changing context, but it also requiresmajor decisions regarding the actual application(s) to be pursued.Finally, the abstract and codified nature of scientific knowledgemakes it easier to protect through appropriation mechanismssuch as patents (Saviotti, 1998). This combination of character-istics creates business opportunities for new firms endowed withnovel knowledge/technologies. But it also sets very stringentrequirements in terms of technological competences and abilityto access new scientific knowledge. Moreover, it can create somedifficulties given the novelty of the technologies and the resultingtechnological and market uncertainty.
The transversal nature of the technologies that composebiotechnology is closely related with their high pervasiveness,i.e., the fact that the same core knowledge can be used in a varietyof applications (Malerba and Orsenigo, 1993). Thus, firms usingbroadly similar technologies may operate in different industrialsegments or even in different industries (Swann and Prevezer,1996). This transversal nature combined with the scientific originof biotechnology and the route followed in its industrial exploita-tion effectively shaped the sector’s mode of organisation.
In fact, biotechnology originated in the university, thus outsidean industrial setting, but started being applied in establishedindustries in a process largely conducted by outsiders. The firstsector where biotechnology was introduced – pharmaceuticals –was populated by large powerful firms. In order to enter, the newfirms were forced to establish relationships with the incumbents,who did not dominate the new knowledge but controlled thedownstream assets necessary to commercialise its applications(McKelvey et al., 2004). This gave rise to a new type of organisa-tion – the science-based firm – and a specific business model (alsolabelled ‘‘classical model’’) in which biotechnology firms operatemostly upstream. They are engaged in research, producing newknowledge which is usually patented and then sold or licensed toother firms that control the downstream assets and pursue theirsubsequent development (Pisano, 2010).
Moreover, even if the new technologies had the potential tochange the incumbent production processes and the nature oftheir products, the relationships established tended to be char-acterised by strong power asymmetries. Thus, small entrantswere often deprived of a substantial part of the profits from theirinnovations and prevented from achieving vertical integrationand growth, remaining specialised technology suppliers(Audretsch and Feldman, 2003). In addition, they depended onexternal capital to support the development of technologiescharacterised by long time lags and high novelty and uncertainty.Capital could be provided by the incumbents or by the financialmarkets and in particular by one actor that assumed a key role inthe sector: the venture capital company (Coriat et al., 2003).
This process led to the development of a set of interdepen-dencies: between research universities that guaranteed the con-tinuity in the production of knowledge and the new firms createdto exploit the emerging technologies; between these firms andestablished companies operating in the pharmaceutical sector,which assumed the responsibility for part or the totality of thedownstream activities; and between the new firms and thecapital suppliers that sustained their mode of business. Theinterdependencies that emerged in these early stages effectivelyshaped the way biotechnology became organised (Powell et al.,2010). They led to a relatively clear division of labour betweenproducers of scientific knowledge, dedicated biotechnology firms,
firms from user sectors and capital suppliers, all possessing com-plementary competences and assets (Stuart et al., 2007) andresulted in the development of extensive networks between them(Powell et al., 1996, 2005).
This mode of organisation proved to be highly persistent,although some changes/adjustments in the role and position ofthe various actors took place over time associated with theevolution of technologies and markets, or with the extension ofbiotechnology to applications outside drug discovery and devel-opment (Gottinger and Umali, 2011; McKelvey, 2008). Thesechanges had some impact on the business models adopted bydedicated biotechnology firms. New firms targeting health seg-ments other than drug discovery or other application sectors(such as agro-food or energy/environment), which had differentcapital and regulatory requirements and where small specialisedniches could be found, engaged in the development and commer-cialisation of their own products and services, aiming at nichemarkets (Luukkonen and Palmberg, 2007; Valentin and Jensen,2003). Even in the drug discovery field, where the ‘‘classical’’business model first evolved and continued to prevail, newopportunities emerged from the exploitation of new transversaltechnologies that increase the efficiency of drug discovery andcan be applied to a variety of problems (Orsenigo et al., 2001;Sabatier et al., 2010). In all these cases, biotechnology firms areless dependent on alliances with one particular company eventhough large companies often remain their main clients.
As for software, it differs in many aspects from biotechnology.It is a knowledge-intensive sector with a pervasive influence inthe innovation processes of many industries, but its evolution hasdepended largely on activities other than university research. Inits early stage, the history of software was shaped by that of thecomputer business. The creation of an independent softwareindustry is generally attributable to both the evolution andstrategies of the computer manufacturers and to the furtherupsurge of personal computers (Steinmueller, 1996, 2004), whichled to the emergence of a vast packaged software segmentcomprising large specialised corporations, and coexisting with arenewed segment of custom and service software companies(Cloodt et al., 2010). A number of authors have observed that atechnological convergence between computers, software andtelecommunications has been taking place over recent decades,giving rise to completely new categories of innovation and newforms of relationship between the three fields (Cloodt et al.,2010). The software industry and its business models were onceagain deeply shaken by the creation and expansion of the internetfrom the 1990s onwards (Aramand, 2008; Mowery and Simcoe,2002).
In short, software is a diversified and mature industry; itencompasses segments (Lippoldt and Stryszowski, 2009) withvarious degrees of technological sophistication and reliance onscientific advances (Steinmueller, 2004) but a general dependencefrom universities for highly skilled human resources. Thus, wemay define it as a technology-intensive sector relying on acomplex and diversified knowledge base, but where tacit knowl-edge appears to be much more relevant than in most biotechnol-ogy activities (Grimaldi and Torrisi, 2001; Aramand, 2008).
Innovation can be described as mostly incremental, although ittakes place at a very rapid pace. In fact, the level of technologicalopportunities in the industry is high but depends mostly on user-producer relationships, especially when it comes to embeddedsoftware and applications. Opportunities are reinforced by thepervasiveness of applications. Since the early 1990s, industrieslike automobiles, mobile phones, robotics, telecommunicationsystems, medical devices and consumer electronics (Lippoldtand Stryszowski, 2009) joined the pioneering defence and aero-space industries as heavy users of software. Although in-house
I. Salavisa et al. / Technovation 32 (2012) 380–399 383
software production is dominant in most of them, they haveestablished numerous links with software companies. Theyrepresent a new generation of customers, namely regarding thespecific class of embedded software. These sectors have estab-lished connections, in the form of R&D collaboration and othertechnological partnerships with large software houses but alsowith small innovative software companies. Similarly, the per-ceived actual and anticipated needs of the clients induce pack-aged software firms to innovate in problem-solving solutions.
In terms of appropriability – greatly affected by the opensource software movement (Malerba, 2005; McKelvey, 2005) –firms rely on several forms of property protection such aspatenting, standards, copy rights, techno-commercial strategies –including lead-time, proliferation of products (Giarratana, 2004)and partnerships and alliances, both among software firms andwith customers.
1.1.2. The impact of sectoral differences on the access to
technological resources
The nature of the knowledge being exploited by the firms hasdirect implications for the type of scientific and technologicalknowledge they need and thus for the types of relationshipestablished to access this resource. The relationship betweenthe nature of knowledge required for innovation and the type ofknowledge networks established by the firms was addressed bysome authors, using the concept of knowledge bases (Asheim andCoenen, 2005; Moodysson et al., 2008; Plum and Hassink, 2011).
The basic argument is that the innovation process in firms andindustries is strongly shaped by their specific knowledge bases. Inthe case of technology-based firms, two main types of knowledgebase or modes of knowledge creation – analytical and synthetic –are distinguished (Asheim and Coenen, 2005; Moodysson et al.,2008). An analytical knowledge base prevails when: innovationbuilds on the creation of new knowledge; scientific knowledge isvery important; knowledge creation is based on deductive pro-cesses and formal models and relies on abstract ‘‘know-why’’;knowledge is more often codified (even if tacit knowledge isalso present); and the outcome is frequently radical innovation.A synthetic knowledge base prevails when: innovation is mostlybased on the use of existing knowledge, sometimes through novelcombinations; knowledge creation takes place to solve specificproblems, through inductive processes of testing and experimen-tation; tacit knowledge dominates; and the outcome is mainlyincremental innovation.
The differences uncovered concerning the modes of knowledgecreation were found to have implications for the nature ofinteractions that take place (Moodysson et al., 2008; Plum andHassink, 2011). Thus, knowledge interactions with researchorganisations are more frequent in the analytical mode, comple-menting and fuelling internal R&D activities. Relations withresearch organisations are also present in the case of the syntheticmode, but interactions with clients and suppliers for problemsolving are more frequent, often taking the form of face-to-faceexchanges and/or informal bartering. The more formalised andcodified nature of the knowledge being produced in the analyticalmode makes personal interaction less important than in thesynthetic one and also invites (or even recommends) a greaterformalisation of the knowledge exchanges.
These types of knowledge base have been found by someauthors to be more clearly associated to specific industries, whichemerge as ‘‘paradigmatic’’ of the modes of knowledge creationdescribed. However, it has been stressed that innovation pro-cesses have elements of both, although some elements tend todominate to a greater or lesser degree (Moodysson et al., 2008).But the extent to which one of them is dominant has implications
for the type of knowledge relationship that is established, both interms of the type of actors and the modes of communicationbetween them.
Regarding the sectors under analysis in this paper, an analy-tical knowledge base (or mode of knowledge creation) clearlypredominates in the case of biotechnology, even though it is stillpossible to find some variety among firms operating in this sector(Moodysson et al., 2008).
Software appears to be less typical of one particular knowl-edge base (and it was not specifically addressed by the empiricalresearch conducted by these authors). However, the evidenceavailable on the mode of knowledge creation in this sector(Steinmueller, 2004; Lippoldt and Stryszowski, 2009) points to apredominance of a synthetic knowledge base, though it may bepossible to identify some traits of an analytical knowledge base ina more science-based sub-set.
Thus, the above discussion suggests that the differences in thenature of knowledge resources predominantly required by bio-technology and by software firms is likely to lead them toestablish distinct types of relationship and offer some insightsinto the potential differences that may emerge at this level.
1.1.3. The impact of sectoral differences on non-technological
resources
Innovation involves the transformation of scientific and tech-nological knowledge in marketable products or services. In orderto achieve this, firms have to gain access (building or acquiringfrom others) to a set of non-technological resources that arenecessary to sell a product or service: e.g., manufacturing,marketing, sales and distribution, regulatory knowledge, capital,etc. These resources that enable firms to capture value from theirtechnologies are described in the literature as ‘‘complementaryassets’’ (Teece, 1986).
The type of complementary assets that are required by firmsand the nature of their suppliers vary. The nature of the knowl-edge being exploited determines the type of technology assetspossessed by the firm and influences their decisions on thebusiness model adopted to commercialise them (Conceic- ~aoet al., 2012). However, these decisions are also partly dependenton the sectoral structure, namely the location and mode ofdeployment of the complementary assets required to adoptalternative modes of commercialisation, which have differentresource requirements (Gans and Stern, 2003).
Thus, firms may opt in favour of operating exclusively in theupstream stages of the value chain, specialising in the productionand selling of intellectual property, in which case their engage-ment in downstream activities is minimal and their need for non-technological assets is confined to capital resources and tocompetences in technology marketing. On the other hand, firmsmay choose to develop products or services based on theirtechnology and sell them in the market. This leads them toengage in some or all downstream activities and thus buildingup or gaining access – in the market or through alliances – to awider range of non-technological resources and competences(Arora et al., 2001).
Once a decision on the mode of commercialisation is made, thesearch for the non-technological assets is constrained by thestructure of the sector and its interdependencies with othersectors that are potential suppliers of these resources. In parti-cular, sectoral conditions may have an impact on the accessibilityof the assets. In fact, complementary assets can be generic andsupplied by the market in competitive conditions; or co-specia-lised to the innovation (Teece, 1986). Co-specialised assets maynot be readily available in the market since their owners try toobtain control over them; they may also be difficult to imitate.
I. Salavisa et al. / Technovation 32 (2012) 380–399384
Thus, access to these assets may require the establishment ofsome type of contractual relationship with the owner (Colomboet al., 2006).
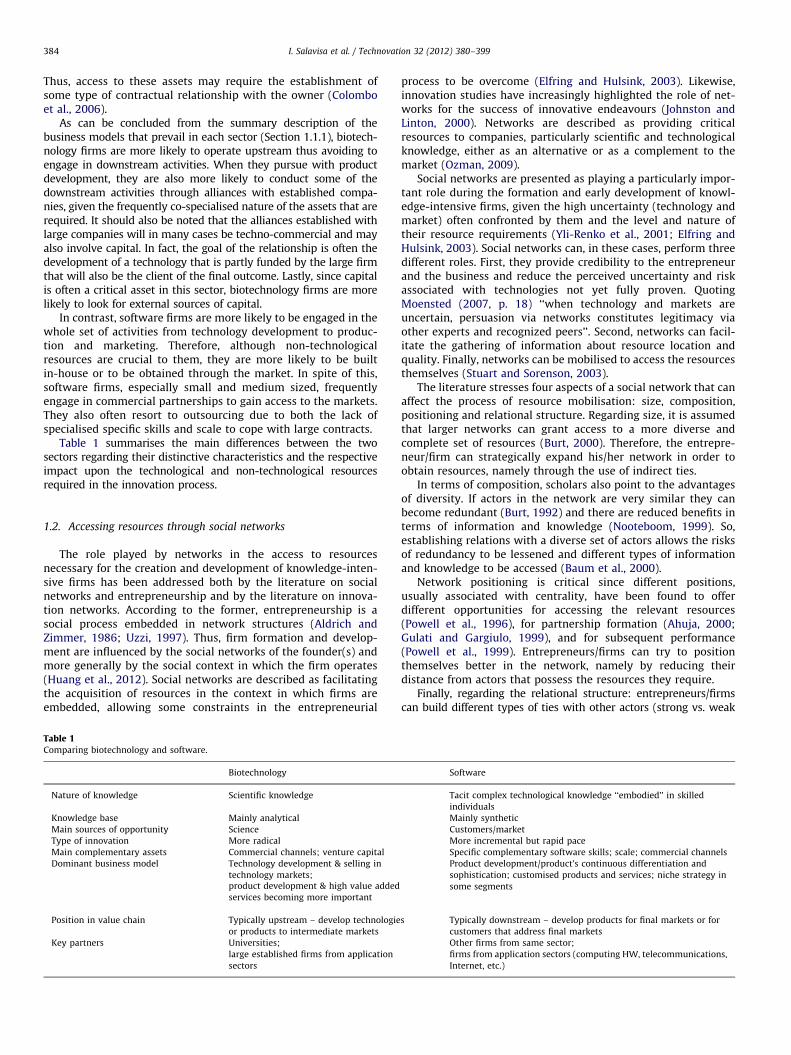
As can be concluded from the summary description of thebusiness models that prevail in each sector (Section 1.1.1), biotech-nology firms are more likely to operate upstream thus avoiding toengage in downstream activities. When they pursue with productdevelopment, they are also more likely to conduct some of thedownstream activities through alliances with established compa-nies, given the frequently co-specialised nature of the assets that arerequired. It should also be noted that the alliances established withlarge companies will in many cases be techno-commercial and mayalso involve capital. In fact, the goal of the relationship is often thedevelopment of a technology that is partly funded by the large firmthat will also be the client of the final outcome. Lastly, since capitalis often a critical asset in this sector, biotechnology firms are morelikely to look for external sources of capital.
In contrast, software firms are more likely to be engaged in thewhole set of activities from technology development to produc-tion and marketing. Therefore, although non-technologicalresources are crucial to them, they are more likely to be builtin-house or to be obtained through the market. In spite of this,software firms, especially small and medium sized, frequentlyengage in commercial partnerships to gain access to the markets.They also often resort to outsourcing due to both the lack ofspecialised specific skills and scale to cope with large contracts.
Table 1 summarises the main differences between the twosectors regarding their distinctive characteristics and the respectiveimpact upon the technological and non-technological resourcesrequired in the innovation process.
1.2. Accessing resources through social networks
The role played by networks in the access to resourcesnecessary for the creation and development of knowledge-inten-sive firms has been addressed both by the literature on socialnetworks and entrepreneurship and by the literature on innova-tion networks. According to the former, entrepreneurship is asocial process embedded in network structures (Aldrich andZimmer, 1986; Uzzi, 1997). Thus, firm formation and develop-ment are influenced by the social networks of the founder(s) andmore generally by the social context in which the firm operates(Huang et al., 2012). Social networks are described as facilitatingthe acquisition of resources in the context in which firms areembedded, allowing some constraints in the entrepreneurial
Table 1Comparing biotechnology and software.
Biotechnology
Nature of knowledge Scientific knowledge
Knowledge base Mainly analytical
Main sources of opportunity Science
Type of innovation More radical
Main complementary assets Commercial channels; venture capital
Dominant business model Technology development & selling in
technology markets;product development & high value added
services becoming more important
Position in value chain Typically upstream – develop technologie
or products to intermediate markets
Key partners Universities;
large established firms from application
sectors
process to be overcome (Elfring and Hulsink, 2003). Likewise,innovation studies have increasingly highlighted the role of net-works for the success of innovative endeavours (Johnston andLinton, 2000). Networks are described as providing criticalresources to companies, particularly scientific and technologicalknowledge, either as an alternative or as a complement to themarket (Ozman, 2009).
Social networks are presented as playing a particularly impor-tant role during the formation and early development of knowl-edge-intensive firms, given the high uncertainty (technology andmarket) often confronted by them and the level and nature oftheir resource requirements (Yli-Renko et al., 2001; Elfring andHulsink, 2003). Social networks can, in these cases, perform threedifferent roles. First, they provide credibility to the entrepreneurand the business and reduce the perceived uncertainty and riskassociated with technologies not yet fully proven. QuotingMoensted (2007, p. 18) ‘‘when technology and markets areuncertain, persuasion via networks constitutes legitimacy viaother experts and recognized peers’’. Second, networks can facil-itate the gathering of information about resource location andquality. Finally, networks can be mobilised to access the resourcesthemselves (Stuart and Sorenson, 2003).
The literature stresses four aspects of a social network that canaffect the process of resource mobilisation: size, composition,positioning and relational structure. Regarding size, it is assumedthat larger networks can grant access to a more diverse andcomplete set of resources (Burt, 2000). Therefore, the entrepre-neur/firm can strategically expand his/her network in order toobtain resources, namely through the use of indirect ties.
In terms of composition, scholars also point to the advantagesof diversity. If actors in the network are very similar they canbecome redundant (Burt, 1992) and there are reduced benefits interms of information and knowledge (Nooteboom, 1999). So,establishing relations with a diverse set of actors allows the risksof redundancy to be lessened and different types of informationand knowledge to be accessed (Baum et al., 2000).
Network positioning is critical since different positions,usually associated with centrality, have been found to offerdifferent opportunities for accessing the relevant resources(Powell et al., 1996), for partnership formation (Ahuja, 2000;Gulati and Gargiulo, 1999), and for subsequent performance(Powell et al., 1999). Entrepreneurs/firms can try to positionthemselves better in the network, namely by reducing theirdistance from actors that possess the resources they require.
Finally, regarding the relational structure: entrepreneurs/firmscan build different types of ties with other actors (strong vs. weak
Software
Tacit complex technological knowledge ‘‘embodied’’ in skilled
individuals
Mainly synthetic
Customers/market
More incremental but rapid pace
Specific complementary software skills; scale; commercial channels
Product development/product’s continuous differentiation and
sophistication; customised products and services; niche strategy in
some segments
s Typically downstream – develop products for final markets or for
customers that address final markets
Other firms from same sector;
firms from application sectors (computing HW, telecommunications,
Internet, etc.)
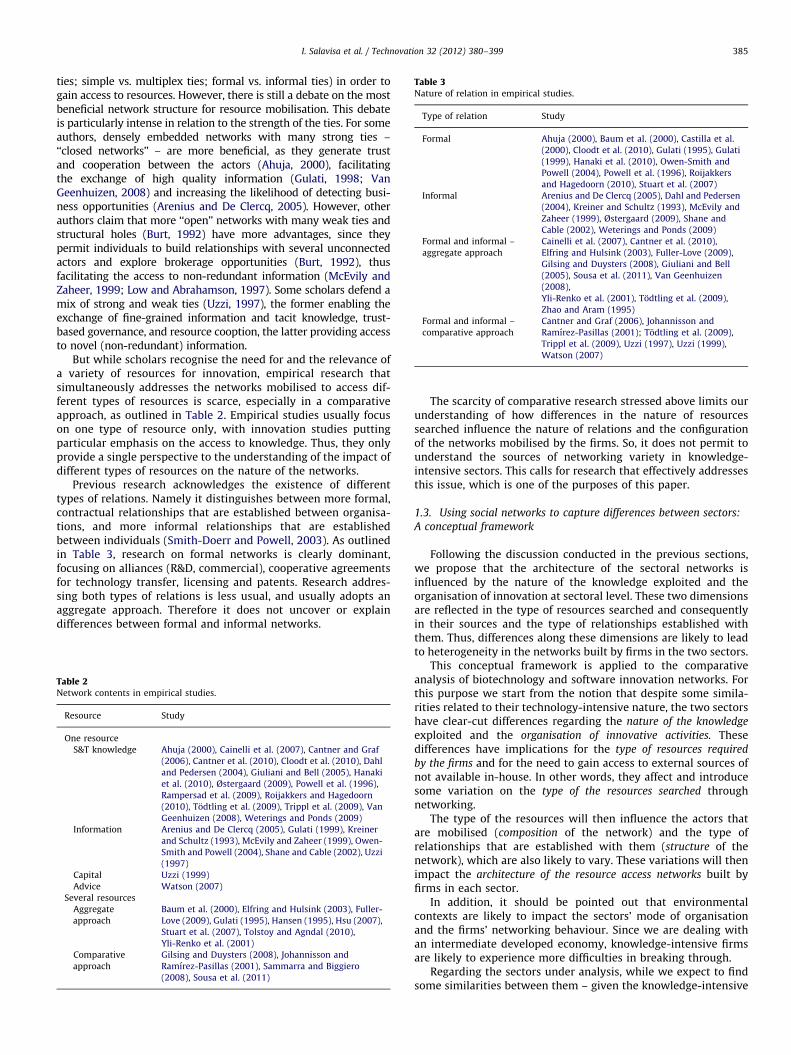
Table 3Nature of relation in empirical studies.
Type of relation Study
Formal Ahuja (2000), Baum et al. (2000), Castilla et al.
(2000), Cloodt et al. (2010), Gulati (1995), Gulati
(1999), Hanaki et al. (2010), Owen-Smith and
Powell (2004), Powell et al. (1996), Roijakkers
and Hagedoorn (2010), Stuart et al. (2007)
Informal Arenius and De Clercq (2005), Dahl and Pedersen
(2004), Kreiner and Schultz (1993), McEvily and
Zaheer (1999), Østergaard (2009), Shane and
Cable (2002), Weterings and Ponds (2009)
Formal and informal –
aggregate approach
Cainelli et al. (2007), Cantner et al. (2010),
Elfring and Hulsink (2003), Fuller-Love (2009),
Gilsing and Duysters (2008), Giuliani and Bell
(2005), Sousa et al. (2011), Van Geenhuizen
(2008),
Yli-Renko et al. (2001), Todtling et al. (2009),
Zhao and Aram (1995)
Formal and informal –
comparative approach
Cantner and Graf (2006), Johannisson and
Ramırez-Pasillas (2001); Todtling et al. (2009),
Trippl et al. (2009), Uzzi (1997), Uzzi (1999),
Watson (2007)
I. Salavisa et al. / Technovation 32 (2012) 380–399 385
ties; simple vs. multiplex ties; formal vs. informal ties) in order togain access to resources. However, there is still a debate on the mostbeneficial network structure for resource mobilisation. This debateis particularly intense in relation to the strength of the ties. For someauthors, densely embedded networks with many strong ties –‘‘closed networks’’ – are more beneficial, as they generate trustand cooperation between the actors (Ahuja, 2000), facilitatingthe exchange of high quality information (Gulati, 1998; VanGeenhuizen, 2008) and increasing the likelihood of detecting busi-ness opportunities (Arenius and De Clercq, 2005). However, otherauthors claim that more ‘‘open’’ networks with many weak ties andstructural holes (Burt, 1992) have more advantages, since theypermit individuals to build relationships with several unconnectedactors and explore brokerage opportunities (Burt, 1992), thusfacilitating the access to non-redundant information (McEvily andZaheer, 1999; Low and Abrahamson, 1997). Some scholars defend amix of strong and weak ties (Uzzi, 1997), the former enabling theexchange of fine-grained information and tacit knowledge, trust-based governance, and resource cooption, the latter providing accessto novel (non-redundant) information.
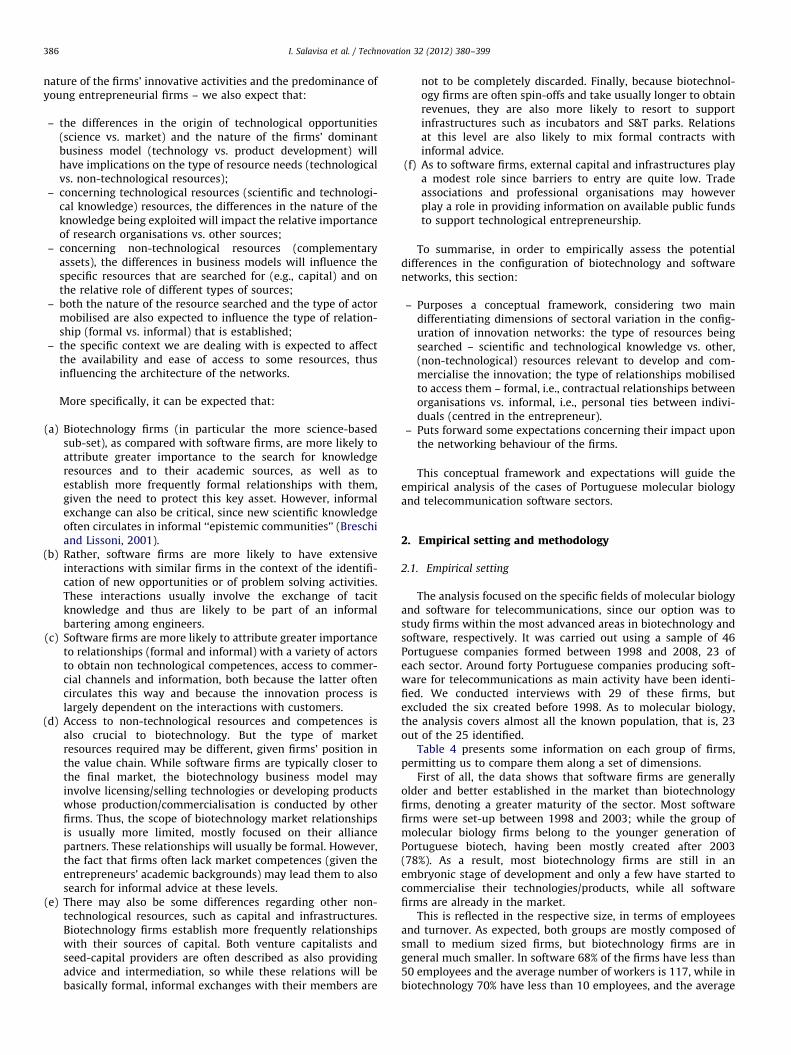
But while scholars recognise the need for and the relevance ofa variety of resources for innovation, empirical research thatsimultaneously addresses the networks mobilised to access dif-ferent types of resources is scarce, especially in a comparativeapproach, as outlined in Table 2. Empirical studies usually focuson one type of resource only, with innovation studies puttingparticular emphasis on the access to knowledge. Thus, they onlyprovide a single perspective to the understanding of the impact ofdifferent types of resources on the nature of the networks.
Previous research acknowledges the existence of differenttypes of relations. Namely it distinguishes between more formal,contractual relationships that are established between organisa-tions, and more informal relationships that are establishedbetween individuals (Smith-Doerr and Powell, 2003). As outlinedin Table 3, research on formal networks is clearly dominant,focusing on alliances (R&D, commercial), cooperative agreementsfor technology transfer, licensing and patents. Research addres-sing both types of relations is less usual, and usually adopts anaggregate approach. Therefore it does not uncover or explaindifferences between formal and informal networks.
Table 2Network contents in empirical studies.
Resource Study
One resource
S&T knowledge Ahuja (2000), Cainelli et al. (2007), Cantner and Graf
(2006), Cantner et al. (2010), Cloodt et al. (2010), Dahl
and Pedersen (2004), Giuliani and Bell (2005), Hanaki
et al. (2010), Østergaard (2009), Powell et al. (1996),
Rampersad et al. (2009), Roijakkers and Hagedoorn
(2010), Todtling et al. (2009), Trippl et al. (2009), Van
Geenhuizen (2008), Weterings and Ponds (2009)
Information Arenius and De Clercq (2005), Gulati (1999), Kreiner
and Schultz (1993), McEvily and Zaheer (1999), Owen-
Smith and Powell (2004), Shane and Cable (2002), Uzzi
(1997)
Capital Uzzi (1999)
Advice Watson (2007)
Several resources
Aggregate
approach
Baum et al. (2000), Elfring and Hulsink (2003), Fuller-
Love (2009), Gulati (1995), Hansen (1995), Hsu (2007),
Stuart et al. (2007), Tolstoy and Agndal (2010),
Yli-Renko et al. (2001)
Comparative
approach
Gilsing and Duysters (2008), Johannisson and
Ramırez-Pasillas (2001), Sammarra and Biggiero
(2008), Sousa et al. (2011)
The scarcity of comparative research stressed above limits ourunderstanding of how differences in the nature of resourcessearched influence the nature of relations and the configurationof the networks mobilised by the firms. So, it does not permit tounderstand the sources of networking variety in knowledge-intensive sectors. This calls for research that effectively addressesthis issue, which is one of the purposes of this paper.
1.3. Using social networks to capture differences between sectors:
A conceptual framework
Following the discussion conducted in the previous sections,we propose that the architecture of the sectoral networks isinfluenced by the nature of the knowledge exploited and theorganisation of innovation at sectoral level. These two dimensionsare reflected in the type of resources searched and consequentlyin their sources and the type of relationships established withthem. Thus, differences along these dimensions are likely to leadto heterogeneity in the networks built by firms in the two sectors.
This conceptual framework is applied to the comparativeanalysis of biotechnology and software innovation networks. Forthis purpose we start from the notion that despite some simila-rities related to their technology-intensive nature, the two sectorshave clear-cut differences regarding the nature of the knowledge
exploited and the organisation of innovative activities. Thesedifferences have implications for the type of resources required
by the firms and for the need to gain access to external sources ofnot available in-house. In other words, they affect and introducesome variation on the type of the resources searched throughnetworking.
The type of the resources will then influence the actors thatare mobilised (composition of the network) and the type ofrelationships that are established with them (structure of thenetwork), which are also likely to vary. These variations will thenimpact the architecture of the resource access networks built byfirms in each sector.
In addition, it should be pointed out that environmentalcontexts are likely to impact the sectors’ mode of organisationand the firms’ networking behaviour. Since we are dealing withan intermediate developed economy, knowledge-intensive firmsare likely to experience more difficulties in breaking through.
Regarding the sectors under analysis, while we expect to findsome similarities between them – given the knowledge-intensive
I. Salavisa et al. / Technovation 32 (2012) 380–399386
nature of the firms’ innovative activities and the predominance ofyoung entrepreneurial firms – we also expect that:
–
the differences in the origin of technological opportunities(science vs. market) and the nature of the firms’ dominantbusiness model (technology vs. product development) willhave implications on the type of resource needs (technologicalvs. non-technological resources);–
concerning technological resources (scientific and technologi-cal knowledge) resources, the differences in the nature of theknowledge being exploited will impact the relative importanceof research organisations vs. other sources;–
concerning non-technological resources (complementaryassets), the differences in business models will influence thespecific resources that are searched for (e.g., capital) and onthe relative role of different types of sources;–
both the nature of the resource searched and the type of actormobilised are also expected to influence the type of relation-ship (formal vs. informal) that is established;–
the specific context we are dealing with is expected to affectthe availability and ease of access to some resources, thusinfluencing the architecture of the networks.More specifically, it can be expected that:
(a)
Biotechnology firms (in particular the more science-basedsub-set), as compared with software firms, are more likely toattribute greater importance to the search for knowledgeresources and to their academic sources, as well as toestablish more frequently formal relationships with them,given the need to protect this key asset. However, informalexchange can also be critical, since new scientific knowledgeoften circulates in informal ‘‘epistemic communities’’ (Breschiand Lissoni, 2001).(b)
Rather, software firms are more likely to have extensiveinteractions with similar firms in the context of the identifi-cation of new opportunities or of problem solving activities.These interactions usually involve the exchange of tacitknowledge and thus are likely to be part of an informalbartering among engineers.(c)
Software firms are more likely to attribute greater importanceto relationships (formal and informal) with a variety of actorsto obtain non technological competences, access to commer-cial channels and information, both because the latter oftencirculates this way and because the innovation process islargely dependent on the interactions with customers.(d)
Access to non-technological resources and competences isalso crucial to biotechnology. But the type of marketresources required may be different, given firms’ position inthe value chain. While software firms are typically closer tothe final market, the biotechnology business model mayinvolve licensing/selling technologies or developing productswhose production/commercialisation is conducted by otherfirms. Thus, the scope of biotechnology market relationshipsis usually more limited, mostly focused on their alliancepartners. These relationships will usually be formal. However,the fact that firms often lack market competences (given theentrepreneurs’ academic backgrounds) may lead them to alsosearch for informal advice at these levels.(e)
There may also be some differences regarding other non-technological resources, such as capital and infrastructures.Biotechnology firms establish more frequently relationshipswith their sources of capital. Both venture capitalists andseed-capital providers are often described as also providingadvice and intermediation, so while these relations will bebasically formal, informal exchanges with their members arenot to be completely discarded. Finally, because biotechnol-ogy firms are often spin-offs and take usually longer to obtainrevenues, they are also more likely to resort to supportinfrastructures such as incubators and S&T parks. Relationsat this level are also likely to mix formal contracts withinformal advice.
(f)
As to software firms, external capital and infrastructures playa modest role since barriers to entry are quite low. Tradeassociations and professional organisations may howeverplay a role in providing information on available public fundsto support technological entrepreneurship.To summarise, in order to empirically assess the potentialdifferences in the configuration of biotechnology and softwarenetworks, this section:
–
Purposes a conceptual framework, considering two maindifferentiating dimensions of sectoral variation in the config-uration of innovation networks: the type of resources beingsearched – scientific and technological knowledge vs. other,(non-technological) resources relevant to develop and com-mercialise the innovation; the type of relationships mobilisedto access them – formal, i.e., contractual relationships betweenorganisations vs. informal, i.e., personal ties between indivi-duals (centred in the entrepreneur).–
Puts forward some expectations concerning their impact uponthe networking behaviour of the firms.This conceptual framework and expectations will guide theempirical analysis of the cases of Portuguese molecular biologyand telecommunication software sectors.
2. Empirical setting and methodology
2.1. Empirical setting
The analysis focused on the specific fields of molecular biologyand software for telecommunications, since our option was tostudy firms within the most advanced areas in biotechnology andsoftware, respectively. It was carried out using a sample of 46Portuguese companies formed between 1998 and 2008, 23 ofeach sector. Around forty Portuguese companies producing soft-ware for telecommunications as main activity have been identi-fied. We conducted interviews with 29 of these firms, butexcluded the six created before 1998. As to molecular biology,the analysis covers almost all the known population, that is, 23out of the 25 identified.
Table 4 presents some information on each group of firms,permitting us to compare them along a set of dimensions.
First of all, the data shows that software firms are generallyolder and better established in the market than biotechnologyfirms, denoting a greater maturity of the sector. Most softwarefirms were set-up between 1998 and 2003; while the group ofmolecular biology firms belong to the younger generation ofPortuguese biotech, having been mostly created after 2003(78%). As a result, most biotechnology firms are still in anembryonic stage of development and only a few have started tocommercialise their technologies/products, while all softwarefirms are already in the market.
This is reflected in the respective size, in terms of employeesand turnover. As expected, both groups are mostly composed ofsmall to medium sized firms, but biotechnology firms are ingeneral much smaller. In software 68% of the firms have less than50 employees and the average number of workers is 117, while inbiotechnology 70% have less than 10 employees, and the average
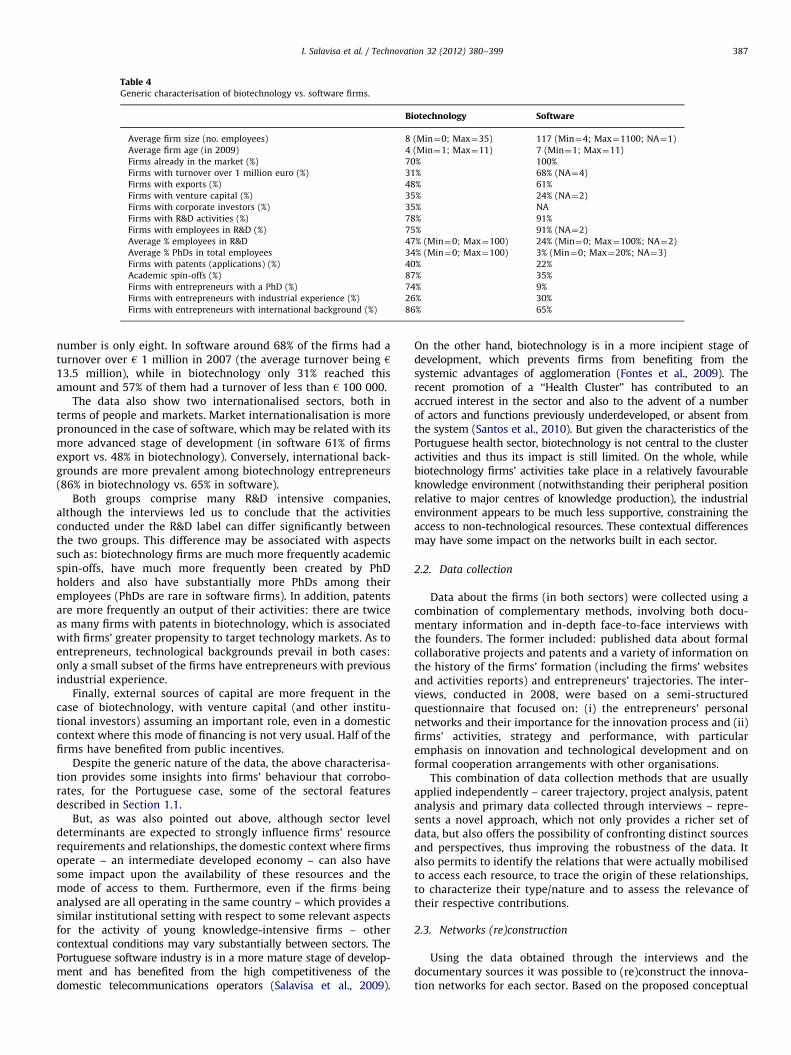
Table 4Generic characterisation of biotechnology vs. software firms.
Biotechnology Software
Average firm size (no. employees) 8 (Min¼0; Max¼35) 117 (Min¼4; Max¼1100; NA¼1)
Average firm age (in 2009) 4 (Min¼1; Max¼11) 7 (Min¼1; Max¼11)
Firms already in the market (%) 70% 100%
Firms with turnover over 1 million euro (%) 31% 68% (NA¼4)
Firms with exports (%) 48% 61%
Firms with venture capital (%) 35% 24% (NA¼2)
Firms with corporate investors (%) 35% NA
Firms with R&D activities (%) 78% 91%
Firms with employees in R&D (%) 75% 91% (NA¼2)
Average % employees in R&D 47% (Min¼0; Max¼100) 24% (Min¼0; Max¼100%; NA¼2)
Average % PhDs in total employees 34% (Min¼0; Max¼100) 3% (Min¼0; Max¼20%; NA¼3)
Firms with patents (applications) (%) 40% 22%
Academic spin-offs (%) 87% 35%
Firms with entrepreneurs with a PhD (%) 74% 9%
Firms with entrepreneurs with industrial experience (%) 26% 30%
Firms with entrepreneurs with international background (%) 86% 65%
I. Salavisa et al. / Technovation 32 (2012) 380–399 387
number is only eight. In software around 68% of the firms had aturnover over h 1 million in 2007 (the average turnover being h
13.5 million), while in biotechnology only 31% reached thisamount and 57% of them had a turnover of less than h 100 000.
The data also show two internationalised sectors, both interms of people and markets. Market internationalisation is morepronounced in the case of software, which may be related with itsmore advanced stage of development (in software 61% of firmsexport vs. 48% in biotechnology). Conversely, international back-grounds are more prevalent among biotechnology entrepreneurs(86% in biotechnology vs. 65% in software).
Both groups comprise many R&D intensive companies,although the interviews led us to conclude that the activitiesconducted under the R&D label can differ significantly betweenthe two groups. This difference may be associated with aspectssuch as: biotechnology firms are much more frequently academicspin-offs, have much more frequently been created by PhDholders and also have substantially more PhDs among theiremployees (PhDs are rare in software firms). In addition, patentsare more frequently an output of their activities: there are twiceas many firms with patents in biotechnology, which is associatedwith firms’ greater propensity to target technology markets. As toentrepreneurs, technological backgrounds prevail in both cases:only a small subset of the firms have entrepreneurs with previousindustrial experience.
Finally, external sources of capital are more frequent in thecase of biotechnology, with venture capital (and other institu-tional investors) assuming an important role, even in a domesticcontext where this mode of financing is not very usual. Half of thefirms have benefited from public incentives.
Despite the generic nature of the data, the above characterisa-tion provides some insights into firms’ behaviour that corrobo-rates, for the Portuguese case, some of the sectoral featuresdescribed in Section 1.1.
But, as was also pointed out above, although sector leveldeterminants are expected to strongly influence firms’ resourcerequirements and relationships, the domestic context where firmsoperate – an intermediate developed economy – can also havesome impact upon the availability of these resources and themode of access to them. Furthermore, even if the firms beinganalysed are all operating in the same country – which provides asimilar institutional setting with respect to some relevant aspectsfor the activity of young knowledge-intensive firms – othercontextual conditions may vary substantially between sectors. ThePortuguese software industry is in a more mature stage of develop-ment and has benefited from the high competitiveness of thedomestic telecommunications operators (Salavisa et al., 2009).
On the other hand, biotechnology is in a more incipient stage ofdevelopment, which prevents firms from benefiting from thesystemic advantages of agglomeration (Fontes et al., 2009). Therecent promotion of a ‘‘Health Cluster’’ has contributed to anaccrued interest in the sector and also to the advent of a numberof actors and functions previously underdeveloped, or absent fromthe system (Santos et al., 2010). But given the characteristics of thePortuguese health sector, biotechnology is not central to the clusteractivities and thus its impact is still limited. On the whole, whilebiotechnology firms’ activities take place in a relatively favourableknowledge environment (notwithstanding their peripheral positionrelative to major centres of knowledge production), the industrialenvironment appears to be much less supportive, constraining theaccess to non-technological resources. These contextual differencesmay have some impact on the networks built in each sector.
2.2. Data collection
Data about the firms (in both sectors) were collected using acombination of complementary methods, involving both docu-mentary information and in-depth face-to-face interviews withthe founders. The former included: published data about formalcollaborative projects and patents and a variety of information onthe history of the firms’ formation (including the firms’ websitesand activities reports) and entrepreneurs’ trajectories. The inter-views, conducted in 2008, were based on a semi-structuredquestionnaire that focused on: (i) the entrepreneurs’ personalnetworks and their importance for the innovation process and (ii)firms’ activities, strategy and performance, with particularemphasis on innovation and technological development and onformal cooperation arrangements with other organisations.
This combination of data collection methods that are usuallyapplied independently – career trajectory, project analysis, patentanalysis and primary data collected through interviews – repre-sents a novel approach, which not only provides a richer set ofdata, but also offers the possibility of confronting distinct sourcesand perspectives, thus improving the robustness of the data. Italso permits to identify the relations that were actually mobilisedto access each resource, to trace the origin of these relationships,to characterize their type/nature and to assess the relevance oftheir respective contributions.
2.3. Networks (re)construction
Using the data obtained through the interviews and thedocumentary sources it was possible to (re)construct the innova-tion networks for each sector. Based on the proposed conceptual
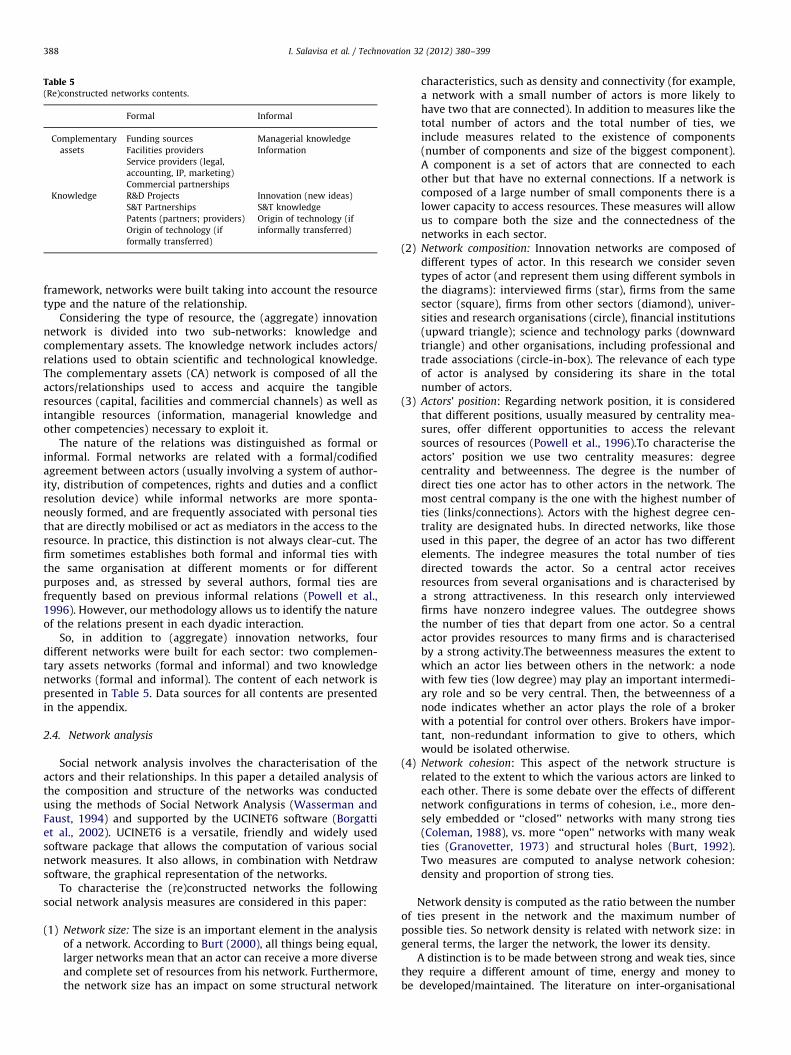
Table 5(Re)constructed networks contents.
Formal Informal
Complementary
assets
Funding sources Managerial knowledge
Facilities providers Information
Service providers (legal,
accounting, IP, marketing)
Commercial partnerships
Knowledge R&D Projects Innovation (new ideas)
S&T Partnerships S&T knowledge
Patents (partners; providers) Origin of technology (if
informally transferred)Origin of technology (if
formally transferred)
I. Salavisa et al. / Technovation 32 (2012) 380–399388
framework, networks were built taking into account the resourcetype and the nature of the relationship.
Considering the type of resource, the (aggregate) innovationnetwork is divided into two sub-networks: knowledge andcomplementary assets. The knowledge network includes actors/relations used to obtain scientific and technological knowledge.The complementary assets (CA) network is composed of all theactors/relationships used to access and acquire the tangibleresources (capital, facilities and commercial channels) as well asintangible resources (information, managerial knowledge andother competencies) necessary to exploit it.
The nature of the relations was distinguished as formal orinformal. Formal networks are related with a formal/codifiedagreement between actors (usually involving a system of author-ity, distribution of competences, rights and duties and a conflictresolution device) while informal networks are more sponta-neously formed, and are frequently associated with personal tiesthat are directly mobilised or act as mediators in the access to theresource. In practice, this distinction is not always clear-cut. Thefirm sometimes establishes both formal and informal ties withthe same organisation at different moments or for differentpurposes and, as stressed by several authors, formal ties arefrequently based on previous informal relations (Powell et al.,1996). However, our methodology allows us to identify the natureof the relations present in each dyadic interaction.
So, in addition to (aggregate) innovation networks, fourdifferent networks were built for each sector: two complemen-tary assets networks (formal and informal) and two knowledgenetworks (formal and informal). The content of each network ispresented in Table 5. Data sources for all contents are presentedin the appendix.
2.4. Network analysis
Social network analysis involves the characterisation of theactors and their relationships. In this paper a detailed analysis ofthe composition and structure of the networks was conductedusing the methods of Social Network Analysis (Wasserman andFaust, 1994) and supported by the UCINET6 software (Borgattiet al., 2002). UCINET6 is a versatile, friendly and widely usedsoftware package that allows the computation of various socialnetwork measures. It also allows, in combination with Netdrawsoftware, the graphical representation of the networks.
To characterise the (re)constructed networks the followingsocial network analysis measures are considered in this paper:
(1)
Network size: The size is an important element in the analysisof a network. According to Burt (2000), all things being equal,larger networks mean that an actor can receive a more diverseand complete set of resources from his network. Furthermore,the network size has an impact on some structural networkcharacteristics, such as density and connectivity (for example,a network with a small number of actors is more likely tohave two that are connected). In addition to measures like thetotal number of actors and the total number of ties, weinclude measures related to the existence of components(number of components and size of the biggest component).A component is a set of actors that are connected to eachother but that have no external connections. If a network iscomposed of a large number of small components there is alower capacity to access resources. These measures will allowus to compare both the size and the connectedness of thenetworks in each sector.
(2)
Network composition: Innovation networks are composed ofdifferent types of actor. In this research we consider seventypes of actor (and represent them using different symbols inthe diagrams): interviewed firms (star), firms from the samesector (square), firms from other sectors (diamond), univer-sities and research organisations (circle), financial institutions(upward triangle); science and technology parks (downwardtriangle) and other organisations, including professional andtrade associations (circle-in-box). The relevance of each typeof actor is analysed by considering its share in the totalnumber of actors.(3)
Actors’ position: Regarding network position, it is consideredthat different positions, usually measured by centrality mea-sures, offer different opportunities to access the relevantsources of resources (Powell et al., 1996).To characterise theactors’ position we use two centrality measures: degreecentrality and betweenness. The degree is the number ofdirect ties one actor has to other actors in the network. Themost central company is the one with the highest number ofties (links/connections). Actors with the highest degree cen-trality are designated hubs. In directed networks, like thoseused in this paper, the degree of an actor has two differentelements. The indegree measures the total number of tiesdirected towards the actor. So a central actor receivesresources from several organisations and is characterised bya strong attractiveness. In this research only interviewedfirms have nonzero indegree values. The outdegree showsthe number of ties that depart from one actor. So a centralactor provides resources to many firms and is characterisedby a strong activity.The betweenness measures the extent towhich an actor lies between others in the network: a nodewith few ties (low degree) may play an important intermedi-ary role and so be very central. Then, the betweenness of anode indicates whether an actor plays the role of a brokerwith a potential for control over others. Brokers have impor-tant, non-redundant information to give to others, whichwould be isolated otherwise.(4)
Network cohesion: This aspect of the network structure isrelated to the extent to which the various actors are linked toeach other. There is some debate over the effects of differentnetwork configurations in terms of cohesion, i.e., more den-sely embedded or ‘‘closed’’ networks with many strong ties(Coleman, 1988), vs. more ‘‘open’’ networks with many weakties (Granovetter, 1973) and structural holes (Burt, 1992).Two measures are computed to analyse network cohesion:density and proportion of strong ties.Network density is computed as the ratio between the numberof ties present in the network and the maximum number ofpossible ties. So network density is related with network size: ingeneral terms, the larger the network, the lower its density.
A distinction is to be made between strong and weak ties, sincethey require a different amount of time, energy and money tobe developed/maintained. The literature on inter-organisational
I. Salavisa et al. / Technovation 32 (2012) 380–399 389
networks considers that the intensity of the relations can bedepicted as a function of two factors: the amount of resourcesexchanged and the frequency of contacts between two organisa-tions (Zhao and Aram, 1995). In this paper, we take a combinationof three factors to assess whether the tie is strong or weak:the frequency of contacts, the existence of multiplex ties andthe existence of ties of a different nature. In this case, a tie isconsidered strong, being represented by a thick line, when:
–
The informal contacts take place at least once a month(frequency).–
The tie is used to access different types of resources(multiplex tie).–
The firm establishes both formal and informal relations withanother organisation (nature).Networks with many strong ties are denser than those with asmaller number of strong ties. In order to characterise thestrength of the ties, we consider the proportion of strong ties,i.e., the ratio between their number and the total number of ties.
(5)
Network centralisation: This refers to centrality measurescomputed for the whole network, allowing the observationof the extent to which it has a centralised structure, i.e., astructure that is organised around its most central nodes. Ascentralisation measures are based on actors’ centrality mea-sures, this paper considers the two different perspectivesmentioned above: degree and betweenness. They vary from0 to 1, where 1 is associated to the maximum level ofcentralisation.(6)
Cohesive subgroups: Cohesive groups are groups of mutuallyconnected actors. A clique is the particular case of a sub-set ofactors, which are all connected to each other. Since thisconcept ‘‘is rather restrictive for real social networks’’ (Scott,2000: 115), the 2-clique concept is used, that is, a cliquewhere the actors are connected both directly or through acommon neighbour. In addition, only cliques with more thanthree members are taken into account. It should be men-tioned that an actor can belong to more than one clique.Finally, the clustering coefficient is considered to studycohesive subgroups. This coefficient reveals the averagedensity of the groups of actors around individuals in thenetwork, revealing the extent to which the actors’ partnersare connected to each other.3. Results and discussion
3.1. The topology of innovation networks
In this section we present the actual topology of the innova-tion networks in both sectors. This topology is captured by thenetwork diagrams sketched with Netdraw software. Figs. 1–4present the diagrams considering the type of the resource –knowledge vis-�a-vis complementary assets – and the nature ofthe relationships established in each case – formal and informalnetworks. The diagrams reveal differences between the twosectors, which seem to be more pronounced in the cases of formalaccess to complementary assets and of informal access toknowledge.
If we aggregate all the resource-based networks and build theaggregate innovation networks for each sector, the differencesbetween the diagrams are significantly reduced and the diagramsappear to be quite similar (Fig. 5). This suggests two conclusions:first, that the existing sectoral differences in the networks have tobe captured at a disaggregate level; and second, that resources
and modes of access to these resources are effectively importantsources of network variation in these two technology-intensivesectors, as we propose in our conceptual framework.
To fully capture and understand the sectoral specificities in thenetworks’ topology we have computed and analysed the abovementioned set of social network measures. Based on these data,we will first describe the features of each sector and subsequentlyconduct a comparison between them.
3.2. Main characteristics of sectoral networks
In this section we present a description of the four recon-structed networks in the two sectors, starting with biotechnology.More than providing a comprehensive description of each of thefour networks, we stress relevant differences and relate themwith the two sources of variation considered in our conceptualframework: the type of resource and the mode of access/nature ofthe tie.
3.2.1. Innovation networks in biotechnology
In terms of network size, the data (Table 6) show thatsubstantial differences emerge when we consider the nature ofthe tie. Formal networks are much larger than informal ones bothin terms of the number of actors and the number of ties,regardless of the specific resource under consideration. Formalnetworks also are more connected: they have a smaller number ofcomponents and the weight of the largest component is greater thanin informal ones (more than 90% of all actors vs. around 70%).
The composition of the networks is strongly affected by thetype of resource. As expected, firms predominate in complemen-tary assets networks and universities in knowledge networks.This result is in line with the science-driven nature of the sector(universities are the main source of knowledge) and with theneed to interact with other firms in the access to resources toexploit opportunities.
Still regarding composition, we can also find differencesbetween formal and informal networks. Universities and firmsfrom other sectors are more strongly present in formal networks.This may be related with the need to appropriate the innovationresults in the interaction with universities and powerful custo-mers. Inversely, companies in the same sector, S&T parks andfinancial institutions have a stronger presence in informal net-works, suggesting a greater informality in the interaction withthese types of actor.
Contrary to our expectations, financial institutions are rela-tively more relevant in the informal knowledge network than inthe formal complementary assets network. So, their role goesbeyond the source of financial assets. The interviews confirm theadvisory role of venture capital (VC) companies, not only onbusiness issues but also on the directions of research to pursue inthe early years.
Looking at the cohesion measures, the most obvious differ-ences are related to the nature of the tie. Therefore, sharpcontrasts between formal and informal biotech networks becomevisible again: informal networks are denser and have a higherproportion of strong ties, denoting higher levels of interaction andtrust. The very small proportion of strong ties in the formalknowledge network is consistent with the kind of technologicalalliances in this sector and their high volatility (Hagedoorn, 2002;Smith-Doerr and Powell, 2003).
The measures of the actors’ centrality also reveal differencesbetween the networks. Here, there seems to be a cross-over effectbetween the resource type and the nature of the tie. The formalcomplementary assets network shows the highest degree cen-trality, indicating a higher activity, and the highest betweenness
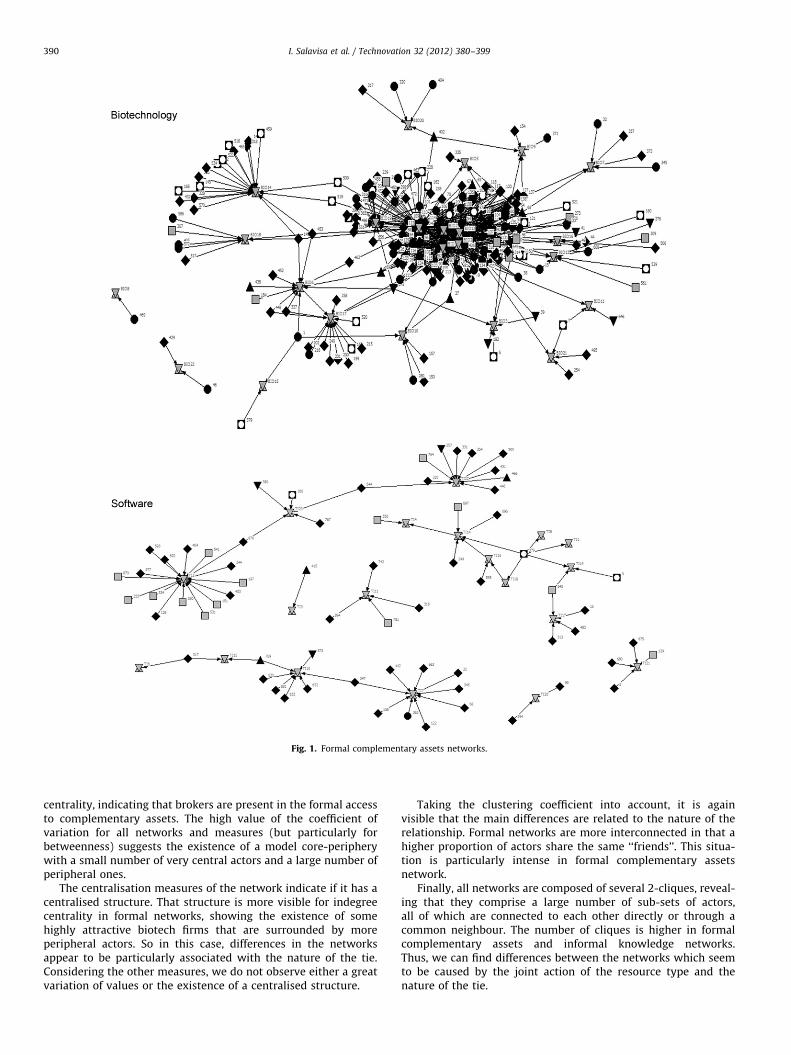
Fig. 1. Formal complementary assets networks.
I. Salavisa et al. / Technovation 32 (2012) 380–399390
centrality, indicating that brokers are present in the formal accessto complementary assets. The high value of the coefficient ofvariation for all networks and measures (but particularly forbetweenness) suggests the existence of a model core-peripherywith a small number of very central actors and a large number ofperipheral ones.
The centralisation measures of the network indicate if it has acentralised structure. That structure is more visible for indegreecentrality in formal networks, showing the existence of somehighly attractive biotech firms that are surrounded by moreperipheral actors. So in this case, differences in the networksappear to be particularly associated with the nature of the tie.Considering the other measures, we do not observe either a greatvariation of values or the existence of a centralised structure.
Taking the clustering coefficient into account, it is againvisible that the main differences are related to the nature of therelationship. Formal networks are more interconnected in that ahigher proportion of actors share the same ‘‘friends’’. This situa-tion is particularly intense in formal complementary assetsnetwork.
Finally, all networks are composed of several 2-cliques, reveal-ing that they comprise a large number of sub-sets of actors,all of which are connected to each other directly or through acommon neighbour. The number of cliques is higher in formalcomplementary assets and informal knowledge networks.Thus, we can find differences between the networks which seemto be caused by the joint action of the resource type and thenature of the tie.
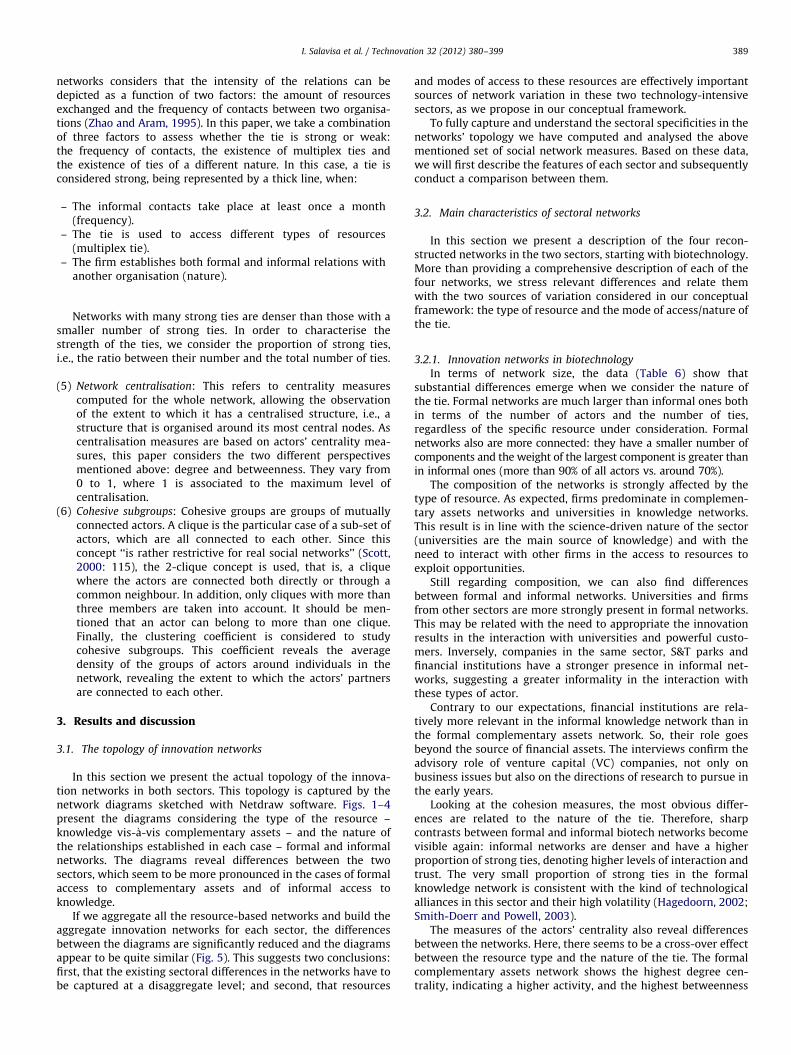
Fig. 2. Informal complementary assets networks.
I. Salavisa et al. / Technovation 32 (2012) 380–399 391
3.2.2. Innovation networks in software
We can also observe differences between the reconstructednetworks in software (Table 7). Starting with size, the distinctivefeatures are induced by the resource type and the nature of thetie. Knowledge networks are much more populated than com-plementary assets networks. Additionally, formal networks arelarger than informal networks. Data show a very similar numberof components in all networks, but the weight of the largestcomponent differs, especially if we consider the type of resource,being much higher in knowledge networks.
The composition of the networks reflects the fact that firms arethe major resource providers for the innovation process of soft-ware companies. However, we can find some variation relatedwith the type of resource and the nature of the tie. First, not
surprisingly, the relevance of universities is considerably higherto access knowledge. Second, the presence of firms from the samesector is particularly significant in informal networks, indicatingthe typical strong informal bartering at the horizontal level thatcharacterises the industry.
The density values of the various networks are quite similar.However, we can find differences related with the nature of thetie: informal networks are slightly denser. Additionally, they havea higher proportion of strong ties.
The innovation networks are highly heterogeneous in terms oftheir structure of influence and power, as denoted by the highcoefficient of variation of the centrality measures, suggesting theexistence of a model core-periphery. The average degree assumesthe same value in all networks, but betweenness centrality is
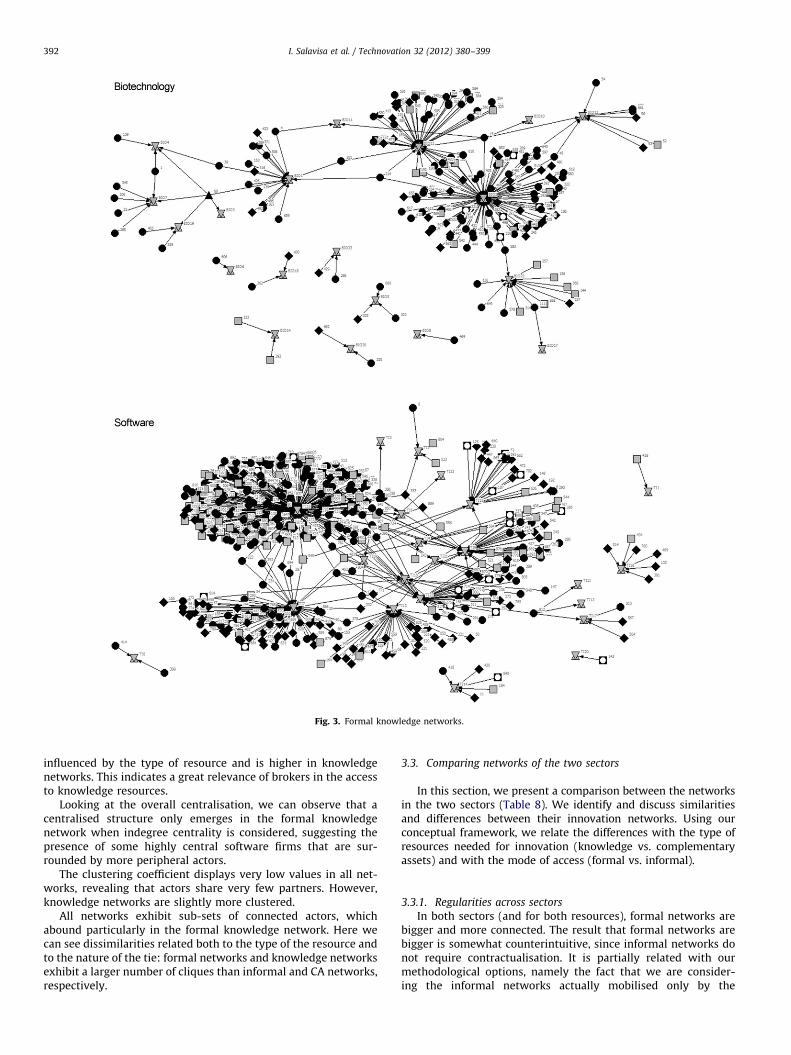
Fig. 3. Formal knowledge networks.
I. Salavisa et al. / Technovation 32 (2012) 380–399392
influenced by the type of resource and is higher in knowledgenetworks. This indicates a great relevance of brokers in the accessto knowledge resources.
Looking at the overall centralisation, we can observe that acentralised structure only emerges in the formal knowledgenetwork when indegree centrality is considered, suggesting thepresence of some highly central software firms that are sur-rounded by more peripheral actors.
The clustering coefficient displays very low values in all net-works, revealing that actors share very few partners. However,knowledge networks are slightly more clustered.
All networks exhibit sub-sets of connected actors, whichabound particularly in the formal knowledge network. Here wecan see dissimilarities related both to the type of the resource andto the nature of the tie: formal networks and knowledge networksexhibit a larger number of cliques than informal and CA networks,respectively.
3.3. Comparing networks of the two sectors
In this section, we present a comparison between the networksin the two sectors (Table 8). We identify and discuss similaritiesand differences between their innovation networks. Using ourconceptual framework, we relate the differences with the type ofresources needed for innovation (knowledge vs. complementaryassets) and with the mode of access (formal vs. informal).
3.3.1. Regularities across sectors
In both sectors (and for both resources), formal networks arebigger and more connected. The result that formal networks arebigger is somewhat counterintuitive, since informal networks donot require contractualisation. It is partially related with ourmethodological options, namely the fact that we are consider-ing the informal networks actually mobilised only by the
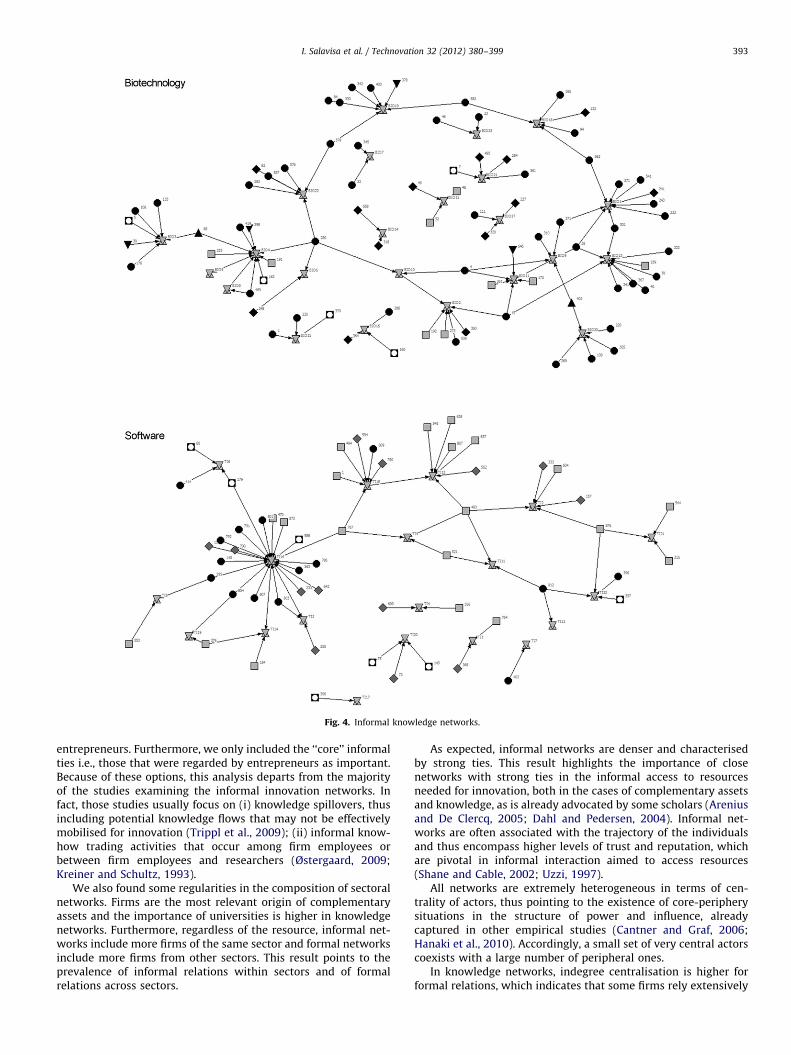
Fig. 4. Informal knowledge networks.
I. Salavisa et al. / Technovation 32 (2012) 380–399 393
entrepreneurs. Furthermore, we only included the ‘‘core’’ informalties i.e., those that were regarded by entrepreneurs as important.Because of these options, this analysis departs from the majorityof the studies examining the informal innovation networks. Infact, those studies usually focus on (i) knowledge spillovers, thusincluding potential knowledge flows that may not be effectivelymobilised for innovation (Trippl et al., 2009); (ii) informal know-how trading activities that occur among firm employees orbetween firm employees and researchers (Østergaard, 2009;Kreiner and Schultz, 1993).
We also found some regularities in the composition of sectoralnetworks. Firms are the most relevant origin of complementaryassets and the importance of universities is higher in knowledgenetworks. Furthermore, regardless of the resource, informal net-works include more firms of the same sector and formal networksinclude more firms from other sectors. This result points to theprevalence of informal relations within sectors and of formalrelations across sectors.
As expected, informal networks are denser and characterisedby strong ties. This result highlights the importance of closenetworks with strong ties in the informal access to resourcesneeded for innovation, both in the cases of complementary assetsand knowledge, as is already advocated by some scholars (Areniusand De Clercq, 2005; Dahl and Pedersen, 2004). Informal net-works are often associated with the trajectory of the individualsand thus encompass higher levels of trust and reputation, whichare pivotal in informal interaction aimed to access resources(Shane and Cable, 2002; Uzzi, 1997).
All networks are extremely heterogeneous in terms of cen-trality of actors, thus pointing to the existence of core-peripherysituations in the structure of power and influence, alreadycaptured in other empirical studies (Cantner and Graf, 2006;Hanaki et al., 2010). Accordingly, a small set of very central actorscoexists with a large number of peripheral ones.
In knowledge networks, indegree centralisation is higher forformal relations, which indicates that some firms rely extensively
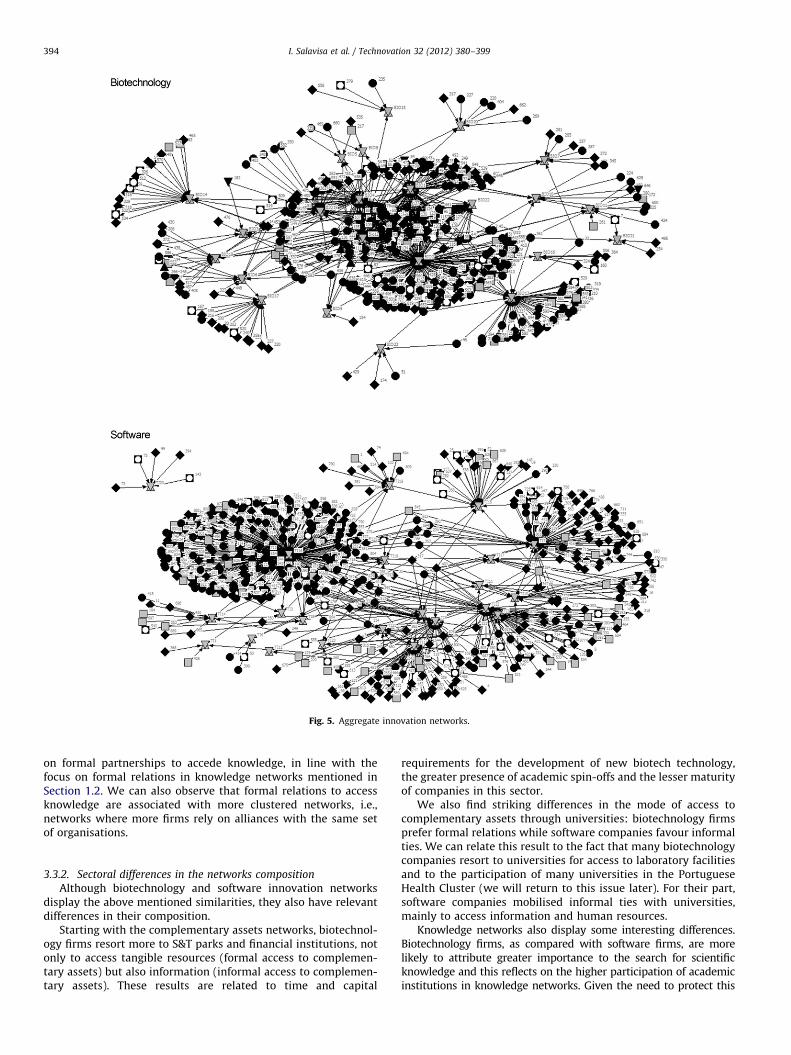
Fig. 5. Aggregate innovation networks.
I. Salavisa et al. / Technovation 32 (2012) 380–399394
on formal partnerships to accede knowledge, in line with thefocus on formal relations in knowledge networks mentioned inSection 1.2. We can also observe that formal relations to accessknowledge are associated with more clustered networks, i.e.,networks where more firms rely on alliances with the same setof organisations.
3.3.2. Sectoral differences in the networks composition
Although biotechnology and software innovation networksdisplay the above mentioned similarities, they also have relevantdifferences in their composition.
Starting with the complementary assets networks, biotechnol-ogy firms resort more to S&T parks and financial institutions, notonly to access tangible resources (formal access to complemen-tary assets) but also information (informal access to complemen-tary assets). These results are related to time and capital
requirements for the development of new biotech technology,the greater presence of academic spin-offs and the lesser maturityof companies in this sector.
We also find striking differences in the mode of access tocomplementary assets through universities: biotechnology firmsprefer formal relations while software companies favour informalties. We can relate this result to the fact that many biotechnologycompanies resort to universities for access to laboratory facilitiesand to the participation of many universities in the PortugueseHealth Cluster (we will return to this issue later). For their part,software companies mobilised informal ties with universities,mainly to access information and human resources.
Knowledge networks also display some interesting differences.Biotechnology firms, as compared with software firms, are morelikely to attribute greater importance to the search for scientificknowledge and this reflects on the higher participation of academicinstitutions in knowledge networks. Given the need to protect this
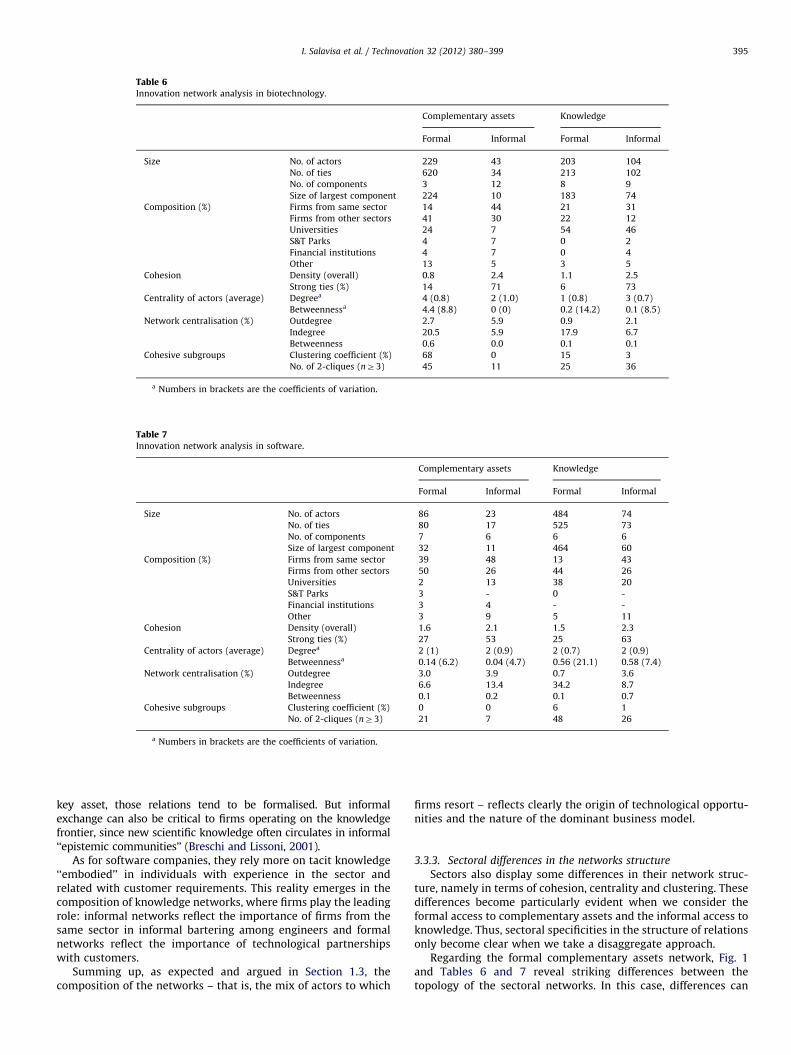
Table 6Innovation network analysis in biotechnology.
Complementary assets Knowledge
Formal Informal Formal Informal
Size No. of actors 229 43 203 104
No. of ties 620 34 213 102
No. of components 3 12 8 9
Size of largest component 224 10 183 74
Composition (%) Firms from same sector 14 44 21 31
Firms from other sectors 41 30 22 12
Universities 24 7 54 46
S&T Parks 4 7 0 2
Financial institutions 4 7 0 4
Other 13 5 3 5
Cohesion Density (overall) 0.8 2.4 1.1 2.5
Strong ties (%) 14 71 6 73
Centrality of actors (average) Degreea 4 (0.8) 2 (1.0) 1 (0.8) 3 (0.7)
Betweennessa 4.4 (8.8) 0 (0) 0.2 (14.2) 0.1 (8.5)
Network centralisation (%) Outdegree 2.7 5.9 0.9 2.1
Indegree 20.5 5.9 17.9 6.7
Betweenness 0.6 0.0 0.1 0.1
Cohesive subgroups Clustering coefficient (%) 68 0 15 3
No. of 2-cliques (nZ3) 45 11 25 36
a Numbers in brackets are the coefficients of variation.
Table 7Innovation network analysis in software.
Complementary assets Knowledge
Formal Informal Formal Informal
Size No. of actors 86 23 484 74
No. of ties 80 17 525 73
No. of components 7 6 6 6
Size of largest component 32 11 464 60
Composition (%) Firms from same sector 39 48 13 43
Firms from other sectors 50 26 44 26
Universities 2 13 38 20
S&T Parks 3 - 0 -
Financial institutions 3 4 - -
Other 3 9 5 11
Cohesion Density (overall) 1.6 2.1 1.5 2.3
Strong ties (%) 27 53 25 63
Centrality of actors (average) Degreea 2 (1) 2 (0.9) 2 (0.7) 2 (0.9)
Betweennessa 0.14 (6.2) 0.04 (4.7) 0.56 (21.1) 0.58 (7.4)
Network centralisation (%) Outdegree 3.0 3.9 0.7 3.6
Indegree 6.6 13.4 34.2 8.7
Betweenness 0.1 0.2 0.1 0.7
Cohesive subgroups Clustering coefficient (%) 0 0 6 1
No. of 2-cliques (nZ3) 21 7 48 26
a Numbers in brackets are the coefficients of variation.
I. Salavisa et al. / Technovation 32 (2012) 380–399 395
key asset, those relations tend to be formalised. But informalexchange can also be critical to firms operating on the knowledgefrontier, since new scientific knowledge often circulates in informal‘‘epistemic communities’’ (Breschi and Lissoni, 2001).
As for software companies, they rely more on tacit knowledge‘‘embodied’’ in individuals with experience in the sector andrelated with customer requirements. This reality emerges in thecomposition of knowledge networks, where firms play the leadingrole: informal networks reflect the importance of firms from thesame sector in informal bartering among engineers and formalnetworks reflect the importance of technological partnershipswith customers.
Summing up, as expected and argued in Section 1.3, thecomposition of the networks – that is, the mix of actors to which
firms resort – reflects clearly the origin of technological opportu-nities and the nature of the dominant business model.
3.3.3. Sectoral differences in the networks structure
Sectors also display some differences in their network struc-ture, namely in terms of cohesion, centrality and clustering. Thesedifferences become particularly evident when we consider theformal access to complementary assets and the informal access toknowledge. Thus, sectoral specificities in the structure of relationsonly become clear when we take a disaggregate approach.
Regarding the formal complementary assets network, Fig. 1and Tables 6 and 7 reveal striking differences between thetopology of the sectoral networks. In this case, differences can
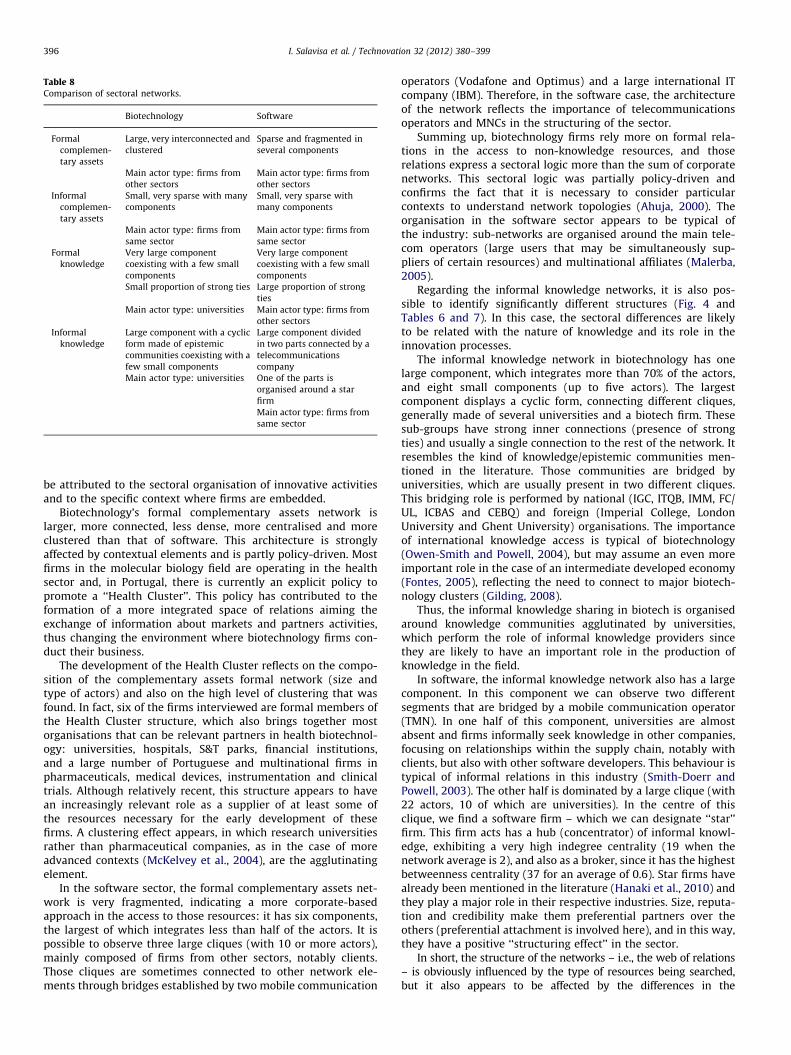
Table 8Comparison of sectoral networks.
Biotechnology Software
Formal
complemen-
tary assets
Large, very interconnected and
clustered
Sparse and fragmented in
several components
Main actor type: firms from
other sectors
Main actor type: firms from
other sectors
Informal
complemen-
tary assets
Small, very sparse with many
components
Small, very sparse with
many components
Main actor type: firms from
same sector
Main actor type: firms from
same sector
Formal
knowledge
Very large component
coexisting with a few small
components
Very large component
coexisting with a few small
components
Small proportion of strong ties Large proportion of strong
ties
Main actor type: universities Main actor type: firms from
other sectors
Informal
knowledge
Large component with a cyclic
form made of epistemic
communities coexisting with a
few small components
Large component divided
in two parts connected by a
telecommunications
company
Main actor type: universities One of the parts is
organised around a star
firm
Main actor type: firms from
same sector
I. Salavisa et al. / Technovation 32 (2012) 380–399396
be attributed to the sectoral organisation of innovative activitiesand to the specific context where firms are embedded.
Biotechnology’s formal complementary assets network islarger, more connected, less dense, more centralised and moreclustered than that of software. This architecture is stronglyaffected by contextual elements and is partly policy-driven. Mostfirms in the molecular biology field are operating in the healthsector and, in Portugal, there is currently an explicit policy topromote a ‘‘Health Cluster’’. This policy has contributed to theformation of a more integrated space of relations aiming theexchange of information about markets and partners activities,thus changing the environment where biotechnology firms con-duct their business.
The development of the Health Cluster reflects on the compo-sition of the complementary assets formal network (size andtype of actors) and also on the high level of clustering that wasfound. In fact, six of the firms interviewed are formal members ofthe Health Cluster structure, which also brings together mostorganisations that can be relevant partners in health biotechnol-ogy: universities, hospitals, S&T parks, financial institutions,and a large number of Portuguese and multinational firms inpharmaceuticals, medical devices, instrumentation and clinicaltrials. Although relatively recent, this structure appears to havean increasingly relevant role as a supplier of at least some ofthe resources necessary for the early development of thesefirms. A clustering effect appears, in which research universitiesrather than pharmaceutical companies, as in the case of moreadvanced contexts (McKelvey et al., 2004), are the agglutinatingelement.
In the software sector, the formal complementary assets net-work is very fragmented, indicating a more corporate-basedapproach in the access to those resources: it has six components,the largest of which integrates less than half of the actors. It ispossible to observe three large cliques (with 10 or more actors),mainly composed of firms from other sectors, notably clients.Those cliques are sometimes connected to other network ele-ments through bridges established by two mobile communication
operators (Vodafone and Optimus) and a large international ITcompany (IBM). Therefore, in the software case, the architectureof the network reflects the importance of telecommunicationsoperators and MNCs in the structuring of the sector.
Summing up, biotechnology firms rely more on formal rela-tions in the access to non-knowledge resources, and thoserelations express a sectoral logic more than the sum of corporatenetworks. This sectoral logic was partially policy-driven andconfirms the fact that it is necessary to consider particularcontexts to understand network topologies (Ahuja, 2000). Theorganisation in the software sector appears to be typical ofthe industry: sub-networks are organised around the main tele-com operators (large users that may be simultaneously sup-pliers of certain resources) and multinational affiliates (Malerba,2005).
Regarding the informal knowledge networks, it is also pos-sible to identify significantly different structures (Fig. 4 andTables 6 and 7). In this case, the sectoral differences are likelyto be related with the nature of knowledge and its role in theinnovation processes.
The informal knowledge network in biotechnology has onelarge component, which integrates more than 70% of the actors,and eight small components (up to five actors). The largestcomponent displays a cyclic form, connecting different cliques,generally made of several universities and a biotech firm. Thesesub-groups have strong inner connections (presence of strongties) and usually a single connection to the rest of the network. Itresembles the kind of knowledge/epistemic communities men-tioned in the literature. Those communities are bridged byuniversities, which are usually present in two different cliques.This bridging role is performed by national (IGC, ITQB, IMM, FC/UL, ICBAS and CEBQ) and foreign (Imperial College, LondonUniversity and Ghent University) organisations. The importanceof international knowledge access is typical of biotechnology(Owen-Smith and Powell, 2004), but may assume an even moreimportant role in the case of an intermediate developed economy(Fontes, 2005), reflecting the need to connect to major biotech-nology clusters (Gilding, 2008).
Thus, the informal knowledge sharing in biotech is organisedaround knowledge communities agglutinated by universities,which perform the role of informal knowledge providers sincethey are likely to have an important role in the production ofknowledge in the field.
In software, the informal knowledge network also has a largecomponent. In this component we can observe two differentsegments that are bridged by a mobile communication operator(TMN). In one half of this component, universities are almostabsent and firms informally seek knowledge in other companies,focusing on relationships within the supply chain, notably withclients, but also with other software developers. This behaviour istypical of informal relations in this industry (Smith-Doerr andPowell, 2003). The other half is dominated by a large clique (with22 actors, 10 of which are universities). In the centre of thisclique, we find a software firm – which we can designate ‘‘star’’firm. This firm acts has a hub (concentrator) of informal knowl-edge, exhibiting a very high indegree centrality (19 when thenetwork average is 2), and also as a broker, since it has the highestbetweenness centrality (37 for an average of 0.6). Star firms havealready been mentioned in the literature (Hanaki et al., 2010) andthey play a major role in their respective industries. Size, reputa-tion and credibility make them preferential partners over theothers (preferential attachment is involved here), and in this way,they have a positive ‘‘structuring effect’’ in the sector.
In short, the structure of the networks – i.e., the web of relations– is obviously influenced by the type of resources being searched,but it also appears to be affected by the differences in the
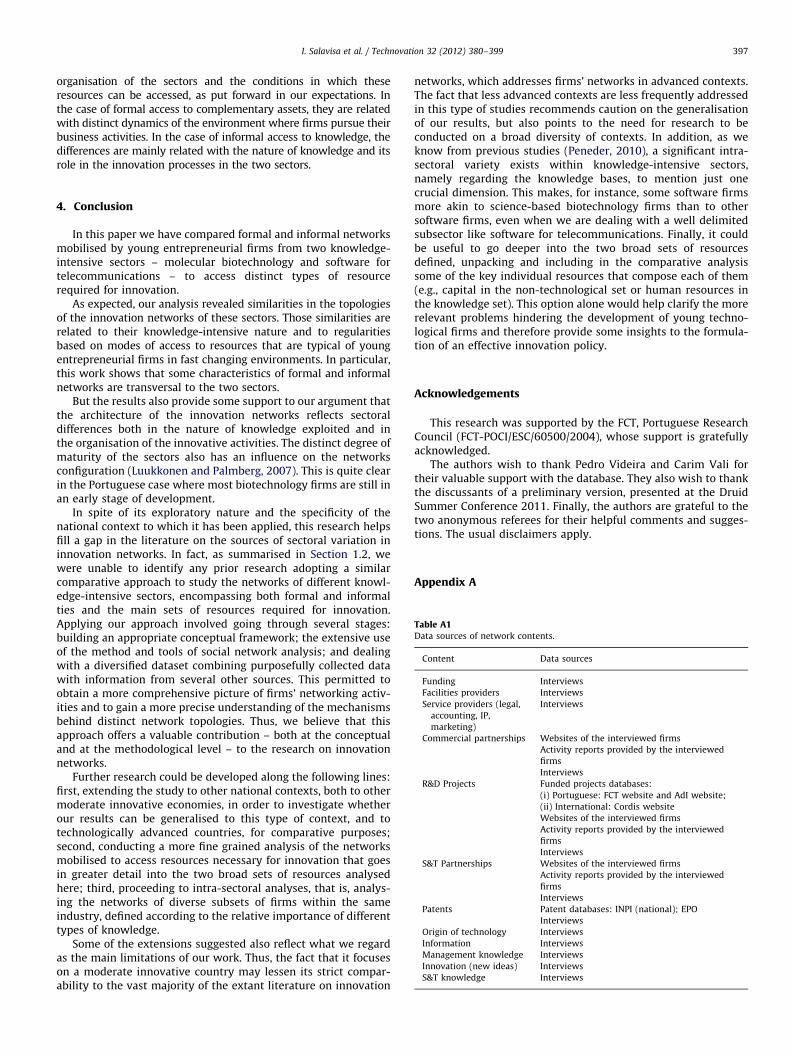
I. Salavisa et al. / Technovation 32 (2012) 380–399 397
organisation of the sectors and the conditions in which theseresources can be accessed, as put forward in our expectations. Inthe case of formal access to complementary assets, they are relatedwith distinct dynamics of the environment where firms pursue theirbusiness activities. In the case of informal access to knowledge, thedifferences are mainly related with the nature of knowledge and itsrole in the innovation processes in the two sectors.
Table A1Data sources of network contents.
Content Data sources
Funding Interviews
Facilities providers Interviews
Service providers (legal,
accounting, IP,
marketing)
Interviews
Commercial partnerships Websites of the interviewed firms
Activity reports provided by the interviewed
firms
Interviews
R&D Projects Funded projects databases:
(i) Portuguese: FCT website and AdI website;
(ii) International: Cordis website
Websites of the interviewed firms
Activity reports provided by the interviewed
firms
Interviews
S&T Partnerships Websites of the interviewed firms
Activity reports provided by the interviewed
firms
Interviews
Patents Patent databases: INPI (national); EPO
Interviews
Origin of technology Interviews
Information Interviews
Management knowledge Interviews
Innovation (new ideas) Interviews
S&T knowledge Interviews
4. Conclusion
In this paper we have compared formal and informal networksmobilised by young entrepreneurial firms from two knowledge-intensive sectors – molecular biotechnology and software fortelecommunications – to access distinct types of resourcerequired for innovation.
As expected, our analysis revealed similarities in the topologiesof the innovation networks of these sectors. Those similarities arerelated to their knowledge-intensive nature and to regularitiesbased on modes of access to resources that are typical of youngentrepreneurial firms in fast changing environments. In particular,this work shows that some characteristics of formal and informalnetworks are transversal to the two sectors.
But the results also provide some support to our argument thatthe architecture of the innovation networks reflects sectoraldifferences both in the nature of knowledge exploited and inthe organisation of the innovative activities. The distinct degree ofmaturity of the sectors also has an influence on the networksconfiguration (Luukkonen and Palmberg, 2007). This is quite clearin the Portuguese case where most biotechnology firms are still inan early stage of development.
In spite of its exploratory nature and the specificity of thenational context to which it has been applied, this research helpsfill a gap in the literature on the sources of sectoral variation ininnovation networks. In fact, as summarised in Section 1.2, wewere unable to identify any prior research adopting a similarcomparative approach to study the networks of different knowl-edge-intensive sectors, encompassing both formal and informalties and the main sets of resources required for innovation.Applying our approach involved going through several stages:building an appropriate conceptual framework; the extensive useof the method and tools of social network analysis; and dealingwith a diversified dataset combining purposefully collected datawith information from several other sources. This permitted toobtain a more comprehensive picture of firms’ networking activ-ities and to gain a more precise understanding of the mechanismsbehind distinct network topologies. Thus, we believe that thisapproach offers a valuable contribution – both at the conceptualand at the methodological level – to the research on innovationnetworks.
Further research could be developed along the following lines:first, extending the study to other national contexts, both to othermoderate innovative economies, in order to investigate whetherour results can be generalised to this type of context, and totechnologically advanced countries, for comparative purposes;second, conducting a more fine grained analysis of the networksmobilised to access resources necessary for innovation that goesin greater detail into the two broad sets of resources analysedhere; third, proceeding to intra-sectoral analyses, that is, analys-ing the networks of diverse subsets of firms within the sameindustry, defined according to the relative importance of differenttypes of knowledge.
Some of the extensions suggested also reflect what we regardas the main limitations of our work. Thus, the fact that it focuseson a moderate innovative country may lessen its strict compar-ability to the vast majority of the extant literature on innovation
networks, which addresses firms’ networks in advanced contexts.The fact that less advanced contexts are less frequently addressedin this type of studies recommends caution on the generalisationof our results, but also points to the need for research to beconducted on a broad diversity of contexts. In addition, as weknow from previous studies (Peneder, 2010), a significant intra-sectoral variety exists within knowledge-intensive sectors,namely regarding the knowledge bases, to mention just onecrucial dimension. This makes, for instance, some software firmsmore akin to science-based biotechnology firms than to othersoftware firms, even when we are dealing with a well delimitedsubsector like software for telecommunications. Finally, it couldbe useful to go deeper into the two broad sets of resourcesdefined, unpacking and including in the comparative analysissome of the key individual resources that compose each of them(e.g., capital in the non-technological set or human resources inthe knowledge set). This option alone would help clarify the morerelevant problems hindering the development of young techno-logical firms and therefore provide some insights to the formula-tion of an effective innovation policy.
Acknowledgements
This research was supported by the FCT, Portuguese ResearchCouncil (FCT-POCI/ESC/60500/2004), whose support is gratefullyacknowledged.
The authors wish to thank Pedro Videira and Carim Vali fortheir valuable support with the database. They also wish to thankthe discussants of a preliminary version, presented at the DruidSummer Conference 2011. Finally, the authors are grateful to thetwo anonymous referees for their helpful comments and sugges-tions. The usual disclaimers apply.
Appendix A
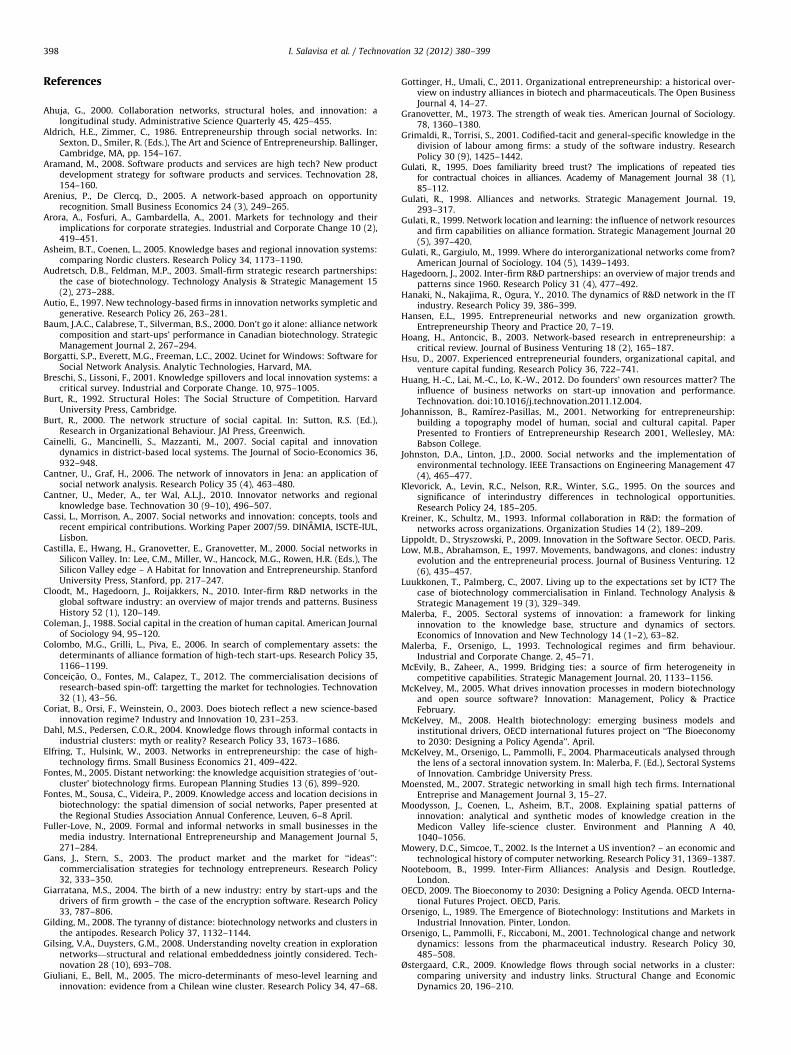
I. Salavisa et al. / Technovation 32 (2012) 380–399398
References
Ahuja, G., 2000. Collaboration networks, structural holes, and innovation: alongitudinal study. Administrative Science Quarterly 45, 425–455.
Aldrich, H.E., Zimmer, C., 1986. Entrepreneurship through social networks. In:Sexton, D., Smiler, R. (Eds.), The Art and Science of Entrepreneurship. Ballinger,Cambridge, MA, pp. 154–167.
Aramand, M., 2008. Software products and services are high tech? New productdevelopment strategy for software products and services. Technovation 28,154–160.
Arenius, P., De Clercq, D., 2005. A network-based approach on opportunityrecognition. Small Business Economics 24 (3), 249–265.
Arora, A., Fosfuri, A., Gambardella, A., 2001. Markets for technology and theirimplications for corporate strategies. Industrial and Corporate Change 10 (2),419–451.
Asheim, B.T., Coenen, L., 2005. Knowledge bases and regional innovation systems:comparing Nordic clusters. Research Policy 34, 1173–1190.
Audretsch, D.B., Feldman, M.P., 2003. Small-firm strategic research partnerships:the case of biotechnology. Technology Analysis & Strategic Management 15(2), 273–288.
Autio, E., 1997. New technology-based firms in innovation networks sympletic andgenerative. Research Policy 26, 263–281.
Baum, J.A.C., Calabrese, T., Silverman, B.S., 2000. Don’t go it alone: alliance networkcomposition and start-ups’ performance in Canadian biotechnology. StrategicManagement Journal 2, 267–294.
Borgatti, S.P., Everett, M.G., Freeman, L.C., 2002. Ucinet for Windows: Software forSocial Network Analysis. Analytic Technologies, Harvard, MA.
Breschi, S., Lissoni, F., 2001. Knowledge spillovers and local innovation systems: acritical survey. Industrial and Corporate Change. 10, 975–1005.
Burt, R., 1992. Structural Holes: The Social Structure of Competition. HarvardUniversity Press, Cambridge.
Burt, R., 2000. The network structure of social capital. In: Sutton, R.S. (Ed.),Research in Organizational Behaviour. JAI Press, Greenwich.
Cainelli, G., Mancinelli, S., Mazzanti, M., 2007. Social capital and innovationdynamics in district-based local systems. The Journal of Socio-Economics 36,932–948.
Cantner, U., Graf, H., 2006. The network of innovators in Jena: an application ofsocial network analysis. Research Policy 35 (4), 463–480.
Cantner, U., Meder, A., ter Wal, A.L.J., 2010. Innovator networks and regionalknowledge base. Technovation 30 (9–10), 496–507.
Cassi, L., Morrison, A., 2007. Social networks and innovation: concepts, tools andrecent empirical contributions. Working Paper 2007/59. DINAMIA, ISCTE-IUL,Lisbon.
Castilla, E., Hwang, H., Granovetter, E., Granovetter, M., 2000. Social networks inSilicon Valley. In: Lee, C.M., Miller, W., Hancock, M.G., Rowen, H.R. (Eds.), TheSilicon Valley edge – A Habitat for Innovation and Entrepreneurship. StanfordUniversity Press, Stanford, pp. 217–247.
Cloodt, M., Hagedoorn, J., Roijakkers, N., 2010. Inter-firm R&D networks in theglobal software industry: an overview of major trends and patterns. BusinessHistory 52 (1), 120–149.
Coleman, J., 1988. Social capital in the creation of human capital. American Journalof Sociology 94, 95–120.
Colombo, M.G., Grilli, L., Piva, E., 2006. In search of complementary assets: thedeterminants of alliance formation of high-tech start-ups. Research Policy 35,1166–1199.
Conceic- ~ao, O., Fontes, M., Calapez, T., 2012. The commercialisation decisions ofresearch-based spin-off: targetting the market for technologies. Technovation32 (1), 43–56.
Coriat, B., Orsi, F., Weinstein, O., 2003. Does biotech reflect a new science-basedinnovation regime? Industry and Innovation 10, 231–253.
Dahl, M.S., Pedersen, C.O.R., 2004. Knowledge flows through informal contacts inindustrial clusters: myth or reality? Research Policy 33, 1673–1686.
Elfring, T., Hulsink, W., 2003. Networks in entrepreneurship: the case of high-technology firms. Small Business Economics 21, 409–422.
Fontes, M., 2005. Distant networking: the knowledge acquisition strategies of ‘out-cluster’ biotechnology firms. European Planning Studies 13 (6), 899–920.
Fontes, M., Sousa, C., Videira, P., 2009. Knowledge access and location decisions inbiotechnology: the spatial dimension of social networks, Paper presented atthe Regional Studies Association Annual Conference, Leuven, 6–8 April.
Fuller-Love, N., 2009. Formal and informal networks in small businesses in themedia industry. International Entrepreneurship and Management Journal 5,271–284.
Gans, J., Stern, S., 2003. The product market and the market for ‘‘ideas’’:commercialisation strategies for technology entrepreneurs. Research Policy32, 333–350.
Giarratana, M.S., 2004. The birth of a new industry: entry by start-ups and thedrivers of firm growth – the case of the encryption software. Research Policy33, 787–806.
Gilding, M., 2008. The tyranny of distance: biotechnology networks and clusters inthe antipodes. Research Policy 37, 1132–1144.
Gilsing, V.A., Duysters, G.M., 2008. Understanding novelty creation in explorationnetworks—structural and relational embeddedness jointly considered. Tech-novation 28 (10), 693–708.
Giuliani, E., Bell, M., 2005. The micro-determinants of meso-level learning andinnovation: evidence from a Chilean wine cluster. Research Policy 34, 47–68.
Gottinger, H., Umali, C., 2011. Organizational entrepreneurship: a historical over-view on industry alliances in biotech and pharmaceuticals. The Open BusinessJournal 4, 14–27.
Granovetter, M., 1973. The strength of weak ties. American Journal of Sociology.78, 1360–1380.
Grimaldi, R., Torrisi, S., 2001. Codified-tacit and general-specific knowledge in thedivision of labour among firms: a study of the software industry. ResearchPolicy 30 (9), 1425–1442.
Gulati, R., 1995. Does familiarity breed trust? The implications of repeated tiesfor contractual choices in alliances. Academy of Management Journal 38 (1),85–112.
Gulati, R., 1998. Alliances and networks. Strategic Management Journal. 19,293–317.
Gulati, R., 1999. Network location and learning: the influence of network resourcesand firm capabilities on alliance formation. Strategic Management Journal 20(5), 397–420.
Gulati, R., Gargiulo, M., 1999. Where do interorganizational networks come from?American Journal of Sociology. 104 (5), 1439–1493.
Hagedoorn, J., 2002. Inter-firm R&D partnerships: an overview of major trends andpatterns since 1960. Research Policy 31 (4), 477–492.
Hanaki, N., Nakajima, R., Ogura, Y., 2010. The dynamics of R&D network in the ITindustry. Research Policy 39, 386–399.
Hansen, E.L., 1995. Entrepreneurial networks and new organization growth.Entrepreneurship Theory and Practice 20, 7–19.
Hoang, H., Antoncic, B., 2003. Network-based research in entrepreneurship: acritical review. Journal of Business Venturing 18 (2), 165–187.
Hsu, D., 2007. Experienced entrepreneurial founders, organizational capital, andventure capital funding. Research Policy 36, 722–741.
Huang, H.-C., Lai, M.-C., Lo, K.-W., 2012. Do founders’ own resources matter? Theinfluence of business networks on start-up innovation and performance.Technovation. doi:10.1016/j.technovation.2011.12.004.
Johannisson, B., Ramırez-Pasillas, M., 2001. Networking for entrepreneurship:building a topography model of human, social and cultural capital. PaperPresented to Frontiers of Entrepreneurship Research 2001, Wellesley, MA:Babson College.
Johnston, D.A., Linton, J.D., 2000. Social networks and the implementation ofenvironmental technology. IEEE Transactions on Engineering Management 47(4), 465–477.
Klevorick, A., Levin, R.C., Nelson, R.R., Winter, S.G., 1995. On the sources andsignificance of interindustry differences in technological opportunities.Research Policy 24, 185–205.
Kreiner, K., Schultz, M., 1993. Informal collaboration in R&D: the formation ofnetworks across organizations. Organization Studies 14 (2), 189–209.
Lippoldt, D., Stryszowski, P., 2009. Innovation in the Software Sector. OECD, Paris.Low, M.B., Abrahamson, E., 1997. Movements, bandwagons, and clones: industry
evolution and the entrepreneurial process. Journal of Business Venturing. 12(6), 435–457.
Luukkonen, T., Palmberg, C., 2007. Living up to the expectations set by ICT? Thecase of biotechnology commercialisation in Finland. Technology Analysis &Strategic Management 19 (3), 329–349.
Malerba, F., 2005. Sectoral systems of innovation: a framework for linkinginnovation to the knowledge base, structure and dynamics of sectors.Economics of Innovation and New Technology 14 (1–2), 63–82.
Malerba, F., Orsenigo, L., 1993. Technological regimes and firm behaviour.Industrial and Corporate Change. 2, 45–71.
McEvily, B., Zaheer, A., 1999. Bridging ties: a source of firm heterogeneity incompetitive capabilities. Strategic Management Journal. 20, 1133–1156.
McKelvey, M., 2005. What drives innovation processes in modern biotechnologyand open source software? Innovation: Management, Policy & PracticeFebruary.
McKelvey, M., 2008. Health biotechnology: emerging business models andinstitutional drivers, OECD international futures project on ‘‘The Bioeconomyto 2030: Designing a Policy Agenda’’. April.
McKelvey, M., Orsenigo, L., Pammolli, F., 2004. Pharmaceuticals analysed throughthe lens of a sectoral innovation system. In: Malerba, F. (Ed.), Sectoral Systemsof Innovation. Cambridge University Press.
Moensted, M., 2007. Strategic networking in small high tech firms. InternationalEntreprise and Management Journal 3, 15–27.
Moodysson, J., Coenen, L., Asheim, B.T., 2008. Explaining spatial patterns ofinnovation: analytical and synthetic modes of knowledge creation in theMedicon Valley life-science cluster. Environment and Planning A 40,1040–1056.
Mowery, D.C., Simcoe, T., 2002. Is the Internet a US invention? – an economic andtechnological history of computer networking. Research Policy 31, 1369–1387.
Nooteboom, B., 1999. Inter-Firm Alliances: Analysis and Design. Routledge,London.
OECD, 2009. The Bioeconomy to 2030: Designing a Policy Agenda. OECD Interna-tional Futures Project. OECD, Paris.
Orsenigo, L., 1989. The Emergence of Biotechnology: Institutions and Markets inIndustrial Innovation. Pinter, London.
Orsenigo, L., Pammolli, F., Riccaboni, M., 2001. Technological change and networkdynamics: lessons from the pharmaceutical industry. Research Policy 30,485–508.
Østergaard, C.R., 2009. Knowledge flows through social networks in a cluster:comparing university and industry links. Structural Change and EconomicDynamics 20, 196–210.
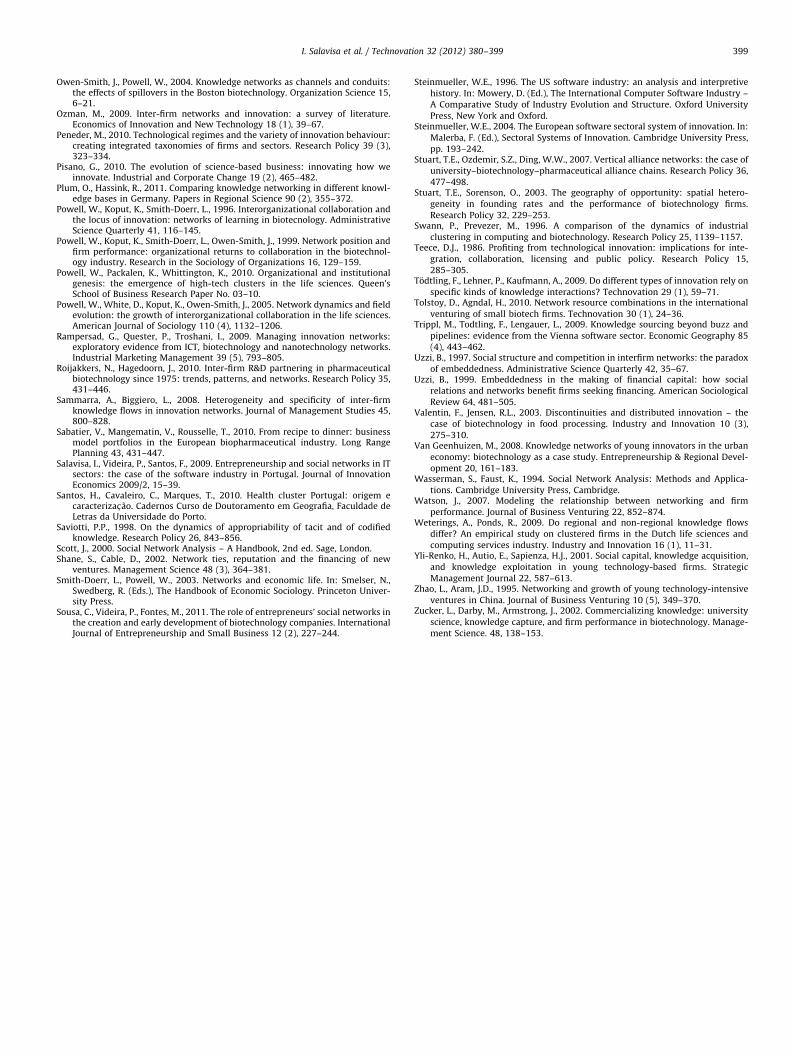
I. Salavisa et al. / Technovation 32 (2012) 380–399 399
Owen-Smith, J., Powell, W., 2004. Knowledge networks as channels and conduits:the effects of spillovers in the Boston biotechnology. Organization Science 15,6–21.
Ozman, M., 2009. Inter-firm networks and innovation: a survey of literature.Economics of Innovation and New Technology 18 (1), 39–67.
Peneder, M., 2010. Technological regimes and the variety of innovation behaviour:creating integrated taxonomies of firms and sectors. Research Policy 39 (3),323–334.
Pisano, G., 2010. The evolution of science-based business: innovating how weinnovate. Industrial and Corporate Change 19 (2), 465–482.
Plum, O., Hassink, R., 2011. Comparing knowledge networking in different knowl-edge bases in Germany. Papers in Regional Science 90 (2), 355–372.
Powell, W., Koput, K., Smith-Doerr, L., 1996. Interorganizational collaboration andthe locus of innovation: networks of learning in biotecnology. AdministrativeScience Quarterly 41, 116–145.
Powell, W., Koput, K., Smith-Doerr, L., Owen-Smith, J., 1999. Network position andfirm performance: organizational returns to collaboration in the biotechnol-ogy industry. Research in the Sociology of Organizations 16, 129–159.
Powell, W., Packalen, K., Whittington, K., 2010. Organizational and institutionalgenesis: the emergence of high-tech clusters in the life sciences. Queen’sSchool of Business Research Paper No. 03–10.
Powell, W., White, D., Koput, K., Owen-Smith, J., 2005. Network dynamics and fieldevolution: the growth of interorganizational collaboration in the life sciences.American Journal of Sociology 110 (4), 1132–1206.
Rampersad, G., Quester, P., Troshani, I., 2009. Managing innovation networks:exploratory evidence from ICT, biotechnology and nanotechnology networks.Industrial Marketing Management 39 (5), 793–805.
Roijakkers, N., Hagedoorn, J., 2010. Inter-firm R&D partnering in pharmaceuticalbiotechnology since 1975: trends, patterns, and networks. Research Policy 35,431–446.
Sammarra, A., Biggiero, L., 2008. Heterogeneity and specificity of inter-firmknowledge flows in innovation networks. Journal of Management Studies 45,800–828.
Sabatier, V., Mangematin, V., Rousselle, T., 2010. From recipe to dinner: businessmodel portfolios in the European biopharmaceutical industry. Long RangePlanning 43, 431–447.
Salavisa, I., Videira, P., Santos, F., 2009. Entrepreneurship and social networks in ITsectors: the case of the software industry in Portugal. Journal of InnovationEconomics 2009/2, 15–39.
Santos, H., Cavaleiro, C., Marques, T., 2010. Health cluster Portugal: origem ecaracterizac- ~ao. Cadernos Curso de Doutoramento em Geografia, Faculdade deLetras da Universidade do Porto.
Saviotti, P.P., 1998. On the dynamics of appropriability of tacit and of codifiedknowledge. Research Policy 26, 843–856.
Scott, J., 2000. Social Network Analysis – A Handbook, 2nd ed. Sage, London.Shane, S., Cable, D., 2002. Network ties, reputation and the financing of new
ventures. Management Science 48 (3), 364–381.Smith-Doerr, L., Powell, W., 2003. Networks and economic life. In: Smelser, N.,
Swedberg, R. (Eds.), The Handbook of Economic Sociology. Princeton Univer-sity Press.
Sousa, C., Videira, P., Fontes, M., 2011. The role of entrepreneurs’ social networks inthe creation and early development of biotechnology companies. InternationalJournal of Entrepreneurship and Small Business 12 (2), 227–244.
Steinmueller, W.E., 1996. The US software industry: an analysis and interpretivehistory. In: Mowery, D. (Ed.), The International Computer Software Industry –A Comparative Study of Industry Evolution and Structure. Oxford University
Press, New York and Oxford.Steinmueller, W.E., 2004. The European software sectoral system of innovation. In:
Malerba, F. (Ed.), Sectoral Systems of Innovation. Cambridge University Press,pp. 193–242.
Stuart, T.E., Ozdemir, S.Z., Ding, W.W., 2007. Vertical alliance networks: the case ofuniversity–biotechnology–pharmaceutical alliance chains. Research Policy 36,477–498.
Stuart, T.E., Sorenson, O., 2003. The geography of opportunity: spatial hetero-geneity in founding rates and the performance of biotechnology firms.
Research Policy 32, 229–253.Swann, P., Prevezer, M., 1996. A comparison of the dynamics of industrial
clustering in computing and biotechnology. Research Policy 25, 1139–1157.Teece, D.J., 1986. Profiting from technological innovation: implications for inte-
gration, collaboration, licensing and public policy. Research Policy 15,285–305.
Todtling, F., Lehner, P., Kaufmann, A., 2009. Do different types of innovation rely on
specific kinds of knowledge interactions? Technovation 29 (1), 59–71.Tolstoy, D., Agndal, H., 2010. Network resource combinations in the international
venturing of small biotech firms. Technovation 30 (1), 24–36.Trippl, M., Todtling, F., Lengauer, L., 2009. Knowledge sourcing beyond buzz and
pipelines: evidence from the Vienna software sector. Economic Geography 85(4), 443–462.
Uzzi, B., 1997. Social structure and competition in interfirm networks: the paradoxof embeddedness. Administrative Science Quarterly 42, 35–67.
Uzzi, B., 1999. Embeddedness in the making of financial capital: how socialrelations and networks benefit firms seeking financing. American SociologicalReview 64, 481–505.
Valentin, F., Jensen, R.L., 2003. Discontinuities and distributed innovation – thecase of biotechnology in food processing. Industry and Innovation 10 (3),
275–310.Van Geenhuizen, M., 2008. Knowledge networks of young innovators in the urban
economy: biotechnology as a case study. Entrepreneurship & Regional Devel-opment 20, 161–183.
Wasserman, S., Faust, K., 1994. Social Network Analysis: Methods and Applica-tions. Cambridge University Press, Cambridge.
Watson, J., 2007. Modeling the relationship between networking and firmperformance. Journal of Business Venturing 22, 852–874.
Weterings, A., Ponds, R., 2009. Do regional and non-regional knowledge flowsdiffer? An empirical study on clustered firms in the Dutch life sciences andcomputing services industry. Industry and Innovation 16 (1), 11–31.
Yli-Renko, H., Autio, E., Sapienza, H.J., 2001. Social capital, knowledge acquisition,and knowledge exploitation in young technology-based firms. Strategic
Management Journal 22, 587–613.Zhao, L., Aram, J.D., 1995. Networking and growth of young technology-intensive
ventures in China. Journal of Business Venturing 10 (5), 349–370.Zucker, L., Darby, M., Armstrong, J., 2002. Commercializing knowledge: university
science, knowledge capture, and firm performance in biotechnology. Manage-ment Science. 48, 138–153.
Related Documents