White Rose Research Online http://eprints.whiterose.ac.uk/ This is an author produced version of a paper published in Journal of Physics: Condensed Matter. White Rose Repository URL for this paper: http://eprints.whiterose.ac.uk/1958/ Published paper Ojovan, M.I. and Lee, W.E. (2006) Topologically disordered systems at the glass transition. Journal of Physics: Condensed Matter, 18 (50). pp. 11507-11520. White Rose Research Online [email protected]

Welcome message from author
This document is posted to help you gain knowledge. Please leave a comment to let me know what you think about it! Share it to your friends and learn new things together.
Transcript
White Rose Research Online http://eprints.whiterose.ac.uk/
This is an author produced version of a paper published in Journal of Physics: Condensed Matter. White Rose Repository URL for this paper: http://eprints.whiterose.ac.uk/1958/
Published paper Ojovan, M.I. and Lee, W.E. (2006) Topologically disordered systems at the glass transition. Journal of Physics: Condensed Matter, 18 (50). pp. 11507-11520.
White Rose Research Online [email protected]
1
Topologically-disordered systems at the glass transition Michael I Ojovan1 and William E Lee2 1Immobilisation Science Laboratory, Department of Engineering Materials, University of Sheffield, E-mail: [email protected] 2Department of Materials, Imperial College London, E-mail: [email protected]
Abstract The thermodynamic approach to the viscosity and fragility of amorphous oxides was used to determine the topological characteristics of the disordered network forming systems. Instead of the disordered system of atoms we considered the congruent disordered system of interconnecting bonds. The Gibbs free energy of network breaking defects (configurons) was found based on available viscosity data. Amorphous silica and germania were used as reference disordered systems for which we found an excellent agreement of calculated and measured glass transition temperatures. We revealed that the Hausdorff dimension of the system of bonds changes from Euclidian three-dimensional below to fractal 2.55±0.05- dimensional geometry above the glass transition temperature.
PACS: 61.43.-j Disordered solids; 64.70.Pf Glass transitions; 71.55.Jv Disordered structures; amorphous and glassy solids. Keywords: Amorphous materials; liquids, glasses; glass transition; topological disorder; percolation;
1. Introduction The distribution of atoms and molecules in amorphous materials is irregular and is described as topologically disordered in that an amorphous material cannot be produced by continuously distorting a crystalline lattice. There is an enormous diversity of amorphous materials, including: covalently-bonded oxide glasses such as vitreous silica, the structure of which is modelled by a continuous random network of bonds (network-forming materials); metallic glasses bonded by isotropic pair potentials, whose structure is thought of as a dense random packing of spheres; and amorphous polymers, whose structure is understood to be an arrangement of interpenetrating random-walk-like coils strongly entangled with each other. Amorphous materials can be in two forms: either as viscous liquids or glasses. A glass is a disordered material like a viscous liquid but which behaves mechanically like an isotropic solid. Although fundamentally important the nature of the glassy state is not well understood neither for ordinary glasses such as vitreous oxides nor for spin glasses [1, 2]. Moreover it is recognised that the theory of ordinary glasses may suffer from a lack of commonly accepted simplified models analogous to that of spin glasses such as the Edwards-Anderson model [2]. A glass is most commonly formed by cooling a viscous liquid fast enough to avoid crystallization. Practically any liquid crystallizes if the cooling rate is sufficiently slow hence there is a critical cooling rate above which a liquid can be vitrified. On cooling the viscosities of liquids gradually increase and the liquid-glass transition is often regarded as a transition for practical purposes rather than a thermodynamic phase transition [3]: by general agreement it is considered that a liquid on being cooled becomes a glass when the viscosity equals 1012 Pa⋅s (1013 poise) or where the relaxation time is 102 s [3, 4]. The liquid-glass transition is accompanied by spectacular changes in physical properties (e.g. glasses are rigid whereas supercooled liquids are soft) however no obvious changes occur at the molecular level and the material is topologically disordered both in liquid and glassy states [5]. However at the glass transition temperature, Tg, rearrangements occur in an amorphous material so that the Tg can be exactly detected analysing for example the behaviour of derivative parameters such as the coefficient of thermal expansion or the specific heat [6]. As a result the glass transition is considered as a second order phase transition in which a supercooled melt yields, on cooling, a glassy structure and properties similar to those of crystalline materials e.g. of an isotropic solid material [7]. The theory of second order phase transitions describes the temperature behaviour of the specific heat (Cp) near Tg by the power law
αgp TTTC −∝ /1)( , where α is the universal critical exponent [8]. The specific heat of either a
supercooled liquid or equilibrium melt )(, TC liquidp is higher than that of a glass )(, TC glassp , the
thermal expansion coefficient of a liquid )(Tliquidα is higher than that of a glass )(Tglassα , and the
2
isothermal compressibility of a liquid liquidκ is higher than that of a glass glassκ . The differences in
specific heat pC∆ , thermal expansion coefficient α∆ and isothermal compressibility κ∆ at second
order phase transitions obey two Ehrenfest theorems α∆=∆ )/( dTdPTCp and
)/( dTdPκα ∆=∆ , where P is pressure [8]. Indeed at the liquid-glass transition the two Ehrenfest
theorems for the pressure dependence of transition temperature dPdTg / are approximately obeyed [9]. Although kinetic approaches enable justification of these theorems [9] the glass transition shows distinctly thermodynamic phase transition features [7, 10]. However, being a kinetically-controlled phenomenon the liquid-glass transition exhibits a range of Tg which depend on the cooling rate with maximal Tg at highest rates of cooling [6]. Thus the liquid-glass transition has features both in common with second order thermodynamic phase transitions and of kinetic origin [6, 8].
Liquid-glass transition phenomena are observed universally in various types of liquids, including molecular liquids, ionic liquids, metallic liquids, oxides, and chalcogenides [11-15]. There is no long range order in amorphous materials, however at the liquid-glass transition a kind of freezing transition occurs which is similar to that of second-order phase transitions and which it may be possible to characterise using an order parameter [2]. In addition because the ordered system (and the glass state seems to be more ordered than the liquid one) has a higher symmetry the question of the symmetry arises for disordered systems at the liquid-glass transition [2]. The general theoretical description of the topologically disordered glassy state focuses on tessellations [16] and is based on partitioning space into a set of Voronoi polyhedrons filling the space of a disordered material. A Voronoi polyhedron is a unit cell around each structural unit (atom, defect, group of atoms) which contains all the points closer to this unit than to any other and is an analogue of the Wigner-Seitz cell in crystals [3]. For an amorphous material the topological and metric characteristics of the Voronoi polyhedron of a given unit are defined by its nearest neighbours so that its structure may be characterised by a distribution of Voronoi polyhedrons. Considerable progress has been achieved in investigating the structure and distribution of Voronoi polyhedrons of amorphous materials using molecular dynamic (MD) models [17-20]. MD simulations reveal that the difference between a liquid and glassy state of an amorphous material is caused by the formation of percolation clusters in the Voronoi network: namely in the liquid state low density atomic configurations form a percolation cluster whereas such a percolation cluster does not occur in the glassy state [17, 20]. The percolation cluster made of low density atomic configurations was called a liquid-like cluster as it occurs only in a liquid and does not occur in the glassy state. Nonetheless, a percolation cluster can be envisaged in the glassy state but formed by high density configurations [17, 18]. Solid-like percolation clusters made of high density configurations seems to exist in all glass phase models of spherical atoms and dense spheres [17, 18]. Thus MD simulations demonstrate that near Tg the interconnectivity of atoms (e.g. the geometry of bonds) changes due to the formation of percolation clusters composed of coordination Voronoi polyhedrons. While these percolation clusters made of Voronoi polyhedrons are more mathematical descriptors than physical objects their formation results in changes in the derivative properties of materials near the Tg [18]. The liquid-glass transition is thus characterised by a fundamental change in the bond geometries so that this change can be used to distinguish liquids from glasses although both have amorphous structures [17, 21].
The purpose of this work is to analyse the disordered structure of bonds and the spatial distribution of defects which break the net of bonds of an amorphous material with temperature. We used for numerical analysis two binary systems: amorphous silica and germania as the simplest glass forming materials. Thermodynamic data for broken bonds were evaluated based on recent results on the viscosity of amorphous materials treated theoretically by use of Doremus’ defect model of viscosity [22-24]. This model relates the viscosity of an amorphous material to the concentration of broken bonds (defects) which are believed to be responsible for the viscous flow [22]. Given some known thermodynamic parameters of point defects analytical evaluation of their concentration becomes feasible (including in high concentration areas) as does determination of temperature ranges where dynamic percolation clusters made of broken bonds are formed [21, 25, 26].
Recognition of the role of interconnectivity of the microscopic elements of disordered systems and application of percolation theory has enabled the development of the statistical physics of disordered systems [26]. Amorphous materials have no elementary cell characterised by a certain symmetry,
3
which can reproduce the distribution of atoms by its infinite repetition. Instead the symmetry of a topologically disordered system is characterised by the Hausdorff dimension of interconnecting and broken bonds. Two types of topological disorder characterised by different symmetries can be revealed in an amorphous material based on the analysis of broken bond concentrations: (i) 3-dimensional, 3D (Euclidean), which occurs at low temperatures when no percolation clusters are formed and the geometrical structures of bonds can be characterised as a 3-D with no preferential pathways of motion and (ii) df=2.55±0.05-dimensional (fractal), which occurs at high temperatures when percolation clusters made of broken bonds are formed and the geometries of the structures formed can be characterised as fractal objects with preferential pathways for defect (broken bond) motion. Similarly to MD results [17, 18] we revealed that the geometry of bonds changes at Tg: the distribution of net defects is Euclidean below the Tg but becomes fractal above it due to the formation of dynamic percolation clusters made of broken bonds. The glassy state is characterised by a Euclidean 3-dimensional distribution of bonds and the liquid state is characterised by a fractal 2.55±0.05 dimensional distribution. Our results are consistent with results of MD models and reflect the same change of the geometry of atom distribution in amorphous materials at Tg, namely the change of the symmetry of distribution. Thus the transition from a glassy to a supercooled liquid state can be treated as a change in the symmetry of topological disorder. This makes the liquid-glass transition similar to second order thermodynamic phase transitions in crystalline materials which are always characterised by symmetry changes [8].
2. Formation of network breaking defects
Binary oxide systems that form network glasses are of significant scientific and technological importance and there is a need for a detailed knowledge of their structure. However, for the disordered atomic arrangement which occurs in amorphous materials a precise structure description over a wide range of length scales is notoriously difficult to obtain. The atomic sites form a topologically-disordered network, and the presence of two chemical species adds further complexity. The identity of the atom occupying a particular site needs to be specified and information is also required on the chemical ordering and hence on how the concentration of a particular species varies across the network. Recent investigations show that the glassy phase has two characteristic length scales at distances larger than the nearest neighbour. One is associated with the intermediate range, and the other is associated with an extended range, which relates to a propagation of short range ordering [27].
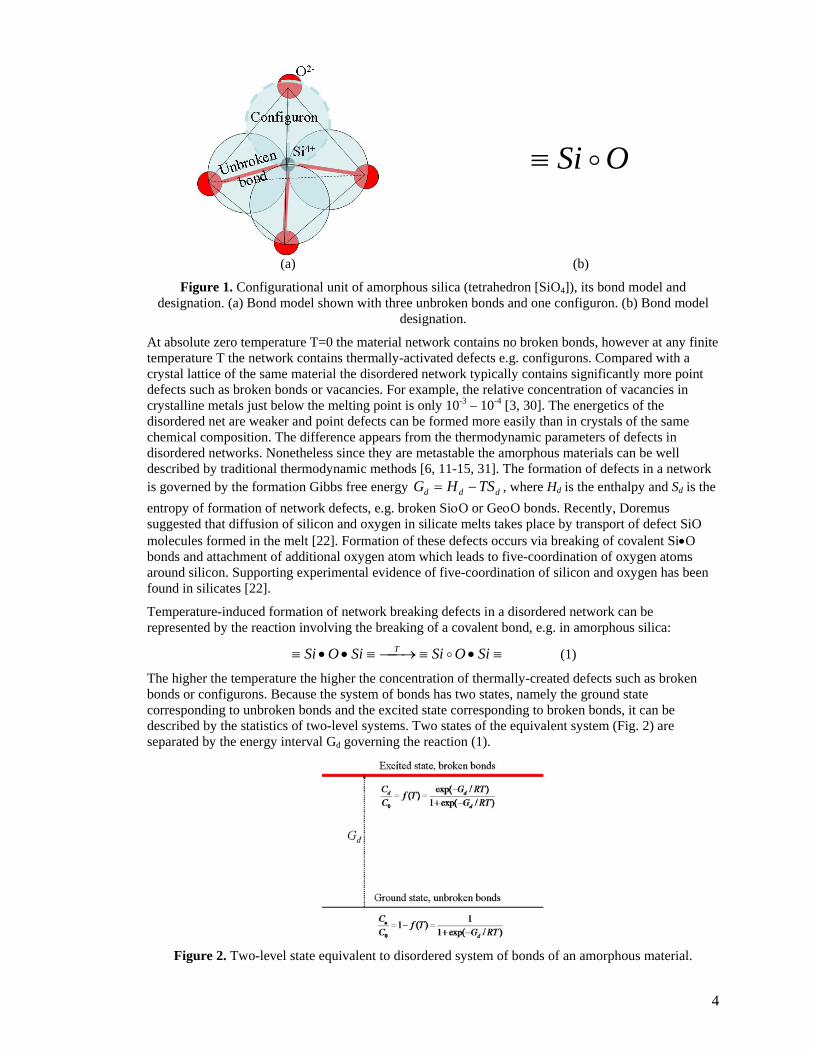
Consider an ideal disordered network representing a binary oxide system such as amorphous SiO2 or GeO2. The three-dimensional (3D) disordered network in these oxides is formed by [SiO4] or [GeO4] tetrahedra interconnected via bridging oxygens ≡Si•O•Si≡, where • designates a bond between Si and O, and – designates a bridging oxygen atom with two bonds •O•. The ideal network can also contain some point defects in the form of broken bonds ≡SiοO•Si≡, where ο designates a broken bond between Si and O. Each broken bond, which is typically associated with strain-release and local adjustment of centres of atomic vibration, is treated as an elementary configurational excitation in the system of bonds and is termed a configuron [28]. Using Angell’s bond lattice model we can represent condensed phases by their bond network structures [28, 29]. Thus we can focus our attention on temperature changes that occur in the system of interconnecting bonds of a disordered material rather than of atoms. In this approach the initial set of N strongly interacting cations such as Si+4 or Ge+4 is replaced by a congruent set of weakly interacting bonds of the system. The number of bonds will be Nb=NZ where Z is the coordination number of cations e.g. Z=4 for SiO2 and GeO2. For amorphous materials which have no bridging atoms such as oxygen in SiO2 and GeO2 or chlorine in ZnCl2, i.e. for amorphous Fe or Ge, Nb = NZ/2. Fig. 1 illustrates the replacement of atomic structure by the congruent bond structure being either unbroken or broken for amorphous silica when one of four Si•O bonds in the configurational [SiO4] tetrahedron is broken.
4
OSi o≡
(a) (b)
Figure 1. Configurational unit of amorphous silica (tetrahedron [SiO4]), its bond model and designation. (a) Bond model shown with three unbroken bonds and one configuron. (b) Bond model
designation.
At absolute zero temperature T=0 the material network contains no broken bonds, however at any finite temperature T the network contains thermally-activated defects e.g. configurons. Compared with a crystal lattice of the same material the disordered network typically contains significantly more point defects such as broken bonds or vacancies. For example, the relative concentration of vacancies in crystalline metals just below the melting point is only 10-3 – 10-4 [3, 30]. The energetics of the disordered net are weaker and point defects can be formed more easily than in crystals of the same chemical composition. The difference appears from the thermodynamic parameters of defects in disordered networks. Nonetheless since they are metastable the amorphous materials can be well described by traditional thermodynamic methods [6, 11-15, 31]. The formation of defects in a network is governed by the formation Gibbs free energy ddd TSHG −= , where Hd is the enthalpy and Sd is the entropy of formation of network defects, e.g. broken SiοO or GeοO bonds. Recently, Doremus suggested that diffusion of silicon and oxygen in silicate melts takes place by transport of defect SiO molecules formed in the melt [22]. Formation of these defects occurs via breaking of covalent Si•O bonds and attachment of additional oxygen atom which leads to five-coordination of oxygen atoms around silicon. Supporting experimental evidence of five-coordination of silicon and oxygen has been found in silicates [22].
Temperature-induced formation of network breaking defects in a disordered network can be represented by the reaction involving the breaking of a covalent bond, e.g. in amorphous silica:
≡•≡⎯→⎯≡••≡ SiOSiSiOSi T o (1)
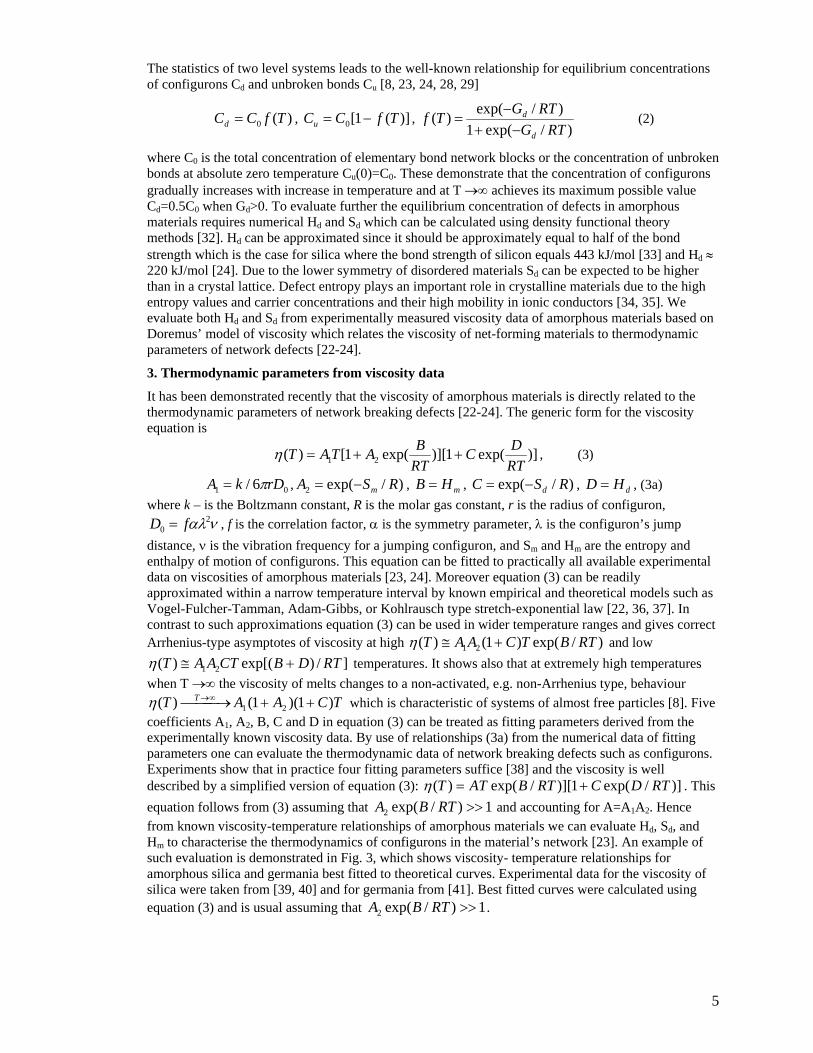
The higher the temperature the higher the concentration of thermally-created defects such as broken bonds or configurons. Because the system of bonds has two states, namely the ground state corresponding to unbroken bonds and the excited state corresponding to broken bonds, it can be described by the statistics of two-level systems. Two states of the equivalent system (Fig. 2) are separated by the energy interval Gd governing the reaction (1).
Figure 2. Two-level state equivalent to disordered system of bonds of an amorphous material.
5
The statistics of two level systems leads to the well-known relationship for equilibrium concentrations of configurons Cd and unbroken bonds Cu [8, 23, 24, 28, 29]
)(0 TfCCd = , )](1[0 TfCCu −= , )/exp(1
)/exp()(RTG
RTGTfd
d
−+−
= (2)
where C0 is the total concentration of elementary bond network blocks or the concentration of unbroken bonds at absolute zero temperature Cu(0)=C0. These demonstrate that the concentration of configurons gradually increases with increase in temperature and at T →∞ achieves its maximum possible value Cd=0.5C0 when Gd>0. To evaluate further the equilibrium concentration of defects in amorphous materials requires numerical Hd and Sd which can be calculated using density functional theory methods [32]. Hd can be approximated since it should be approximately equal to half of the bond strength which is the case for silica where the bond strength of silicon equals 443 kJ/mol [33] and Hd ≈ 220 kJ/mol [24]. Due to the lower symmetry of disordered materials Sd can be expected to be higher than in a crystal lattice. Defect entropy plays an important role in crystalline materials due to the high entropy values and carrier concentrations and their high mobility in ionic conductors [34, 35]. We evaluate both Hd and Sd from experimentally measured viscosity data of amorphous materials based on Doremus’ model of viscosity which relates the viscosity of net-forming materials to thermodynamic parameters of network defects [22-24].
3. Thermodynamic parameters from viscosity data
It has been demonstrated recently that the viscosity of amorphous materials is directly related to the thermodynamic parameters of network breaking defects [22-24]. The generic form for the viscosity equation is
)]exp(1)][exp(1[)( 21 RTDC
RTBATAT ++=η , (3)
01 6/ rDkA π= , )/exp(2 RSA m−= , mHB = , )/exp( RSC d−= , dHD = , (3a) where k – is the Boltzmann constant, R is the molar gas constant, r is the radius of configuron,
ναλ20 fD = , f is the correlation factor, α is the symmetry parameter, λ is the configuron’s jump
distance, ν is the vibration frequency for a jumping configuron, and Sm and Hm are the entropy and enthalpy of motion of configurons. This equation can be fitted to practically all available experimental data on viscosities of amorphous materials [23, 24]. Moreover equation (3) can be readily approximated within a narrow temperature interval by known empirical and theoretical models such as Vogel-Fulcher-Tamman, Adam-Gibbs, or Kohlrausch type stretch-exponential law [22, 36, 37]. In contrast to such approximations equation (3) can be used in wider temperature ranges and gives correct Arrhenius-type asymptotes of viscosity at high )/exp()1()( 21 RTBTCAAT +≅η and low
]/)exp[()( 21 RTDBCTAAT +≅η temperatures. It shows also that at extremely high temperatures when T →∞ the viscosity of melts changes to a non-activated, e.g. non-Arrhenius type, behaviour
TCAAT T )1)(1()( 21 ++⎯⎯ →⎯ ∞→η which is characteristic of systems of almost free particles [8]. Five coefficients A1, A2, B, C and D in equation (3) can be treated as fitting parameters derived from the experimentally known viscosity data. By use of relationships (3a) from the numerical data of fitting parameters one can evaluate the thermodynamic data of network breaking defects such as configurons. Experiments show that in practice four fitting parameters suffice [38] and the viscosity is well described by a simplified version of equation (3): )]/exp(1)][/exp()( RTDCRTBATT +=η . This equation follows from (3) assuming that 1)/exp(2 >>RTBA and accounting for A=A1A2. Hence from known viscosity-temperature relationships of amorphous materials we can evaluate Hd, Sd, and Hm to characterise the thermodynamics of configurons in the material’s network [23]. An example of such evaluation is demonstrated in Fig. 3, which shows viscosity- temperature relationships for amorphous silica and germania best fitted to theoretical curves. Experimental data for the viscosity of silica were taken from [39, 40] and for germania from [41]. Best fitted curves were calculated using equation (3) and is usual assuming that 1)/exp(2 >>RTBA .
6
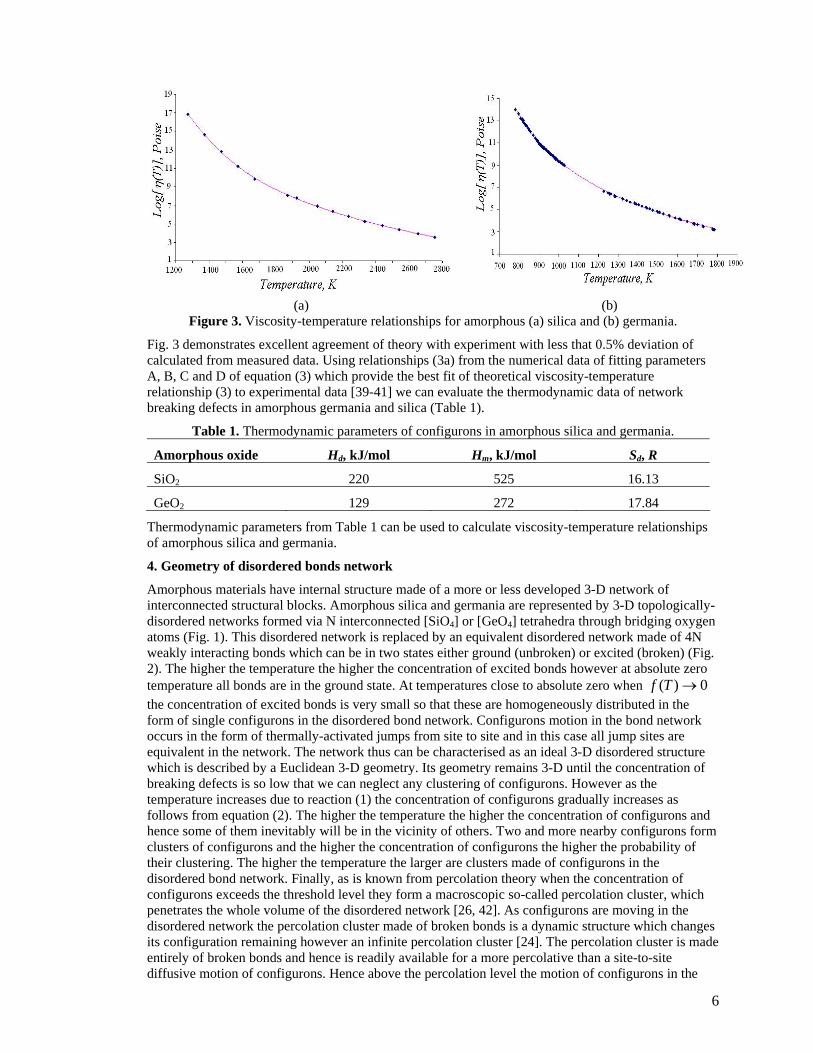
(a) (b) Figure 3. Viscosity-temperature relationships for amorphous (a) silica and (b) germania.
Fig. 3 demonstrates excellent agreement of theory with experiment with less that 0.5% deviation of calculated from measured data. Using relationships (3a) from the numerical data of fitting parameters A, B, C and D of equation (3) which provide the best fit of theoretical viscosity-temperature relationship (3) to experimental data [39-41] we can evaluate the thermodynamic data of network breaking defects in amorphous germania and silica (Table 1).
Table 1. Thermodynamic parameters of configurons in amorphous silica and germania.
Amorphous oxide Hd, kJ/mol Hm, kJ/mol Sd, R
SiO2 220 525 16.13
GeO2 129 272 17.84
Thermodynamic parameters from Table 1 can be used to calculate viscosity-temperature relationships of amorphous silica and germania.
4. Geometry of disordered bonds network
Amorphous materials have internal structure made of a more or less developed 3-D network of interconnected structural blocks. Amorphous silica and germania are represented by 3-D topologically-disordered networks formed via N interconnected [SiO4] or [GeO4] tetrahedra through bridging oxygen atoms (Fig. 1). This disordered network is replaced by an equivalent disordered network made of 4N weakly interacting bonds which can be in two states either ground (unbroken) or excited (broken) (Fig. 2). The higher the temperature the higher the concentration of excited bonds however at absolute zero temperature all bonds are in the ground state. At temperatures close to absolute zero when 0)( →Tf the concentration of excited bonds is very small so that these are homogeneously distributed in the form of single configurons in the disordered bond network. Configurons motion in the bond network occurs in the form of thermally-activated jumps from site to site and in this case all jump sites are equivalent in the network. The network thus can be characterised as an ideal 3-D disordered structure which is described by a Euclidean 3-D geometry. Its geometry remains 3-D until the concentration of breaking defects is so low that we can neglect any clustering of configurons. However as the temperature increases due to reaction (1) the concentration of configurons gradually increases as follows from equation (2). The higher the temperature the higher the concentration of configurons and hence some of them inevitably will be in the vicinity of others. Two and more nearby configurons form clusters of configurons and the higher the concentration of configurons the higher the probability of their clustering. The higher the temperature the larger are clusters made of configurons in the disordered bond network. Finally, as is known from percolation theory when the concentration of configurons exceeds the threshold level they form a macroscopic so-called percolation cluster, which penetrates the whole volume of the disordered network [26, 42]. As configurons are moving in the disordered network the percolation cluster made of broken bonds is a dynamic structure which changes its configuration remaining however an infinite percolation cluster [24]. The percolation cluster is made entirely of broken bonds and hence is readily available for a more percolative than a site-to-site diffusive motion of configurons. Hence above the percolation level the motion of configurons in the
7
bond network occurs via preferred pathways through the percolation cluster. The percolation cluster is also called an infinite cluster as it penetrates the whole volume of material which as a result is expected to drastically change its physical properties from solid-like below to fluid-like above the percolation threshold [18, 21]. The geometry of a percolation cluster is fractal with the Hausdorff dimension
νβ /−= dd f , where β and ν are critical exponents (indexes) and d=3 is the dimension of the space
occupied by the initial disordered network, so that 0.052.55 ±=fd [26, 42]. Above the percolation threshold the disordered bond network can be characterised for moving configurons as a fractal disordered structure which is described by a fractal fd -dimensional geometry. Hence when considering configurons’ motion in the disordered network its geometry is Euclidean three-dimensional at low temperatures and low defect concentrations, whereas at high temperature when the broken bond concentration is above the percolation threshold it changes to a fractal one with Hausdorff dimension df=2.55±0.05. The formation of percolation cluster changes the topology of bonds network from the 3-D Euclidean below to the fractal fd -dimensional above the percolation threshold.
An amorphous material is represented by a disordered bond network at all temperatures, however it has a uniform 3-D distribution of network breaking defects at low concentrations in a glassy state and a fractal fd -dimensional distribution at high enough temperatures when their concentration exceeds the percolation threshold in the liquid state. Changes that occur in the geometries of amorphous material at Tg affect their mechanical properties. Above Tg as the geometry is fractal as in liquids [20] the mechanical properties are similar to those of liquids. The network of material remains disordered at all temperatures although the space distribution of configurons as seen above is different below and above the percolation threshold changing the geometry from the Euclidean to fractal. Although to a certain extent being disordered at all temperatures the bond network above the percolation threshold becomes more ordered as a significant fraction of broken bonds belong to the percolation cluster.
Crystalline materials are characterised by 3-D Euclidean geometries below their melting point Tm. Hence glasses below Tg and crystals below Tm are characterised by the same 3-D geometry. Glasses behave like isotropic solids and are brittle. Because of the 3-D bond geometry glasses are brittle materials which break abruptly and the fracture surfaces of glasses typically appear flat in the ‘‘mirror’’ zone. It is known however, when analyzed at the nanometre scale with an atomic force microscope, they reveal a roughness which is similar to the one exhibited by metallic fracture surfaces [43]. Glasses change their bond geometry at Tg. When melting occurs the geometry of crystalline materials also changes, as revealed by MD experiments to fractal structure with df≈2.6 [20]. Table 2 summarises the changes in the geometry of bond structures of both amorphous and crystalline structures.
Table 2. Hausdorff dimensions of bond structures.
Temperature 0 < T < Tg Tg < T < Tm T > Tm
Amorphous material state Solid Liquid
Hausdorff dimension of bond structure d=3 df=2.55±0.05
Crystalline material state Solid Liquid
Hausdorff dimension of bond structure d=3 df≈2.6
5. Glass-liquid transition
As the bond network of an amorphous material is disordered the concentration of configurons at which the percolation threshold is achieved can be found using the universal critical percolation density cθ , which remains the same for both ordered and disordered lattices [26, 42, 44]. The relative concentration of defects is given by 0/)( CCTf d= which shows that the higher the temperature the higher is
)(Tf . Assuming that at 1/ 0 =CCd the space is completely filled by configurons we can designate )(Tf as the volume fraction of space occupied by randomly distributed configurons. Thus the critical
temperature Tg at which the percolation level is achieved can be found assuming that the configurons achieve the universal critical density given by the percolation theory
8
cgTf θ=)( , (4)
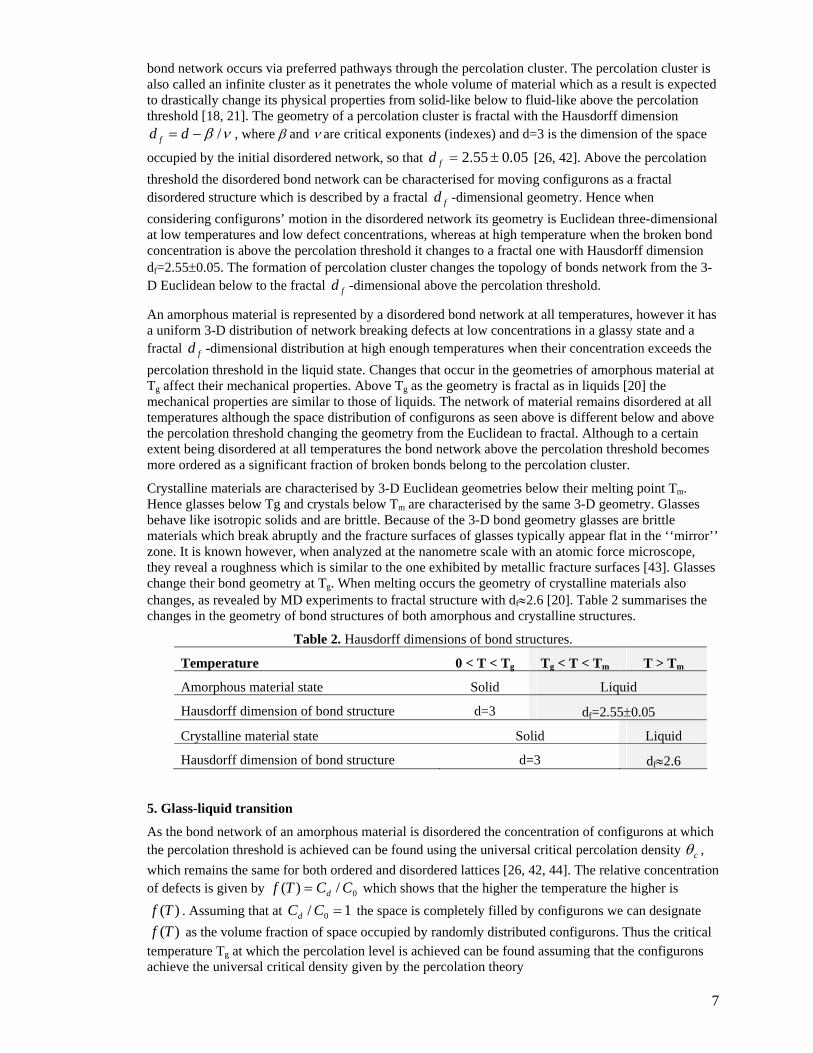
For SiO2 and GeO2 we suppose that cc ϑθ = where cϑ is the Scher-Zallen critical density in the 3-D space 01.015.0 ±=cϑ [26, 42, 44]. Note that for real percolating systems the value of cθ can be significantly lower [26]. At temperatures above Tg the space is filled by configurons at concentrations which exceed the critical density cθ therefore they form the percolation cluster with fractal geometry changing the state of material from solid-like (glass) to liquid-like (Fig. 4).
Figure 4. Relative concentration of configurons in amorphous silica and germania.
Accounting for (2) from (4) we find that Tg is directly related to the configuron thermodynamic parameters via:
]/)1ln[( ccd
dg RS
HTθθ−+
= (5)
Below Tg the configurons are uniformly distributed in space and formation of clusters is improbable. The geometry of network defects in this area can be characterised as Euclidean. With increase of temperature at T=Tg, the concentration of defects achieves the critical concentration for formation of a percolation cluster. Above Tg a percolation cluster made of network defects is formed and the geometry of the network becomes fractal. Hence at T> Tg amorphous materials can be considered as supercooled liquids. We expect that Tg obtained from (5) will have values close to those experimentally observed. Table 3 gives Tg calculated using equation (5) and experimentally measured data on transition from the glassy to the supercooled liquid state (e.g. temperatures when the supercooled liquid state is reached) from [45, 46].
Table 3. Glass transition temperatures (Tg’s) in amorphous SiO2 and GeO2.
Amorphous oxide SiO2 GeO2
Tg, calculated from (5), K 1482 792
Tg, experiment [45, 46], K 1475 786
The agreement between calculated and experimentally measured data on transition from the glassy to the supercooled liquid state is excellent: calculated values of Tg, which are entirely based on processing of continuous viscosity-temperature relationships taken from earlier works [18, 19], nearly coincide (within 0.5- 0.7%) with recently-measured calorimetric Tg [45, 46].
Although the formation of glass is a kinetically-controlled process equation (5) demonstrates that Tg is a thermodynamic parameter of an amorphou materials and its network-breaking defects (configurons) rather than a kinetic or dynamic one. It is worth noting that taking into account RSd >> we can simplify equation (5) to an approximation similar in form with the well-known Dienes ratio [35, 47]
ddg SHT /≈ . In addition equation (5) conforms well to Hunt’s equation for Tg of ionic glasses
kET mg 18/≅ , where Em is the peak hopping energy barrier [48]. This can be seen by accounting that
the hopping barrier can be assessed as Adm NHE /= , where NA is Avogadro’s number, e.g. for
9
amorphous silica equation (5) gives RHT dg 18/≅ which is almost the same as given by Hunt’s equation.
6. Role of kinetics
We obtained the temperature of transition from a glassy to a supercooled liquid state (5) without considering for the formation of crystalline phases. Changes at the glass transition are kinetically-controlled and occur when the cooling rate is so high that crystallisation is negligible. A liquid is always in a metastable state below its melting point (Tm) thus whether it becomes a glass or a crystal depends critically on cooling rate. When the cooling rate is slow any liquid crystallizes, except atactic polymers that hardly crystallize due to stereoirregularity [1]. A liquid always tends to crystallize into the equilibrium crystal. The tendency to crystallise is well expressed by the fragility of melts which Angell suggested is used to describe the deviation of viscosity from Arrhenius-type behaviour [49]. This deviation is caused by changes in the activation energies of viscosity and enables numerical characterisation of the fragility via Doremus’ criterion of fragility mdD HHR /1+= , where Hm is the enthalpy of motion of configurons [23, 24]. Strong network liquids such as SiO2 and GeO2 are well polymerised, mostly covalently-bonded, and demonstrate nearly-Arrhenius temperature dependence of viscosity. These have small values of RD: SiO2, has RD=1.42 and GeO2 has RD=1.33 [22, 24]. In contrast the activation energies of fragile liquids change significantly with temperature so their viscosity deviates significantly from the Arrhenius behaviour. Typical fragile glass-forming liquids are chalcogenides or iron phosphates, whose networks are mostly ionic. These are characterised by large values of RD>>1, diopside has RD=7.26 [50]. Fragility of amorphous materials is reflected by a high sensitivity of the melt viscosity to temperature and by a strong tendency to crystallize. It is known that when a fragile material is heated or cooled at a normal rate, say 20 K/min, the exothermic peaks due to crystallization processes can be easily detected using a differential scanning calorimeter. Moreover experiments with fragile basalt systems reveal ordered structures even above the liquidus temperature [51]. Large-scale density fluctuations, known as Fischer clusters, commonly exist in fragile liquids and are revealed in one component glass-forming liquids and polymers [52]. Bakai [53] showed that the observed fluctuations appears as result of aggregation of liquid domains and developed the idea that a glass-forming liquid has heterophase mesoscopic structure consisting of solid-like and fluid-like species. In contrast strong liquids are more difficult to crystallise than fragile ones below Tg since their kinetics are almost controlled by α-relaxation [1]. Hence equation (5) is readily applicable to calculating of Tg for strong liquids and at relatively fast cooling rates.
A certain amount of crystalline phase inevitable forms when a glass is formed via cooling a liquid. The lower the cooling rate, q, the higher the volume fraction, x, occupied by crystalline phases. Finally, at very low cooling rates when q is below the critical cooling rate qc(xc) formation of glass is impeded by crystallisation. The critical cooling rate is defined as the lowest cooling rate at which the final degree of crystallinity of amorphous material does not exceed a given critical value xc, which can be close to unity when the glass crystallises. For good glass-forming liquids xc is normally assumed to be within 10-6 – 10-2 [54, 55]. The volume fraction of crystallised material can be found in the framework of Kolmogorov-Avrami theory of phase transformations. It can be expressed in the simplest case of a constant nucleation rate per unit volume, Iv, as an integral function at constant cooling rate q [55-57]:
)3/exp(1 43tuIx vπ−−= where t is time and u is the rate of growth of crystalline phase. Note that nucleation rates are at a maximum near Tg [57] which emphasises the role of crystallisation at liquid-glass transition [1]. The fraction of crystalline phase is proportional to q-4 or t4: 3/43tuIx vπ≅ when x<<1. Generally, the higher the cooling rate q the smaller is x. The actual volume of vitreous phase hence depends on cooling rate and can be expressed as xg =1-x. At finite cooling rates the actual volume of amorphous material available for the formation of percolation clusters made of configurons is lower. This reduction can be accounted for in the equation for critical temperature of percolation including a renormalization term in (4) )1()( xxTf cgcg −== θθ . Thus when taking into account the formation of crystalline phases we obtain a renormalized equation for Tg:
]/)1ln[( ccd
dg xRS
HTθθ−++
= (6)
10
This shows that when x<<1 Tg increases logarithmically with q: [ ][ ]cgmvcddg quTTIRSHT θπθ /]3/)(1[ln/ 434−+−+=
and achieves its maximum value given by (5) at q →∞ when the volume fraction of crystalline material is negligibly low so x→0. Tg diminishes with the diminution of q although its reduction is limited by formation of crystalline phases as when q →0 the fraction of crystalline material x →1. Thus at very low cooling rates the vitreous phase is hardly formed as the only phase formed is crystalline. The interval of temperatures where the glass transition occurs can be assessed from (6) accounting that there is a minimum possible cooling rate qmin or correspondingly a maximum cooling time tmax when a glass can be obtained via cooling. The minimum possible cooling rate qmin and corresponding maximum cooling time tmax are found considering the crystallisation kinetics [54, 55]. This gives for the glass transition interval )39.066.5ln()/( 4
max3tuISRTT vdgg π+≈∆ which reproduces the experimentally
known logarithmic behaviour of Tg with cooling rate [6, 58]. Although the glass transition temperature is a thermodynamic parameter it depends on the cooling rate of a supercooled liquid as the formation of glass is a kinetically-controlled process. The Tg’s of amorphous materials achieve their maximum thermodynamic values at infinitely high cooling rates.
7. Derivative discontinuities
The concentration of configurons changes continuously with temperature therefore no discontinuities are expected to occur at Tg for integral properties of amorphous materials. MD simulations show that derivative characteristics such as specific heat demonstrate discontinuities at Tg [17, 18]. The discontinuities are explained accounting for the formation of percolation clusters and the change in the geometry of distribution of configurons. The characteristic linear scale which describes the branch sizes of clusters formed by configurons is the correlation length ξ(T). It gives the linear dimension above which the material is homogeneous and can be characterised as a material with uniformly distributed configurons. Because of formation of percolation clusters at lengths smaller than ξ(T) the material has a fractal geometry [42]. At temperatures approaching Tg the correlation length ξ diverges:
ν
θξξ cTfT −= )(/)( 0 , where the critical exponent ν=0.88 [26, 42]. Accounting for this we can describe finite size effects in the glass transition where a drift to higher values of Tg is observed when sample sizes L diminish: Tg(∞)-Tg(L) ∼ 1/L [59, 60]. Indeed assuming that the glass-liquid transition is achieved when the correlation length is equal to the size of sample LT =)(ξ we obtain
136.10 )/)(/(1275.0)()( LHRTTLTT dgggg ξ=−∞ which conforms well to Hunt’s conclusions [59,
60].
Following approaches developed in Angell’s bond lattice model [28, 29] we can find the heat capacity per mole of configurons involved in the percolation cluster near Tg:
⎟⎟⎟
⎠
⎞
⎜⎜⎜
⎝
⎛
−∆+−⎟
⎠⎞
⎜⎝⎛= −
−
)1(
11
0
2
, )/(1)](1)[( β
β
βg
dd
confpTT
THHPTfTfRTHRC (7)
where dccg HRTT )1(/21 θθ −= , P0 is a numerical coefficient close to unity (for strong liquids
P0=1.0695) and ∆H<<Hd is the enthalpy of bonding of configurons in the percolation cluster. ∆H can be found accounting for the fact that the enthalpy of formation of one mole of configurons which belong to a percolation cluster Hc is higher than Hd, e.g. ∆H=Hc-Hd. Thus the configurons in a percolation cluster are not condensed in a condensed excited state, which makes it different from Holmlid’s clusters where ∆H<0 [61, 62]. From (7) one can see that the heat capacity shows divergence
near Tg proportional to 59.0
/1 gTT −∝ . Because T1 << Tg with further increase of temperature the
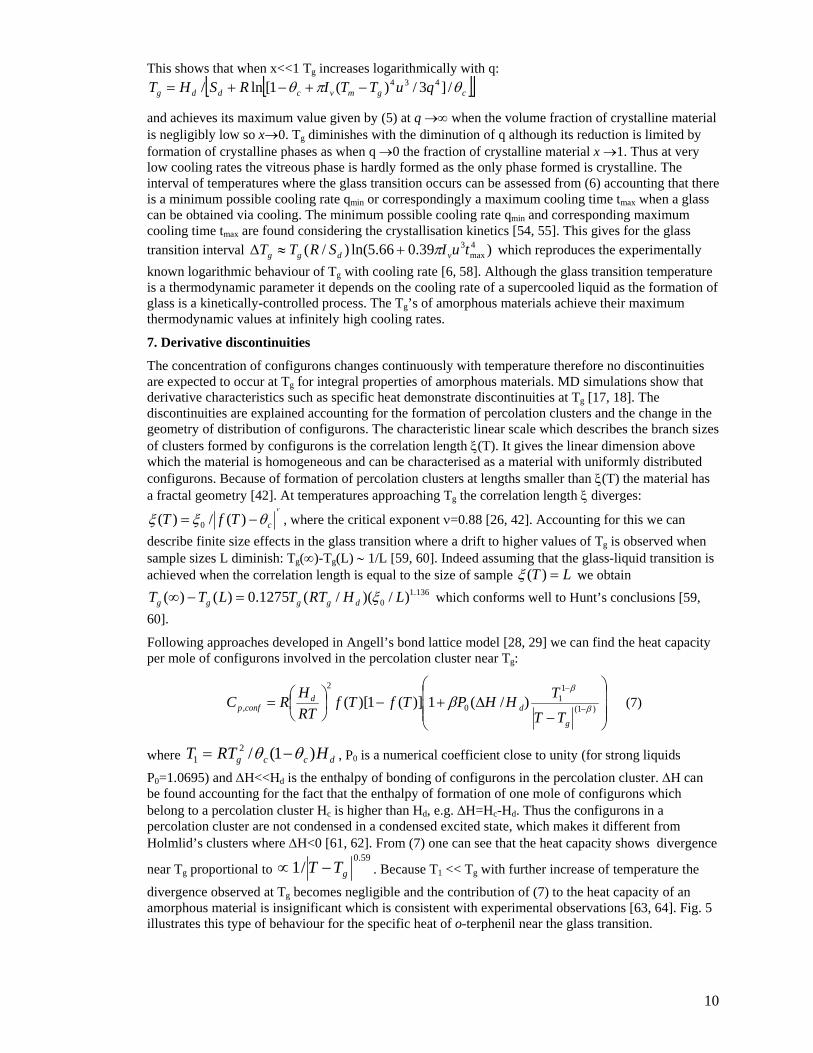
divergence observed at Tg becomes negligible and the contribution of (7) to the heat capacity of an amorphous material is insignificant which is consistent with experimental observations [63, 64]. Fig. 5 illustrates this type of behaviour for the specific heat of o-terphenil near the glass transition.
11
Figure 5. Specific heat of amorphous o-terphenil. (a) experimental data from [61, 62]. (b) calculated
curves accounting for contribution (7).
Thus the glass transition shows typical features of second order phase transformations including universal behaviour near the phase transition temperature [8]. From (7) we can find that the universal critical exponent at the glass transition α=0.59.
8. Conclusions
We analysed the disordered structure of bonds and the geometry of the spatial distribution of configurons (thermal equilibrium network-breaking defects in a network of bonds) of an amorphous material. Amorphous SiO2 and GeO2 were used as simple glass-forming materials for this purpose. Thermodynamic data of broken bonds were evaluated based on viscosity-temperature relationships and Doremus’ defect model of viscosity. Evaluation of configurons concentration revealed temperature ranges where dynamic percolation clusters made of broken bonds are formed. We defined Tg as the temperature where a percolation cluster made of configurons is formed and found an excellent agreement between calculated and experimentally measured calorimetric Tg. We characterised the symmetry of topologically-disordered systems by the Hausdorff dimension, d, of bonds. Our analysis revealed two types of topological disorder characterised by different symmetries below and above the Tg: (i) d=3- dimensional (Euclidean), which occurs in the glassy state at T<Tg when no percolation clusters are formed and (ii) df=2.55±0.05- dimensional (fractal), which occurs in the liquid state at T>Tg when percolation clusters made of broken bonds are formed. Our results hence are consistent with previous work and reflect the same change in geometry of the atoms distribution in amorphous materials at Tg. Thus the transition from a glassy to a supercooled liquid state can be treated as a change in the symmetry of topological disorder.
Acknowledgements
Authors acknowledge useful discussions with L. Holmlid, A. Hunt and V. Stolyarova.
References
1. Tanaka H 2005 J. Non-Cryst. Solids 351 3371-84.
2. Binder K and Young A P 1986 Rev. Mod. Phys. 58, 801-976.
3. Kittel C 1996 Introduction to solid state physics (New York: J. Wiley and Sons Inc.).
4. Richert R 2002 J. Phys.: Condens. Matter 14 R703-38.
5. Roland C M and Casalini R 2005 J. Non-Cryst. Solids 351 2581-87.
6. Zarzycki J 1982 Glasses and the vitreous state. (New York: Cambridge University Press).
7. IUPAC Compendium of Chemical Terminology 1997 66 583.
8. Landau L D and Lifshitz E M 1984 Statistical physics Part 1 (Butterworth-Heynemann).
12
9. Hunt A 1992 Solid State Communications 84 263-6.
10. Gutzow I and Petroff B 2004 J. Non-Cryst. Solids 345&346 528-36.
11. Doremus R H Glass Science 1973 (New York: Wiley).
12. Zallen R 1983 The Physics of Amorphous Solids (New York: Wiley).
13. Ziman J M 1979 Models of Disorder (Cambridge: Cambridge University Press).
14. Debenedetti P G 1997 Metastable Liquids (Princeton: Princeton University Press).
15. Donth E 2001 The Glass Transition (Berlin: Springer-Verlag).
16. Hobbs L W 1995 J. Non-Cryst. Solids 192 & 193 79-91.
17. Medvedev N N, Geider A and Brostow W 1990 J. Chem. Phys. 93, 8337.
18. Evteev A V, Kosilov A T and Levchenko E V 2002 JETP Letters 76 104.
19. Binder K 2000 J. Non-Cryst. Solids 274 332.
20. Kolokol A S and Shimkevich A L 2005 At. Energy 98 187-90.
21. Ojovan M I 2004 J. Exp. Theor. Phys. Let. 79 632-4.
22. Doremus R H 2002 J. Appl. Physics 92 7619-29.
23. Ojovan M I and Lee W E 2004 J. Appl. Phys. 95 3803-10.
24. Ojovan M I and Lee W E 2005 Phys. Chem. Glasses 46 7-11.
25. Ozhovan M I 1993 J. Exp. Theor. Phys. 77 939-43 (1993).
26. Sahimi M 1994 Applications of percolation theory (London: Taylor and Francis).
27. Salmon P S, Martin R A, Mason P E and Cuello G J 2005 Nature 435 75-7.
28. Angell C A and Rao K J 1972 J. Chem. Phys. 57 470-81.
29. Angell C A and J Wong1970 J. Chem. Phys. 53 2053-66.
30. Kraftmaker Y 1998 Phys. Rep. 299 799.
31. Sciortino F and Tartaglia P 2001 Phys Rev. Lett. 86 107-10.
32. Chelikovsky J R and Louie S G 1996 Quantum theory of real materials (Boston: Kluwer Press).
33. Pavlushkin N M 1979 Basics of glassceramic technology (Moscow: Stroizdat).
34. Harding J H 1985 Phys. Rev. B 32 6861.
35. Almond D P and West A R 1987 Solid State Ionics 23 27.
36. Avramov I 2000 J. Non-Cryst. Solids 262 258.
37. Avramov I 2005 J. Non-Cryst. Solids 351 3163-73.
38. Volf M B 1988 Mathematical approach to glass (Amsterdam: Elsevier).
39. Urbain G, Bottinga Y and Richert P 1982 Geochim. Cosmochim. Acta. 46 1061.
40. Hetherington G, Jack K H and Kennedy J C 1964 Phys. Chem. Glasses 5 130.
41. Fontana E H and Plummer WA 1966 Phys. Chem. Glasses 7 139-46.
42. Isichenko M B 1992 Rev. Mod. Phys. 64 961.
43. Celarie F, Prades S, Bonamy D, Ferrero L, Bouchaud E, Guillot C and Marliere C 2003 Phys. Rev. Lett. 90 075504-1-4.
44. Scher H and ZallenR 1970 J. Chem. Phys. 53, 3759.
45. Bruning R 2003 J. Non-Cryst. Solids 330 13-22.
46. Bruning R and Crowell T 1999 J. Non-Cryst. Solids 248 183-93.
47. Dienes G C 1950 J. Appl. Phys. 21 1189-92.
13
48. Hunt A 1994 J. Non-Cryst. Solids 176 288-93.
49. Angell C A 1988 J. Phys. Chem. Solids 49 863–71.
50. Doremus R H 2003 Amer. Ceram. Soc. Bull. 82 59-63.
51. Yue Y 2004 J. Non-Crys. Solids 345&346 523–27.
52. Fischer E W, Meier G, Rabenau T, Patkowski A, Steffen W and Thonnes W 1991 J. Non-Cryst. Solids 131-133 134.
53. Bakai A S 2002 J. Non-Cryst. Solids 307–310 623–29.
54. Uhlmann D R 1972 J. Non-Cryst. Solids 7 337.
55. Avramov I, Zanotto E D and Prado M O 2003 J. Non-Cryst. Solids 320 9.
56. Uhlmann D R, Hays J F and Turnbull D 1966 Phys. Chem. Glasses 7 159-68.
57. Granasy L and James P F 1999 J. Non-Cryst. Solids 253 210.
58. Klinger M I 1988 Phys. Rep. 165 275.
59. Hunt A 1994 Solid State Communications 90 527-32.
60. Hunt A 1996 J. Non-Cryst. Solids 195 293-303.
61. Holmlid L 2002 J. Phys.: Condens. Matter 14 13469–79.
62. Akesson H, Badiei S and Holmlid L 2006 Chemical Physics 321 215–22.
63. Gotze W and Sjogren L 1992 Rep. Prog. Phys. 55 241-376.
64. Greed R J and Turnbull D 1967 J. Chem. Phys. 47 2185-90.
Related Documents
![TOPOLOGICALLY SLICE KNOTS WITH NONTRIVIAL ...arXiv:1001.1538v3 [math.GT] 7 May 2011 TOPOLOGICALLY SLICE KNOTS WITH NONTRIVIAL ALEXANDER POLYNOMIAL MATTHEW HEDDEN, CHARLES LIVINGSTON,](https://static.cupdf.com/doc/110x72/5f8d8100ff950450d4784567/topologically-slice-knots-with-nontrivial-arxiv10011538v3-mathgt-7-may.jpg)