Topographic Maps Two-dimensional representation of a Three-dimensional surface. Coordinate systems Latitude/Longitude (spherical) Universal Transverse Mercator (UTM) system Contour Lines: lines of equal elevation. North Arrow Scale Symbols Colors Standard in US: USGS

Topographic Maps Two-dimensional representation of a Three-dimensional surface. Coordinate systems Latitude/Longitude (spherical) Universal Transverse.
Dec 14, 2015
Welcome message from author
This document is posted to help you gain knowledge. Please leave a comment to let me know what you think about it! Share it to your friends and learn new things together.
Transcript

Topographic Maps
Two-dimensional representation of a Three-dimensional surface.
Coordinate systems Latitude/Longitude (spherical) Universal Transverse Mercator (UTM)
system Contour Lines: lines of equal
elevation. North Arrow Scale Symbols Colors Standard in US: USGS

General
Units and conversions: Page xii, front of lab manual
Significant Figures in calculations: 3.0 * 120 = 360 2 3 * 120 = 400 (not 360) 1 3.178 * 122.5 = 389.3 (not 389.305) 4 2.17 * 2,000 (Conversion factor) = 4,340 3 7.1 * 2,000 = 14,000 (not 14,200) 2 Many of your answers should have at least 2
significant figures, but no more than 3, even if not following the “rules”

Page 230

___ Minutes = 1 Degree
___ Seconds = 1 Minute
60
60

Not a square. Why not?
Equator vs Poles?
What is Linville Falls?Square or Rectangle?


Page 232 Linville Falls Latitudes and Longitudes?
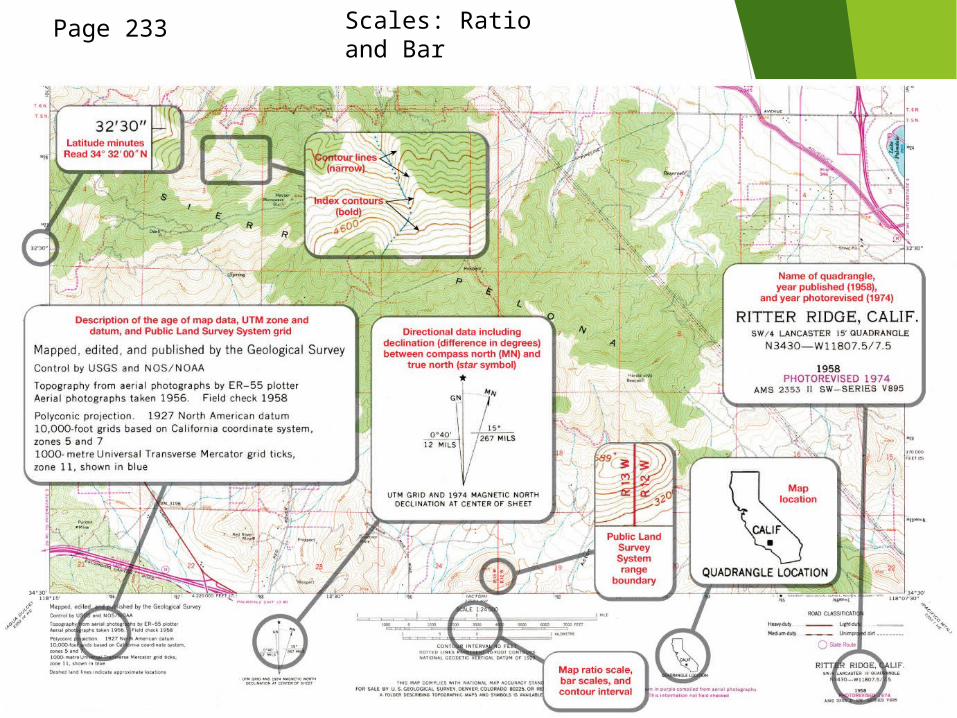
Page 233 Scales: Ratio and Bar

Scale
Bar Scale Ratio Scale
1 map unit = # units in real life
1:12,000
1 map unit equals 12,000 real units 1 inch on the map = 12,000 inches in real life or _____ feet
(Linville Falls: 1:_______; 1 in ~ ___ feet)24,000 2,000
1,000
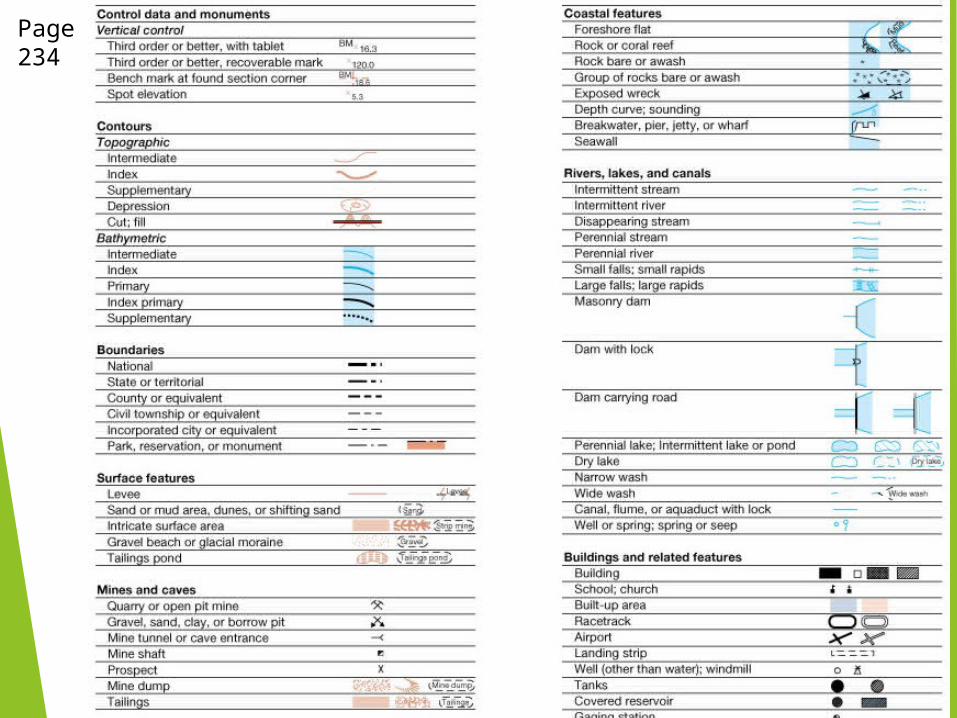
Page234

Page234

Page 235
N or S first, Degrees to the E or WA to B: N 42 EB to A: ______
# Degrees clockwise from North (0°)A to B: 42°B to A: ______
DIRECTIONS – TWO METHODS
222S 42 W

Metric (meters)Rectangular,not spherical
UNIVERSAL TRANSVERSE MERCATOR (UTM)
Page 237

Page 242
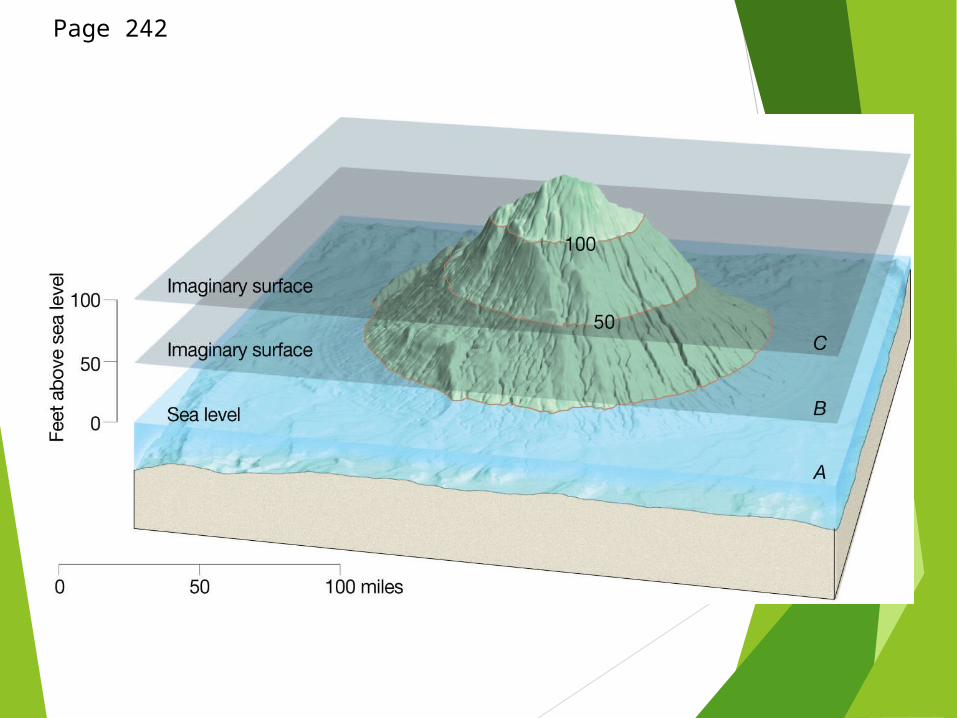
Page 242

Units of Elevation?Units of Distance?
Contour Interval: difference in elevation between two adjacent contour lines (that are not equal).
What is the contour interval?
The location indicated by “x 108” is higher in elevation than 100 feet but less than 150 feet. If no listed elevation, what you predict it to be?
Page 242

Page 244

Page 245

Page 247
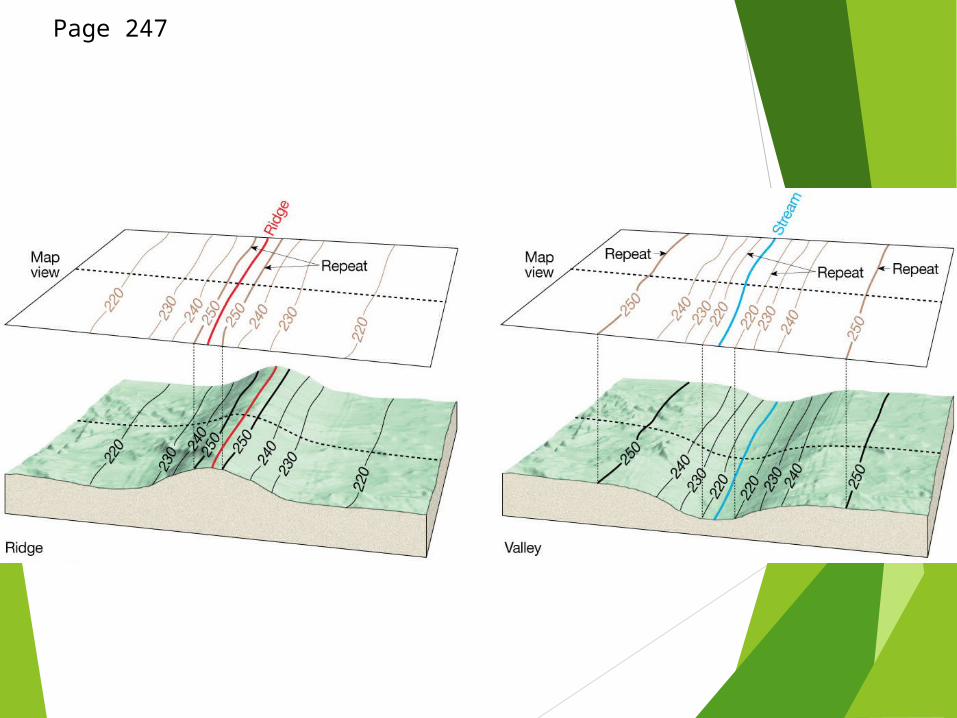
Page 247
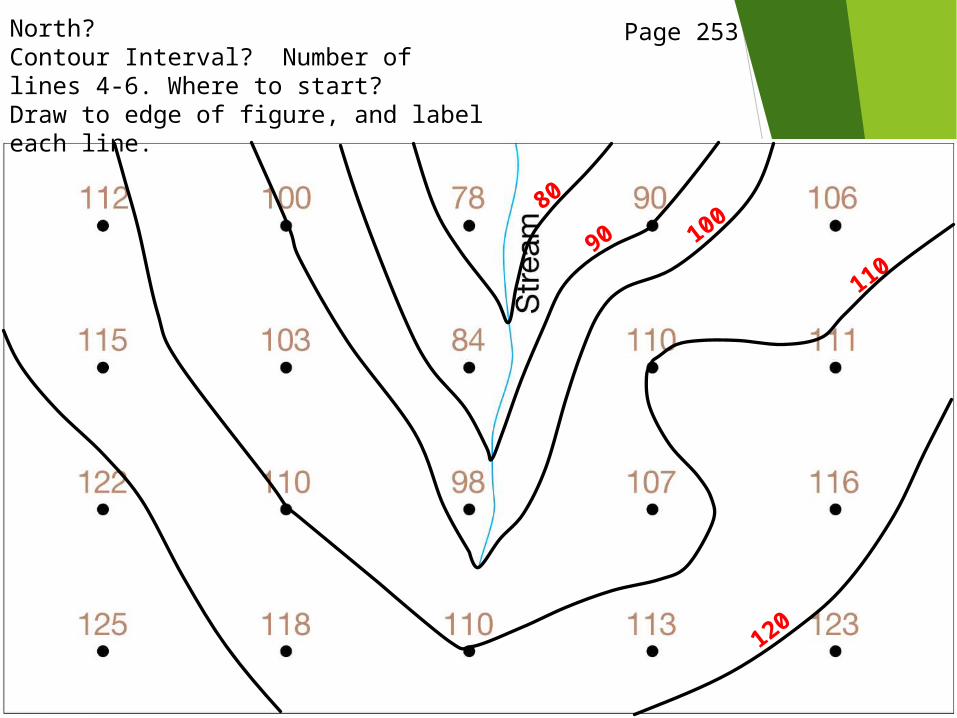
North?Contour Interval? Number of lines 4-6. Where to start?Draw to edge of figure, and label each line.
Page 253
100
110
120
90
80
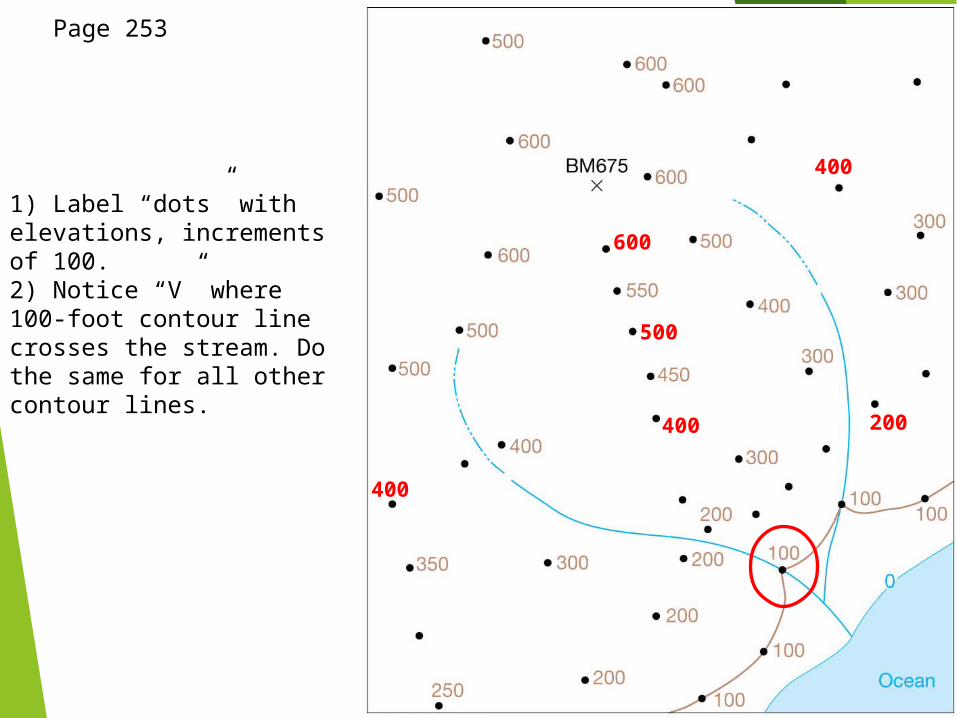
1) Label “dots” with elevations, increments of 100.2) Notice “V” where 100-foot contour line crosses the stream. Do the same for all other contour lines.
Page 253
400
400
600
400
500
200
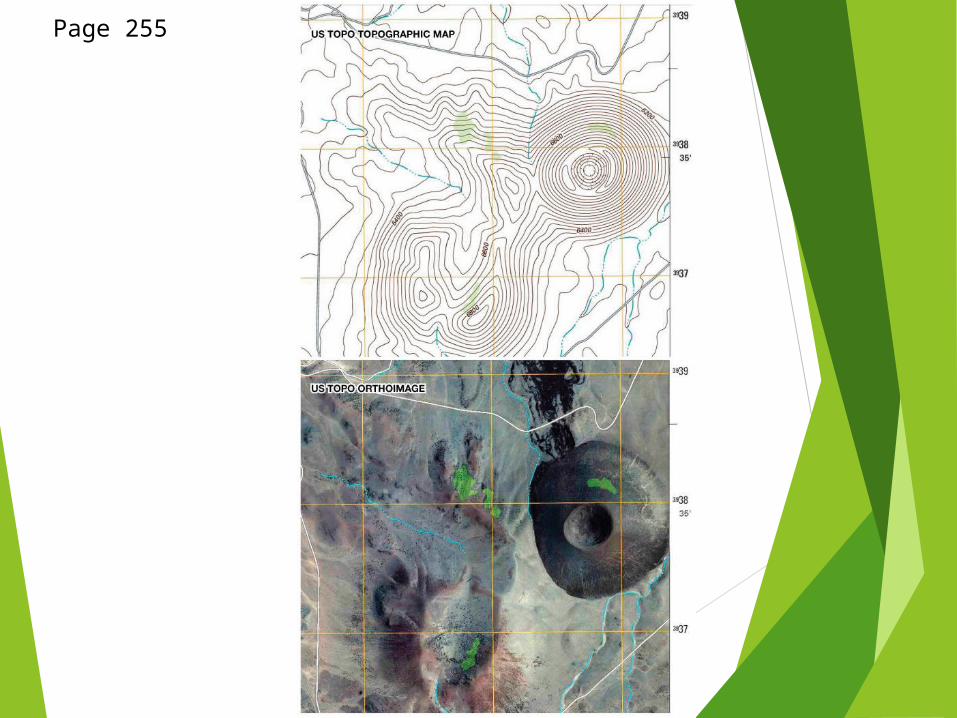
Page 255

Copy is Black & White, so look at the manual.
What do the blue lines represent?
What is the contour interval?
Which direction to the rivers flow?
Page 254
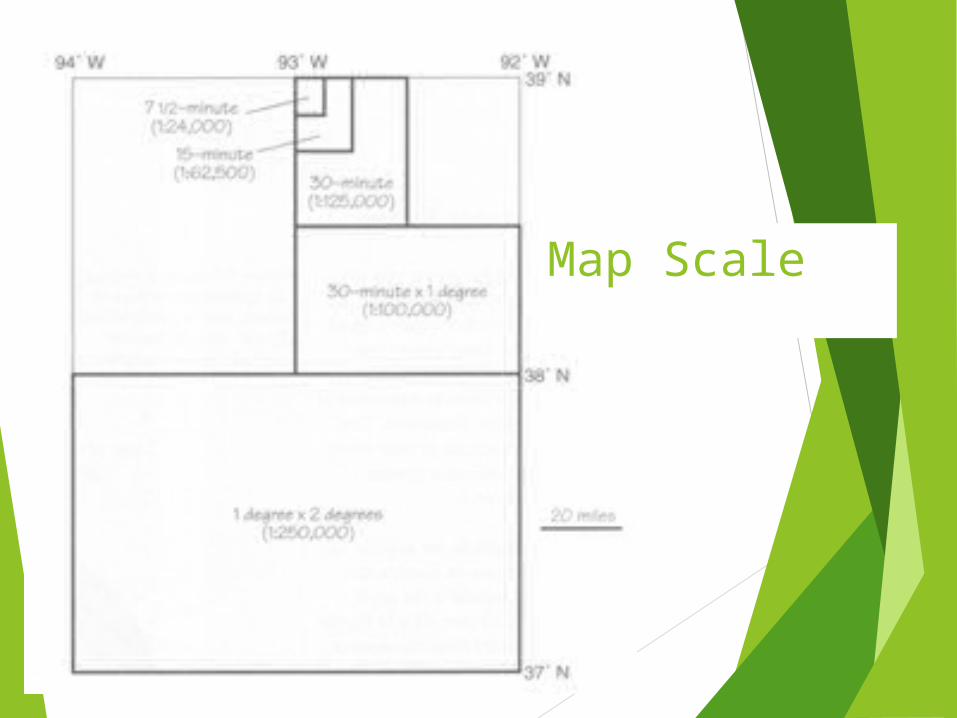
Map Scale

Gradient:Change in elevation divided by distance.Slope: Rise / Run
Relief: Change in elevation on the map. Maximum – Minimum.

North?Contour Interval? Number of lines 4-6. Where to start?Draw to edge of figure, and label each line.
Page 253
100
110
120
90
80
Related Documents