What is a Topographic Map? A map is a representation of the Earth, or part of it. The distinctive character- istic of a topographic map is that the shape of the Earth’s surface is shown by contour lines. Contours are imag- inary lines that join points of equal elevation on the surface of the land above or below a reference surface, such as mean sea level. Contours make it possible to measure the height of mountains, depths of the ocean bottom, and steep- ness of slopes. A topographic map shows more than contours. The map includes symbols that represent such fea- tures as streets, buildings, streams, and vegetation. These symbols are con- stantly refined to better relate to the features they represent, improve the appearance or readability of the map, or reduce production cost. Consequently, within the same series, maps may have slightly dif- ferent symbols for the same feature. Examples of symbols that have changed include built-up areas, roads, intermittent drainage, and some letter- ing styles. On one type of large-scale topographic map, called provisional, some symbols and lettering are hand- drawn. U.S. Department of the Interior U.S. Geological Survey Reading Topographic Maps Interpreting the colored lines, areas, and other symbols is the first step in using topographic maps. Features are shown as points, lines, or areas, depending on their size and extent. For example, individual houses may be shown as small black squares. For larger buildings, the actual shapes are mapped. In densely built-up areas, most indi- vidual buildings are omitted and an area tint is shown. On some maps, post offices, churches, city halls, and other landmark buildings are shown within the tinted area. The first features usually noticed on a topographic map are the area features, such as vegetation (green), water (blue), and densely built-up areas (gray or red). Many features are shown by lines that may be straight, curved, solid, dashed, dotted, or in any combination. The colors of the lines usually indicate similar classes of information: topographic contours (brown); lakes, streams, irrigation ditches, and other hydrographic features (blue); land grids and important roads (red); and other roads and trails, railroads, boundaries, and other cultural features (black). At one time, purple was used as a revision color to show all feature changes. Currently, purple is not used in our revision program, but purple features are still present on many existing maps. Various point symbols are used to depict features such as buildings, campgrounds, springs, water tanks, mines, survey control points, and wells. Names of places and features are shown in a color cor- responding to the type of feature. Many features are identified by labels, such as “Substation” or “Golf Course.” Topographic contours are shown in brown by lines of different widths. Each contour is a line of equal elevation; therefore, contours never cross. They show the general shape of the terrain. To help the user determine elevations, index contours are wider. Elevation values are printed in several places along these lines. The narrower intermediate and supplementary contours found between the index contours help to show more details of the land surface shape. Con- tours that are very close together represent steep slopes. Widely spaced contours or an absence of contours means that the ground slope is relatively level. The elevation difference between adjacent contour lines, called the contour interval, is selected to best show the general shape of the terrain. A map of a relatively flat area may have a contour interval of 10 feet or less. Maps in mountainous areas may have contour intervals of 100 feet or more. The contour interval is printed in the margin of each U.S. Geological Survey (USGS) map. Bathymetric contours are shown in blue or black, depending on their location. They show the shape and slope of the ocean bottom surface. The bathymetric contour interval may vary on each map and is explained in the map margin. Topographic Map Symbols

Welcome message from author
This document is posted to help you gain knowledge. Please leave a comment to let me know what you think about it! Share it to your friends and learn new things together.
Transcript

What is a Topographic Map?
A map is a representation of the Earth, or part of it. The distinctive character-istic of a topographic map is that the shape of the Earth’s surface is shown by contour lines. Contours are imag-inary lines that join points of equal elevation on the surface of the land above or below a reference surface, such as mean sea level. Contours make it possible to measure the height of mountains, depths of the ocean bottom, and steep-ness of slopes.
A topographic map shows more than contours. The map includes symbols that represent such fea-tures as streets, buildings, streams, and vegetation. These symbols are con-stantly refi ned to better relate to the features they represent, improve the appearance or readability of the map, or reduce production cost.
Consequently, within the same series, maps may have slightly dif-ferent symbols for the same feature. Examples of symbols that have changed include built-up areas, roads, intermittent drainage, and some letter-ing styles. On one type of large-scale topographic map, called provisional, some symbols and lettering are hand- drawn.
U.S. Department of the InteriorU.S. Geological Survey
Reading Topographic Maps
Interpreting the colored lines, areas, and other symbols is the fi rst step in using topographic maps. Features are shown as points, lines, or areas, depending on their size and extent. For example, individual houses may be shown as small black squares. For larger buildings, the actual shapes are mapped. In densely built-up areas, most indi-vidual buildings are omitted and an area tint is shown. On some maps, post offi ces, churches, city halls, and other landmark buildings are shown within the tinted area. The fi rst features usually noticed on a topographic map are the area features, such as vegetation (green), water (blue), and densely built-up areas (gray or red). Many features are shown by lines that may be straight, curved, solid, dashed, dotted, or in any combination. The colors of the lines usually indicate similar classes of information: topographic contours (brown); lakes, streams, irrigation ditches, and other hydrographic features (blue); land grids and important roads (red); and other roads and trails, railroads, boundaries, and other cultural features (black). At one time, purple was used as a revision color to show all feature changes. Currently, purple is not used in our revision program, but purple features are still present on many existing maps. Various point symbols are used to depict features such as buildings, campgrounds, springs, water tanks, mines, survey control points, and wells. Names of places and features are shown in a color cor-responding to the type of feature. Many features are identifi ed by labels, such as “Substation” or “Golf Course.” Topographic contours are shown in brown by lines of different widths. Each contour is a line of equal elevation; therefore, contours never cross. They show the general shape of the terrain. To help the user determine elevations, index contours are wider. Elevation values are printed in several places along these lines. The narrower intermediate and supplementary contours found between the index contours help to show more details of the land surface shape. Con-tours that are very close together represent steep slopes. Widely spaced contours or an absence of contours means that the ground slope is relatively level. The elevation difference between adjacent contour lines, called the contour interval, is selected to best show the general shape of the terrain. A map of a relatively fl at area may have a contour interval of 10 feet or less. Maps in mountainous areas may have contour intervals of 100 feet or more. The contour interval is printed in the margin of each U.S. Geological Survey (USGS) map. Bathymetric contours are shown in blue or black, depending on their location. They show the shape and slope of the ocean bottom surface. The bathymetric contour interval may vary on each map and is explained in the map margin.
Topographic Map Symbols

Area exposed at mean low tide; sounding datum line***
Channel***
Sunken rock***
BATHYMETRIC FEATURES
BOUNDARIES
National
State or territorial
County or equivalent
Civil township or equivalent
Incorporated city or equivalent
Federally administered park, reservation, or monument (external)
Federally administered park, reservation, or monument (internal)
State forest, park, reservation, or monument and large county park Forest Service administrative area*
Forest Service ranger district*
National Forest System land status, Forest Service lands* National Forest System land status, non-Forest Service lands*
Small park (county or city)
BUILDINGS AND RELATED FEATURES
Building
School; house of worship
Built-up area
Forest headquarters*
Ranger district offi ce*
Guard station or work center*
Racetrack or raceway
Airport, paved landing strip, runway, taxiway, or apron
Gaging station
Located or landmark object (feature as labeled)
Covered reservoir
Boat ramp or boat access*
Unpaved landing strip
Well (other than water), windmill or wind generator
Tanks
Roadside park or rest area
Campground
Picnic area
Winter recreation area*
Cem Cemetery
Athletic fi eld
COASTAL FEATURES
Foreshore fl at
Coral or rock reef
Group of rocks, bare or awash
Breakwater, pier, jetty, or wharf
Seawall
Exposed wreck
18 23 Depth curve; sounding
Oil or gas well; platform
Rock, bare or awash; dangerous to navigation
CONTOURS
Index 6000
Approximate or indefi nite
Intermediate
Approximate or indefi nite
Depression
Cut
Fill
Supplementary
Continental divide
Index***
Intermediate***
Index primary***
Primary***
Supplementary***
Bathymetric
Topographic
Third-order or better, permanent mark
With third-order or better elevation
With checked spot elevation
Coincident with found section corner
Unmonumented**
Neace
BM 52
1012
Cactus
Horizontal control
CONTROL DATA AND MONUMENTS
Third-order or better elevation, with tablet
Third-order or better elevation, recoverable mark, no tablet With number and elevation 4567
67
5628
BM9134
U.S. mineral or location monumentPrincipal point**
River mileage marker Mile69
USMM 438
Boundary monument

Third-order or better elevation, with tablet
Third-order or better elevation, recoverable mark, no tablet Bench mark coincident with found section corner
Spot elevation
528
BM 5280
BM
5280
7523
CONTROL DATA AND MONUMENTS – continuedVertical control
Contours and limits
Glacial advance
Formlines
Glacial retreat
GLACIERS AND PERMANENT SNOWFIELDS
LAND SURVEYS
Range or Township line
Protracted
R1E T2N R3W T4S Range or Township labels Section line
Protracted (AK 1:63,360-scale)
Location doubtful Location approximate
Location doubtful Protracted Protracted (AK 1:63,360-scale)
Found section corner
Found closing cornerWC
Witness corner
MC Meander corner
Weak corner*
Location approximate
Section numbers 1 - 36 1 - 36
Other land surveys Range or Township line Section line
Fence or fi eld lines
Land grant, mining claim, donation land claim, or tractLand grant, homestead, mineral, or other special survey monument
Public land survey system
State plane coordinate systems
Universal transverse metcator grid
MARINE SHORELINES Shoreline Apparent (edge of vegetation)*** Indefi nite or unsurveyed
MINES AND CAVES Quarry or open pit mine Gravel, sand, clay, or borrow pit Mine tunnel or cave entrance Mine shaft Prospect
Tailings
Former disposal site or mine
Mine dump
Graticule intersection
PROJECTION AND GRIDS
Neatline 39˚15’ 90˚37’30”
Graticule tick 55’
Datum shift tick
247 500 METERS Secondary zone tick
260 000 FEET Tertiary zone tick
98 500 METERS Quaternary zone tick
320 000 FEET Quintary zone tick
273 UTM grid (full grid)
269 UTM grid ticks*
640 000 FEET Primary zone tick
RAILROADS AND RELATED FEATURES
Standard guage railroad, single track Standard guage railroad, multiple track Narrow guage railroad, single track
Narrow guage railroad, multiple track
Railroad siding
Railroad underpass; overpass
Railroad bridge; drawbridge
Railroad tunnel
Railroad yard
Railroad turntable; roundhouse
Railroad in highway Railroad in road Railroad in light duty road*
RIVERS, LAKES, AND CANALS
Perennial stream
Perennial river
Intermittent stream
Intermittent river
Disappearing stream Falls, small
Falls, large
Rapids, large
Rapids, small
Masonry dam
Dam with lock
Dam carrying road
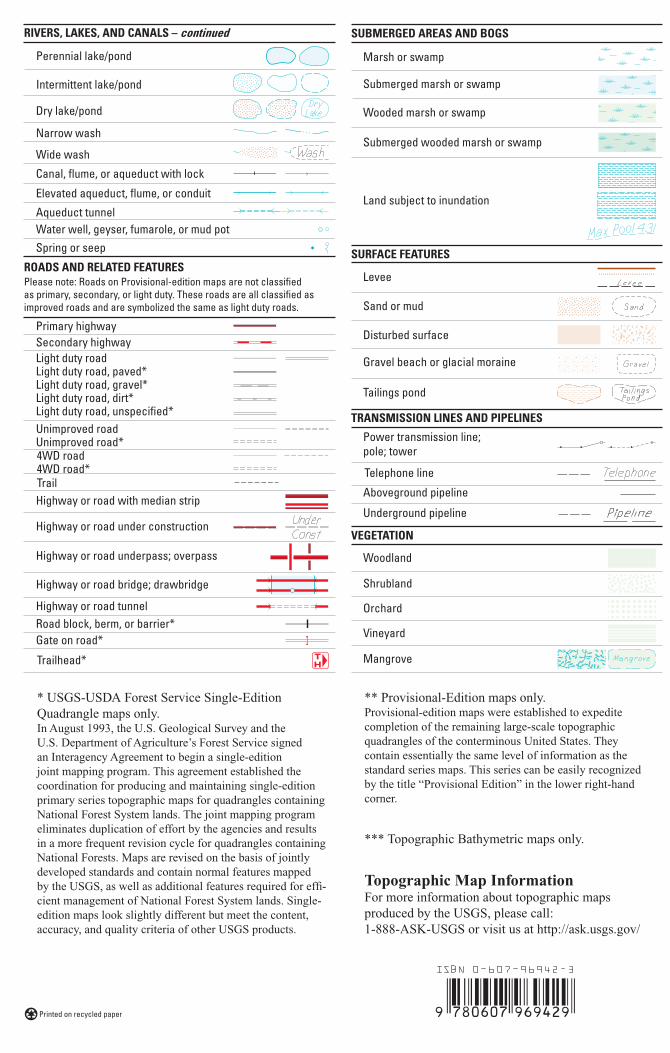
ROADS AND RELATED FEATURES
Primary highway Secondary highway Light duty road Light duty road, paved* Light duty road, gravel* Light duty road, dirt* Light duty road, unspecifi ed*
Please note: Roads on Provisional-edition maps are not classifi ed as primary, secondary, or light duty. These roads are all classifi ed as improved roads and are symbolized the same as light duty roads.
4WD road 4WD road* Trail
Unimproved road Unimproved road*
Highway or road under construction
Highway or road underpass; overpass
Highway or road bridge; drawbridge
Highway or road tunnel Road block, berm, or barrier* Gate on road*
Highway or road with median strip
Trailhead* TH
RIVERS, LAKES, AND CANALS – continued
Intermittent lake/pond
Perennial lake/pond
Dry lake/pond
Wide wash
Narrow wash
Canal, fl ume, or aqueduct with lock
Elevated aqueduct, fl ume, or conduit
Aqueduct tunnel Water well, geyser, fumarole, or mud pot Spring or seep
Topographic Map InformationFor more information about topographic maps produced by the USGS, please call:1-888-ASK-USGS or visit us at http://ask.usgs.gov/
SUBMERGED AREAS AND BOGS
Marsh or swamp
Submerged marsh or swamp
Wooded marsh or swamp
Submerged wooded marsh or swamp
Land subject to inundation
SURFACE FEATURES
Levee
Sand or mud
Disturbed surface
Gravel beach or glacial moraine
Tailings pond
Power transmission line; pole; tower
Telephone line
Aboveground pipeline
Underground pipeline
TRANSMISSION LINES AND PIPELINES
VEGETATION
Shrubland
Mangrove
Vineyard
Orchard
Woodland
* USGS-USDA Forest Service Single-Edition Quadrangle maps only.In August 1993, the U.S. Geological Survey and the U.S. Department of Agriculture’s Forest Service signed an Interagency Agreement to begin a single-edition joint mapping program. This agreement established the coordination for producing and maintaining single-edition primary series topographic maps for quadrangles containing National Forest System lands. The joint mapping program eliminates duplication of effort by the agencies and results in a more frequent revision cycle for quadrangles containing National Forests. Maps are revised on the basis of jointly developed standards and contain normal features mapped by the USGS, as well as additional features required for effi -cient management of National Forest System lands. Single-edition maps look slightly different but meet the content, accuracy, and quality criteria of other USGS products.
*** Topographic Bathymetric maps only.
** Provisional-Edition maps only.Provisional-edition maps were established to expedite completion of the remaining large-scale topographic quadrangles of the conterminous United States. They contain essentially the same level of information as the standard series maps. This series can be easily recognized by the title “Provisional Edition” in the lower right-hand corner.
Printed on recycled paper
Related Documents