Universidad Carlos III de Madrid C´ esar Alonso ECONOMETRICS Topic 8: AUTOCORRELATION Contents 1 Introduction 1 2 El regression model with time series 6 3 Consequences on OLS estimation 9 4 Inference robust to autocorrelation: Newey-West variance estimator 12 5 Autocorrelation tests 14

Welcome message from author
This document is posted to help you gain knowledge. Please leave a comment to let me know what you think about it! Share it to your friends and learn new things together.
Transcript

Universidad Carlos III de Madrid
Cesar Alonso
ECONOMETRICS
Topic 8: AUTOCORRELATION
Contents
1 Introduction 1
2 El regression model with time series 6
3 Consequences on OLS estimation 9
4 Inference robust to autocorrelation: Newey-West variance estimator 12
5 Autocorrelation tests 14

ECONOMETRICS. Topic 8.
1 Introduction
• The term autocorrelation (or serial correlation) denotes those situations where
realizations (observations) of the dependent variable are not independently drawn.
• This situation is very usual in the case of time series data.
• On the contrary, this situation does not happen in the case of cross-section data, for
which indvidual units are independent each other.
Cesar Alonso (UC3M) 1

ECONOMETRICS. Topic 8.
Example (Cross section data):
• Cross section data about 200 Spanish households composed by couples with or
without children, randomly drawn from the Spanish Consumer Expenditure Survey
(EPF), 1990-91.
• Simple regression of the logarithm of per capita consumption on the logarithm of per
capita disposable income.
• Left figure: logarithm of per capita consumption vs. logarithm of per capita income,
and the corresponding OLS regression line.
• Right figure: residuals of the OLS linear regression vs. the order number of each
observation (such order is arbitrary in the case of cross section data).
– As residuals are the sample analogs of the population regression,
if errors were independent each other we should not find any pattern.
Cesar Alonso (UC3M) 2
ECONOMETRICS. Topic 8.
• In the case of time series data (for which order of occurrence matters), autocorrelation
is a frequent phenomenon, among other things, because of the time dependence
associated with the inertia in economic data.
• It is quite plausible that shocks o disturbances affecting economic variables may
show time dependence. Examples:
– Consider the relationship between employment and inflation between 1950 and
1990.
All unobserved factors which potentially can affect employment but are not
included in such relationship are contained in the error term.
Some of these unobserved factors can exhibit time dependence: particularly,
energy shocks in the 1970s’.
Such energy shocks can induce higher employment drop that that predicted by
the model (i.e., a large positive error).
As the effects of an energy shock are not damped fastly, we would expect errors
in the next following years to be positive too.
The magnitude of such errors due to the energy shock will decrease over time
and, eventually, we will have errors closer to zero (even, negative) after some
years.
– Consider the relationship between stock index and growth.
Among the unobserved factors that can affect the stock index, we should men-
tion the level of confidence of economic agents (which, in turn, is affected by
unexpected news or surprises).
Such unexpected news can lead the stock index below the value predicted by
the model if agents’ confidence is worsened.
Presumably, the level of confidence of agents will exhibit inertia.
Cesar Alonso (UC3M) 3

ECONOMETRICS. Topic 8.
Example (Time series data):
• Annual data for the Spanish economy between 1964 and 1997 of aggregate consump-
tion and GDP at market prices, in constant million euros of 1986.
• Simple regression of the logarithm of consumption on the logarithm of GDP.
• Left figure: logarithm of consumption vs. logarithm of GDP
and the corresponding OLS regression line.
• Right figure: residuals of the OLS linear regression vs. the order number of each
observation (i.e., the year, which establishes a non-arbitrary order).
– As residuals are the sample analogs of the population regression of the relation
between the log of consumption and the log of GDP,
if errors were independent each other, we should not find any pattern along time.
– However, we find periods when residuals are predominantly negative followed
by other periods when residuals are predominantly positive.
Cesar Alonso (UC3M) 4
ECONOMETRICS. Topic 8.
• When observations are correlated each other, the OLS estimator can no longer be
optimal, and it might be that the standard expression of its standard error can be
inappropriate..
• For the sake of simplicity, we will consider the simple regression model, where we are
conditioning on a single variable.
• To index observations, we will use t, s or t − j as subindices –instead of i, h– to
emphasize that we are considering time series.
Cesar Alonso (UC3M) 5

ECONOMETRICS. Topic 8.
2 El regression model with time series
• Consider a time series of (Yt, Xt) (t = 1, . . . , T ),
i.e.: we observe T consecutive observations of Yt and Xt.
• Suppose that all the classical regression assumptions, except that about independence
among observations, are held.
• For a time series with T observations, we can write the model as
Yt = β0 + β1Xt + εt (t = 1, . . . , T )
• Assunptions of the regression model with dependent observations:
1. Linearity in parameters (Yt = β0 + β1Xt + εt)
2.
(i) E (εt|X1, . . . , XT ) = E (εt|Xt) ∀t
This assumption was always satisfied with independent observations (cross
section data).
But with time series data, this assumption is very restrictive,
as it establishes that the conditional mean of the disturbance is only af-
fected by the contemporaneous value of X.
(ii) E (εt|Xt) = 0 ∀t
Then, assumptions 2.(i) and 2.(ii) together imply that
E (εt|X1, . . . , XT ) = E (εt|Xt) = 0 ∀t
Particularly, note that we are requiring the disturbance to be uncorrelated with
past, present and future realizations of X.
This implies that we are discarding the possibility that disturbances can affect
future values of X.
This implication, which entails strict exogeneity of X, is very restrictive.
Cesar Alonso (UC3M) 6

ECONOMETRICS. Topic 8.
It implies that, even though shocks or disturbances affect, by definition, Y ,
never affect X. (what seems unlikely)
Implications:
∗ E (εt) = 0 ∀t (by the law of iterated expectations).
∗ C (Xt, εt) = 0 ∀t
∗ From assumptions 1. and 2.,
E (Yt|X1, . . . , XT ) = E (Yt|Xt) = β0 + β1Xt
i.e., the CEF is linear.
3.
(i) V (εt|X1, . . . , XT ) = V (εt|Xt) = σ2 ∀t
(Conditional homoskedasticity)
(ii) C (εt, εt−j|X1, . . . , XT ) = C (εt, εt−j|Xt, Xt−j) = σt,t−j ∀t, j (j 6= 0)
(Conditional autocorrelation or conditional serial correlation)
This assumption implies that the covariance between any two disturbances
occurred in different periods (conditional to the realizations of X in those
same periods) can differ from zero.
(iii) σt,t−j = γj ∀t, j (j 6= 0)
This assumption implies that the covariance between any two disturbances
occurred in different periods (conditional to the realizations of X in those
same periods) depends only on the time length j between both periods, but
not on the particular period t.
In other words: the conditional covariance between disturbances occurred
in 1980 and 1985 is the same as the conditional covariance between distur-
bances occurred in 1990 and 1995.
This assumption relies on the stationarity (in covariance) condition,
which establishes that all first- and second- order conditional moments
(means, variances and covariances) do not depend on the period of ref-
erence.
Actually, stationarity condition is already implicit in assumption 2. an in
Cesar Alonso (UC3M) 7

ECONOMETRICS. Topic 8.
assumption 3.(i).
Intuitively, stationarity entails that the relationship between variables is
relatively stable along time. Otherwise, the parameters characterizing such
relationship would vary along time, precluding us to infer how changes in a
variable affect the mean value of another variable.
Thus, assumptions 3.(i), 3.(ii) and 3.(iii) together establish that
V (εt|X1, . . . , XT ) = V (εt|Xt) = σ2 ∀t
C (εt, εt−j|X1, . . . , XT ) = C (εt, εt−j|Xt, Xt−j) = γj ∀t, j (j 6= 0)
Implications (by the law of iterated expectations):
V (εt) = σ2 ∀t
C (εt, εt−j) = γj ∀t, j (j 6= 0)
Cesar Alonso (UC3M) 8

ECONOMETRICS. Topic 8.
3 Consequences on OLS estimation
• What are the implications of autocorrelation on the properties of the OLS linear
regression of Y on X, i.e., Y = β0 + β1X?
• Recall that, for a given sample, the OLS slope can be expressed as
β1 =∑t
ctYt
where, defining the explanatory variable in deviations with respect to its mean, xs =
Xs −X,
ct = xt/∑s
x2s
• Besides, we know that
∑t
ct = 0,∑t
ctXt = 1,∑t
c2t = 1/∑s
x2s
Thus, β has conditional mean:
E(β1
∣∣∣X1, . . . , XT
)=∑t
ctE (Yt|Xt) =∑t
ct (β0 + β1Xt)
= β0∑t
ct + β1∑t
ctXt = β1
Consequently, with the earlier assumptions, the OLS estimator remains unbiased.
• Moreover, it can be easily checked that
p lim β1 = β1,
so that the OLS estimator β1 is a consistent estimator of β1. To see this, notice
that
β1 =
1T
T∑t=1
xtYt
1T
T∑s=1
x2s
=SXYS2X
.
β1 =C(Xt, Yt)
V (Xt)
As SXY , S2X are consistent estimators of C(Xt, Yt), V (Xt), respectively, the ratio
between SXY and S2X estimates consistently β1.
Cesar Alonso (UC3M) 9
ECONOMETRICS. Topic 8.
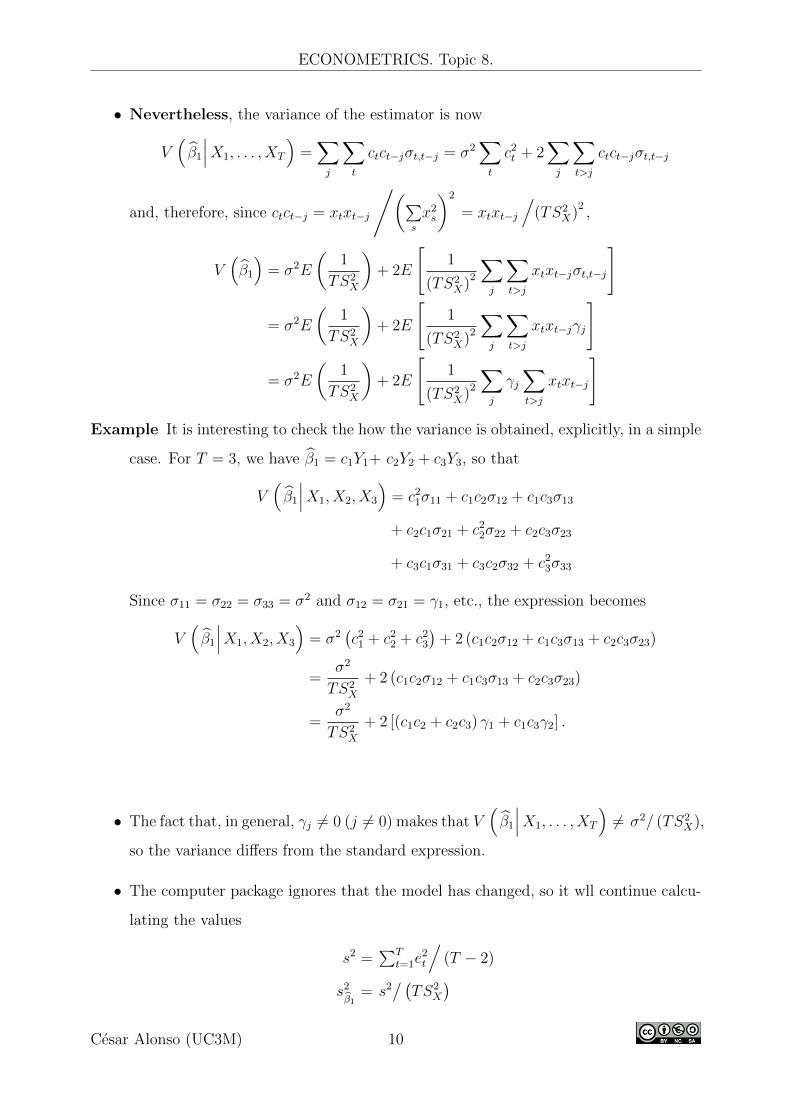
• Nevertheless, the variance of the estimator is now
V(β1
∣∣∣X1, . . . , XT
)=∑j
∑t
ctct−jσt,t−j = σ2∑t
c2t + 2∑j
∑t>j
ctct−jσt,t−j
and, therefore, since ctct−j = xtxt−j
/(∑s
x2s
)2
= xtxt−j
/(TS2
X)2,
V(β1
)= σ2E
(1
TS2X
)+ 2E
[1
(TS2X)
2
∑j
∑t>j
xtxt−jσt,t−j
]
= σ2E
(1
TS2X
)+ 2E
[1
(TS2X)
2
∑j
∑t>j
xtxt−jγj
]
= σ2E
(1
TS2X
)+ 2E
[1
(TS2X)
2
∑j
γj∑t>j
xtxt−j
]
Example It is interesting to check the how the variance is obtained, explicitly, in a simple
case. For T = 3, we have β1 = c1Y1+ c2Y2 + c3Y3, so that
V(β1
∣∣∣X1, X2, X3
)= c21σ11 + c1c2σ12 + c1c3σ13
+ c2c1σ21 + c22σ22 + c2c3σ23
+ c3c1σ31 + c3c2σ32 + c23σ33
Since σ11 = σ22 = σ33 = σ2 and σ12 = σ21 = γ1, etc., the expression becomes
V(β1
∣∣∣X1, X2, X3
)= σ2
(c21 + c22 + c23
)+ 2 (c1c2σ12 + c1c3σ13 + c2c3σ23)
=σ2
TS2X
+ 2 (c1c2σ12 + c1c3σ13 + c2c3σ23)
=σ2
TS2X
+ 2 [(c1c2 + c2c3) γ1 + c1c3γ2] .
• The fact that, in general, γj 6= 0 (j 6= 0) makes that V(β1
∣∣∣X1, . . . , XT
)6= σ2/ (TS2
X),
so the variance differs from the standard expression.
• The computer package ignores that the model has changed, so it wll continue calcu-
lating the values
s2 =∑T
t=1e2t
/(T − 2)
s2β1
= s2/ (TS2
X
)Cesar Alonso (UC3M) 10

ECONOMETRICS. Topic 8.
• Clearly, the standard estimator of the variance does not provide a proper estimate
of σ2β1
, and the usual calculation of the standard error is inappropriate.
Consequently, the usual confidence intervals and hypotheses test statistics are also
wrong.
• Efficiency
OLS, in this context, is not the Best Linear Unbiased Estimator.
(Because it ignores the autocorrelation structure between errors).
Cesar Alonso (UC3M) 11

ECONOMETRICS. Topic 8.
4 Inference robust to autocorrelation: Newey-West
variance estimator
• The rationale to obtain estimators of the variance of the OLS estimator that are ro-
bust to autocorrelation is similar to the one proposed by Eicker-White for conditional
heteroskedasticity.
• In this respect, the natural way to estimate the additional term
∑j
∑t>j
xtxt−jγj =∑j
γj∑t>j
xtxt−j
would be, denoting the model residuals as εt = Yt − Yt = Yt −(β0 + β1Xt
), (t =
1, . . . , T ):J∑j=1
1
T − j∑t (t>j)
xtxt−j εtεt−j.
and, using the assumption C (εt, εt−j) = γj ∀t, j (j 6= 0), can be simplified to
J∑j=1
1
T − j
( ∑t (t>j)
εtεt−j
)( ∑t (t>j)
xtxt−j
).
• There appears the problem that, in principle, the sum across j should account from
1 to ∞ in order to capture all the possible non-zero covariances, but in practice, it
is limited by the sample size T .
In fact, the choice of J is arbitrary, a usual criterion being
J = int[(T )1/4
]where int(w) is the function that yields the integer of w.
In practice, the choice is subject to the data frequency and the number of available
observations.
– Annual data: J between 1 and 3.
– Quarterly data: J between 4 and 12.
– Monthly data: J between 12 and36.
Cesar Alonso (UC3M) 12
ECONOMETRICS. Topic 8.
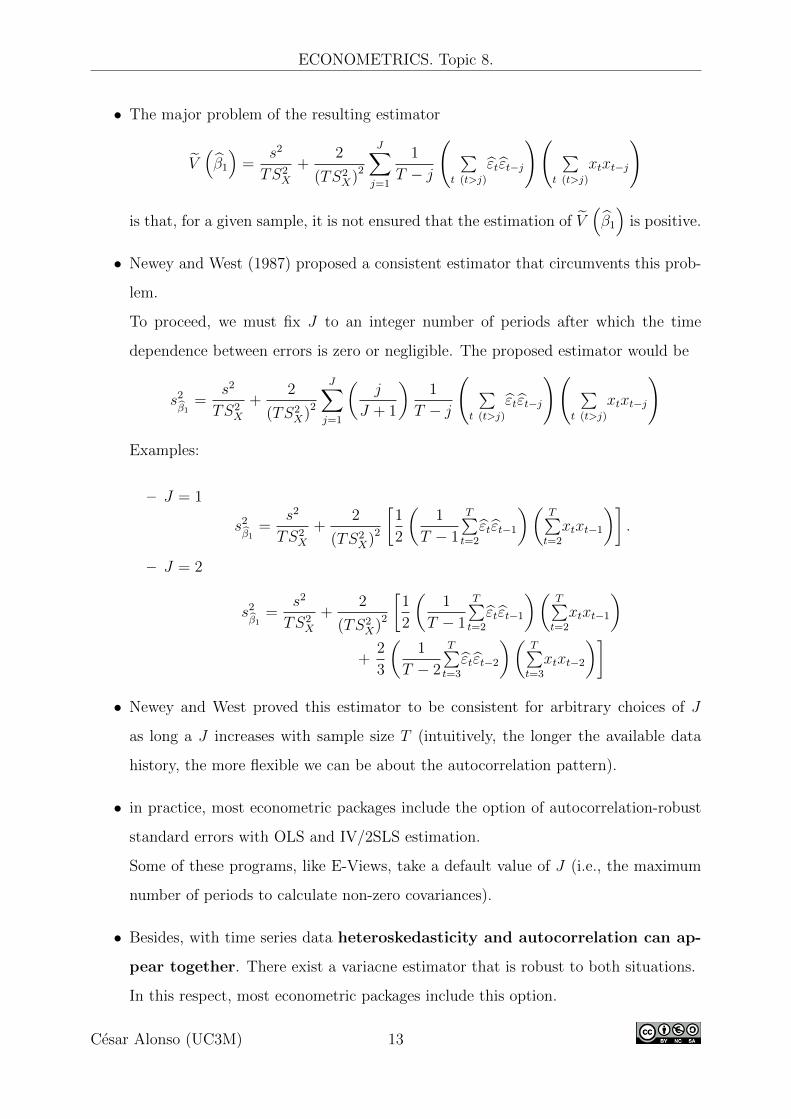
• The major problem of the resulting estimator
V(β1
)=
s2
TS2X
+2
(TS2X)
2
J∑j=1
1
T − j
( ∑t (t>j)
εtεt−j
)( ∑t (t>j)
xtxt−j
)
is that, for a given sample, it is not ensured that the estimation of V(β1
)is positive.
• Newey and West (1987) proposed a consistent estimator that circumvents this prob-
lem.
To proceed, we must fix J to an integer number of periods after which the time
dependence between errors is zero or negligible. The proposed estimator would be
s2β1
=s2
TS2X
+2
(TS2X)
2
J∑j=1
(j
J + 1
)1
T − j
( ∑t (t>j)
εtεt−j
)( ∑t (t>j)
xtxt−j
)
Examples:
– J = 1
s2β1
=s2
TS2X
+2
(TS2X)
2
[1
2
(1
T − 1
T∑t=2
εtεt−1
)(T∑t=2
xtxt−1
)].
– J = 2
s2β1
=s2
TS2X
+2
(TS2X)
2
[1
2
(1
T − 1
T∑t=2
εtεt−1
)(T∑t=2
xtxt−1
)+
2
3
(1
T − 2
T∑t=3
εtεt−2
)(T∑t=3
xtxt−2
)]• Newey and West proved this estimator to be consistent for arbitrary choices of J
as long a J increases with sample size T (intuitively, the longer the available data
history, the more flexible we can be about the autocorrelation pattern).
• in practice, most econometric packages include the option of autocorrelation-robust
standard errors with OLS and IV/2SLS estimation.
Some of these programs, like E-Views, take a default value of J (i.e., the maximum
number of periods to calculate non-zero covariances).
• Besides, with time series data heteroskedasticity and autocorrelation can ap-
pear together. There exist a variacne estimator that is robust to both situations.
In this respect, most econometric packages include this option.
Cesar Alonso (UC3M) 13
ECONOMETRICS. Topic 8.
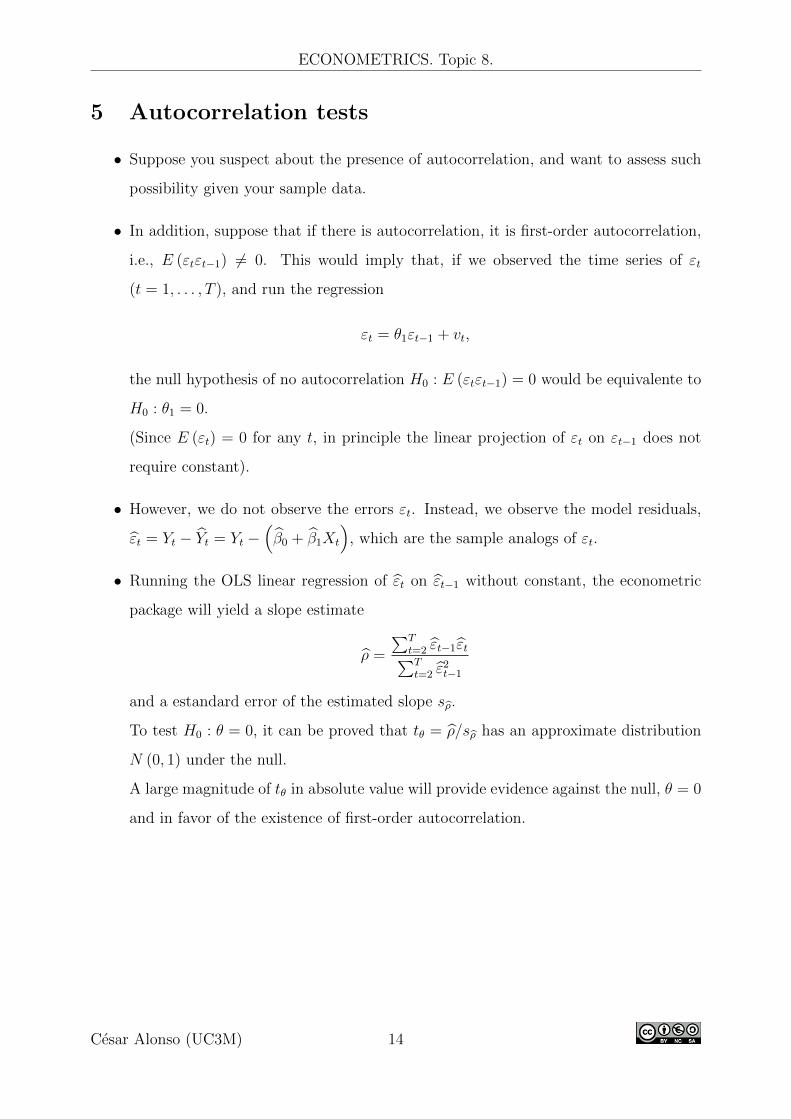
5 Autocorrelation tests
• Suppose you suspect about the presence of autocorrelation, and want to assess such
possibility given your sample data.
• In addition, suppose that if there is autocorrelation, it is first-order autocorrelation,
i.e., E (εtεt−1) 6= 0. This would imply that, if we observed the time series of εt
(t = 1, . . . , T ), and run the regression
εt = θ1εt−1 + vt,
the null hypothesis of no autocorrelation H0 : E (εtεt−1) = 0 would be equivalente to
H0 : θ1 = 0.
(Since E (εt) = 0 for any t, in principle the linear projection of εt on εt−1 does not
require constant).
• However, we do not observe the errors εt. Instead, we observe the model residuals,
εt = Yt − Yt = Yt −(β0 + β1Xt
), which are the sample analogs of εt.
• Running the OLS linear regression of εt on εt−1 without constant, the econometric
package will yield a slope estimate
ρ =
∑Tt=2 εt−1εt∑Tt=2 ε
2t−1
and a estandard error of the estimated slope sρ.
To test H0 : θ = 0, it can be proved that tθ = ρ/sρ has an approximate distribution
N (0, 1) under the null.
A large magnitude of tθ in absolute value will provide evidence against the null, θ = 0
and in favor of the existence of first-order autocorrelation.
Cesar Alonso (UC3M) 14
ECONOMETRICS. Topic 8.
• The most popular first-order autocorrelation test (reported by most econometric
packages) is the Durbin-Watson test d.
This test is relarted with the first-order autocorrelation statistic that we have shown
in the form,
d ' 2(1− ρ).
However, the Durbin-Watson test has the inconvenient that its critical values depend
on the sample size.
Besides, its interpretation is counterintuitive, as small values of the Durbin-Watson
statistic point out high and positive autocorrelation, and vice versa.
• In practice, we can test for the existence of higher order autocorrelation. For example,
if we wanted to test for autocorrelation up to order q, we can run the regression
εt = θ0 + θ1εt−1 + θ2εt−2 + · · ·+ θqεt−q + vt,
where εt = Yt − Yt = Yt −(β0 + β1Xt
)are the OLS residuals, and test the null
H0 : θ1 = θ2 = · · · = θq = 0.
Intuitively, this test is, in practice, a regression test.
Cesar Alonso (UC3M) 15
Related Documents