Corporate Financial Policy Semester A 2012-13 City University of Hong Kong AC4331 – Topic 6

Welcome message from author
This document is posted to help you gain knowledge. Please leave a comment to let me know what you think about it! Share it to your friends and learn new things together.
Transcript

7/29/2019 Topic 7 (2012-13A)MP
http://slidepdf.com/reader/full/topic-7-2012-13amp 1/108
Corporate Financial Policy
Semester A 2012-13City University of Hong Kong
AC4331 – Topic 6

7/29/2019 Topic 7 (2012-13A)MP
http://slidepdf.com/reader/full/topic-7-2012-13amp 2/108
Topic 7
.

7/29/2019 Topic 7 (2012-13A)MP
http://slidepdf.com/reader/full/topic-7-2012-13amp 3/108
1-2
Introduction to Financial Management
Free Cash Flow
Financial Planning and Forecasting
Financial Assets and Time Value of Money
Risk and Return Bond and Stock Valuation
Cost of Capital
Cash Flow Estimation and Risk Analysis Capital Structure and Leverage Treasury and Valuation
Enterprise Risk Management Dividends and Share Repurchase
Merger and Acquisitions
Working Capital Management

7/29/2019 Topic 7 (2012-13A)MP
http://slidepdf.com/reader/full/topic-7-2012-13amp 4/108
Extra Ref: Smart,Chapter 13
Financial Management, Theory and Practice, 12e Eugene and
Brigham
Topic 7:Capital Structure and Leverage

7/29/2019 Topic 7 (2012-13A)MP
http://slidepdf.com/reader/full/topic-7-2012-13amp 5/108
Chapter 15
Business vs. Financial Risk
Optimal Capital Structure
Operating Leverage Capital Structure Theory
15-4
7/29/2019 Topic 7 (2012-13A)MP
http://slidepdf.com/reader/full/topic-7-2012-13amp 6/108
Uncertainty about future operating income(EBIT), i.e., how well can we predict operatingincome?
Note that business risk does not includefinancing effects.
Probability
EBITE(EBIT)0
Low risk
High risk
15-5

7/29/2019 Topic 7 (2012-13A)MP
http://slidepdf.com/reader/full/topic-7-2012-13amp 7/108
Uncertainty about demand (sales)
Uncertainty about output prices
Uncertainty about costs
Product, other types of liability Operating leverage
15-6

7/29/2019 Topic 7 (2012-13A)MP
http://slidepdf.com/reader/full/topic-7-2012-13amp 8/108
Operating leverage is the use of fixed costsrather than variable costs.
If most costs are fixed, hence do not decline
when demand falls, then the firm has highoperating leverage.
15-7

7/29/2019 Topic 7 (2012-13A)MP
http://slidepdf.com/reader/full/topic-7-2012-13amp 9/108
More operating leverage leads to morebusiness risk, for then a small sales declinecauses a big profit decline.
What happens if variable costs change?Sales
$ Rev.TC
FCQ BE Sales
$ Rev.
TC
FC
Q BE
} Profit
15-8

7/29/2019 Topic 7 (2012-13A)MP
http://slidepdf.com/reader/full/topic-7-2012-13amp 10/108
Typical situation: Can use operating leverageto get higher E(EBIT), but risk also increases.
Probability
EBITL
Low operating leverage
High operating leverage
EBITH
15-9

7/29/2019 Topic 7 (2012-13A)MP
http://slidepdf.com/reader/full/topic-7-2012-13amp 11/108
Financial leverage is the use of debt andpreferred stock.
Financial risk is the additional risk
concentrated on common stockholders as aresult of financial leverage.
15-10

7/29/2019 Topic 7 (2012-13A)MP
http://slidepdf.com/reader/full/topic-7-2012-13amp 12/108
Business risk depends on business factorssuch as competition, product liability, andoperating leverage.
Financial risk depends only on the types of securities issued.◦ More debt, more financial risk.
◦ Concentrates business risk on stockholders.
15-11

7/29/2019 Topic 7 (2012-13A)MP
http://slidepdf.com/reader/full/topic-7-2012-13amp 13/108
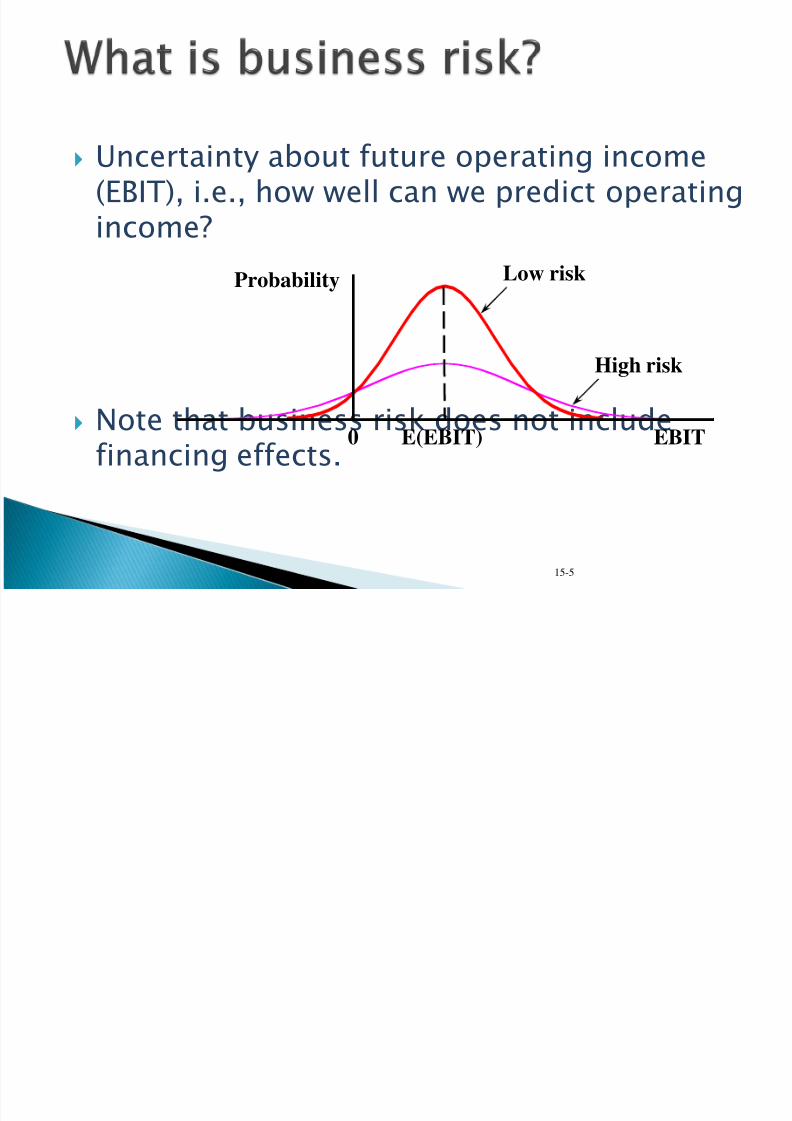
Two firms with the same operating leverage,business risk, and probability distribution of EBIT.
Only differ with respect to their use of debt(capital structure).
15-12
Firm U Firm L
No debt $10,000 of 12% debt$20,000 in assets $20,000 in assets40% tax rate 40% tax rate
7/29/2019 Topic 7 (2012-13A)MP
http://slidepdf.com/reader/full/topic-7-2012-13amp 14/108
15-13
Economy
Bad Average Good
Probability 0.25 0.50 0.25
EBIT $2,000 $3,000 $4,000Interest 0 0 0EBT $2,000 $3,000 $4,000
Taxes (40%) 800 1,200 1,600NI $1,200 $1,800 $2,400

7/29/2019 Topic 7 (2012-13A)MP
http://slidepdf.com/reader/full/topic-7-2012-13amp 15/108
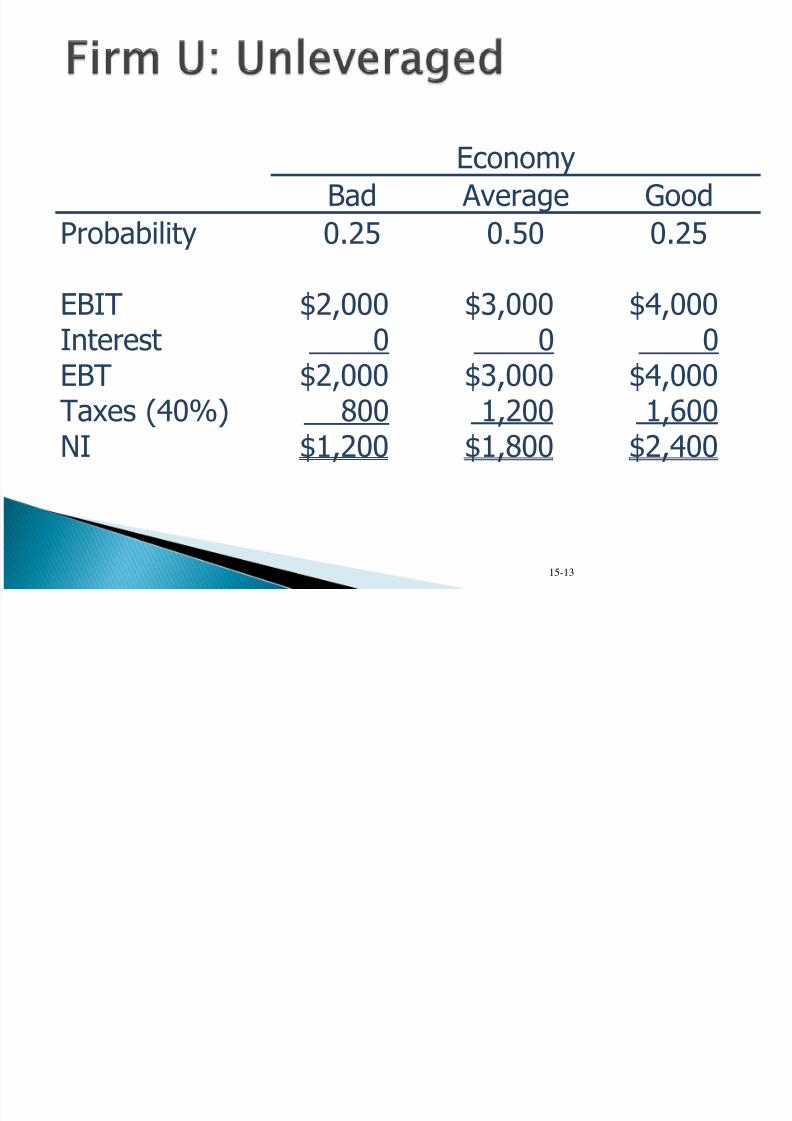
15-14
Economy
Bad Average Good
Probability* 0.25 0.50 0.25
EBIT* $2,000 $3,000 $4,000Interest 1,200 1,200 1,200EBT $ 800 $1,800 $2,800
Taxes (40%) 320 720 1,120NI $ 480 $1,080 $1,680
*Same as for Firm U.

7/29/2019 Topic 7 (2012-13A)MP
http://slidepdf.com/reader/full/topic-7-2012-13amp 16/108
15-15
Firm U Bad Average Good
BEP 10.0% 15.0% 20.0%ROE 6.0 9.0 12.0
TIE
Firm L Bad Average Good
BEP 10.0% 15.0% 20.0%
ROE 4.8 10.8 16.8TIE 1.67× 2.50x 3.30x

7/29/2019 Topic 7 (2012-13A)MP
http://slidepdf.com/reader/full/topic-7-2012-13amp 17/108
15-16
Expected values:Firm U Firm L
E(BEP) 15.0% 15.0%
E(ROE) 9.0% 10.8%E(TIE) 2.5×
Risk measures:Firm U Firm L
σROE 2.12% 4.24%CVROE 0.24 0.39

7/29/2019 Topic 7 (2012-13A)MP
http://slidepdf.com/reader/full/topic-7-2012-13amp 18/108
For leverage to raise expected ROE, musthave BEP > rd.
Why? If rd > BEP, then the interest expense
will be higher than the operating incomeproduced by debt-financed assets, soleverage will depress income.
As debt increases, TIE decreases because
EBIT is unaffected by debt, but interestexpense increases (Int Exp = rdD).
15-17
7/29/2019 Topic 7 (2012-13A)MP
http://slidepdf.com/reader/full/topic-7-2012-13amp 19/108
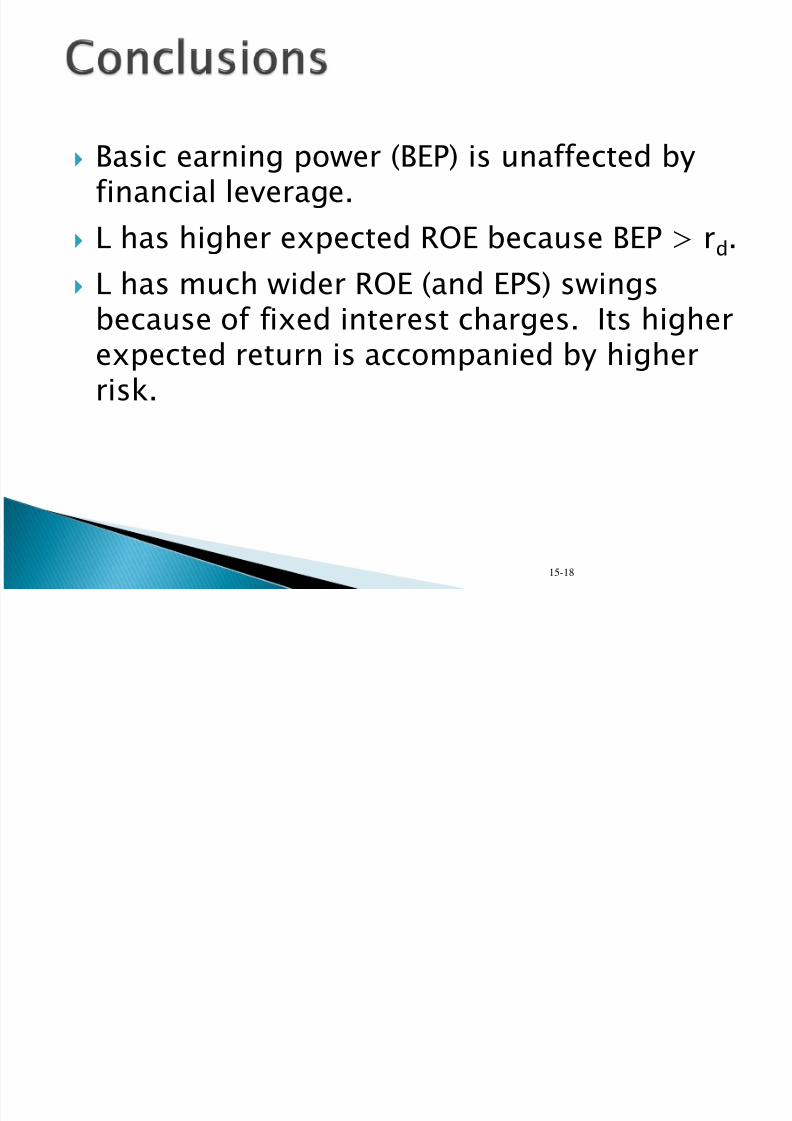
Basic earning power (BEP) is unaffected byfinancial leverage.
L has higher expected ROE because BEP > rd.
L has much wider ROE (and EPS) swingsbecause of fixed interest charges. Its higherexpected return is accompanied by higherrisk.
15-18

7/29/2019 Topic 7 (2012-13A)MP
http://slidepdf.com/reader/full/topic-7-2012-13amp 20/108
The capital structure (mix of debt, preferred,and common equity) at which P0 ismaximized.
Trades off higher E(ROE) and EPS againsthigher risk. The tax-related benefits of leverage are exactly offset by the debt’s risk-related costs.
The target capital structure is the mix of debt, preferred stock, and common equitywith which the firm intends to raise capital.
15-19

7/29/2019 Topic 7 (2012-13A)MP
http://slidepdf.com/reader/full/topic-7-2012-13amp 21/108
Firm announces the recapitalization.
New debt is issued.
Proceeds are used to repurchase stock.◦
The number of shares repurchased is equal to theamount of debt issued divided by price per share.
15-20

7/29/2019 Topic 7 (2012-13A)MP
http://slidepdf.com/reader/full/topic-7-2012-13amp 22/108
AmountBorrowed
D/A Ratio
D/ERatio
BondRating rd
$ 0 0 0 -- --
250 0.125 0.143 AA 8.0%
500 0.250 0.333 A 9.0%
750 0.375 0.600 BBB 11.5%
1,000 0.500 1.000 BB 14.0%
15-21

7/29/2019 Topic 7 (2012-13A)MP
http://slidepdf.com/reader/full/topic-7-2012-13amp 23/108
As the firm borrows more money, the firmincreases its financial risk causing the firm’sbond rating to decrease, and its cost of debtto increase.
15-22

7/29/2019 Topic 7 (2012-13A)MP
http://slidepdf.com/reader/full/topic-7-2012-13amp 24/108
$3.00
80,000
(0.6)($400,000)
goutstandinSharesT)D)(1r(EBIT EPS
$0D
d
15-23

7/29/2019 Topic 7 (2012-13A)MP
http://slidepdf.com/reader/full/topic-7-2012-13amp 25/108
20x$20,000
$400,000
ExpInt
EBIT TIE
$3.26
10,00080,000
000))(0.6)0.08($250,($400,000
goutstandinShares
T)D)(1r(EBIT EPS
10,000$25
$250,000 drepurchaseShares
d
15-24

7/29/2019 Topic 7 (2012-13A)MP
http://slidepdf.com/reader/full/topic-7-2012-13amp 26/108
8.9x$45,000
$400,000
ExpInt
EBIT TIE
$3.55
20,00080,000
000))(0.6)0.09($500,($400,000
goutstandinShares
T)D)(1r(EBIT EPS
20,000$25
$500,000 drepurchaseShares
d
15-25

7/29/2019 Topic 7 (2012-13A)MP
http://slidepdf.com/reader/full/topic-7-2012-13amp 27/108
4.6x$86,250
$400,000
ExpInt
EBIT TIE
$3.77
30,00080,000
),000))(0.60.115($750($400,000
goutstandinShares T)D)(1r(EBIT EPS
30,000$25
$750,000 drepurchaseShares
d
15-26

7/29/2019 Topic 7 (2012-13A)MP
http://slidepdf.com/reader/full/topic-7-2012-13amp 28/108
2.9x$140,000
$400,000
ExpInt
EBIT TIE
$3.90
40,00080,000
6)0,000))(0.0.14($1,00($400,000
goutstandinSharesT)D)(1r(EBIT EPS
40,000$25
$1,000,000 drepurchaseShares
d
15-27

7/29/2019 Topic 7 (2012-13A)MP
http://slidepdf.com/reader/full/topic-7-2012-13amp 29/108
sss
10
r
DPS
r
EPS
gr
D P̂
If all earnings are paid out as dividends,E(g) = 0.
EPS = DPS.
To find the expected stock price ( ),we must find the appropriate rs at each of the debt levels discussed.
15-28
Pˆ0
7/29/2019 Topic 7 (2012-13A)MP
http://slidepdf.com/reader/full/topic-7-2012-13amp 30/108
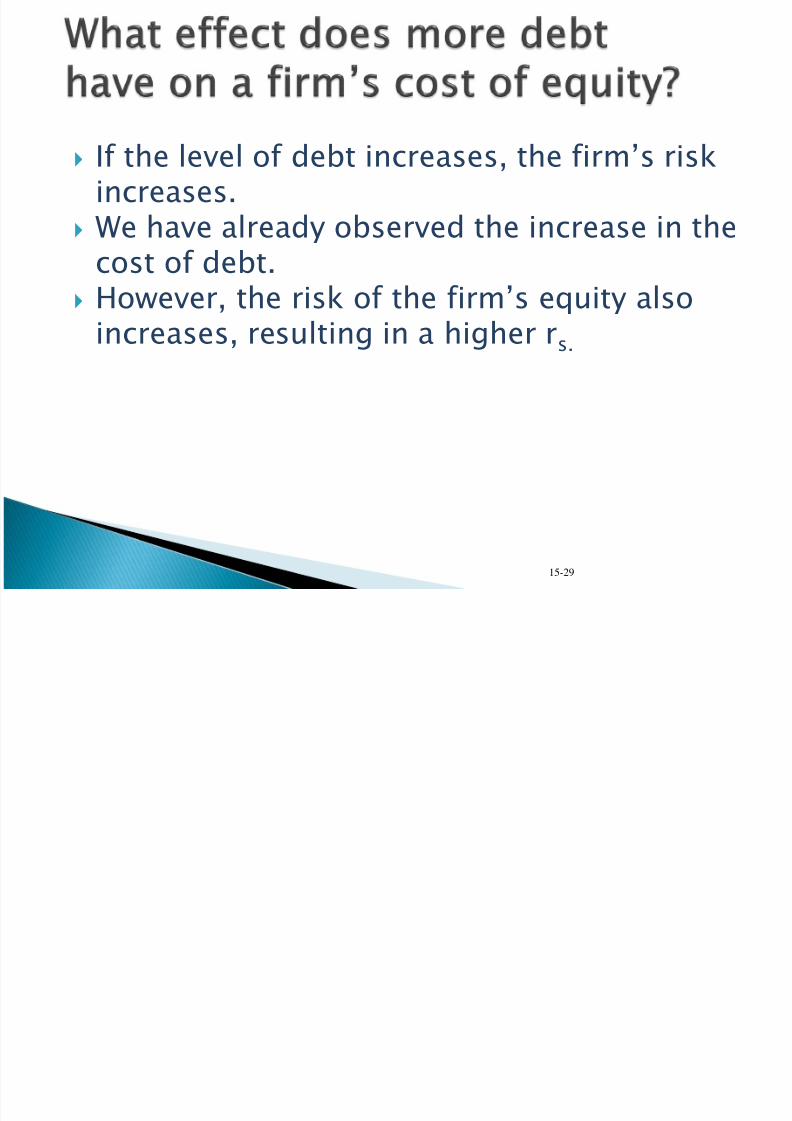
If the level of debt increases, the firm’s riskincreases.
We have already observed the increase in thecost of debt.
However, the risk of the firm’s equity alsoincreases, resulting in a higher rs.
15-29

7/29/2019 Topic 7 (2012-13A)MP
http://slidepdf.com/reader/full/topic-7-2012-13amp 31/108
Because the increased use of debt causesboth the costs of debt and equity to increase,we need to estimate the new cost of equity.
The Hamada equation attempts to quantifythe increased cost of equity due to financialleverage.
Uses the firm’s unlevered beta, which
represents the firm’s business risk as if ithad no debt.
15-30
7/29/2019 Topic 7 (2012-13A)MP
http://slidepdf.com/reader/full/topic-7-2012-13amp 32/108
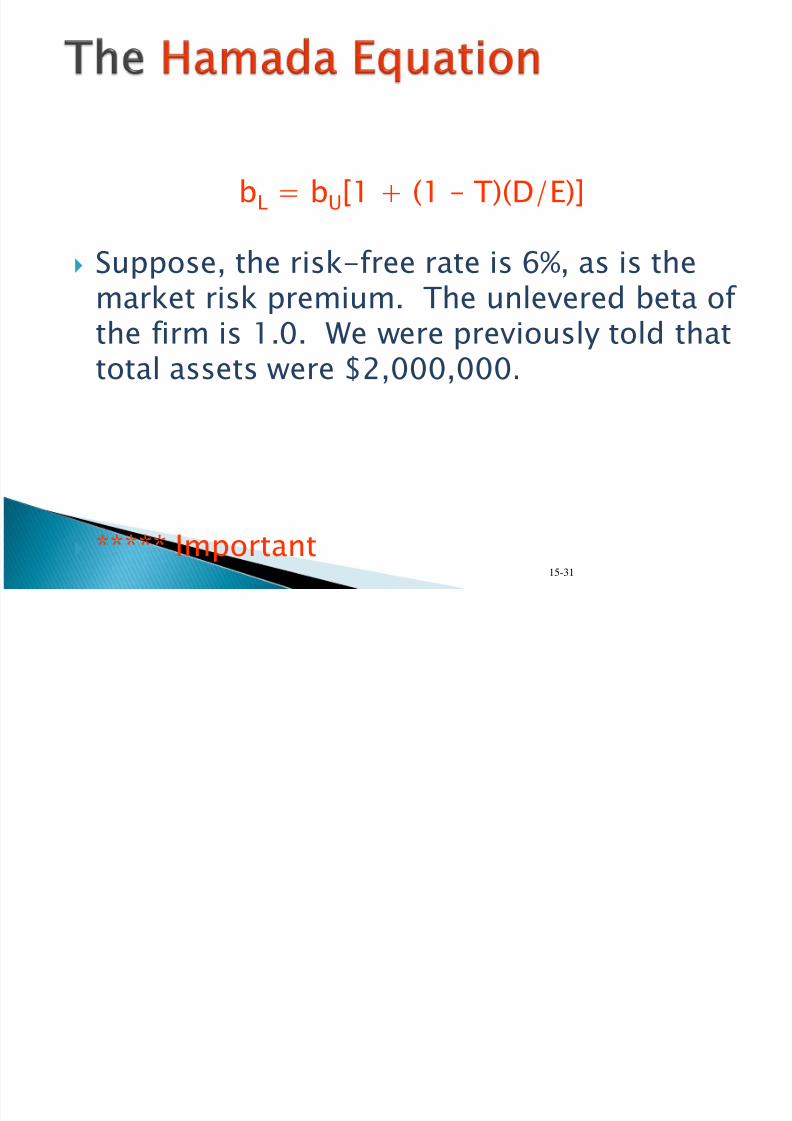
bL = bU[1 + (1 – T)(D/E)]
Suppose, the risk-free rate is 6%, as is themarket risk premium. The unlevered beta of the firm is 1.0. We were previously told thattotal assets were $2,000,000.
***** Important 15-31

7/29/2019 Topic 7 (2012-13A)MP
http://slidepdf.com/reader/full/topic-7-2012-13amp 33/108
If D = $250,
bL = 1.0[1 + (0.6)($250/$1,750)]= 1.0857
rs = rRF + (rM – rRF)bL = 6.0% + (6.0%)1.0857
= 12.51%
15-32

7/29/2019 Topic 7 (2012-13A)MP
http://slidepdf.com/reader/full/topic-7-2012-13amp 34/108
AmountBorrowed
D/A Ratio
D/ERatio
LeveredBeta rs
$ 0 0% 0% 1.00 12.00%
250 12.50 14.29 1.09 12.51
500 25.00 33.33 1.20 13.20
750 37.50 60.00 1.36 14.16
1,000 50.00 100.00 1.60 15.60
15-33

7/29/2019 Topic 7 (2012-13A)MP
http://slidepdf.com/reader/full/topic-7-2012-13amp 35/108
15-34

7/29/2019 Topic 7 (2012-13A)MP
http://slidepdf.com/reader/full/topic-7-2012-13amp 36/108
The firm’s optimal capital structure can bedetermined two ways:◦ Minimizes WACC.
◦ Maximizes stock price.
Both methods yield the same results.
15-35
7/29/2019 Topic 7 (2012-13A)MP
http://slidepdf.com/reader/full/topic-7-2012-13amp 37/108
36

7/29/2019 Topic 7 (2012-13A)MP
http://slidepdf.com/reader/full/topic-7-2012-13amp 38/108
37
Homogeneous Expectations Homogeneous Business Risk Classes
Perpetual Cash Flows
Perfect Capital Markets:◦ Perfect competition
◦ Firms and investors can borrow/lend at the samerate
◦
Equal access to all relevant information◦ No transaction costs
◦ No taxes
7/29/2019 Topic 7 (2012-13A)MP
http://slidepdf.com/reader/full/topic-7-2012-13amp 39/108
38
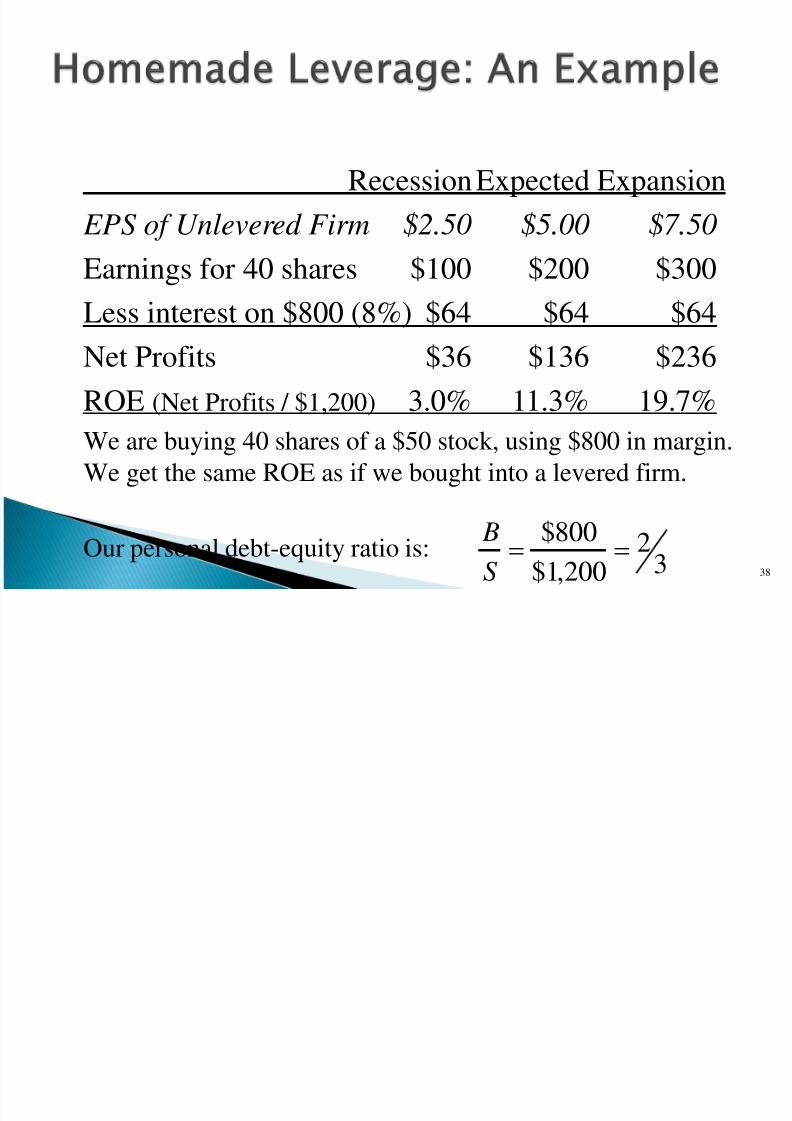
Recession Expected Expansion
EPS of Unlevered Firm $2.50 $5.00 $7.50
Earnings for 40 shares $100 $200 $300Less interest on $800 (8%) $64 $64 $64
Net Profits $36 $136 $236
ROE (Net Profits / $1,200) 3.0% 11.3% 19.7%
We are buying 40 shares of a $50 stock, using $800 in margin.
We get the same ROE as if we bought into a levered firm.
Our personal debt-equity ratio is: 32
200,1$
800$S
B

7/29/2019 Topic 7 (2012-13A)MP
http://slidepdf.com/reader/full/topic-7-2012-13amp 40/108
39
RecessionExpected ExpansionEPS of Levered Firm $1.50 $5.67 $9.83 Earnings for 24 shares$36 $136 $236
Plus interest on $800 (8%)$64 $64 $64Net Profits $100 $200 $300ROE (Net Profits / $2,000) 5% 10% 15%Buying 24 shares of an otherwise identical levered
firm along with some of the firm’s debt gets us to theROE of the unlevered firm.
This is the fundamental insight of M&M

7/29/2019 Topic 7 (2012-13A)MP
http://slidepdf.com/reader/full/topic-7-2012-13amp 41/108
40
We can create a levered or unlevered positionby adjusting the trading in our own account.
This homemade leverage suggests thatcapital structure is irrelevant in determining
the value of the firm:
V L = V U

7/29/2019 Topic 7 (2012-13A)MP
http://slidepdf.com/reader/full/topic-7-2012-13amp 42/108
41
Proposition II◦ Leverage increases the risk and return to
stockholders
R s = R 0 + (B / S ) (R 0 - R B)R B is the interest rate (cost of debt)
R S is the return on (levered) equity (cost of equity)
R 0 is the return on unlevered equity (cost of capital)
B is the value of debt
S is the value of equity

7/29/2019 Topic 7 (2012-13A)MP
http://slidepdf.com/reader/full/topic-7-2012-13amp 43/108
42
The derivation is straightforward:
S BWACC R
S B
S R
S B
B R
0setThen R RWACC
0 R RS B
S RS B
BS B
S
S B bysidesbothmultiply
0 RS
S B R
S B
S
S
S B R
S B
B
S
S B
S B
0 RS
S B R R
S
B
S B
00 R RS
B R R
S
B
S B )( 00 BS
R R
S
B R R

7/29/2019 Topic 7 (2012-13A)MP
http://slidepdf.com/reader/full/topic-7-2012-13amp 44/108
43
Debt-to-equity Ratio
C o s t o f c a p i t a l : R ( % )
R0
R B
S BWACC R
S B
S R
S B
B R
)( 00 BS R R
S
B R R
R B
S
B

7/29/2019 Topic 7 (2012-13A)MP
http://slidepdf.com/reader/full/topic-7-2012-13amp 45/108
44
Proposition I (with Corporate Taxes)◦ Firm value increases with leverage
V L = V U + t C B
Proposition II (with Corporate Taxes)◦ Some of the increase in equity risk and return is
offset by the interest tax shield
R S = R 0 + (B/S )×(1-t C )×(R 0 - R B ) R B is the interest rate (cost of debt)
R S is the return on equity (cost of equity)
R 0 is the return on unlevered equity (cost of capital)
B is the value of debt
S is the value of equity

7/29/2019 Topic 7 (2012-13A)MP
http://slidepdf.com/reader/full/topic-7-2012-13amp 46/108
45 Bt V V C U L
B Rt B R EBIT BC B
)1()(
isrsstakeholdealltoflowcashtotalThe
The present value of this stream of cash flows is V L
B Rt B R EBIT BC B
)1()(Clearly
The present value of the first term is V U
The present value of the second term is t C B
B Rt B Rt EBIT BC BC
)1()1(
B R Bt R B Rt EBIT BC B BC )1(

7/29/2019 Topic 7 (2012-13A)MP
http://slidepdf.com/reader/full/topic-7-2012-13amp 47/108
46
Start with M&M Proposition I with taxes:
)()1( 00 BC S R Rt S
B
R R
Bt V V C U L
Since BS V L
The cash flows from each side of the balance sheet must equal:
BC U BS BRt RV BRSR 0
B Rt Rt BS BRSR BC C BS
0)]1([
Divide both sides by S
BC C BS Rt
S
B Rt
S
B R
S
B R 0)]1(1[
Bt V BS C U
)1( C U
t BS V
Which quickly reduces to

7/29/2019 Topic 7 (2012-13A)MP
http://slidepdf.com/reader/full/topic-7-2012-13amp 48/108
47Debt-to-equityratio ( B / S )
Cost of capital: R (%)
R0
R B
)()1( 00 BC S R Rt
S
B R R
S C BWACC R
S B
S t RS B
B R
)1(
)( 00 BS R R
S
B R R

7/29/2019 Topic 7 (2012-13A)MP
http://slidepdf.com/reader/full/topic-7-2012-13amp 49/108
48
Recession Expected Expansion
EBIT $1,000 $2,000 $3,000
Interest 0 0 0
EBT $1,000 $2,000 $3,000
Taxes (t c = 35%) $350 $700 $1,050
Total Cash Flow to S/H $650 $1,300 $1,950
Recession Expected Expansion
EBIT $1,000 $2,000 $3,000
Interest ($800 @ 8% ) 640 640 640
EBT $360 $1,360 $2,360
Taxes (t c = 35%) $126 $476 $826
Total Cash Flow $234+640 $884+$640 $1,534+$640
(to both S/H & B/H): $874 $1,524 $2,174
EBIT(1-t c )+t C R B B $650+$224 $1,300+$224 $1,950+$224
$874 $1,524 $2,174
A
l l E q u i t y
L e v e r e d

7/29/2019 Topic 7 (2012-13A)MP
http://slidepdf.com/reader/full/topic-7-2012-13amp 50/108
49
The levered firm pays less in taxes than does the all-equity firm.
Thus, the sum of the debt plus the equity of the levered firm is
greater than the equity of the unlevered firm.
This is how cutting the pie differently can make the pie “larger.”
-the government takes a smaller slice of the pie!
S G S G
B
All-equity firm Levered firm

7/29/2019 Topic 7 (2012-13A)MP
http://slidepdf.com/reader/full/topic-7-2012-13amp 51/108
50
In a world of no taxes, the value of the firm isunaffected by capital structure.
This is M&M Proposition I:
V L = V U Proposition I holds because shareholders can
achieve any pattern of payouts they desire withhomemade leverage.
In a world of no taxes, M&M Proposition II statesthat leverage increases the risk and return tostockholders.
)( 00 BS R R
S
B R R

7/29/2019 Topic 7 (2012-13A)MP
http://slidepdf.com/reader/full/topic-7-2012-13amp 52/108
51
In a world of taxes, but no bankruptcy costs, thevalue of the firm increases with leverage.
This is M&M Proposition I:
V L = V U + t C B Proposition I holds because shareholders can
achieve any pattern of payouts they desire withhomemade leverage.
In a world of taxes, M&M Proposition II states thatleverage increases the risk and return tostockholders.
)()1( 00 BC S R Rt
S
B R R

7/29/2019 Topic 7 (2012-13A)MP
http://slidepdf.com/reader/full/topic-7-2012-13amp 53/108
Life Corporation has 7 million shares of ordinary equityoutstanding, 1 million shares of 6 percent preferred stockoutstanding and 100,000 9 percent semi-annual bondsoutstanding, par value $1,000 each. Current market value of stock is $35 per share and its beta is 1.0, the preferred stock
currently sells at $60 per share, and the bond has 15 years tomaturity and is currently selling for $890. The market riskpremium is 8%, T-bills are yielding 3 %, and the company’stax rate is 16%.
(i) Find the market value capital structure of the firm
(ii)If the firm is evaluating a project that has same risk asthe firm’s existing projects, what rate should the firm use todiscount the project’s future cash flows? If the project hashigher risk than the firm’s existing projects, what should thefirm do in order to evaluate the project?
52

7/29/2019 Topic 7 (2012-13A)MP
http://slidepdf.com/reader/full/topic-7-2012-13amp 54/108
53
T di Off D bt’ B fit d C t

7/29/2019 Topic 7 (2012-13A)MP
http://slidepdf.com/reader/full/topic-7-2012-13amp 55/108
• The optimal capital structure occurs where the marginal benefit of
additional debt is equal to the marginal cost.• How do managers trade-off the benefits and costs of debt to
establish a target capital structure that maximizes firm value?
54
Trading Off Debt’s Benefits and Costs
Figure 1 Weighing Debt’s Benefits and

7/29/2019 Topic 7 (2012-13A)MP
http://slidepdf.com/reader/full/topic-7-2012-13amp 56/108
55
Figure 1 Weighing Debt s Benefits andCosts to Find Optimal Capital Structure
A manager facing these cost and benefit
curves would choose a debt level where thetwo curves intersect.
Figure 2 Weighing Debt’s Benefits and

7/29/2019 Topic 7 (2012-13A)MP
http://slidepdf.com/reader/full/topic-7-2012-13amp 57/108
56
Figure 2 Weighing Debt s Benefits andCosts to Find Optimal Capital Structure
If a firm has no debt, its value equals Vu.
From there, if the firm adds debt to itscapital structure, its value begins to rise,
reaches a peak, and from there, adding more
debt decreases firm value.
Figure 3 Weighing Debt’s Benefits and

7/29/2019 Topic 7 (2012-13A)MP
http://slidepdf.com/reader/full/topic-7-2012-13amp 58/108
57
Figure 3 Weighing Debt s Benefits andCosts to Find Optimal Capital Structure
Managers want to find the debt ratio that
minimizes the cost of capital because itmaximizes firm value. The optimum point
in Panel C is the same optimum debt ratio as
in Panels A & B.

7/29/2019 Topic 7 (2012-13A)MP
http://slidepdf.com/reader/full/topic-7-2012-13amp 59/108
AmountBorrowed
D/A Ratio
E/A Ratio rs rd(1 – T) WACC
$ 0 0% 100% 12.00% -- 12.00%
250 12.50 87.50 12.51 4.80% 11.55
500 25.00 75.00 13.20 5.40% 11.25
750 37.50 62.50 14.16 6.90% 11.44
1,000 50.00 50.00 15.60 8.40% 12.00
15-58

7/29/2019 Topic 7 (2012-13A)MP
http://slidepdf.com/reader/full/topic-7-2012-13amp 60/108
AmountBorrowed DPS rs P0
$ 0 $3.00 12.00% $25.00
250 3.26 12.51 26.03
500 3.55 13.20 26.89
750 3.77 14.16 26.59
1,000 3.90 15.60 25.00
15-59

7/29/2019 Topic 7 (2012-13A)MP
http://slidepdf.com/reader/full/topic-7-2012-13amp 61/108
Maximum EPS = $3.90 at D = $1,000,000,and D/A = 50%. (Remember DPS = EPSbecause payout = 100%.)
Risk is too high at D/A = 50%.
15-60

7/29/2019 Topic 7 (2012-13A)MP
http://slidepdf.com/reader/full/topic-7-2012-13amp 62/108
P0 is maximized ($26.89) at D/A =$500,000/$2,000,000 = 25%, so optimalD/A = 25%.
EPS is maximized at 50%, but primaryinterest is stock price, not E(EPS).
The example shows that we can push upE(EPS) by using more debt, but the risk
resulting from increased leverage more thanoffsets the benefit of higher E(EPS).
15-61

7/29/2019 Topic 7 (2012-13A)MP
http://slidepdf.com/reader/full/topic-7-2012-13amp 63/108
15-62

7/29/2019 Topic 7 (2012-13A)MP
http://slidepdf.com/reader/full/topic-7-2012-13amp 64/108
If there were higher business risk, then theprobability of financial distress would begreater at any debt level, and the optimalcapital structure would be one that had less
debt.
However, lower business risk would lead toan optimal capital structure with more debt.
15-63

7/29/2019 Topic 7 (2012-13A)MP
http://slidepdf.com/reader/full/topic-7-2012-13amp 65/108
1.Sales stability?2.High operating leverage?
3.Increase in the corporate tax rate?
4.Increase in the personal tax rate?5.Increase in bankruptcy costs?
6.Management spending lots of money onlavish perks?
15-64

7/29/2019 Topic 7 (2012-13A)MP
http://slidepdf.com/reader/full/topic-7-2012-13amp 66/108
Value of Stock
0 D1 D2 D/A
MMresult
Actual
Noleverage
15-65
Example: PV of Tax Debt Shield

7/29/2019 Topic 7 (2012-13A)MP
http://slidepdf.com/reader/full/topic-7-2012-13amp 67/108
66
Example: PV of Tax Debt Shield
Debt Tax Shields and Firm Profitability

7/29/2019 Topic 7 (2012-13A)MP
http://slidepdf.com/reader/full/topic-7-2012-13amp 68/108
Interest deductions only lower taxes to theextent that the firm is profitable.
Using more debt financing increases the
probability that the firm will experiencelosses.
67
Debt Tax Shields and Firm Profitability
Costs of Bankruptcy and Financial

7/29/2019 Topic 7 (2012-13A)MP
http://slidepdf.com/reader/full/topic-7-2012-13amp 69/108
Bankruptcy costs are distinct from thedecline in firm value that leads to financialdistress.
Poor management, unfavorable movementsin input and output prices, and recessionscan push a firm into bankruptcy, but theyare not examples of bankruptcy costs.
Bankruptcy costs refer to direct andindirect costs of the bankruptcy process
itself.
68
p yDistress
Bankruptcy Costs

7/29/2019 Topic 7 (2012-13A)MP
http://slidepdf.com/reader/full/topic-7-2012-13amp 70/108
69
It is not the event of going bankrupt that matters; it is thecosts of going bankrupt that matter.
If ownership of the firm’s assets were transferred costlesslyto its creditors in the event of bankruptcy…
The optimal capital structure would still be 100% debt.
When the firm incurs costs in bankruptcy that it would otherwise avoid, bankruptcy costs become a deterrent to using leverage.
Bankruptcy Costs
Example

7/29/2019 Topic 7 (2012-13A)MP
http://slidepdf.com/reader/full/topic-7-2012-13amp 71/108
70
Firm 1 Firm 2
Market value of assets $100,000,000 $100,000,000
Debt $0 $50,000,000Equity $100,000,000 $50,000,000
– Assume if firm goes bankrupt, $10 million in assets
are lost in the process of transferring ownership fromstockholders to bondholders:
$30,000,000$40,000,000$0$0
$30,000,000$40,000,000
Firm 2 will calculate the tax advantage of debt and weigh that againstthe cost of bankruptcy times the probability of bankruptcy at each
debt level.
When the recession hits, Firm 1 has $40 million in assets, but Firm 2has $30 million in assets.
We are now looking not at bankruptcy costs per se, but at expected
bankruptcy costs.
Example
Bankruptcy Costs

7/29/2019 Topic 7 (2012-13A)MP
http://slidepdf.com/reader/full/topic-7-2012-13amp 72/108
71
Direct Costs Costs of bankruptcy-related litigation (e.g.legal, auditing, and administrative costs)
Indirect
Costs
Cost of management time diverted tobankruptcy process
Loss of customers who don’t want to deal witha distressed firm
Loss of employees who switch to healthier firms
Strained relationships with suppliers
Lost investment opportunities
Bankruptcy Costs
Bankruptcy Costs

7/29/2019 Topic 7 (2012-13A)MP
http://slidepdf.com/reader/full/topic-7-2012-13amp 73/108
72
Indirect costs are likely to be much larger, and are likely tovary a great deal depending on the type of firm in distress.
Indirect costs may be high:
When the firm’s product requires that the firm stay inbusiness (e.g., when warranties or service are important)
When the firm must make additional investments in productquality to maintain customers
For example, think of customers worrying that a bankruptairline might try to save $ by cutting spending on safety.
Bankruptcy Costs

7/29/2019 Topic 7 (2012-13A)MP
http://slidepdf.com/reader/full/topic-7-2012-13amp 74/108
73
V L = V U + PV(Tax shields) – PV(Bankruptcy costs)

7/29/2019 Topic 7 (2012-13A)MP
http://slidepdf.com/reader/full/topic-7-2012-13amp 75/108
Producers of complex products or servicestend to use less debt than do firmsproducing nondurable goods or basicservices.
Companies whose assets are mostlytangible and have well-establishedsecondary markets should be less fearful of financial distress than companies whose
assets are mostly intangible.
74

7/29/2019 Topic 7 (2012-13A)MP
http://slidepdf.com/reader/full/topic-7-2012-13amp 76/108
75

7/29/2019 Topic 7 (2012-13A)MP
http://slidepdf.com/reader/full/topic-7-2012-13amp 77/108
Jensen and Meckling (1976): agency costtheory of financial structure
Agency costs of outside equity◦ Managers who own less than 100% of the firm
have an incentive to expropriate wealth from the
firm’s investors. Excessive perquisite consumption
Less effort devoted to increasing firm’s value
76

7/29/2019 Topic 7 (2012-13A)MP
http://slidepdf.com/reader/full/topic-7-2012-13amp 78/108
77

7/29/2019 Topic 7 (2012-13A)MP
http://slidepdf.com/reader/full/topic-7-2012-13amp 79/108
Using debt means a firm can sell lessexternal equity and still finance itsoperations.
Using debt reduces managerial perquisiteconsumption.
External debt serves as a bonding mechanism .
Debt subjects managers to directmonitoring by public capital markets.
78
Agency Costs of Outside Debt
7/29/2019 Topic 7 (2012-13A)MP
http://slidepdf.com/reader/full/topic-7-2012-13amp 80/108
Bondholders begin taking on anincreasing fraction of the firm’s risk asfirms use more debt.
Shareholders and managers still control
the firm’s investment and operatingdecisions, so managers have incentives totransfer wealth from bondholders tothemselves and other shareholders.◦ For example, managers might sell bonds and
then pay a huge dividend to shareholders,leaving bondholders with an empty corporateshell.
79
Agency Costs of Outside Debt
Agency Costs of Outside Debt

7/29/2019 Topic 7 (2012-13A)MP
http://slidepdf.com/reader/full/topic-7-2012-13amp 81/108
80
g y o o Ou d b
Problems withoutside debt
Asset substitution (bait and switch)
Underinvestment
Bondholders protect themselves with positive and negativecovenants in lending contracts.
Agency costs of debt are burdensome, but so are solutions.
Agency Costs of Outside Debt

7/29/2019 Topic 7 (2012-13A)MP
http://slidepdf.com/reader/full/topic-7-2012-13amp 82/108
Asset substitution is the promise to invest ina safe asset to obtain an interest ratereflecting low risk, and then substituting ariskier asset promising a higher expected
return. Underinvestment occurs when a firm’s
shareholders refuse to invest in a positive-NPV project because most of the benefits
would be realized by bondholders.
81
g y
Smart Figure 13.5The Trade off Model Revisited

7/29/2019 Topic 7 (2012-13A)MP
http://slidepdf.com/reader/full/topic-7-2012-13amp 83/108
82
The Trade-off Model Revisited
V L = V U + PV(Tax shields) – PV(Bankruptcy costs) – PV(Agency costs)
Implications of the Trade-off Model

7/29/2019 Topic 7 (2012-13A)MP
http://slidepdf.com/reader/full/topic-7-2012-13amp 84/108
Profitable firms should borrow more thanunprofitable firms because they are morelikely to benefit from interest tax shields.
Firms that own tangible, marketable
assets should borrow more than firmswhose assets are intangible or highlyspecialized.
Safer firms should borrow more than
riskier firms. Companies should have a target debt
ratio.
83
Implications of the Trade off Model

7/29/2019 Topic 7 (2012-13A)MP
http://slidepdf.com/reader/full/topic-7-2012-13amp 85/108
Some studies find that the mostprofitable firms in an industry have thelowest debt ratios.
Leverage-increasing events, such as
stock repurchases and debt-for-equityexchange offers, almost always increasestock prices, while leverage-decreasingevents reduce stock prices.
Firms issue debt securities frequently, butseasoned equity issues (equity issuesfrom firms that already have stock) arerare.
84

7/29/2019 Topic 7 (2012-13A)MP
http://slidepdf.com/reader/full/topic-7-2012-13amp 86/108
85
7/29/2019 Topic 7 (2012-13A)MP
http://slidepdf.com/reader/full/topic-7-2012-13amp 87/108
The graph shows MM’s tax benefit vs.bankruptcy cost theory.
Logical, but doesn’t tell whole capitalstructure story. Main problem--assumes
investors have same information asmanagers.
15-86

7/29/2019 Topic 7 (2012-13A)MP
http://slidepdf.com/reader/full/topic-7-2012-13amp 88/108
Signaling theory suggests firms should useless debt than MM suggest.
This unused debt capacity helps avoid stocksales, which depress stock price because of
signaling effects.
15-87

7/29/2019 Topic 7 (2012-13A)MP
http://slidepdf.com/reader/full/topic-7-2012-13amp 89/108
Assumptions:◦ Managers have better information about a firm’s
long-run value than outside investors.
◦ Managers act in the best interests of current
stockholders. What can managers be expected to do?
◦ Issue stock if they think stock is overvalued.
◦ Issue debt if they think stock is undervalued.
◦ As a result, investors view a stock offeringnegatively ─ managers think stock is overvalued.
15-88

7/29/2019 Topic 7 (2012-13A)MP
http://slidepdf.com/reader/full/topic-7-2012-13amp 90/108
Issue stock if they think stock is overvalued. Issue debt if they think stock is undervalued. As a result, investors view a common stock
offering as a negative signal ─ managers think
stock is overvalued.
15-89

7/29/2019 Topic 7 (2012-13A)MP
http://slidepdf.com/reader/full/topic-7-2012-13amp 91/108
Intuitively appealing model, but relativelylittle empirical support
Leverage ratios are, if anything, negatively related to profitability in almost every
industry.◦ Signaling models predict a positive relationship!!!
Asset-rich companies use far more debtthan do growth companies with intangibleassets.◦ Information asymmetry is more severe for growth
companies, which thus should have a greaterneed to signal.
90
Smart Figure 13.5The Trade-off Model Revisited

7/29/2019 Topic 7 (2012-13A)MP
http://slidepdf.com/reader/full/topic-7-2012-13amp 92/108
91
The Trade off Model Revisited
V L = V U + PV(Tax shields) – PV(Bankruptcy costs) – PV(Agency costs)
7/29/2019 Topic 7 (2012-13A)MP
http://slidepdf.com/reader/full/topic-7-2012-13amp 93/108
92

7/29/2019 Topic 7 (2012-13A)MP
http://slidepdf.com/reader/full/topic-7-2012-13amp 94/108
• Dividend policy is “sticky .”
• Firms prefer internal financing (retainedearnings and depreciation) to externalfinancing of any sort, debt or equity.
• If a firm must obtain external financing, it willissue the safest security first.
• As a firm requires more external financing, itwill work down the “pecking order” of securities:1. Safe debt2. Risky debt3. Convertible securities4. Preferred stock5. Common stock (as a last resort)
93

7/29/2019 Topic 7 (2012-13A)MP
http://slidepdf.com/reader/full/topic-7-2012-13amp 95/108
94
Assumptions
Manager acts in best interests of
existing shareholders.
Information asymmetry between managersand investors.
Two key predictions about managerial behavior
Firms hold financial slack so they don’t have toissue securities.
Firms follow pecking order when issuingsecurities: sell low-risk debt first, equity only as
last resort.

7/29/2019 Topic 7 (2012-13A)MP
http://slidepdf.com/reader/full/topic-7-2012-13amp 96/108
It implies that firms have no target capitalstructure and that the debt ratios observedin the real world ought to fluctuaterandomly.
95

7/29/2019 Topic 7 (2012-13A)MP
http://slidepdf.com/reader/full/topic-7-2012-13amp 97/108
96

7/29/2019 Topic 7 (2012-13A)MP
http://slidepdf.com/reader/full/topic-7-2012-13amp 98/108
•
Taxes – Since interest is tax deductible, highly profitable firmsshould use more debt (i.e., greater tax benefit).
• Types of Assets – The costs of financial distress depend on the types of
assets the firm has.
• Uncertainty of Operating Income – Even without debt, firms with uncertain operating
income have a high probability of experiencingfinancial distress.
• Pecking Order and Financial Slack – Theory stating that firms prefer to issue debt rather
than equity if internal financing is insufficient.
15-97
Trading Off Debt’s Benefits and Costs
7/29/2019 Topic 7 (2012-13A)MP
http://slidepdf.com/reader/full/topic-7-2012-13amp 99/108
• The optimal capital structure occurs where the marginal benefit of additional debt is equal to the marginal cost.
• How do managers trade-off the benefits and costs of debt toestablish a target capital structure that maximizes firm value?
98
Smart Figure 13.5The Trade-off Model Revisited

7/29/2019 Topic 7 (2012-13A)MP
http://slidepdf.com/reader/full/topic-7-2012-13amp 100/108
99
The Trade off Model Revisited
V L = V U + PV(Tax shields) – PV(Bankruptcy costs) – PV(Agency costs)

7/29/2019 Topic 7 (2012-13A)MP
http://slidepdf.com/reader/full/topic-7-2012-13amp 101/108
• Most corporations have low Debt-Asset ratios.
• Changes in financial leverage affect firm value. – Stock price increases with increases in leverage and vice-
versa; this is consistent with M&M with taxes.
– Another interpretation is that firms signal good news when
they lever up.• There are differences in capital structure across
industries.
• There is evidence that firms behave as if they had atarget Debt-Equity ratio. As more debt is added andthe probability of losses increases, the marginal
benefit of debt curve slopes downward.
38

7/29/2019 Topic 7 (2012-13A)MP
http://slidepdf.com/reader/full/topic-7-2012-13amp 102/108
10
1

7/29/2019 Topic 7 (2012-13A)MP
http://slidepdf.com/reader/full/topic-7-2012-13amp 103/108
102
What Companies Do GloballySmart Figure 13.6 Target Capital Structure

7/29/2019 Topic 7 (2012-13A)MP
http://slidepdf.com/reader/full/topic-7-2012-13amp 104/108
103
Smart Figure 13.6 Target Capital Structure

7/29/2019 Topic 7 (2012-13A)MP
http://slidepdf.com/reader/full/topic-7-2012-13amp 105/108
10
4
Smart Figure 13.5The Trade-off Model Revisited

7/29/2019 Topic 7 (2012-13A)MP
http://slidepdf.com/reader/full/topic-7-2012-13amp 106/108
10
5
V L = V U + PV(Tax shields) – PV(Bankruptcy costs) – PV(Agency costs)

7/29/2019 Topic 7 (2012-13A)MP
http://slidepdf.com/reader/full/topic-7-2012-13amp 107/108
Need to make calculations as we did, butshould also recognize inputs are“guesstimates.”
As a result of imprecise numbers, capital
structure decisions have a large judgmentalcontent.
We end up with capital structures varyingwidely among firms, even similar ones in
same industry.
15-106

7/29/2019 Topic 7 (2012-13A)MP
http://slidepdf.com/reader/full/topic-7-2012-13amp 108/108
Eugene Chapter 15 Self-test Questions and Problems, ST-1,2,3
Questions: 15-3, 15-6, 15-7, 15-11
Problems: 15-1,15-2,15-3, 15-6,15-8, 15-
10,15-11 Comprehensive Question: 15-14
Related Documents