TOPIC 6 : Monitoring and R&D programmes after a pollution Mr Christophe Sintes Technical lessons learnt from the Erika incident and other oil spills - Brest, 13-16 march 2002 INTERFEROMETRIC SIDE SCAN SONAR : A TOOL FOR HIGH RESOLUTION SEA FLOOR EXPLORATION Mr Christophe Sintes – Gesma – BP 42 - 29240 BREST Naval - France Tel : 02 98 22 64 14 - [email protected] Secondary authors : Messrs. Michel Legris (*) and Basel Solaiman (**) * : ENSIETA, 2 rue François Verny , 29240 Brest-Naval, France ** : ENST-Bretagne, B.P 832, 29285 Brest cedex, France [email protected]} ABSTRACT This paper concerns the description of an a commercial interferometric sonar and possible applications for objects or for wrecks investigation. It presents general concepts of interferometry and its limit essentially due to noise. The main problem of interferometry which is a method echo triangulation is handicapped by its phase ambiguity because it measures a time delay between two sensors modulus a wavelength. So it exists different methods to remove the bias. The Gesma bought a interferometric prototype sonar 3 years ago and developped a general process to reduce to errors of bias. This tool is well designed for sea floor exploration because it provides an high resolution side scan sonar image with the same resolution bathymetry coming from the interferometric sensors. The main conclusion of this paper concerns the potential application of this sonar and the associated process to investigate with a fine resolution, wrecks, small objects, pipes. The speed of survey allows to use it on large areas. The quality of datas makes possible 3D reconstruction and an interactive visualisation. 1. INTRODUCTION The bathymetry of an area is very informative to understand the environment of the observed scene. But the main drawback is the resolution of the illuminated cell which depends on the altitude of echo sounder above the sea bottom because the size of the cell is connected to the aperture of the beam. The bathymetry is estimated by a temporal analysis which measure the go and back time travel of the sound between the sensor and the sea floor. The quality of this measure is very good because the system is designed for it. Much information can be derived from it : it is possible create 3D models of the environment. It is possible integrate to it different kind of

Welcome message from author
This document is posted to help you gain knowledge. Please leave a comment to let me know what you think about it! Share it to your friends and learn new things together.
Transcript
TOPIC 6 : Monitoring and R&D programmesafter a pollution
Mr Christophe Sintes
Technical lessons learnt from the Erika incident and other oil spills - Brest, 13-16 march 2002
INTERFEROMETRIC SIDE SCAN SONAR : A TOOL FOR HIGH RESOLUTIONSEA FLOOR EXPLORATION
Mr Christophe Sintes – Gesma – BP 42 - 29240 BREST Naval - FranceTel : 02 98 22 64 14 - [email protected]
Secondary authors : Messrs. Michel Legris (*) and Basel Solaiman (**)* : ENSIETA, 2 rue François Verny , 29240 Brest-Naval, France
** : ENST-Bretagne, B.P 832, 29285 Brest cedex, [email protected]}
ABSTRACT
This paper concerns the description of an a commercial interferometric sonar and possible applications for
objects or for wrecks investigation. It presents general concepts of interferometry and its limit essentially due to
noise. The main problem of interferometry which is a method echo triangulation is handicapped by its phase
ambiguity because it measures a time delay between two sensors modulus a wavelength. So it exists different
methods to remove the bias. The Gesma bought a interferometric prototype sonar 3 years ago and developped a
general process to reduce to errors of bias. This tool is well designed for sea floor exploration because it
provides an high resolution side scan sonar image with the same resolution bathymetry coming from the
interferometric sensors.
The main conclusion of this paper concerns the potential application of this sonar and the associated process
to investigate with a fine resolution, wrecks, small objects, pipes. The speed of survey allows to use it on large
areas. The quality of datas makes possible 3D reconstruction and an interactive visualisation.
1. INTRODUCTION
The bathymetry of an area is very informative to understand the environment of the observed scene. But the
main drawback is the resolution of the illuminated cell which depends on the altitude of echo sounder above the
sea bottom because the size of the cell is connected to the aperture of the beam. The bathymetry is estimated by
a temporal analysis which measure the go and back time travel of the sound between the sensor and the sea
floor. The quality of this measure is very good because the system is designed for it. Much information can be
derived from it : it is possible create 3D models of the environment. It is possible integrate to it different kind of
TOPIC 6 : Monitoring and R&D programmesafter a pollution
Mr Christophe Sintes
Technical lessons learnt from the Erika incident and other oil spills - Brest, 13-16 march 2002
information coming from external sensor. Traditionally people merge information coming from echo sounder
and side scan sonar.
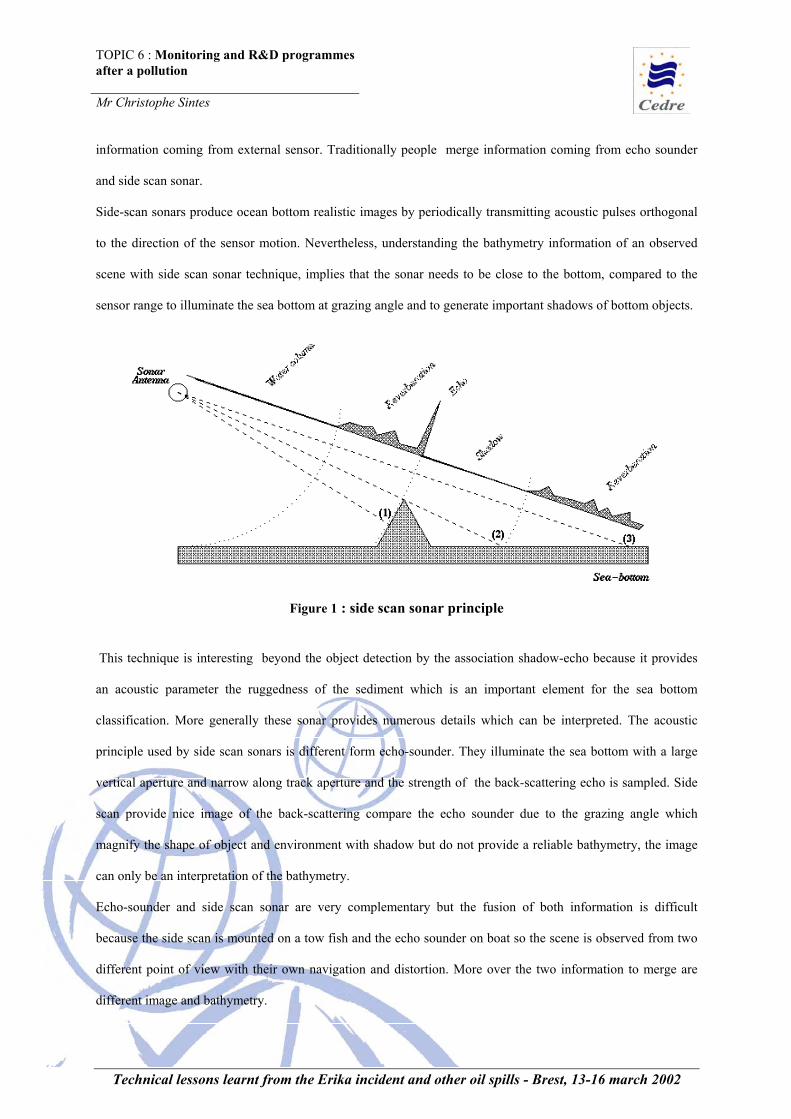
Side-scan sonars produce ocean bottom realistic images by periodically transmitting acoustic pulses orthogonal
to the direction of the sensor motion. Nevertheless, understanding the bathymetry information of an observed
scene with side scan sonar technique, implies that the sonar needs to be close to the bottom, compared to the
sensor range to illuminate the sea bottom at grazing angle and to generate important shadows of bottom objects.
Figure 1 : side scan sonar principle
This technique is interesting beyond the object detection by the association shadow-echo because it provides
an acoustic parameter the ruggedness of the sediment which is an important element for the sea bottom
classification. More generally these sonar provides numerous details which can be interpreted. The acoustic
principle used by side scan sonars is different form echo-sounder. They illuminate the sea bottom with a large
vertical aperture and narrow along track aperture and the strength of the back-scattering echo is sampled. Side
scan provide nice image of the back-scattering compare the echo sounder due to the grazing angle which
magnify the shape of object and environment with shadow but do not provide a reliable bathymetry, the image
can only be an interpretation of the bathymetry.
Echo-sounder and side scan sonar are very complementary but the fusion of both information is difficult
because the side scan is mounted on a tow fish and the echo sounder on boat so the scene is observed from two
different point of view with their own navigation and distortion. More over the two information to merge are
different image and bathymetry.

TOPIC 6 : Monitoring and R&D programmesafter a pollution
Mr Christophe Sintes
Technical lessons learnt from the Erika incident and other oil spills - Brest, 13-16 march 2002
Recent side scan sonars were designed to produce in the same time side scan sonar image and bathymetric
information through the use of interferometric methods. These methods are based on the detection of the angular
arrival of the plane wave reflected from the bottom. With the knowledge of the sonar altitude, of the signal
arrival time and of its angular arriving direction, it is possible to compute the bathymetry of each point present
in the observed scene. These methods constitute a real improvement compared to the fusion methods of the
bathymetry and the image recorded in two dates and issued from two different sensors. But the echo sounder
and the side scan stay complementary, the first work at vertical angle and the second at grazing angle.
Nevertheless from this point of view the bathymetry is an other improvement because the bathymetric
information issued from the interferometry is easier to merge with the echo sounder information than the couple
image : coming from the side scan and the bathymetry from the echo sounder.
The main drawback of interferometric methods concerns their weak robustness in a noisy environment and the
2π bias of the phase measure used to compute the bathymetry. This paper proposes an approach of this
bathymetry with a correction of the 2π bias. The application of that kind of sonar are numerous : objects and
wrecks investigation, environment comprehension …
2. INTERFEROMETRY BASIC CONCEPT
The traditional experiment to illustrate the interferometry effect is the Young slot experiment [1]. A
monochromatic light (i.e. a single carrier frequency) is diffracted through two slots and creates a figure of light
consisting in an alternance fringes (high-lighted lines and of shadowed lines) on a white paper sheet placed
behind. This can be explained by the superposition of two coherent lights. The intensity at each point is given by
(1) :
(1) >−<+><+>=< )cos(2 212122
21 ϕϕEEEEI
where, E1 and E2 denote the electromagnetic fields amplitude, ϕ1 and ϕ2 their corresponding phases, and the
symbol <.> denotes the temporal average during a wave train length time. The resulting intensity depends,
hence, on the phase difference (i.e. the difference of length of the two paths of light). The connection to the
interferometric sonar is straightforward, figure 1. The slots are two acoustic arrays and the paper sheet effect

TOPIC 6 : Monitoring and R&D programmesafter a pollution
Mr Christophe Sintes
Technical lessons learnt from the Erika incident and other oil spills - Brest, 13-16 march 2002
(i.e. superposition of two waves) is computed by *bSaS where aS , bS are the complex signals received on
each array and (*) denotes the complex conjugate.
Figure 2 : the phase difference and the incidence angle θ and the computation SaSb*
On this figure, δM denotes the path length difference. The link between the phase difference and θ, the arriving
angle of the front wave is given by (2)(3) :
(2) ∆ϕπ θ ψ
λ=
+2 d cos( )
where “d” is the baseline, H the vertical altitude of the sonar above the sea bottom and λ the wavelength.
Finally, the altitude “h”of an observed cell is simply computed by :
(3) h = H – r cos(θ)
The main drawback of interferometric technique is the presence of noise which is something usual with
experimental datas but the phase difference is biased of several times 2π. Indeed the quantity δM can be over
one wave length and the phase difference can appreciate the time delay between both array modulus 2π as
shown on the Figure 3.
Interferometry
H
h
θ
ψ
δM=d cos(θ+ψ)d
aS
bS
r
image de la différence de phase
échantillons sur la portée
n° d
u pi
ng
500 1000 1500 2000 2500 3000 3500 4000
20
40
60
80
100
120
140
160
180
200
SaSb*
Range in sample (130m)
Pingnumber

TOPIC 6 : Monitoring and R&D programmesafter a pollution
Mr Christophe Sintes
Technical lessons learnt from the Erika incident and other oil spills - Brest, 13-16 march 2002
Figure 3 : An experimental phase difference (blue) and theorical (red)
The phase difference is not directly usable because it is not representative of the arriving angle of the wave
front. The main difficulty of interferometry is to remove the phase bias in presence of noise.
3. INTERFEROMETRY LIMITS
3.1. Sources of noise
We consider 4 sources of noise which combine themselves and which are responsible of the decrease of the
Signal to Noise Ratio:
- angular decorrelation : The measured gray level value concerning a given pixel on the sonar image, is
obtained by the additive power summation of several microscopic backscatters contained within the
resolution cell. The backscattered energy by each of these microscopic items can interfere and the power
reflected can be null and the received phase difference is random variable: it is the speckle phenomena. We
suppose only one kind of back-scattering points uniformly and continuously distributed on the sea floor
which is the worst hypothesis [5],[1].
- spatial decorrelation : This effect is also called ‘sliding foot print’ effect. This source of noise can be
derived from an optical effect. The figures obtained through the optical Young slots are less and less
contrasted from the center to the exterior. This phenomena is linked to the length of wave trains. The more
the phase difference is important the less the time of the coherent integration is important, and thus, the
TOPIC 6 : Monitoring and R&D programmesafter a pollution
Mr Christophe Sintes
Technical lessons learnt from the Erika incident and other oil spills - Brest, 13-16 march 2002
weight of the phase difference cosine decreases. This effect is the reason of using monochromatic light : it
has a very thin spectral occupation so a large time duration which increases the contrast of the figure. For
the sonar case, the length of the coherent wave train is related to the pulse length and is proportional to :
(4) t- c∆
2τ
=ξ
where τ is the time pulse length and c is the was celerity. ξ corresponds to the time the two arrays have to
make the interferometry in common. ξ can be interpreted as the commonly sea bottom surface seen by the
two sensors within one sample : the two arrays are not situated at the same distance from the bottom and
their footprint on the bottom is lightly shifted. Thus, when the cross product *bSaS is computed, it must
take into account this partial superposition. The lack of this superposition correspond on the sea bottom to
(5) )sin(
)cos(θ
ψθ +=∆
dx .
- multipath impact : Multipath interference constitutes an important noise source through the
interferometry process. In fact, the received signal is formed by the composition of a direct path and,
eventually, of an interfering signal issued from a secondary reflecting path. The interfering path constitutes
a parasite signal contributing to noise the wave front of the main signal.
- propagation attenuation : the signal is astonished by the different effects of propagation and the SNR
too.
3.2. Sources of errors
The noise is globally a difficulty to remove the phase bias but it is generally possible to retrieve the lack of
information by different methods exposed in the following parts. Nevertheless it remains two kind of noise
which intricate the bias removal and are sources of errors. These noise are linked to the angular decorrelation
and multipath effect. The multipath effect is really visible when the level sea floor backscattering is weak
compared to the surface, so the altitude found for the pixels correspond to something between the surface and
the sea bottom. So it is necessary to detect and to ignore these points. The second kind of difficulty is the
TOPIC 6 : Monitoring and R&D programmesafter a pollution
Mr Christophe Sintes
Technical lessons learnt from the Erika incident and other oil spills - Brest, 13-16 march 2002
speckle which can totally astonish the luminance of a pixel and the bathymetry associated to it. It is necessary
for this noise to reduce its impact by an unspecklisation porcess depicted in the part 5.1.
4. SOLUTIONS TO UNBIAS THE PHASE
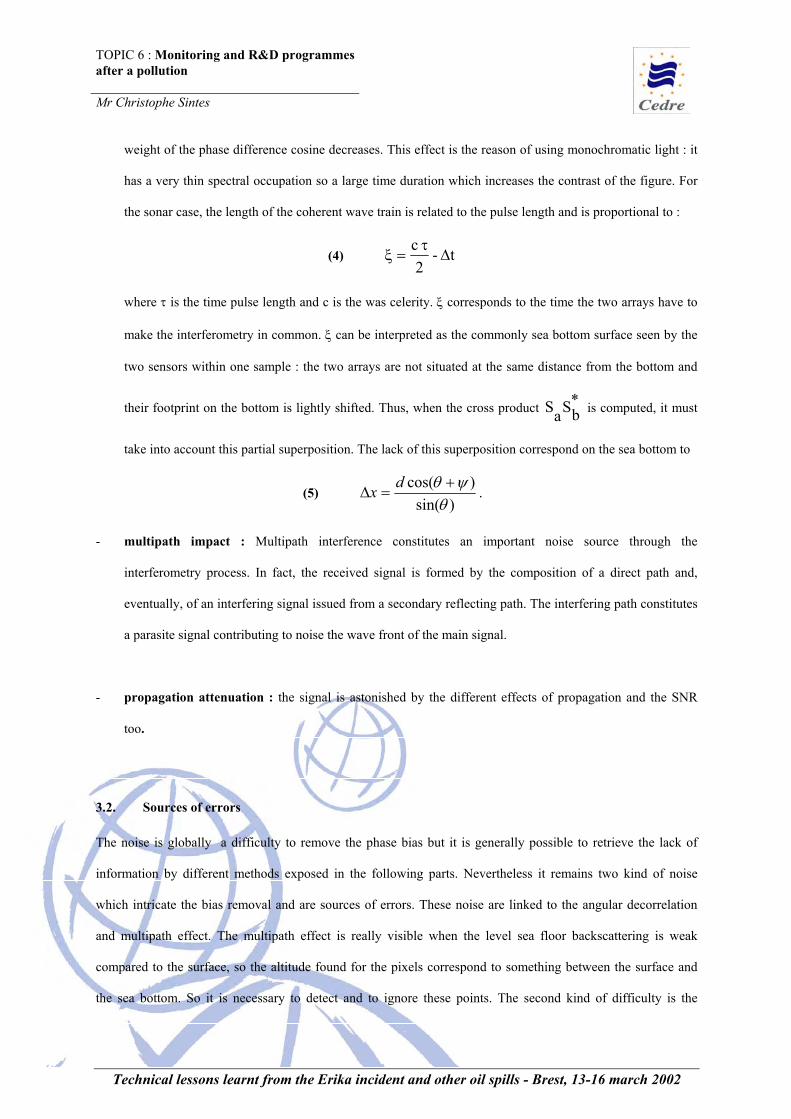
4.1. Phase unwrapping
The traditionnal way to remove the phase bias is to detect a phase jump on the phase signal which corresponds
to a brutal transition close to 2π when the continuous phase signal reaches -π or π. One solution to detect this
step, this jump is to use a differential estimator which detects only big transitions. Generally the estimator
threshold is set on π , so when the transition between two neighbors points reaches the absolute value of π, the
system considers there is a phase jump and corrects the phase as shown on the Figure 4. We can sum up the
phase jump detection algorithm as
(6)
+=≥∀−<−
−=≥∀>−
−
−
ππ
ππ
2)arg()arg( then )arg()arg(
2)arg()arg( then )arg()arg(***
1*
***1
*
iinn
iinn
SaSbSaSbniSaSbSaSb
SaSbSaSbniSaSbSaSb
This algorithm which unwrap the phase, makes a lot of errors as soon as the power of noise increases and in
some case it s impossible to use it directly.
Figure 4 : an example of unwrapping
0 500 1000 1500 2000 2500-10
-8
-6
-4
-2
0
2
4différence de phase am biguë et non am biguë
échantillons sur la portée
radians
n on am biguëam biguë
The unwrapped phase difference
Range in sample (75m)
Blue : unwrapped phaseRed : biased phase
TOPIC 6 : Monitoring and R&D programmesafter a pollution
Mr Christophe Sintes
Technical lessons learnt from the Erika incident and other oil spills - Brest, 13-16 march 2002
One solution to continue to use it is to reduce the level of noise variance. The traditional technique is an average
on the data. This technique works but the resolution is decreased and sometimes it is necessary to reduce
seriously the resolution to hope to reach an acceptable level of noise.
The filtered phase is given by the maximum likelihood estimator
(7) ∑=∆i
iSaSb )arg( *ϕ
The risk of the unwrapping process is to make an error of detection because this error is not located only at the
origin of this error but propagated to end of the signal range as shown by (7).
4.2. Intercorrelation Process
Another technique to remove the 2π bias is to estimate with traditional signal processing techniques the time
delay between both sensors : the intercorrelation calculation. If the confidence of the estimation is above a
resolution of one period of the carrier frequency (i.e. one wave length), it is possible to determine the ambiguity
of the phase.
(8)
−= ∫T
dttSbtSa ))()(max(/ * τττ
This technique is very interesting because it researches the time delay for which the two signals superpose
themselves as well as possible so in the same time the problem of spatial decorrelation is removed. In fact this
approach is like a likehood estimator with a coherent summation.
4.3. Vernier principle
The vernier method is different from the two previous techniques because it uses three sensors , two couple
sensors to determine that ambiguity. So the phase difference for one couple is given by:
(9) λ
ψθπππϕ )cos(22)2,mod( +=+∂
dn .
A family of solution for one couple corresponds several possible wave fronts generated by the 2π modulus of
the phase amgiuity. But the physical wave front is unical and the viewed angle by both sensors is the same if the
sensors are in line. So with two couples if we plot the solutions of the phase difference, only two functions

TOPIC 6 : Monitoring and R&D programmesafter a pollution
Mr Christophe Sintes
Technical lessons learnt from the Erika incident and other oil spills - Brest, 13-16 march 2002
superpose themselves belonging respectively to each couple. We can find a couple of naturals n1 and n2
verifying:
(10) 2
2
2
22
1
1
1
11
2)2,mod()cos(
2)2,mod(
dn
ddn
dπ
πλπϕψθπ
πλπϕ
+∂
=+=+∂
The experimental signal does not allow the superposition, it always remains a small error ε due to noise. The
solution to find the couple (n1,n2) is to choice the closer solutions. If that error goes beyond the gap given by the
closest solutions (vernier efficiency) )()0,0()2,1(
min21
2
2
1
1
dn
dn
nnλλ
−≠
, it will be impossible to make the difference
between the true solution and a wrong wave front. The size of this gap is the limitation of the vernier technique
and it must be as large as possible.
Figure 5 : interpretation of vernier concept
5. PROCESS AND RESULTS
5.1. Unspeckled phase
The intercorrelation process integrates in the inner calculations an mean filtering process which corresponds to
the length of integration window. The vernier and the classic unwrapping technique are independent of an
possible phase pre-processing, so the choice of the size of an averaging process is totally free. But the main
default of the averaging process is to reduce resolution to increase SNR. The idea of an unspecklisation process
based on multiresolution analysis, is to improve the quality of the signal by an autoadaptive averaging filter
Range in meter
0 5 10 15 20 25 30 35 40 45 50-1
-0.8
-0.6
-0.4
-0.2
0
0.2
0.4
0.6
0.8
1
+&dashed line:d1x&continue line: d2θ(r)
ε Vernier efficiency*2
Possible arrivingdirection modulus 2π
Real wave front corresponding to thesuperposition of both curves families
Cos(θ)r
TOPIC 6 : Monitoring and R&D programmesafter a pollution
Mr Christophe Sintes
Technical lessons learnt from the Erika incident and other oil spills - Brest, 13-16 march 2002
which adapts the filter size to the image gradient. It allows to reach a better SNR when it is possible and to keep
the resolution in any case. This operation is performed with an invariant multiresolution analysis based on spline
wavelets.
5.2. Parametric vernier
The main drawback of the vernier process comes from its black box behaviour : it is not possible to set a
threshold for the detection of phase jump. When the noise goes over the vernier efficiency, some errors can
occur: the threshold is determined by the vernier efficiency. To avoid this behaviour, the main idea of this
process is to merge assets of the vernier technique and of classical unwrapping process which can be
configurable. Indeed it is possible to set a threshold under which we consider 2 phase difference points are
continue. The threshold called confidence interval, represents the distance on Y axis between two neightbour
samples. On classical unwrapping technique, a correction of phase jumps is made if the distance between 2
difference phase samples is over π ; a wrong phase point (which continuity is above π) generates a false phase
jump which is integrated trough out the range. The idea is to consider reliable points in term of continuity : we
suppose correct samples represent the majority of points and we consider the others as outlayers. This
hypothesis can easily achieved with a first adaptive meaning processing which reduces noise and keep points on
the major curve which is continue and corresponds to the phase difference evolution along the range.
For example, we choose an interval around the mean of the current sample which gathers 90% of statistical
distribution weight for this sample. If the distance is under the confidence interval, there is continuity, if the
distance is above 2π-confidence interval, there is continuity but presence of phase jump. Then if the distance is
above the confidence interval and under 2π-confidence interval, it is impossible to say if there is or not a phase
jump. There is a discontinuity which may correspond to noise or to an aliasing problem. We call that
discontinuity : an outlayer. For example, this phenomena can appear when the slope of the relief is too high and
makes a big increase on the phase evolution which is not detected by the sampling process. The interest is to
not integrate phase jump which correspond to a possible aliasing phenomenon while there is not enough
information to unwrap phase ; the range is simply divided into segments whose begin and end at outlayers
points location.

TOPIC 6 : Monitoring and R&D programmesafter a pollution
Mr Christophe Sintes
Technical lessons learnt from the Erika incident and other oil spills - Brest, 13-16 march 2002
Figure 6 : example of the process coorecting phase ambiguities
We have created continue phase intervals and we make match the phase of the vernier with the unwrapped
phase on each aliasing intervals. This operation is done by shifting the unwrapped phase through out the cosine
interval [-1;1]. It is easy to conserve the shift which makes the better matching for each continue phase interval.
On an interval, a rejected vernier point can be bring back on the real curve (i.e. corrected), if the true curve
represents the majority of points. This system is based on two numerical parameters : the probability of no phase
jump detection and the false alarm.
In our computations we used a 99% interval confidence, 6 points mean filtering which correspond to 7%
probability of no detection and roughly 2% of false alarm (experimentally 0.9).
5.3. Results
The GESMA bought three years ago a prototype of an interferometric side scan sonar to evaluate the gain of
interferometry to explore sea floor. This sonar is a KLEIN 5400B. The real time control windows of the sonar
with the high resolution image and the navigation windows allows a seafloor exploration with a swath of 130m
with à resolution of 10cm next to75m.
Position of outlayers
Phase continue interval
Original vernier
Processed vernier

TOPIC 6 : Monitoring and R&D programmesafter a pollution
Mr Christophe Sintes
Technical lessons learnt from the Erika incident and other oil spills - Brest, 13-16 march 2002
With the paramatric vernier, the rate of computation allows a real time process but currently this process is
batched and provides an unspeckled sonar image for the bathymetry process with the bathymetry. The process is
fully automatic.
Wreck of Erika with thealready explored zone
50 0 10 00 15 00 20 00 25 00 30 00
40
60
80
10 0
12 0
14 0
16 0
18 0
20 0
22 0
24 0
10 0 0 1 5 0 0 2 0 0 0 2 5 0 0 3 0 0 0
5 0
1 0 0
1 5 0
2 0 0
2 5 0 -5
0
5
1 0
1 5
2 0
2 5
3 0
3 5
4 0
4 5

TOPIC 6 : Monitoring and R&D programmesafter a pollution
Mr Christophe Sintes
Technical lessons learnt from the Erika incident and other oil spills - Brest, 13-16 march 2002
Using an open GL support, it is possible to create a 3D representation of the volumes and many details of
bathymetry are awaible. For example it is possible to see the bridge, the deck, different masts and the telecom
dome. The fusion with the image sonar (backscattering signal) is immediate because the interferometry
calculates the elevation of each pixel to create a voxel.
Figure 7 :

TOPIC 6 : Monitoring and R&D programmesafter a pollution
Mr Christophe Sintes
Technical lessons learnt from the Erika incident and other oil spills - Brest, 13-16 march 2002
6. CONCLUSIONS
The interest of studying interferometric noise sources is to highlight their great impact on the results. The
second point is to succeeded to find an analytical expression integrated them exactly in a pdf and to be able to
foresee the performance of an interferometric system.
The knowledge of the standard deviation of the pdf and the wanted resolution determine different parameters to
process the 2� bias removal using the modified vernier technique. This phase process offers the possibility to
make the difference between noisy points and brutal phase rising. First results show a real improvement
compared to traditional method.
Finally we can say that the vernier principle goes in the opposite improvement of the quality of the phase (using
large baseline for a spatial averaging of the wave front and of the phase). It likes better to use interferometric
sonar with large baseline and large wide band pulse in order to remove the �� bias by intercorrelation method
which can correct the spatial decorrelation.
REFERENCES
[1] J.W. Goodman, ‘Laser Speckle and Related Phenomena’, in Statistical Properties of LaserSpeckle Patterns, J.C. Dainty, Ed. New York: Springer, 1985
[2] C. Sintes, ‘ Bruit interférometrique pour sonar latéral’,internal report 4336 GESMA.
[3] Philip N.Denbigh, ‘Swath Bathymetry : Principles of Operation and an Analysis of Errors’,IEEE Journal of Oceanic Engineering, Vol 14, No 4, October 1989.
[4] D.C. Cooper and B.A. Wyndham, ’Comparison of Monopulse Techniques for DirectionFinding in the Presence’, IEE, Savoy Place, London, Eng. IEE Conf. Publ. 105,1973, pp.154-159.
[5] G. Jin and D. Tang, ‘Uncertainties of Differential Phase Estimation Associated withInterferometric Sonars’, IEEE Journal Of Oceanic Engineering, Vol. 21, No 1, January 1996.
[6] Xavier Lurton, ‘Precision Analysis of Bathymetry measurements using Phase Difference’OCEANS98
[7] Urick, ‘Principles of Underwater Sound’, 1983 Ed McGraw-Hill
[8] D Middleton,’An Introduction to Statistical Communication Theory’, IEEE Press
TOPIC 6 : Monitoring and R&D programmesafter a pollution
Mr Christophe Sintes
Technical lessons learnt from the Erika incident and other oil spills - Brest, 13-16 march 2002
[9] M. Masnadi, ’Differential Phase Estimation with the SeaMarcII Bathymetric SideScan SonarSystem’, IEE Journal of Oceanic Engineering vol17 no3 july 1992
Related Documents