Topic 6. Cost-Volume-Profit analysis Dr. Vera Butkouskaya

Welcome message from author
This document is posted to help you gain knowledge. Please leave a comment to let me know what you think about it! Share it to your friends and learn new things together.
Transcript

Topic 6. Cost-Volume-Profit analysis
Dr. Vera Butkouskaya

Content
1. Variance analysis2. Income statement, Variable and Absorption costing3. CVP analysis4. BEP
2

Variance analysis
3
1

Budget variance
A budget variance is the difference between the budgeted or baseline amount of expense or revenue, and the actual amount.
▰ The budget variance is favorable:▻ when the actual revenue is higher than the budget
or ▻ when the actual expense is less than the budget.
▰ In opposite situation the budget variance is unfavorable.
4

Budget Variance Report
5
Sample Payroll Costs Summary and Analysis
▰ For example, one of the major and most difficult costs to control in a hotel or food operation is labor, and an ongoing comparison of actual with budgeted labor cost is useful in controlling this cost.
6

Variance analysis
Variance analysis is a comparison of any differences between budget figures and actual results ▰ for sales revenue and ▰ each expense item.
7
Remember, for the revenues/price favourable situation is when the actual is higher than a planned one.

Variance analysis
“Does this variance increase or decrease operating income?”▰ If it increases operating income, the variance
is favorable (F).▰ If it decreases operating income, the variance
is unfavorable (U).▰
8quantity price
What is the reason for the income decrease?
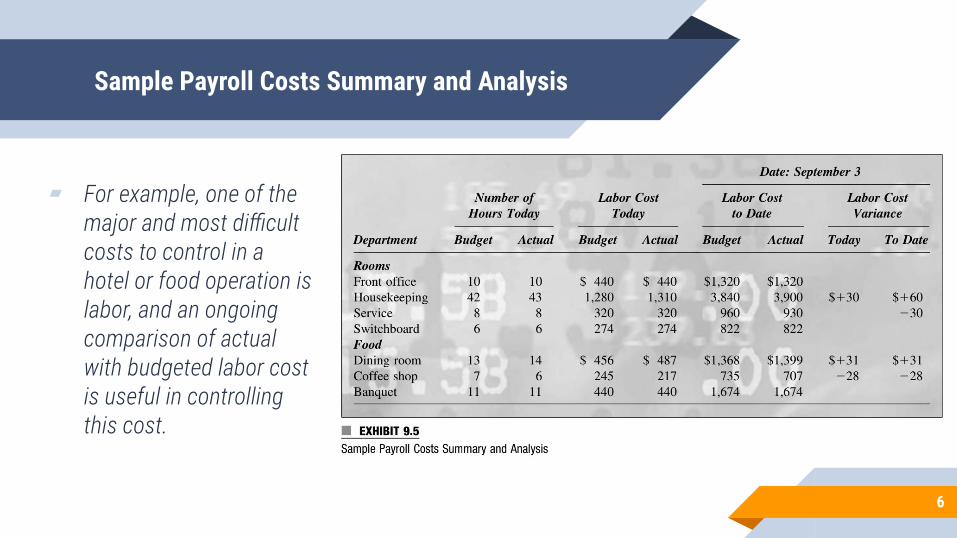
Percentage variance
Percentage variances are calculated by dividing the dollar variance by the budgeted figure for that item and multiplying by 100.
Note
9

Example, price and quantity variance
The price variance is the difference between the budgeted average check of $15.00 and the actual average check of $15.50.
Price variance $15.00-$15.50=$0.50
The average price achieved was $0.50 greater than the budgeted price per guest and is considered to be favorable since it will increase operating income:
10

Example, price and quantity variance
The sales volume (quantity variance) is the difference between the budgeted number of guests and actual units sold.
5 000 guests - 4 500 guests = 500 guests
When the budgeted number of guests is less than anticipated, the sales revenue inflow is also less than anticipated. The 500 fewer guests than was budgeted for is considered unfavorable because it will decrease operating income:
11

Example, price and quantity variance
! Note that when you add a favorable and unfavorable variance, it is similar to adding a positive and negative number (even they are written as a positive number).Price and Sales Variance together:
12

A variance analysis matrix
13

Example, costs variance
14

15

Example, labour costs variance
16

17
Variable and absorption costing
18
2
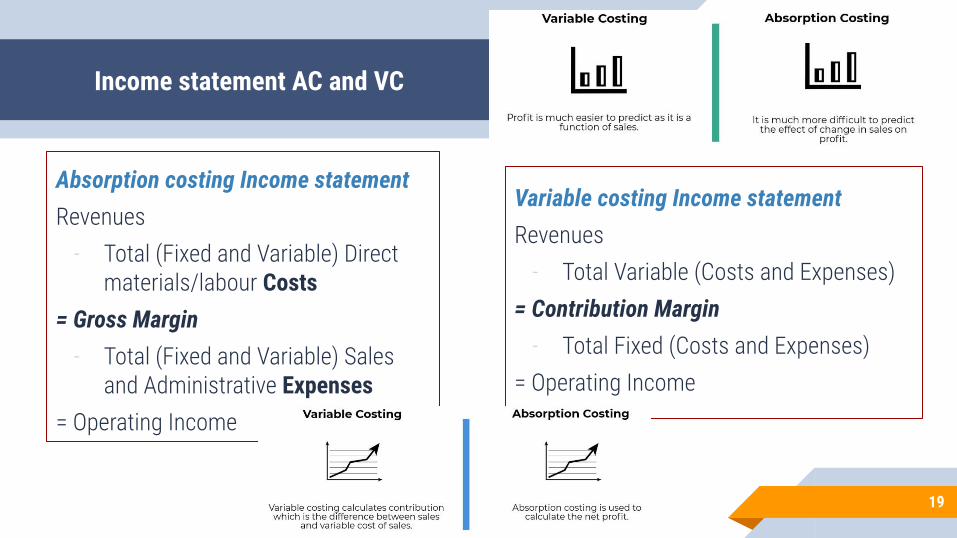
Income statement AC and VC
Absorption costing Income statementRevenues
- Total (Fixed and Variable) Direct materials/labour Costs
= Gross Margin- Total (Fixed and Variable) Sales
and Administrative Expenses= Operating Income
19
Variable costing Income statementRevenues
- Total Variable (Costs and Expenses)= Contribution Margin
- Total Fixed (Costs and Expenses)= Operating Income
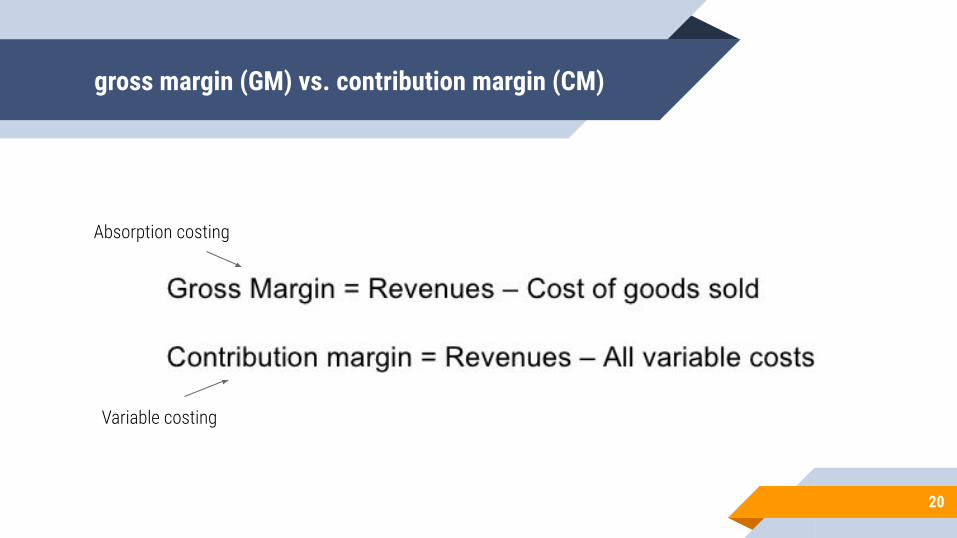
gross margin (GM) vs. contribution margin (CM)
20
Absorption costing
Variable costing

Example, AC and VC without inventory
21
Revenues 4000
Operating CostsVariable costs 2000Fixed costs 400Marketing and Administrative Expenses
Variable expenses 300Fixed expenses 200
Variable Costing
Absorption Costing
Revenues 4000 Revenues 4000
(-) Total Costs2300 = 2000+
300(-)Variable Costs and Expenses
2400 = 2000+ 400
Contribution Margin 1700 Gross Margin 1600
(-) Fixed (Cost + Expenses) 600 = 400+ 200
(-) Total Expenses 500 = 300 + 200
Operating Income 1100
Operating Income 1100
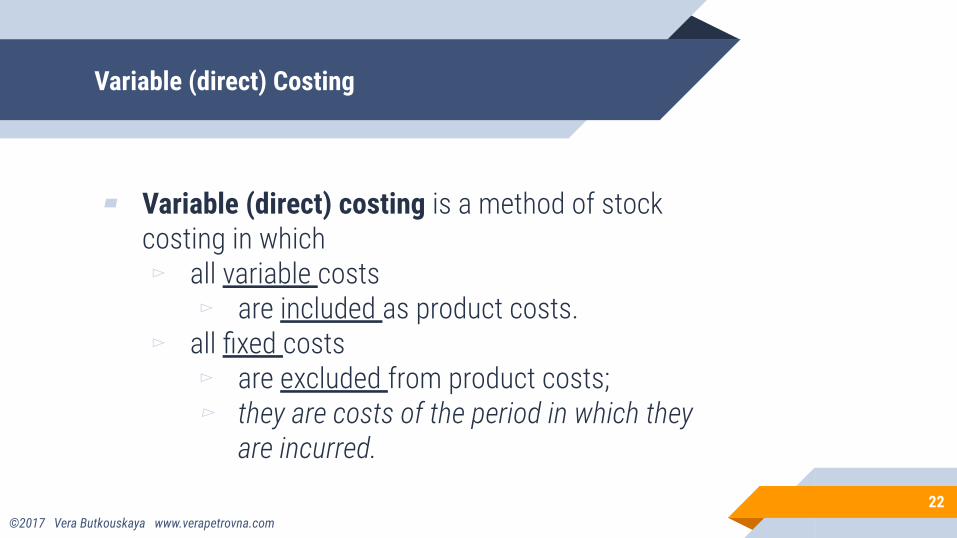
Variable (direct) Costing
▰ Variable (direct) costing is a method of stock costing in which▻ all variable costs
▻ are included as product costs. ▻ all fixed costs
▻ are excluded from product costs; ▻ they are costs of the period in which they
are incurred.
22©2017 Vera Butkouskaya www.verapetrovna.com

Absorption (full) costing
▰ Absorption (full) costing is a method of stock costing in which
▰ all variable operational costs and ▰ all fixed operational costs ▰ are included as product costs.
23

VS vs. AC
24
VC AC
Fixed costs are expensed in the period incurred (no matter if product/service was sold).
are inventoried and are not expenses until the related units is sold.
Income relation allows income to rise as operations rises
Management is used for decision making and performance evaluation (BEP calculations and CVP analysis)
Is required for generally accepted accounting principles (GAAP) of external reporting in most countries.

Cost-volume-profit (CVP) analysis
25
3
COST VOLUME PROFIT ANALYSIS
Basic assumptions:
▰ – selling price is constant▰ – costs are linear;
▻ and can be divided into fixed and variable; ▻ fixed element constant over the relevant range; ▻ unit variable cost constant over relevant range
▰ – sales mix is constant▰ – inventories stay at the same level
26

Contribution Margin (CM)
▰ Contribution Margin (CM) ▻ is the amount remaining from sales revenue ▻ after variable costs and expenses have been
deducted▰ CM goes to cover fixed costs and expenses.▰ After covering fixed costs,
▻ any remaining CM contributes to income.
27
CM=Revenues-Total Variable costscmu = p - vcucmu - CM per unit, vcu - VC pre unit, p - price
Both costs and expenses (for. Ex. marketing)
Both costs and expenses (for. Ex. marketing)

Contribution Margin ratio (CMR)
▰ CM - contribution margin▰ VC - total variable costs and expenses▰ CMR= CONTRIBUTION MARGIN RATIO▰ cmu - CM per unit, vcu - VC pre unit, p - price
▻ CMR = CM / REVENUES OR per unit cmu/p▰ VCR = VARIABLE COST RATIO▰ VCR= VC / REVENUES OR per unit vcu/p▰ CMR +VCR= 1
28

Example
29
Given: Sales 250 000 units. Price per unit 3$. Variable cost per unit 1,8$.
Calculate:
▰ Contribution margin total and per unit.▰ Contribution margin ratio total and per
unit. ▰ Variable cost ratio total and per unit▰ Check if VCR+CMR = 1
Example
30
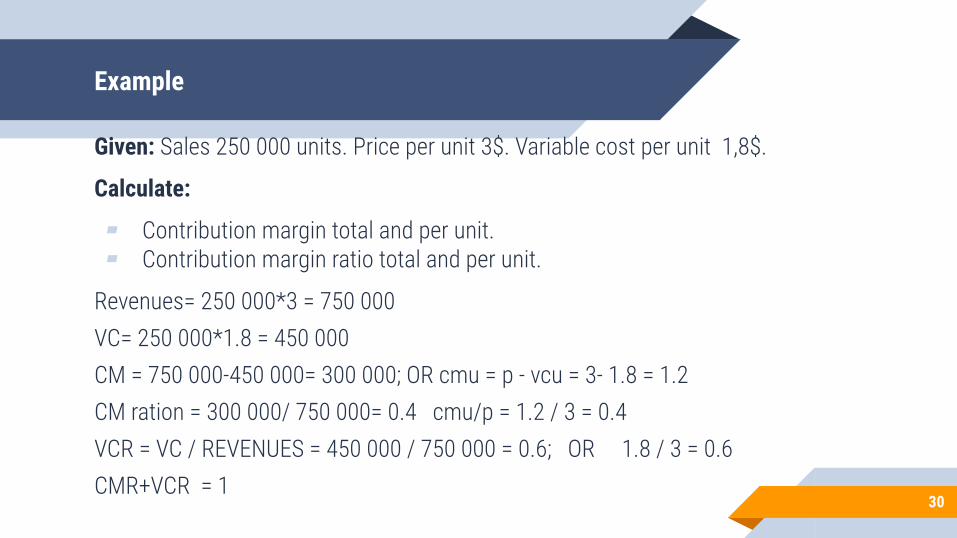
Given: Sales 250 000 units. Price per unit 3$. Variable cost per unit 1,8$.
Calculate:
▰ Contribution margin total and per unit.▰ Contribution margin ratio total and per unit.
Revenues= 250 000*3 = 750 000 VC= 250 000*1.8 = 450 000CM = 750 000-450 000= 300 000; OR cmu = p - vcu = 3- 1.8 = 1.2CM ration = 300 000/ 750 000= 0.4 cmu/p = 1.2 / 3 = 0.4VCR = VC / REVENUES = 450 000 / 750 000 = 0.6; OR 1.8 / 3 = 0.6CMR+VCR = 1
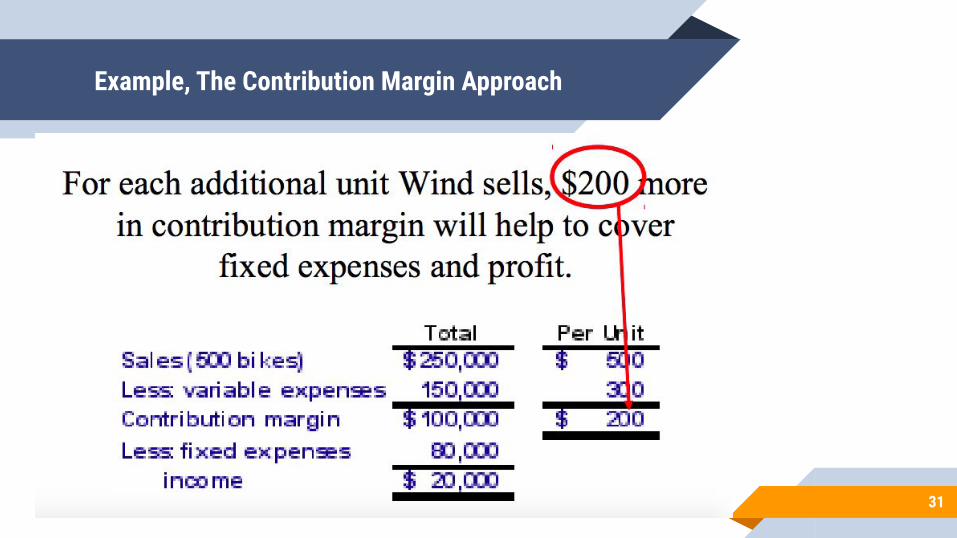
Example, The Contribution Margin Approach
31
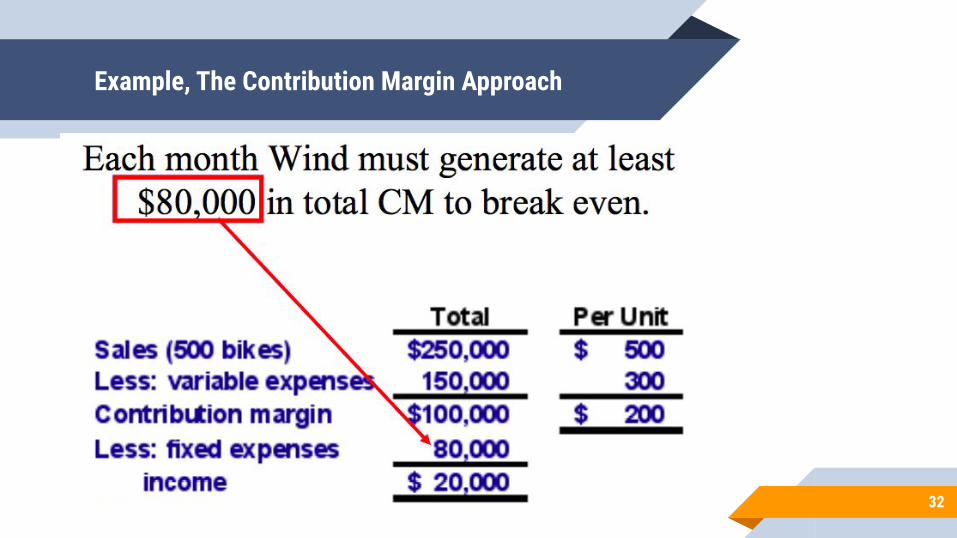
Example, The Contribution Margin Approach
32

Break Even Point (BEP)
▰ The breakeven point (BEP) is where total revenue equal total costs.▰ OR▰ total contribution margin equals total fixed expenses.
▰ Can be calculated in sales $ or in units.
33

Break-Even Analysis
So, break-even analysis can be approached in two ways:
1. Equation method2. Contribution margin method.
Also BEP can be calculated with Target profit
34

BEP in units: Equation Method
▰ q - number of units, p - price, vcu - VC per unit, FC - total FC, cmu - CM per unit
▰ REVENUES= VARIABLE COSTS+FIXED COSTS + PROFIT▻ p*q = vcu *q + FC + 0 (*AT BREAKEVEN PROFIT = 0)▻ q * (p-vcu) = FC▻ q= FC / (p - vcu) OR q=FC / cmu
Used formulas:
▰ CM= SALES - TOTAL VC▰ VC= SALES - CM *INCLUDE VARIABLE PRODUCTION AND SELLING EXPENSES▰ cmu= p - vcu OR cmu= CM/q▰ vcu= VC/ q 35
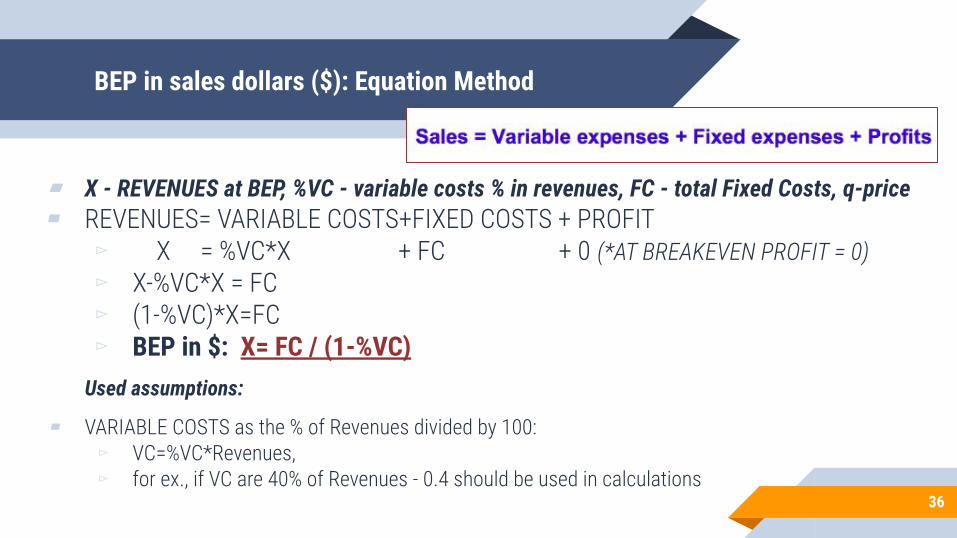
BEP in sales dollars ($): Equation Method
▰ X - REVENUES at BEP, %VC - variable costs % in revenues, FC - total Fixed Costs, q-price▰ REVENUES= VARIABLE COSTS+FIXED COSTS + PROFIT
▻ X = %VC*X + FC + 0 (*AT BREAKEVEN PROFIT = 0)▻ X-%VC*X = FC▻ (1-%VC)*X=FC▻ BEP in $: X= FC / (1-%VC)
Used assumptions:
▰ VARIABLE COSTS as the % of Revenues divided by 100: ▻ VC=%VC*Revenues, ▻ for ex., if VC are 40% of Revenues - 0.4 should be used in calculations
36
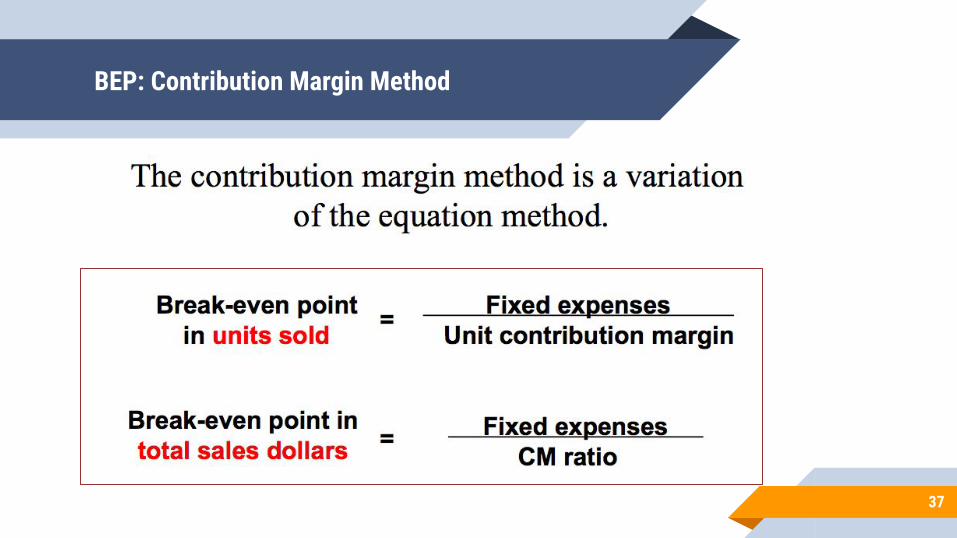
BEP: Contribution Margin Method
37

BEP with Target Profit: Equation Method
▰ q - number of units, p - price, vcu - VC per unit, FC - total FC, cmu - CM per unit▰ REVENUES= VARIABLE COSTS+FIXED COSTS + PROFIT
▻ p*q = vcu *q + FC + Target Profit▻ q * (p-vcu) = FC + Target Profit
▻ Units sold to attain target profit q= (FC +Target profit)/ (p - vcu) ▻ OR ▻ q=(FC +Target profit) / cmu
38

BEP with Target Profit: Equation Method
▰ X - REVENUES at BEP, %VC - variable costs % in revenues, FC - total Fixed Costs, q-price
▰ REVENUES= VARIABLE COSTS+FIXED COSTS + PROFIT▻ X = %VC*X + FC + Target Profit▻ X-%VC*X = FC+Target Profit▻ (1-%VC)*X=FC + Target Profit
▻ Revenues to achieve target profit - X= (FC +Target Profit)/ (1-%VC)
39

BEP with Target Profit: Contribution Margin Method
40
Revenues to attain The target profit =

11. Calculate the Safety Margin for Wind.12. How much is the Safety Margin from the total Revenues (in %)?13. Explain the meaning of the safety margin.
41

42

43
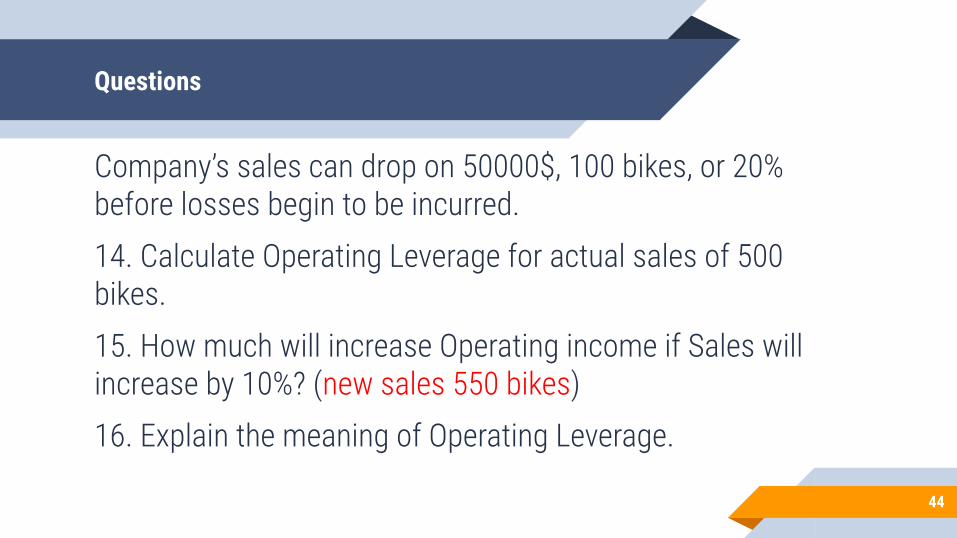
Questions
Company’s sales can drop on 50000$, 100 bikes, or 20% before losses begin to be incurred.14. Calculate Operating Leverage for actual sales of 500 bikes.15. How much will increase Operating income if Sales will increase by 10%? (new sales 550 bikes)16. Explain the meaning of Operating Leverage.
44

45
Degree of Operating Leverage =
=Contribution margin /Operating income
Q.14

46
Q.14

47
Income increase? 30.000/20.000=1.5 >>> 50% Increase in sales (sales revenues) 275.000/250.000=1.1 >>> 10% OL=5
Q.15

48
Q.16

Conclusions: CVP analysis
The company’s sales manager believes that an increase of $10,000 in the monthly advertising budget would increase bike sales to 540 units.
▰ Should we authorize the requested increase in the advertising budget?▰ Increase in sales in %? 540/500=1.08 8%▰ OL=5 ▰ Income in case we sell 540 units??? 8%* 5 40% ▰ Income for 500 bikes 20.000$ so for 540 bikes 20.000+40%=28.000$▰ We will earn 8.000$ more▰ And to get it we will spend 10.000$ more on advertising ▰ So? ▰ No 49

Conclusions: CVP analysis
50

Conclusions: CVP analysis
51
The Shortcut SolutionIncrease in CM (40 units X $200) $ 8,000Increase in advertising expenses 10,000Decrease in Operating income $ (2,000)
▰ If sales increase by $50,000, what will be the increase in total contribution margin?
Change in CM = change in sales*cmuChange in Operating Income = Change in CM - Change in FC

Questions

Income statementDefinitions and formulas
53

Income statement
An income statement is one of the three important financial statements used for reporting a company's financial performance over a specific accounting period. the other two key statements: ▰ the balance sheet▰ the statement of cash flows
54

THE INCOME STATEMENT
three basic elements of income statement:Sales revenue (SR) Sales revenue is produced from the sale of goods and/or services.Cost of sales (CS) Cost of sales reflects the cost of direct materials, direct labour and operation OH that were used in product/service sold (Also known as Costs of Goods sold COGS).Expenses (E) The cost of assets consumed to produce sales revenue. 55

THE INCOME STATEMENT
These and a few other terms are useful when discussing income statements:
▰ Gross margin (GM) Sales revenue minus (-) cost of sales(?) (also known as gross profit).
▰ Breakeven (BE/ BEP) An economic result of operations when total sales revenue equals total costs; no profit (operating income) or loss will exist.
▰ Operating income (OI) Income before taxes.▰ Income (I) An economic result of operations when total
sales revenue is greater than total costs after income taxes.
▰ Loss (L) An economic result of operations when total sales revenue is less than total costs. 56

THE INCOME STATEMENT
that produce three possible outcomes in for-profit operationsSales revenue=Cost of sales +Expenses; BreakevenSales revenue >Cost of sales +Expenses; Net incomeSales revenue <Cost of sales +Expenses; Net loss
57

Related formulas
Sales Revenues (SR)= Price per unit (P)* Number of units sold (Q)
Cost of sales (CS) = Total Variable Costs (TVC) + Total Fixed Costs (TFC)
TVC = Variable cost per unit*Q
TFC = Fixed cost per unit*Q
Gross Margin (Gross Profit) (GM) = SR-CS
Operating Income (OI) = SR - CS - Expenses (E)
OR
OI = GM-E
58
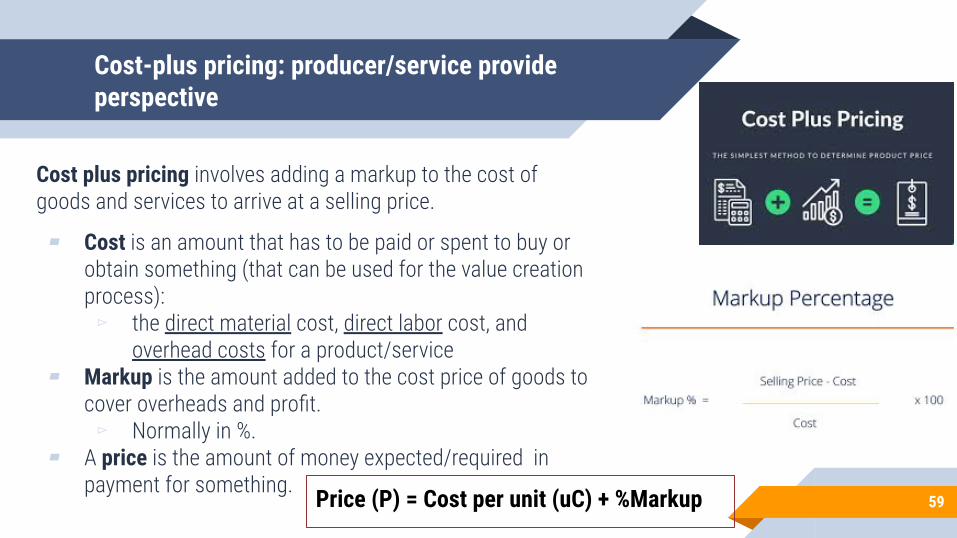
Cost-plus pricing: producer/service provide perspective
Cost plus pricing involves adding a markup to the cost of goods and services to arrive at a selling price.
▰ Cost is an amount that has to be paid or spent to buy or obtain something (that can be used for the value creation process): ▻ the direct material cost, direct labor cost, and
overhead costs for a product/service▰ Markup is the amount added to the cost price of goods to
cover overheads and profit.▻ Normally in %.
▰ A price is the amount of money expected/required in payment for something.
59Price (P) = Cost per unit (uC) + %Markup
Related Documents