MICROECONOMICS Topic 2 Demand & Supply

Welcome message from author
This document is posted to help you gain knowledge. Please leave a comment to let me know what you think about it! Share it to your friends and learn new things together.
Transcript

MICROECONOMICS
Topic 2
Demand & Supply

Demand & Supply
• Demand
• Supply
• Market Equilibrium
• Key Terms

Demand
• Introduction
• The Law of Demand
• Demand Schedule/Demand Curve
• A Change in Demand
• A Change in Quantity Demanded vs A Change in Demand

Demand - Introduction
• If you demand something, then you:
– Want it
– Can afford it
– Plan to buy it
• Quantity Demanded:
– Is the amount of goods and services that consumers plan to buy during a given time periodat a particular price.
– It is measured as an amount per unit of time. Example: 1 cup per day at RM1.50, 1 kg per week at RM3.00

Demand - Introduction
• Demand:
– Refers to the entire relationship between the price of the good and the quantity demanded of the good.

Demand – The Law of Demand
• The law of demand states:
– Other things remaining the same, the higher the price of goods, the smaller the quantity demanded; and the lower the price of a good, the greater is the quantity demanded.

Demand - Schedule
• Demand schedule:
– Lists the quantities demanded at each price when all the other influences on consumers’ planned purchases remain the same.
– Example:
Price = RM 2.00
Quantity Demanded = 3 units per week

Demand Schedule
Price
(RM per disc)
Quantity Demanded
(millions of discs per week)
A 0.50 9
B 1.00 6
C 1.50 4
D 2.00 3
E 2.50 2

Demand - Curve
• Demand curve:
– Shows the relationship between the quantity demandof a good and its price when all other influences on consumers’ planned purchases remain the same.

Demand - Curve
0
Quantity ( millions of discs per week)
Price(RM per disc)
Demand for disc
E
C
A
2.50
1.50
0.50
2 4 9
Demand Curve

Demand – A Change in Quantity Demanded vs A Change in Demand
• Movement along the demand curve
– If the price of a goods changes but everything else remain the same.
• A shift of the demand curve
– If the price of a good remains constant but some other influences on buyers’ plans changes.
– When demand increases, the demand curve shifts rightward.
– When demand decreases, the demand curve shifts leftward.

Demand – A Change in Demand
• 6 factors bring changes in demand:
– The prices of related goods (substitute goods; complement goods)
– Expected future prices
– Income ( normal goods; inferior goods)
– Expected future income
– Population
– Preferences

Demand – A Change in Quantity Demanded vs A Change in Demand
0Quantity
Price
D2
D0
D1Decrease in demand
Increase in demand
Decrease inquantity demanded
Increase inquantity demanded

Supply
• Introduction
• The Law of Supply
• Supply Schedule/Supply Curve
• A Change in Supply
• A Change in Quantity Supplied VS A Change in Supply

Supply - Introduction
• If a firm supplies a good or service, the firm:
– Has the resources and technology to produce it,
– Can profit from producing it,
– Plans to produce it and sell it.
• Quantity supplied:
– The amount that producers plan to sell during a given time period at a particular price.

Supply - Introduction
• Supply:
– Refers to the entire relationship between the quantity supplied and the price of a good.

Supply – The Law of Supply
• The law of supply states:
– Other things remaining the same, the higher the price of a good, the greater is the quantity supplied; and the lower the price of a good, the smaller is the quantity supplied.

Supply - Schedule
• Supply schedule
– Lists the quantities supplied at each price when all the other influences on producers’ planned sale remain the same.
– Example:
Price = RM 1.00
Quantity supplied = 3 millions CDs a week

Supply - Schedule
Price
(RM per disc)
Quantity supplied
(millions of discs per week)
A 0.50 0
B 1.00 3
C 1.50 4
D 2.00 5
E 2.50 6
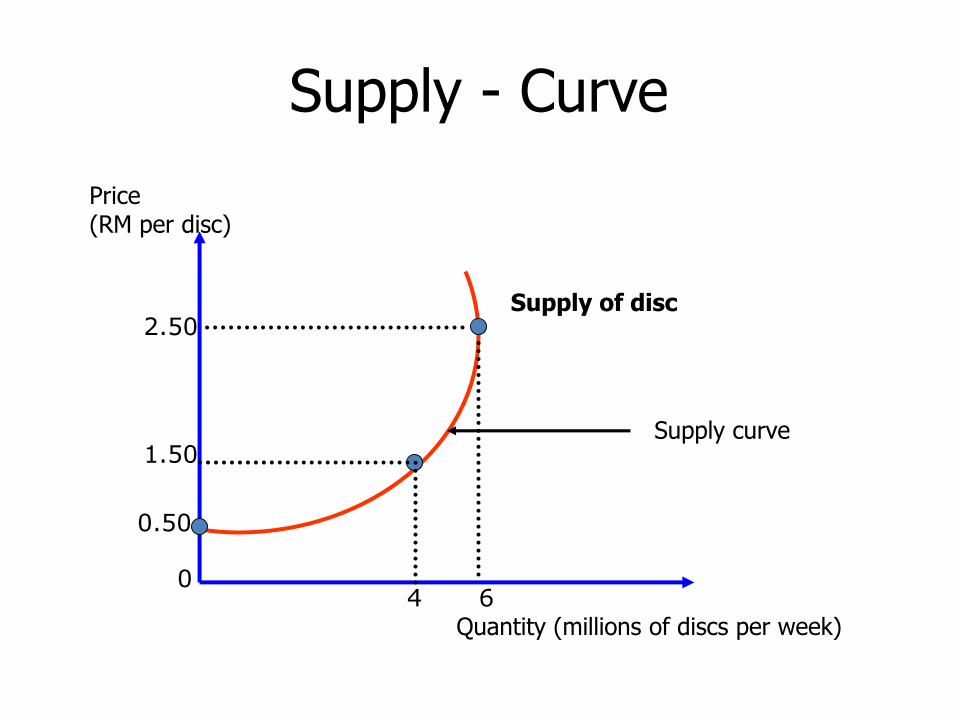
Supply - Curve
0
Quantity (millions of discs per week)
Price(RM per disc)
1.50
2.50
0.50
4 6
Supply of disc
Supply curve

Supply – A Change in Supply
• When any factor that influences selling plans other than the price of the good changes, there is a change in supply.
• When supply decreases, the supply curve shift leftward.
• When supply increases, the supply curve shift rightward.

Supply – A Change in Quantity Supplied vs A Change in Supply
0Quantity
Price
S2
S0S1
Decrease inquantity supplied
Increase inquantity supplied
Decrease in supply
Increasein supply

Supply – A Change in Supply
• 5 main factors bring changes in supply:
– The prices of resources used to produce the good (car – price of steel increase)
– The prices of related goods produced (substitute gds & complement gds)
– Expected future prices (sugar – price is expected to rise next month)
– The number of suppliers
– Technology

Market Equilibrium
A market is said to be in equilibrium if the price in the market is such that the quantity supplied (QS) in the
market and the quantity demanded (QD) in the market are equal.

Market Equilibrium
• Equilibrium price:
– The price at which the quantity demanded equals the quantity supplied
• Equilibrium quantity:
– The quantity bought and sold at the equilibrium price

Market Equilibrium
Price
(RM per disc)
Quantity Demanded
(millions of discs per week)
A 0.50 9
B 1.00 6
C 1.50 4
D 2.00 3
E 2.50 2
Quantity supplied
(millions of discs per week)
Surplus / Shortage (of
Supply)
0 (9 – 0) =-9
3 (6 – 3) =-3
4 (4 –4) =0
5 (3 – 5) =+2
6 (2 – 6) = +4

Market Equilibrium - Graph
0
Quantity (millions of discs per week
Price(RM per disc)
Demandof disc
Supplyof disc
1.50
0.50
4
1.00
3 6
equilibrium
A market is in equilibrium when the price is such that excess supply equals excess demand equals zero.

Market Equilibrium
• Only in equilibrium is quantity supplied equal to quantity demanded.
• At any price level
other than P0, the
wishes of buyers
and sellers do not
coincide.

At a given price, the excess of the quantity supplied over the quantity demand is called the excess supply.
Surplus and Shortage
Surplus
Surplus QS > QD

Market Disequilibria
• Excess supply, or surplus, is the condition that exists when quantity supplied exceeds quantity demanded at the current price.
• When quantity supplied
exceeds quantity
demanded, price tends to
fall until equilibrium is
restored.

At a given price, the excess of the quantity demanded over the quantity supplied is called the excess demand.
Surplus and Shortage
Shortage QS < QD

Market Disequilibria
• Excess demand, or
shortage, is the condition
that exists when quantity
demanded exceeds
quantity supplied at the
current price.
• When quantity demanded
exceeds quantity
supplied, price tends to
rise until equilibrium is
restored.

Increases in Demand and Supply
• Higher demand leads to higher equilibrium price and higher equilibrium quantity.
• Higher supply leads to lower equilibrium price and higher equilibrium quantity.

Decreases in Demand and Supply
• Lower demand leads to lower price and lower quantity exchanged.
• Lower supply leads to higher price and lower quantity exchanged.

Algebraic analysis of supply and demand
To find an equilibrium in a market:
1. Set supply equal to demandand solve for P.
2. Substitute P in the supply anddemand equationsto get the quantities.

QD = 20 - 2P
Example Demand Equation

Example Supply Equation
QS = -4 + 2P

Example Calculation
QD = 20 - 2P = -4 + 2P = QS
Set supply equal to demand and solve the equation for P.
20 + 4 = 2P + 2P
24 = 4P 4 4
6 = P
24 = 4P
20 - 2P = -4 + 2P

Example Calculation
QD = 20 - 2P= 20 – 2(6)= 8 unit
QS = - 4 + 2P= - 4 + 2(6)= - 4 + 12= 8 unit

The End
Next Topic:
Elasticity
Related Documents