Topic 1 Characteristics of Quadratic Functions Unit 6 Topic 1

Welcome message from author
This document is posted to help you gain knowledge. Please leave a comment to let me know what you think about it! Share it to your friends and learn new things together.
Transcript

Topic 1Characteristics of Quadratic Functions
Unit 6 Topic 1
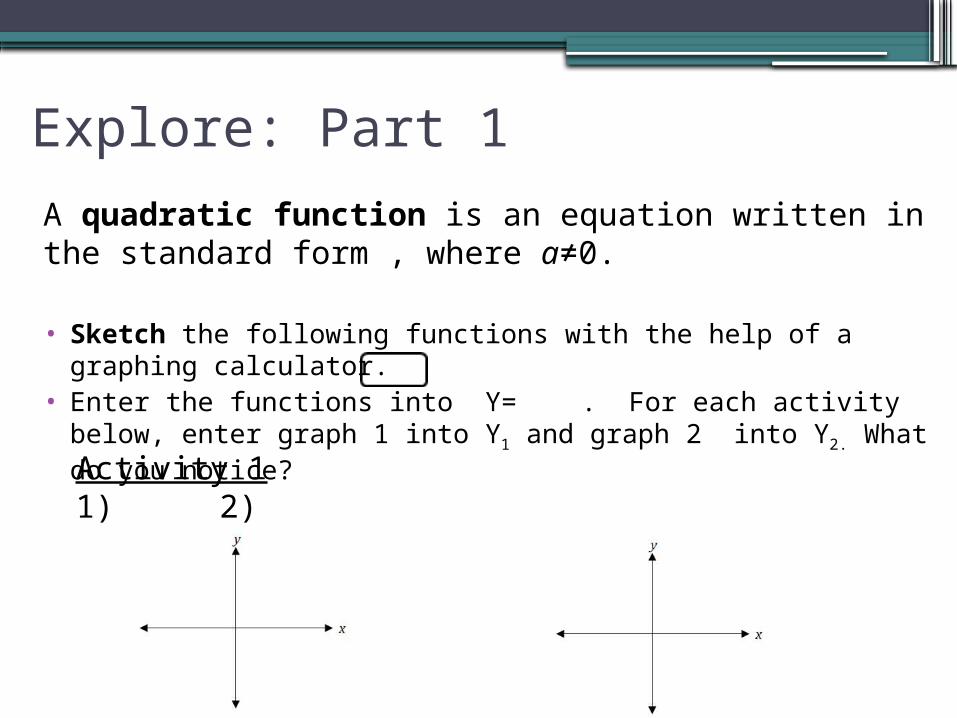
Explore: Part 1
A quadratic function is an equation written in the standard form , where a≠0.
• Sketch the following functions with the help of a graphing calculator.
• Enter the functions into Y= . For each activity below, enter graph 1 into Y1 and graph 2 into Y2. What do you notice?
Activity 11) 2)

Explore: Part 1• Sketch the following functions with the help of a graphing
calculator.• Enter the functions into Y= . For each activity below, enter
graph 1 into Y1 and graph 2 into Y2. What do you notice?
Activity 21) 2)
What happens when the value of a is changed to a negative?
You should notice…
• When the value of a is changed to a negative, the graph changes – it opens downward.▫When the a-value is positive, the graph opens
up▫When the a-value is negative, the graph opens
down
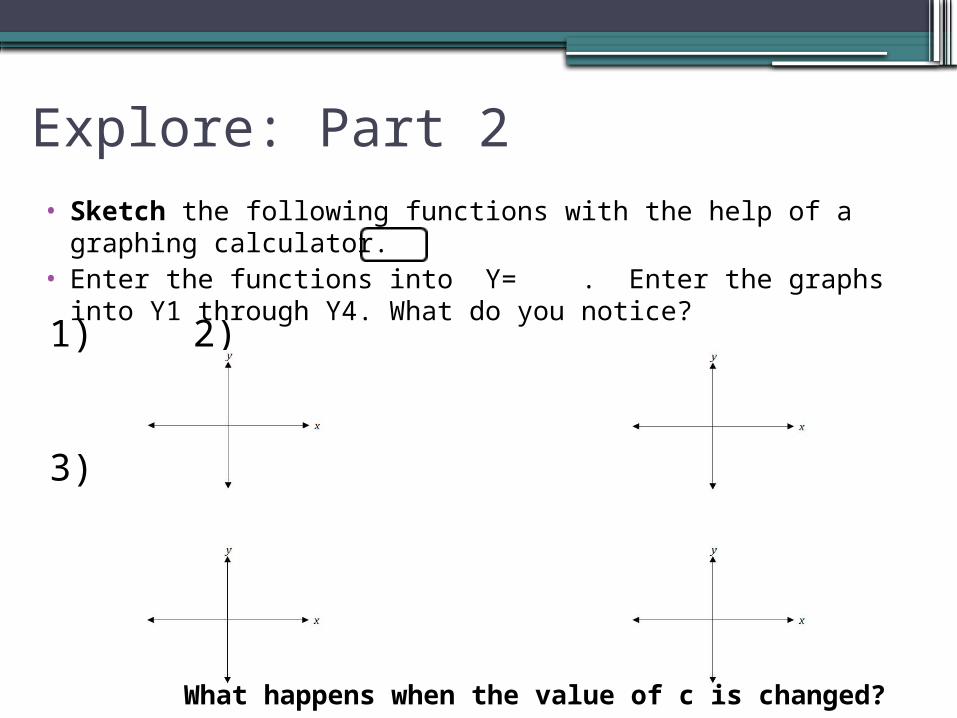
Explore: Part 2• Sketch the following functions with the help of a graphing
calculator.• Enter the functions into Y= . Enter the graphs into Y1 through
Y4. What do you notice?
1) 2) 3) 4)
What happens when the value of c is changed?
You should notice…
• The c-value affects where the graph is located• The c-value gives the y-intercept
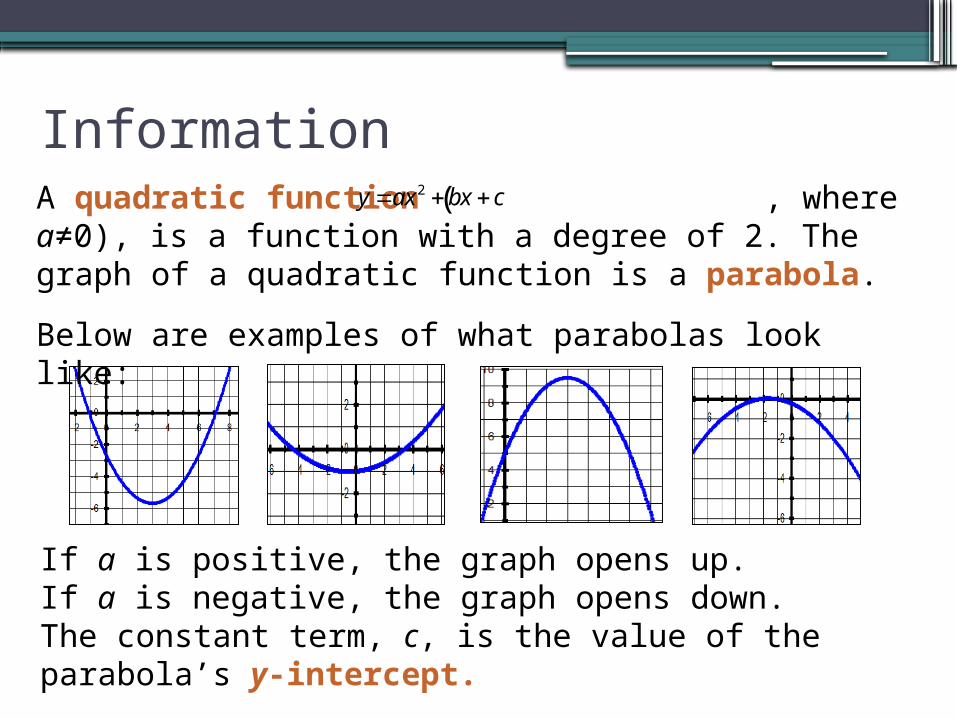
InformationA quadratic function ( , where a≠0), is a function with a degree of 2. The graph of a quadratic function is a parabola.
Below are examples of what parabolas look like:
y ax bx c2
If a is positive, the graph opens up.If a is negative, the graph opens down.The constant term, c, is the value of the parabola’s y-intercept.
Information
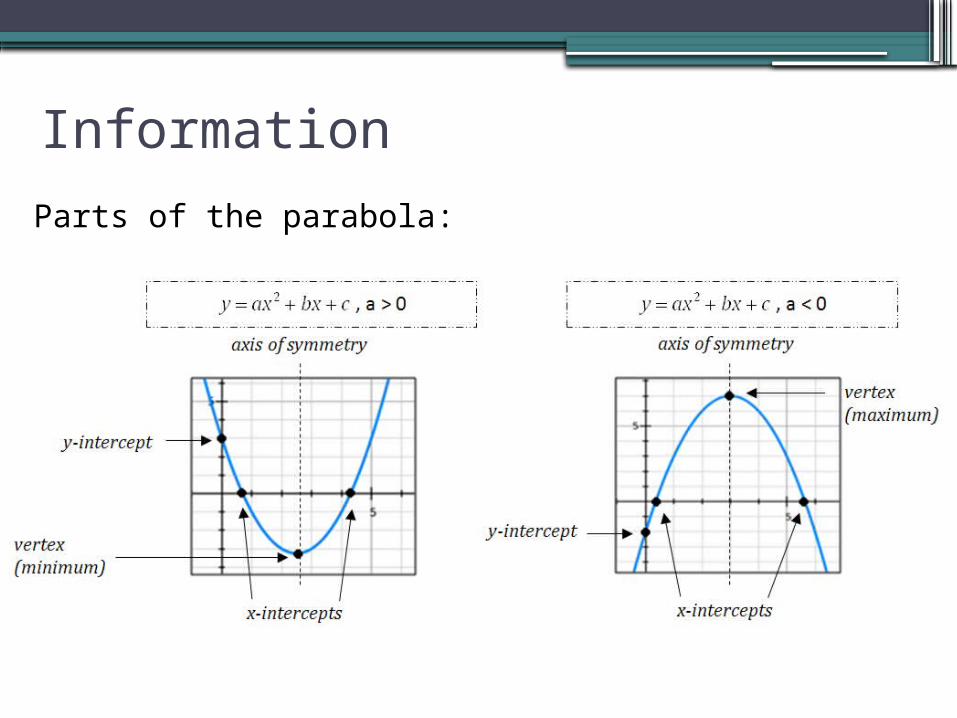
Parts of the parabola:

Information
• vertex: the point at which the quadratic function reaches its maximum or minimum value
• minimum value: the lowest y-value (for a quadratic function that opens up)
• maximum value: the highest y-value (for a quadratic function that opens down)
• axis of symmetry: the line through the vertex that divides the graph into two symmetric halves; the x-coordinate of the vertex defines the equation of the axis of symmetry(if r and s are the x-intercepts, axisofsymmetry= ).
• x-intercept: where the graph crosses the x-axis (x, 0)
• y-intercept: where the graph crosses the y-axis (0, y)
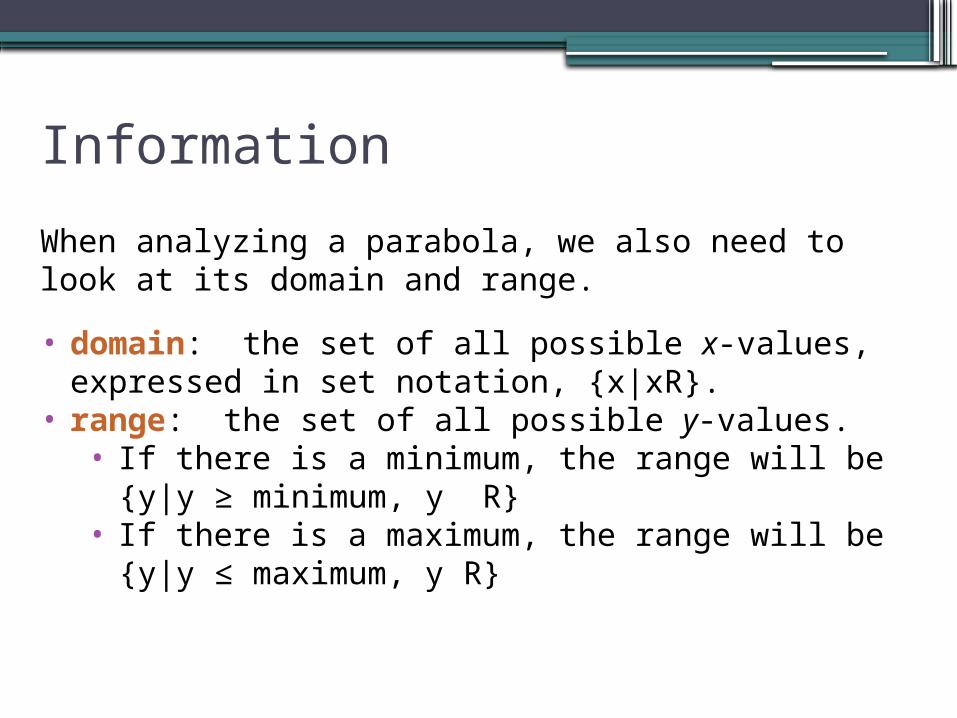
Information When analyzing a parabola, we also need to look at its domain and range.
• domain: the set of all possible x-values, expressed in set notation, {x|xR}.
• range: the set of all possible y-values. • If there is a minimum, the range will be
{y|y ≥ minimum, y R}• If there is a maximum, the range will be
{y|y ≤ maximum, y R}

Example 1Characteristics of Quadratic Functions
For each of quadratic function, fill in the characteristics:
a) up
(0, 0)
x = 0
x = 0
y = 0
Minimum at y =
0
{ | }x x R
{ | 0, } y y y R
2y x
Try this on your own first!!!!Try this on your own first!!!!
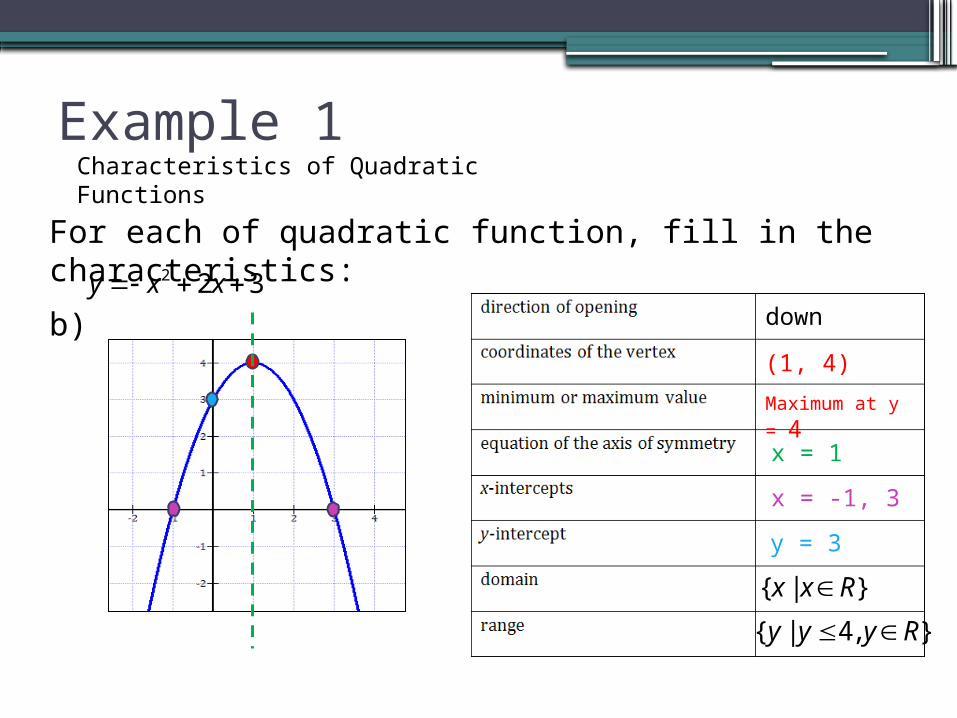
Example 1Characteristics of Quadratic Functions
For each of quadratic function, fill in the characteristics:
b) down
(1, 4)
x = 1
x = -1, 3
y = 3
Maximum at y =
4
{ | }x x R
{ | 4, } y y y R
2 2 3y x x

Example 1Characteristics of Quadratic Functions
For each of quadratic function, fill in the characteristics:
c) up
(1, -1)
x = 1
x = 0, 2
y = 0
Minimum at y =
-1
{ | }x x R
{ | 1, } y y y R
2( ) 2f x x x

Example 1Characteristics of Quadratic Functions
For each of quadratic function, fill in the characteristics:
d) up
(3, 7)
x = 3
none
y = 25
Minimum at y =
7
{ | }x x R
{ | 7, } y y y R
22 12 25y x x
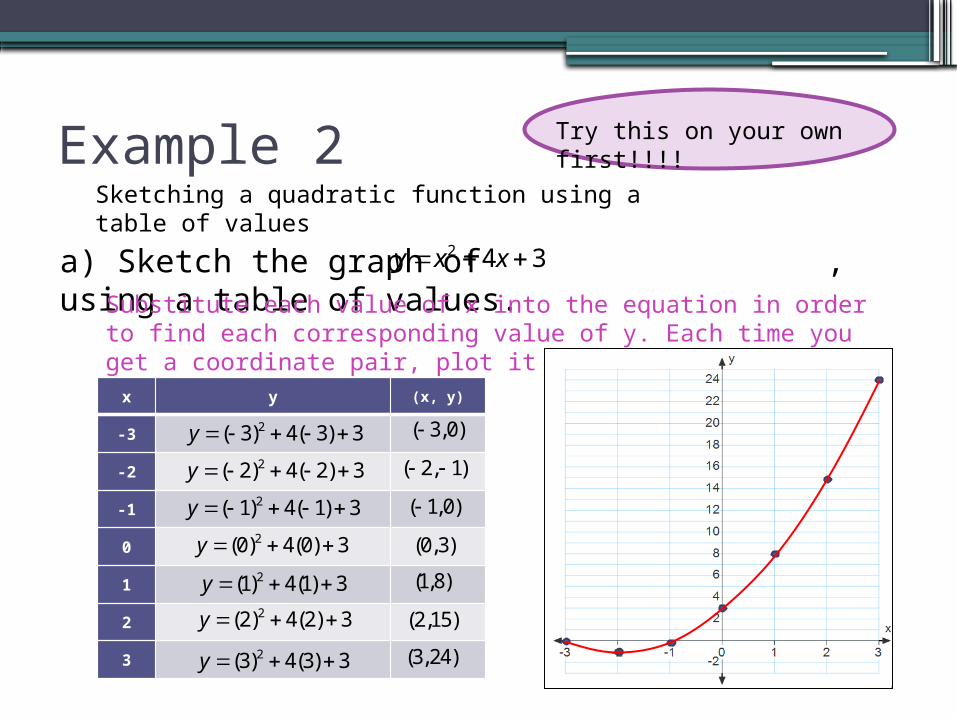
Example 2Sketching a quadratic function using a table of values
a) Sketch the graph of , using a table of values.
Try this on your own first!!!!
2 4 3y x x
x y (x, y)
-3
-2
-1
0
1
2
3
2( 3) 4( 3) 3y
Substitute each value of x into the equation in order to find each corresponding value of y. Each time you get a coordinate pair, plot it on the graph.
2( 2) 4( 2) 3y 2( 1) 4( 1) 3y 2(0) 4(0) 3y 2(1) 4(1) 3y 2(2) 4(2) 3y 2(3) 4(3) 3y
( 3,0)
( 2, 1)
( 1,0)
(0,3)
(1,8)
(2,15)
(3,24)

Example 2Sketching a quadratic function using a table of values
b) Determine the x-intercepts, y-intercept, the equation of the axis of symmetry, the coordinates of the vertex, the domain, and the range.
Try this on your own first!!!!
x–intercepts: x = -3, -1
y–intercept: y = 3
axis of symmetry: x = -2
coordinates of the vertex: (-2, -1)domain:range:
{ | }x x R{ | 1, } y y y R
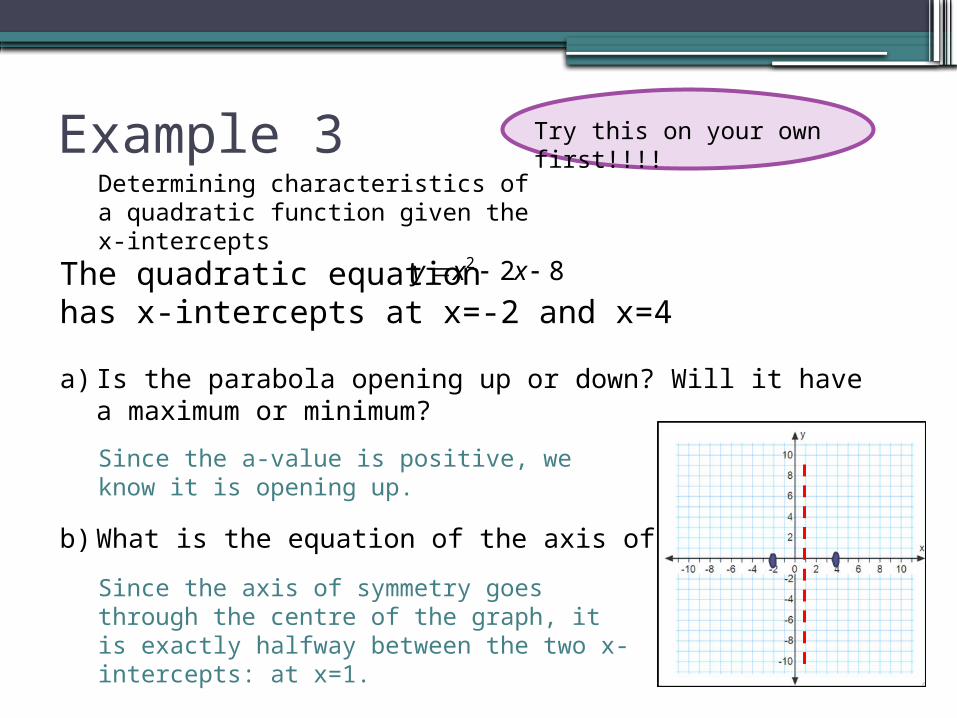
Example 3Determining characteristics of a quadratic function given the x-intercepts
The quadratic equation has x-intercepts at x=-2 and x=4
a) Is the parabola opening up or down? Will it have a maximum or minimum?
b) What is the equation of the axis of symmetry?
Try this on your own first!!!!
2 2 8y x x
Since the a-value is positive, we know it is opening up.
Since the axis of symmetry goes through the centre of the graph, it is exactly halfway between the two x-intercepts: at x=1.

Example 3Determining characteristics of a quadratic function given the x-intercepts
The quadratic equation has x-intercepts at x=-2 and x=4
c) What is the coordinate of the vertex?
d) State the domain and range of the function.
Try this on your own first!!!!
2 2 8y x x
Since the axis of symmetry has an x-value of 1, the y-value can be determined by substituting 1 in for x.2(1) 2(1) 8; 9y y
x R 9y

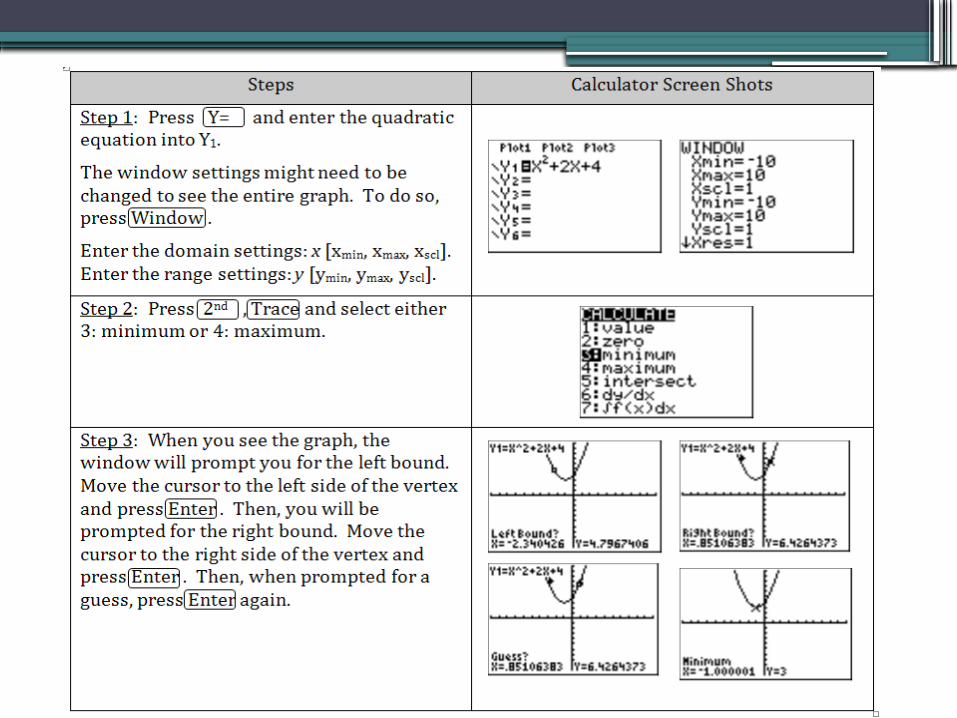
Information
• Another way to determine the vertex of a parabola is to use the graphing calculator.

Example 4
Given the quadratic equation use a graphing calculator to determine the
a) window settings usedb) vertexc) axis of symmetryd) domain and range
Try this on your own first!!!!
Determining characteristics of a quadratic function graphically
2 5 4 y x x
As we proceed through this question, refer to the steps in your workbook.
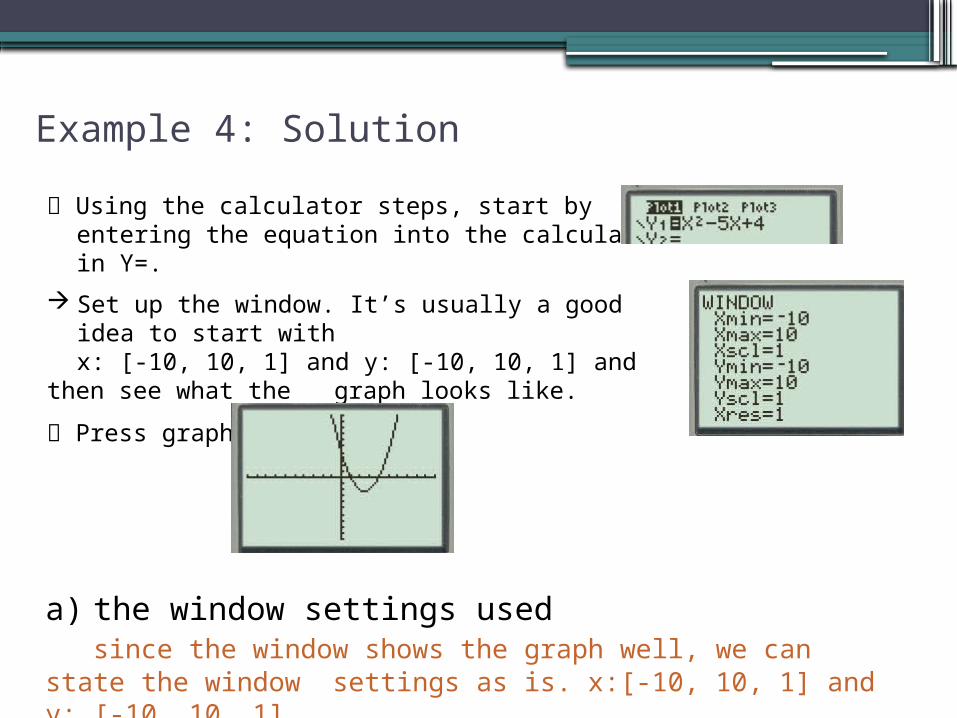
Example 4: Solution
Using the calculator steps, start by entering the equation into the calculator in Y=.
Set up the window. It’s usually a good idea to start with x: [-10, 10, 1] and y: [-10, 10, 1] and then see
what the graph looks like.
Press graph.
a) the window settings usedsince the window shows the graph well, we can state the
window settings as is. x:[-10, 10, 1] and y: [-10, 10, 1]

Example 4: Solution
As you can see in the graph, we have a minimum for a vertex. Press 2nd Trace and select 3: minimum.
Follow the prompts on your calculator. Move the cursor to the left of the vertex and press Enter. Then move the cursor to the right of the vertex and press Enter. Then press Enter again when you are asked for a guess.
There is a minimum at (2.5, -2.25)
b) vertex
Vertex is a minimum at (2.5, -2.25)

Example 4: Solution
c) axis of symmetry
The axis of symmetry passes through the vertex, so the axis of symmetry is: x = 2.5
d) domain and range
The domain is {x|xЄR} and the range is {y|y ≥ -2.25, y ЄR}

Example 5Quadratic function of a ski jump
A skier’s jump was recorded in a frame-by-frame analysis. The picture was used to determine the quadratic function that relates the skier’s height above the ground, y, measured in metres, to the time,x, in seconds that the skier was in the air: .
a) Graph the function in your calculator. State the window settings used.
Try this on your own first!!!!
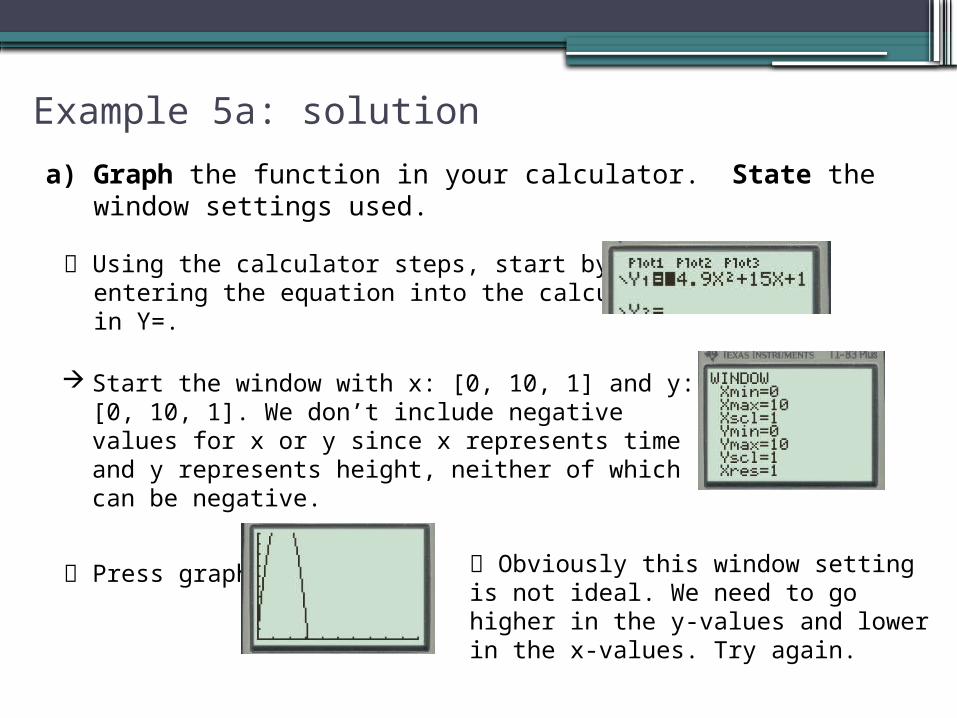
Example 5a: solution
a) Graph the function in your calculator. State the window settings used.
Using the calculator steps, start by entering the equation into the calculator in Y=.
Start the window with x: [0, 10, 1] and y: [0, 10, 1]. We don’t include negative values for x or y since x represents time and y represents height, neither of which can be negative.
Press graph. Obviously this window setting is not ideal. We need to go higher in the y-values and lower in the x-values. Try again.

Example 5a: solutiona) Graph the function in your calculator. State the window
settings used.
Much better. The windows used are x: [0, 5, 1] and y: [0, 15, 1]
Now that we have a good graph to work from the rest becomes pretty straight forward.
Example 5Quadratic function of a ski jump
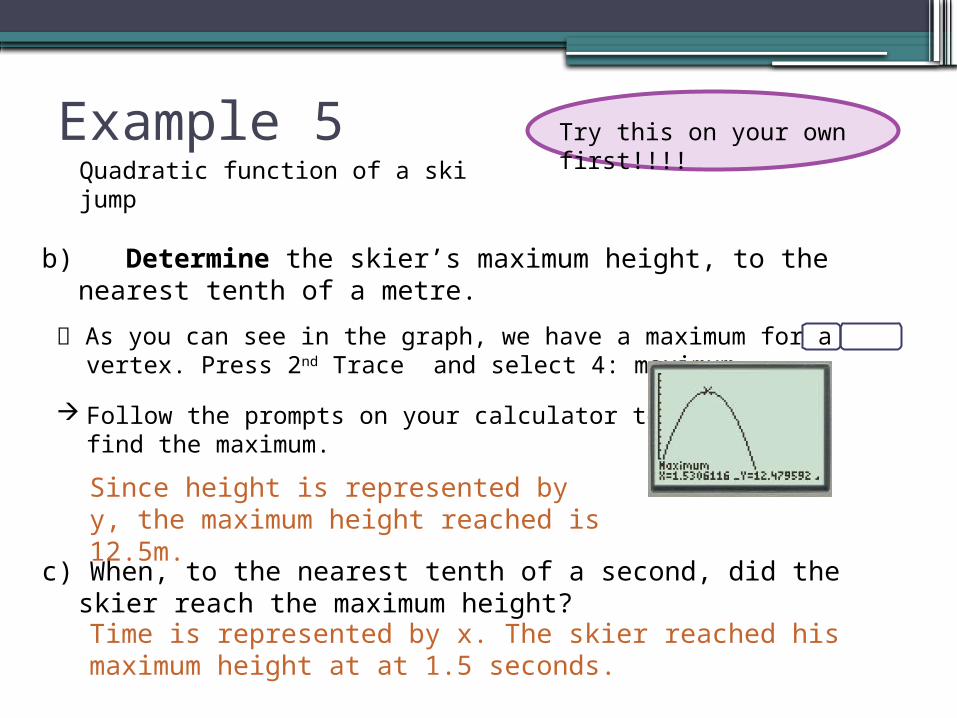
b) Determine the skier’s maximum height, to the nearest tenth
of a metre.
c) When, to the nearest tenth of a second, did the skier reach the maximum height?
Try this on your own first!!!!
As you can see in the graph, we have a maximum for a vertex. Press 2nd Trace and select 4: maximum.
Follow the prompts on your calculator to find the maximum.
Since height is represented by y, the maximum height reached is 12.5m.
Time is represented by x. The skier reached his maximum height at at 1.5 seconds.
Example 5Quadratic function of a ski jump
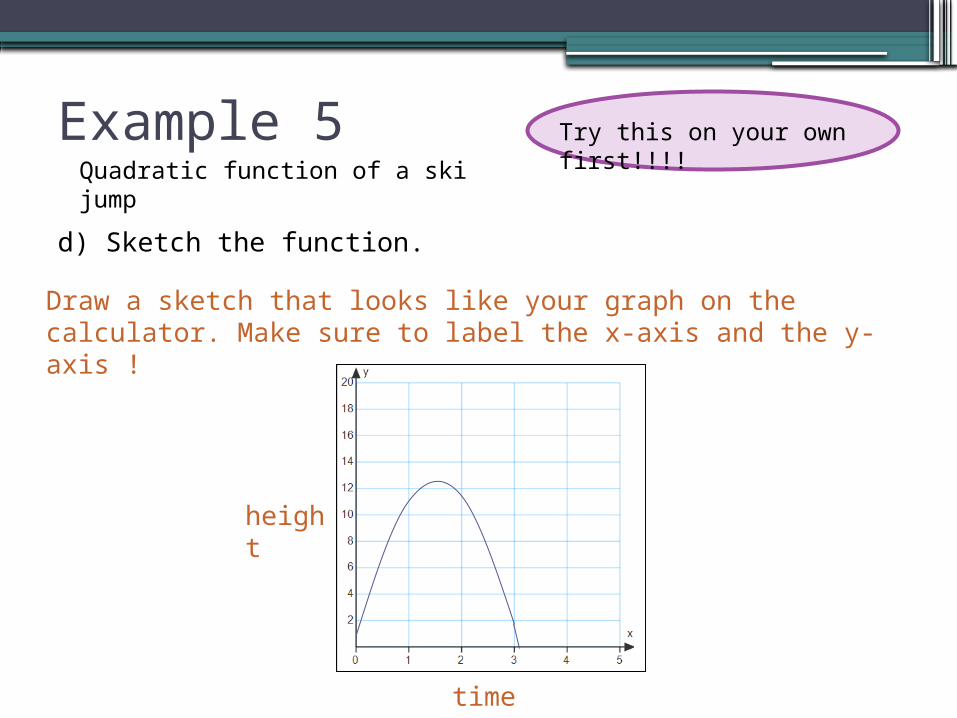
d) Sketch the function.
Try this on your own first!!!!
Draw a sketch that looks like your graph on the calculator. Make sure to label the x-axis and the y-axis !
time
height
Example 5Quadratic function of a ski jump
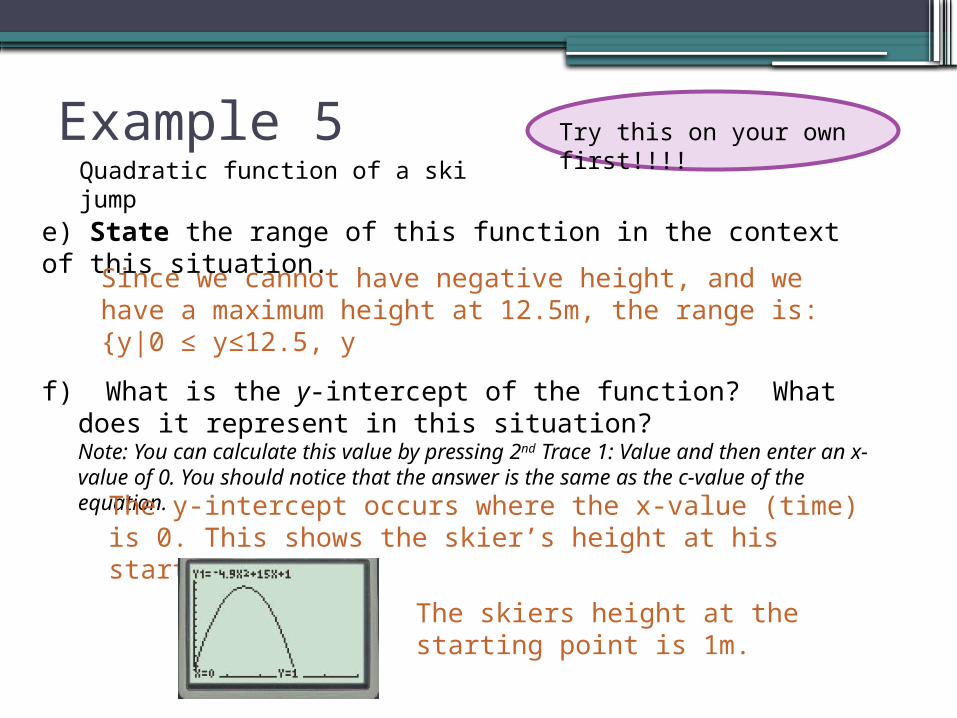
e) State the range of this function in the context of this situation.
f) What is the y-intercept of the function? What does it represent in this situation?Note:Youcancalculatethisvaluebypressing2ndTrace1:Valueandthenenteranx-valueof0.Youshouldnoticethattheansweristhesameasthec-valueoftheequation.
Try this on your own first!!!!
Since we cannot have negative height, and we have a maximum height at 12.5m, the range is: {y|0 ≤ y≤12.5, y
The y-intercept occurs where the x-value (time) is 0. This shows the skier’s height at his starting point.
The skiers height at the starting point is 1m.
Example 5Quadratic function of a ski jump
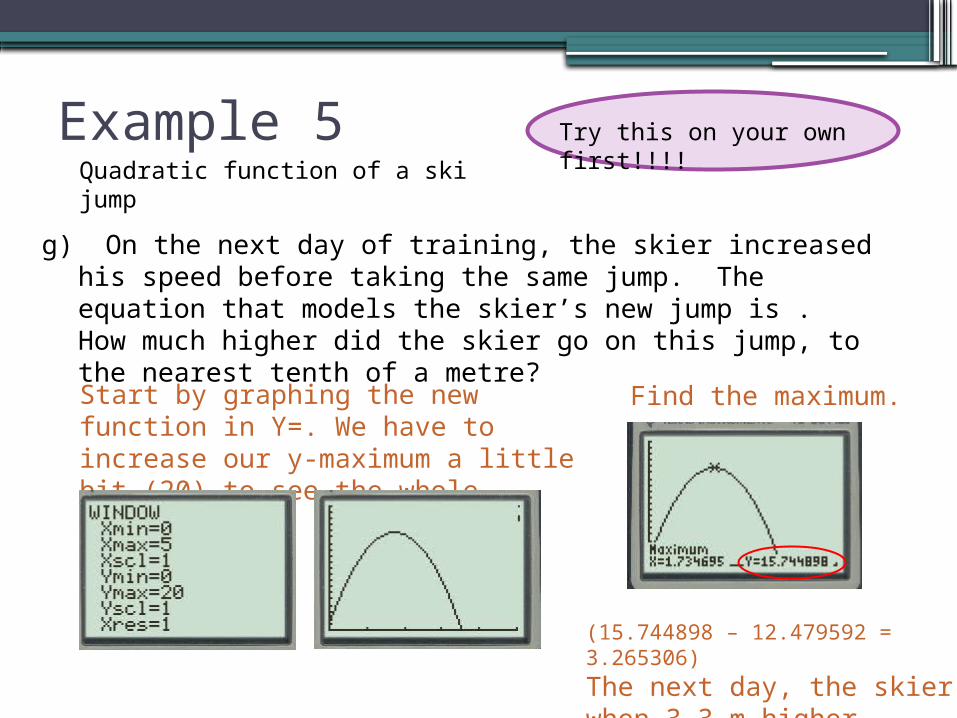
g) On the next day of training, the skier increased his speed before taking the same jump. The equation that models the skier’s new jump is . How much higher did the skier go on this jump, to the nearest tenth of a metre?
Try this on your own first!!!!
Start by graphing the new function in Y=. We have to increase our y-maximum a little bit (20) to see the whole graph.
Find the maximum.
(15.744898 – 12.479592 = 3.265306)The next day, the skier when 3.3 m higher.
Need to Know:• A quadratic function is in the form , where a≠0.• When a quadratic function is graphed, its graph is a
parabola.▫ If a is positive, the graph opens up.▫ If a is negative, the graph opens down.
• The constant term, c, is the value of the parabola’s y-intercept.
• Properties of the parabola include its vertex (which is either a minimum or maximum),
axis of symmetry, x-intercepts, y-intercept, domain and range.
You’re ready! Try the homework from this section.
Related Documents