Md. Monirul Islam, ACA (Bank Analyst) [email protected] Md. Ashfaque Alam (Research Associate) [email protected] Top five first generation banks Top five first generation banks A comparative analysis A comparative analysis 19 July 2010 19 July 2010 Sector rating: Outperform Sector rating: Outperform Overview and Structure of the Financial System The Bangladesh financial system is composed of scheduled banks (which include commercial banks and specialized development banks), non‐bank financial institutions, micro‐finance institutions, cooperative banks and other institutions such as merchant banks, mutual fund operators and insurance companies. Commercial Banks The commercial banks are at the core of the financial system and account for more than 80% of all financial system assets. They could be subdivided based on ownership as state-owned commercial banks (SOCBs), private commercial banks (PCBs) and foreign commercial banks (FCBs). At present there are 43 commercial banks in Bangladesh, comprising 4 SOCBs, 30 PCBs and 9 FCBs. Following financial liberalization in the 1990s, eight FCBs and 10 PCBs were allowed to operate, resulting in increased competition. This, coupled with the inherent weaknesses in SOCBs, resulted in market share shifting away from the SOCBs to PCBs and FCBs. Currently, PCBs constitute 59.24% of total loan (investment) amounts. Specialized Banks The specialized banks are development financial institutions formed to meet specific credit needs in sectors such as agriculture and industry. There are currently five of them in Bangladesh. Non‐Bank Financial Institutions Compared with the commercial banks, the non‐bank financial institutions (NBFIs) have a rather limited role in the financial system, accounting for less than 5% of financial system assets. The NBFIs are mainly engaged in the business of financial and operational leases (about 40% of assets), term lending (about 21% of assets), working capital financing (16% of assets), housing finance (about 14% of assets), merchant banking and venture capital financing. NBFIs also face competition from commercial banks that have started to offer the same products, especially leasing. NBFIs, however, appear to have managed to handle asset quality better than the commercial banks, as reflected by an NPL ratio of 8.2% at end‐June 2008 compared to 13% for banks . That said, it should be noted that this ratio could be understated due to the relatively lax asset quality regulations for NBFIs compared with banks. Currently, there are 29 NBFIs, of which 13 are joint ventures with foreign participation. The NBFIs are licensed and regulated under the Financial Institution Act, 1993, by Bangladesh Bank. Performance & Profitability The banks in Bangladesh have enjoyed high interest spreads for the last few years, although the Bangladesh Bank (BB) is now emphasizing on reducing the spread by lowering both the deposit and the lending rates Regulatory environment Banks and non‐bank financial institutions are regulated by Bangladesh Bank (BB) - the country’s central bank. BB has been working as the central bank since the country's independence. Its functions include issuing of currency, maintaining foreign exchange reserve and providing transaction facilities of all public monetary matters. BB is also responsible for planning the government's monetary policy and implementing it thereby. The Bank Company Act of 1991 empowers the central bank to issue licenses to carry out banking business in Bangladesh. Bangladesh Bank monitors the performance of the banking sector using the CAMELS framework (CAMELS: capital adequacy, asset quality, management soundness, earnings, liquidity and sensitivity to market risk). Banks are subject to periodic comprehensive inspections and ad‐hoc special inspections.

Welcome message from author
This document is posted to help you gain knowledge. Please leave a comment to let me know what you think about it! Share it to your friends and learn new things together.
Transcript

Md. Monirul Islam, ACA (Bank Analyst) [email protected]
Md. Ashfaque Alam (Research Associate) [email protected]
Top five first generation banksTop five first generation banks A comparative analysisA comparative analysis 19 July 201019 July 2010
Sector rating: OutperformSector rating: Outperform
Overview and Structure of the Financial System The Bangladesh financial system is composed of scheduled banks (which include commercial banks and specialized development banks), non‐bank financial institutions, micro‐finance institutions, cooperative banks and other institutions such as merchant banks, mutual fund operators and insurance companies. Commercial Banks The commercial banks are at the core of the financial system and account for more than 80% of all financial system assets. They could be subdivided based on ownership as state-owned commercial banks (SOCBs), private commercial banks (PCBs) and foreign commercial banks (FCBs). At present there are 43 commercial banks in Bangladesh, comprising 4 SOCBs, 30 PCBs and 9 FCBs. Following financial liberalization in the 1990s, eight FCBs and 10 PCBs were allowed to operate, resulting in increased competition. This, coupled with the inherent weaknesses in SOCBs, resulted in market share shifting away from the SOCBs to PCBs and FCBs. Currently, PCBs constitute 59.24% of total loan (investment) amounts. Specialized Banks The specialized banks are development financial institutions formed to meet specific credit needs in sectors such as agriculture and industry. There are currently five of them in Bangladesh. Non‐Bank Financial Institutions Compared with the commercial banks, the non‐bank financial institutions (NBFIs) have a rather limited role in the
financial system, accounting for less than 5% of financial system assets. The NBFIs are mainly engaged in the business of
financial and operational leases (about 40% of assets), term lending (about 21% of assets), working capital financing
(16% of assets), housing finance (about 14% of assets), merchant banking and venture capital financing. NBFIs also face
competition from commercial banks that have started to offer the same products, especially leasing. NBFIs, however,
appear to have managed to handle asset quality better than the commercial banks, as reflected by an NPL ratio of 8.2% at
end‐June 2008 compared to 13% for banks . That said, it should be noted that this ratio could be understated due to the
relatively lax asset quality regulations for NBFIs compared with banks. Currently, there are 29 NBFIs, of which 13 are
joint ventures with foreign participation. The NBFIs are licensed and regulated under the Financial Institution Act, 1993,
by Bangladesh Bank.
Performance & Profitability The banks in Bangladesh have enjoyed high interest spreads for the last few years, although the Bangladesh Bank (BB) is now emphasizing on reducing the spread by lowering both the deposit and the lending rates Regulatory environment Banks and non‐bank financial institutions are regulated by Bangladesh Bank (BB) - the country’s central bank. BB has been working as the central bank since the country's independence. Its functions include issuing of currency, maintaining foreign exchange reserve and providing transaction facilities of all public monetary matters. BB is also responsible for planning the government's monetary policy and implementing it thereby. The Bank Company Act of 1991 empowers the central bank to issue licenses to carry out banking business in Bangladesh. Bangladesh Bank monitors the performance of the banking sector using the CAMELS framework (CAMELS: capital adequacy, asset quality, management soundness, earnings, liquidity and sensitivity to market risk). Banks are subject to periodic comprehensive inspections and ad‐hoc special inspections.

Top five first generation banksTop five first generation banks A comparative analysisA comparative analysis
History of Banking sector of Bangladesh The banking system at independence from Pakistan in 1971 consisted of two branch offices of the former State Bank of Pakistan and seventeen commercial banks, two of which were controlled by Bangladeshi interests and three by foreigners other than West Pakistanis. There were fourteen smaller commercial banks. Virtually all banking services were concentrated in urban areas. The newly independent government immediately designated the Dhaka branch of the State Bank of Pakistan as the central bank and renamed it the Bangladesh Bank. The Bangladesh government initially nationalized the entire domestic banking system and proceeded to reorganize and rename the various banks. This action was aimed at mobilizing funds in a war-ravaged country in the midst of severe lack in experienced banking staff. Foreign-owned banks were permitted to continue doing business in Bangladesh. The insurance business was also nationalized and became a source of investment funds. Cooperative credit systems and postal savings offices handled service to small individual and rural accounts. The new banking system succeeded in establishing reasonably efficient procedures for managing credit and foreign exchange. The primary function of the credit system throughout the 1970s was to finance trade and the public sector, which together absorbed 75 percent of total advances. An early focus of the state was to engage the banking system to agriculture related activities. The government's encouragement during the late 1970s and early 1980s of agricultural development and agro-based industry brought changes in lending strategies. Managed by the Bangladesh Krishi Bank, a specialized agricultural banking institution, lending to farmers and fishermen dramatically expanded. The number of rural bank branches doubled between 1977 and 1985, to more than 3,330. While it had the most noble of objectives, such state-directed lending both in the agro and non-agro sectors agave rise to inefficiencies, chronic loan-defaults and huge non-performing loans. A major change in direction occurred in the early 1980s with the adoption of a market oriented development strategy supported by a number of liberalizing policy reforms. These reforms were undertaken along the guidelines of the World Bank and the IMF and implemented under rigid aid conditionality. For the first time the Government allowed commencing of operation by private commercial banks. In the span of three years, seven private commercial banks were given banking licenses. These banks were Pubali Bank, Uttara Bank, The City Bank, Islami Bank Bangladesh, National Bank, AB Bank and IFIC Bank. This was an eclectic mix of denationalized banks, banks established with foreign capital and banks established by local influential businessmen. Then as it is now, bank licenses were often awarded to sponsors with political connections. However, irrespective of the sponsor shareholders’ connections, the private banks turned out to be fairly professional and robust businesses. Generation of Banking sector in Bangladesh The banking sector of Bangladesh can be classified in three generations. Banks incorporated from the period of 1971-1990 can be classified as first generation banks. Second generation banks were licensed in the period of 1991-2000. All banks licensed since 2000 can be classified as third generation banks. The legacy of problem bank (first generation banks) The transformation of finance priorities has brought with it problems in administration. No sound project-
appraisal system was in place to identify viable borrowers and projects. Lending institutions did not have
adequate autonomy to choose borrowers and projects and were often instructed by the political authorities.
In addition, the incentive system for the banks stressed disbursements rather than recoveries, and the
accounting and debt collection systems were inadequate to deal with the problems of loan recovery. It
became more common for borrowers to default on loans than to repay them; the lending system was simply
disbursing grant assistance to private individuals who qualified for loans more for political than for
economic reasons. The rate of recovery on agricultural loans was only 27 percent in FY 1986, and the rate
on industrial loans was even worse. As a result of this poor showing, major donors applied pressure to
induce the government and banks to take firmer action to strengthen internal bank management and credit
discipline. As a consequence, recovery rates began to improve in 1987. The National Commission on Money,
Credit, and Banking recommended broad structural changes in Bangladesh's system of financial
intermediation early in 1987, many of which were built into a three-year compensatory financing facility
signed by Bangladesh with the IMF in February 1987.
Top five first generation banksTop five first generation banks A comparative analysisA comparative analysis
Analysis of top five first generation banks
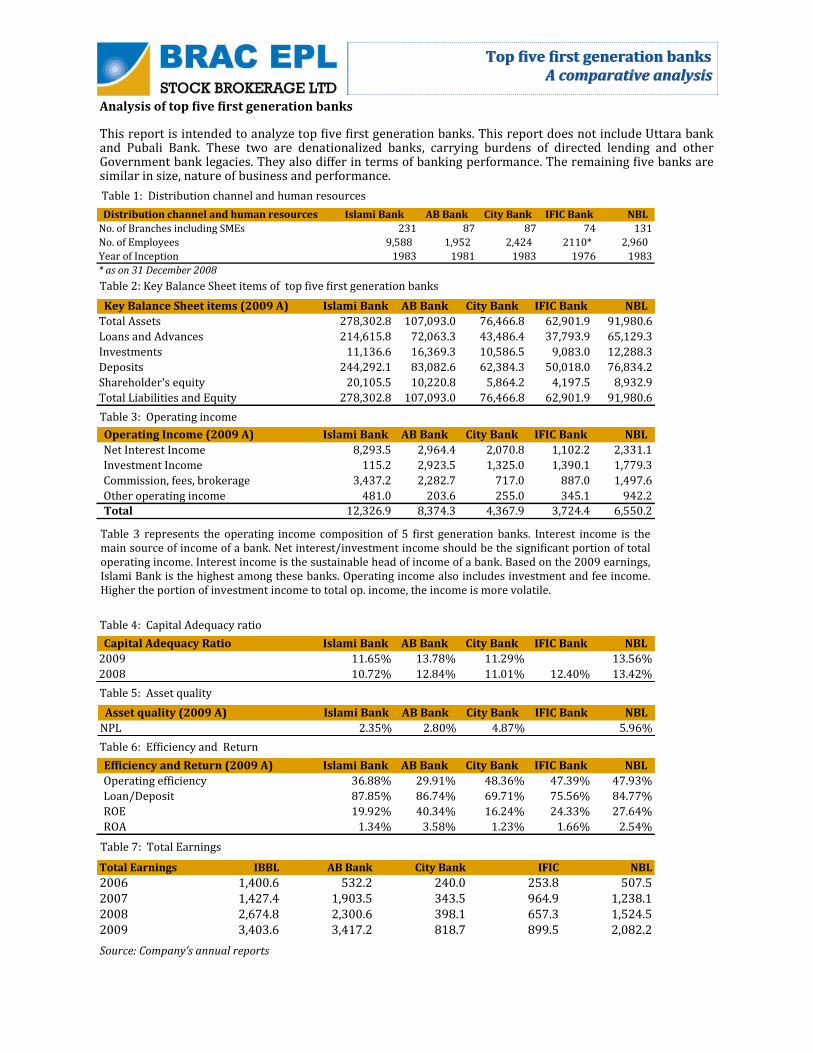
This report is intended to analyze top five first generation banks. This report does not include Uttara bank and Pubali Bank. These two are denationalized banks, carrying burdens of directed lending and other Government bank legacies. They also differ in terms of banking performance. The remaining five banks are similar in size, nature of business and performance.
Table 2: Key Balance Sheet items of top five first generation banks
Key Balance Sheet items (2009 A) Islami Bank AB Bank City Bank IFIC Bank NBL
Total Assets 278,302.8 107,093.0 76,466.8 62,901.9 91,980.6
Loans and Advances 214,615.8 72,063.3 43,486.4 37,793.9 65,129.3
Investments 11,136.6 16,369.3 10,586.5 9,083.0 12,288.3
Deposits 244,292.1 83,082.6 62,384.3 50,018.0 76,834.2
Shareholder's equity 20,105.5 10,220.8 5,864.2 4,197.5 8,932.9
Total Liabilities and Equity 278,302.8 107,093.0 76,466.8 62,901.9 91,980.6
Table 3: Operating income
Operating Income (2009 A) Islami Bank AB Bank City Bank IFIC Bank NBL
Net Interest Income 8,293.5 2,964.4 2,070.8 1,102.2 2,331.1
Investment Income 115.2 2,923.5 1,325.0 1,390.1 1,779.3
Commission, fees, brokerage 3,437.2 2,282.7 717.0 887.0 1,497.6
Other operating income 481.0 203.6 255.0 345.1 942.2
Total 12,326.9 8,374.3 4,367.9 3,724.4 6,550.2
Capital Adequacy Ratio Islami Bank AB Bank City Bank IFIC Bank NBL
2009 11.65% 13.78% 11.29% 13.56%
2008 10.72% 12.84% 11.01% 12.40% 13.42%
Asset quality (2009 A) Islami Bank AB Bank City Bank IFIC Bank NBL
NPL 2.35% 2.80% 4.87% 5.96%
Efficiency and Return (2009 A) Islami Bank AB Bank City Bank IFIC Bank NBL
Operating efficiency 36.88% 29.91% 48.36% 47.39% 47.93%
Loan/Deposit 87.85% 86.74% 69.71% 75.56% 84.77%
ROE 19.92% 40.34% 16.24% 24.33% 27.64%
ROA 1.34% 3.58% 1.23% 1.66% 2.54%
Table 4: Capital Adequacy ratio
Table 5: Asset quality
Table 6: Efficiency and Return
Source: Company’s annual reports
Table 7: Total Earnings
Total Earnings IBBL AB Bank City Bank IFIC NBL
2006 1,400.6 532.2 240.0 253.8 507.52007 1,427.4 1,903.5 343.5 964.9 1,238.12008 2,674.8 2,300.6 398.1 657.3 1,524.52009 3,403.6 3,417.2 818.7 899.5 2,082.2
Table 1: Distribution channel and human resources
Distribution channel and human resources Islami Bank AB Bank City Bank IFIC Bank NBL
No. of Branches including SMEs 231 87 87 74 131
No. of Employees 9,588 1,952 2,424 2110* 2,960
Year of Inception 1983 1981 1983 1976 1983
* as on 31 December 2008
Table 3 represents the operating income composition of 5 first generation banks. Interest income is the main source of income of a bank. Net interest/investment income should be the significant portion of total operating income. Interest income is the sustainable head of income of a bank. Based on the 2009 earnings, Islami Bank is the highest among these banks. Operating income also includes investment and fee income. Higher the portion of investment income to total op. income, the income is more volatile.

Top five first generation banksTop five first generation banks A comparative analysisA comparative analysis
Table 10: Key balance sheet items; AB Bank Limited
Table 9: Key balance sheet items; Islami Bank Bangladesh Limited (IBBL)
Particulars, MM BDT *1983 2003 2004 2005 2006 2007 2008 2009
Loans & Advances 0 59007.5 75858.6 93644.2 113575.1 144920.6 180053.9 214615.8
Total Assets 0 81704.7 102149.3 122880.3 150252.8 191362.3 230879.1 278302.8
Deposits 0 69941.8 87841.0 107779.4 132419.4 166325.3 200343.4 244292.1
Total Equity 0 5200.4 6633.9 8215.7 10007.2 11219.6 14060.5 20105.5
*Year of inception, assumed base year
1981* 2003 2004 2005 2006 2007 2008 2009Loans & Advances 0 20,435.2 17,008.5 21,384.6 31,289.3 40,915.4 56,708.8 72,063.3
Total Assets 0 32,969.5 32,513.5 33,065.4 47,989.3 63,549.9 84,053.6 107,093.0
Deposits 0 27,260.2 28,299.2 27,361.4 42,077.0 53,375.3 68,560.5 83,082.6
Total Equity 0 1,136.0 1,243.6 1,526.9 2,582.8 4,511.6 6,722.5 10,220.8
* Year of inception, assumed base year
Table 11: Key balance sheet items; The City Bank Limited
Particulars *1983 2003 2004 2005 2006 2007 2008 2009
Loans & Advances 0 14778.5 17027.8 23326.3 30789.0 26788.5 34420.9 43486.4
Total Assets 0 23698.6 26375.6 35303.7 47445.8 48755.4 57114.6 76466.8
Deposits 0 20046.3 22237.0 30647.8 39571.9 40539.6 45034.3 62384.3
Total Equity 0 797.2 1417.5 1958.4 2530.9 2874.4 4217.5 5864.2
*Year of inception, assumed base year
Table 12: Key balance sheet items; IFIC Bank Limited
Particulars 1976* 2003 2004 2005 2006 2007 2008 2009
Loans & Advances 0 20450.9 21280.9 21694.9 25490.7 28361.5 33018.4 37793.9
Total Assets 0 27101.3 28575.8 30201.1 36080.5 39914.1 45729.5 62901.9
Deposits 0 19799.0 20774.5 22505.2 28620.9 29900.1 36092.2 50018.0
Total Equity 0 1143.6 1215.5 1361.1 1635.1 2613.8 3196.7 4197.5
*Year of inception, assumed base year
Table 13: Key balance sheet items; National Bank Limited
1983 2003 2004 2005 2006 2007 2008 2009
Loans & Advances 0 22257.2 23129.6 27020.2 32709.7 36475.7 49665.1 65129.3
Total Assets 0 36253.8 35127.3 38400.4 46796.0 56530.9 72227.3 91980.6
Deposits 0 27762.1 28973.4 32984.1 40350.9 47961.2 60187.9 76834.2
Total Equity 0 1700.9 1862.3 2734.6 3274.3 4566.4 6131.3 8932.9
Source: Company annual reports and BRAC EPL research
Growth indicators (2009 A) Islami Bank AB Bank City Bank IFIC Bank NBL
Growth in Interest Income 9.35% 23.68% 22.99% 10.15% 17.86%
Growth in Interest Expenses 7.52% 15.20% 16.10% 18.03% 24.91%
Growth in Assets 20.54% 27.41% 33.88% 37.55% 27.35%
Growth in Loans and advances 19.20% 27.08% 26.34% 14.46% 31.14%
Growth in Investments 47.85% 43.48% 17.21% 73.67% 21.16%
Growth in Deposits 21.94% 21.18% 38.53% 38.58% 27.66%
Earnings growth 27.25% 48.53% 105.65% 36.85% 36.58%
Table 8: Growth indicators
1983 was the year of inception

Top five first generation banksTop five first generation banks A comparative analysisA comparative analysis
Graph 2: Trend of key balance sheet items since inception of AB Bank Limited
Graph 1: Trend of key balance sheet items since inception of Islami Bank
0
50000
100000
150000
200000
250000
300000
*1983 2003 2004 2005 2006 2007 2008 2009
Loans & Advances Total Assets Deposits Total Equity
0
20000
40000
60000
80000
100000
120000
1981* 2003 2004 2005 2006 2007 2008 2009
Loans & Advances Total Assets Deposits Total Equity
Graph 3: Trend of key balance sheet items since incep‐tion; The City Bank Limited
0
10000
20000
30000
40000
50000
60000
70000
80000
90000
*1983 2003 2004 2005 2006 2007 2008 2009
Loans & Advances Total Assets Deposits Total Equity
Graph 4: Trend of key balance sheet items since incep‐tion; IFIC Bank Limited
0
10000
20000
30000
40000
50000
60000
70000
1976* 2003 2004 2005 2006 2007 2008 2009
Loan & Advance Total Assets Deposits Total Equity
Graph 5: Trend of key balance sheet items since inception of National Bank Limited
0
10000
20000
30000
40000
50000
60000
70000
80000
90000
100000
1983 2003 2004 2005 2006 2007 2008 2009
Loans & Advances Total Assets Deposits Total Equity
Source: Company annual reports and BRAC EPL research
These 5 banks total assets, loans and advances and deposits are showing an upward trend over the years. We are expecting this trend in coming years with the large distribution network and diversified product. Since inception the bank‘s total assets, loans and advances and other key balance sheet items are increasing except for the City Bank and AB Bank. Growth rates for AB Bank were flat for the years 2003-2005.
Top five first generation banksTop five first generation banks A comparative analysisA comparative analysis
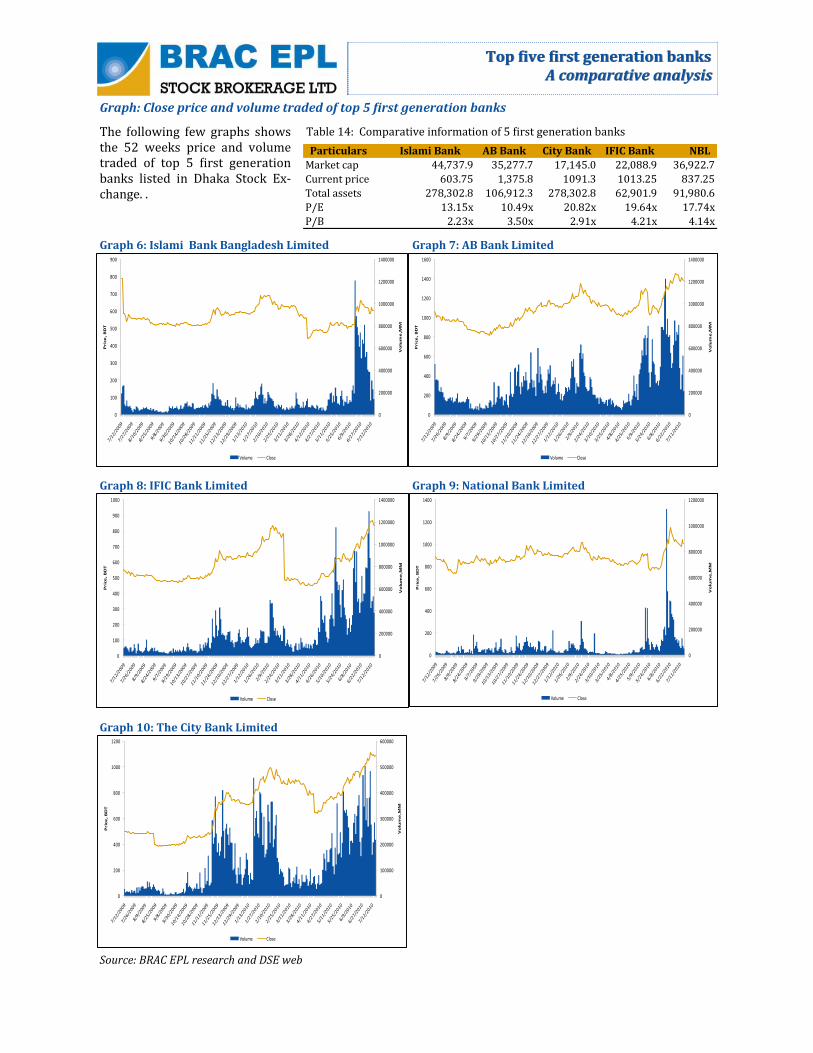
Graph: Close price and volume traded of top 5 first generation banks
The following few graphs shows the 52 weeks price and volume traded of top 5 first generation banks listed in Dhaka Stock Ex‐change. .
Table 14: Comparative information of 5 first generation banks
Graph 6: Islami Bank Bangladesh Limited Graph 7: AB Bank Limited
Graph 8: IFIC Bank Limited Graph 9: National Bank Limited
Graph 10: The City Bank Limited
Source: BRAC EPL research and DSE web
0
200000
400000
600000
800000
1000000
1200000
1400000
0
100
200
300
400
500
600
700
800
900
Vo
lum
e,M
M
Pric
e,
BD
T
Volume Close
0
200000
400000
600000
800000
1000000
1200000
1400000
0
200
400
600
800
1000
1200
1400
1600
Vo
lum
e,M
M
Pric
e,
BD
T
Volume Close
0
100000
200000
300000
400000
500000
600000
0
200
400
600
800
1000
1200
Vo
lum
e,M
M
Pric
e,
BD
T
Volume Close
0
200000
400000
600000
800000
1000000
1200000
0
200
400
600
800
1000
1200
1400
Vo
lum
e,M
M
Pric
e,
BD
T
Volume Close
0
200000
400000
600000
800000
1000000
1200000
1400000
0
100
200
300
400
500
600
700
800
900
1000
Vo
lum
e,M
M
Pric
e,
BD
T
Volume Close
Particulars Islami Bank AB Bank City Bank IFIC Bank NBL
Market cap 44,737.9 35,277.7 17,145.0 22,088.9 36,922.7
Current price 603.75 1,375.8 1091.3 1013.25 837.25
Total assets 278,302.8 106,912.3 278,302.8 62,901.9 91,980.6
P/E 13.15x 10.49x 20.82x 19.64x 17.74x
P/B 2.23x 3.50x 2.91x 4.21x 4.14x
Top five first generation banksTop five first generation banks A comparative analysisA comparative analysis
Domestic banks Price EPS P/E BVPS P/B
Islami Bank 603.75 45.9 13.15x 271.2 2.23x Prime Bank 610.50 61.1 9.99x 255.3 2.39x
Pubali Bank 828.00 54.7 15.13x 248.8 3.33x National Bank 837.25 47.2 17.74x 202.5 4.14x
IFIC 1013.25 51.6 19.64x 240.7 4.21x
Southeast Bank 403.25 40.5 9.96x 245.2 1.64x NCC Bank 453.25 38.2 11.87x 134.1 3.38x
Eastern Bank 655.00 49.8 13.15x 288.6 2.27x BRAC Bank 811.75 51.3 15.82x 329.9 2.46x
Dutch-Bangla Bank 1499.50 56.9 26.36x 217.6 6.89x CITYBANK 1084.75 52.1 20.82x 373.2 2.91x
The Premier Bank 53.90 37.3 1.44x 159.1 0.34x
Average 14.59x 3.02x
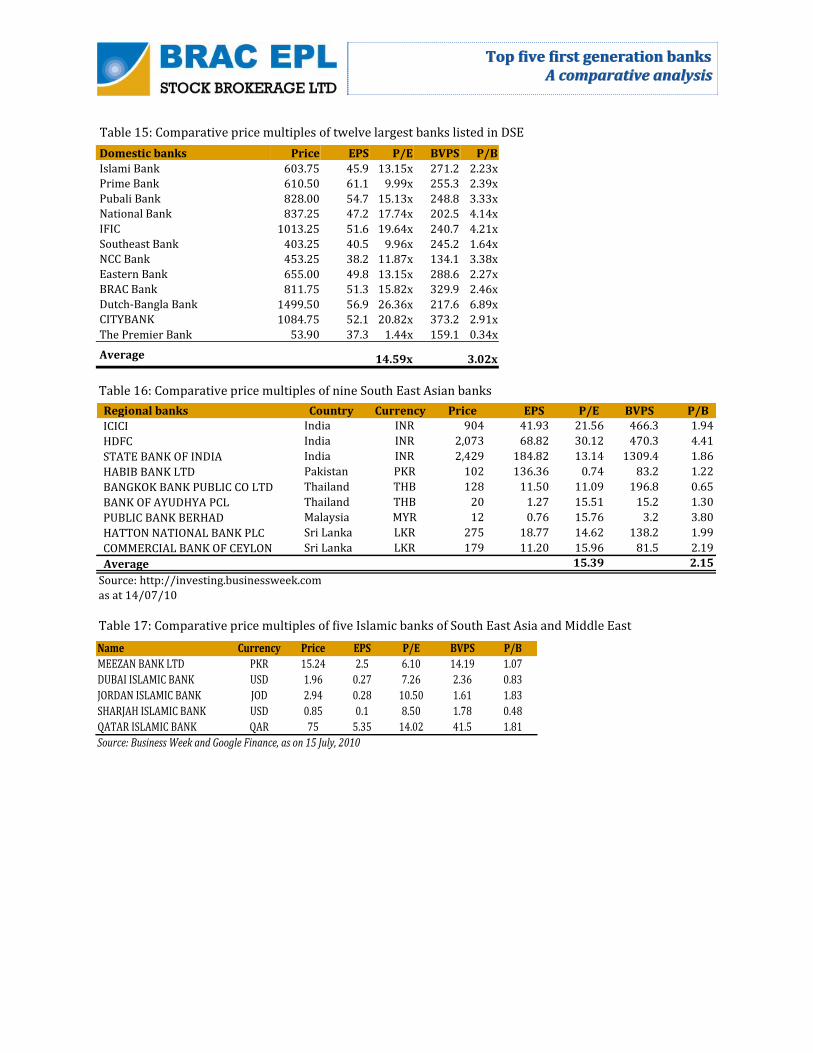
Table 15: Comparative price multiples of twelve largest banks listed in DSE
Table 16: Comparative price multiples of nine South East Asian banks
Regional banks Country Currency Price EPS P/E BVPS P/B
ICICI India INR 904 41.93 21.56 466.3 1.94
HDFC India INR 2,073 68.82 30.12 470.3 4.41
STATE BANK OF INDIA India INR 2,429 184.82 13.14 1309.4 1.86
HABIB BANK LTD Pakistan PKR 102 136.36 0.74 83.2 1.22
BANGKOK BANK PUBLIC CO LTD Thailand THB 128 11.50 11.09 196.8 0.65
BANK OF AYUDHYA PCL Thailand THB 20 1.27 15.51 15.2 1.30
PUBLIC BANK BERHAD Malaysia MYR 12 0.76 15.76 3.2 3.80
HATTON NATIONAL BANK PLC Sri Lanka LKR 275 18.77 14.62 138.2 1.99
COMMERCIAL BANK OF CEYLON Sri Lanka LKR 179 11.20 15.96 81.5 2.19
Average 15.39 2.15
as at 14/07/10
Source: http://investing.businessweek.com
Table 17: Comparative price multiples of five Islamic banks of South East Asia and Middle East
Name Currency Price EPS P/E BVPS P/B
MEEZAN BANK LTD PKR 15.24 2.5 6.10 14.19 1.07
DUBAI ISLAMIC BANK USD 1.96 0.27 7.26 2.36 0.83
JORDAN ISLAMIC BANK JOD 2.94 0.28 10.50 1.61 1.83
SHARJAH ISLAMIC BANK USD 0.85 0.1 8.50 1.78 0.48
QATAR ISLAMIC BANK QAR 75 5.35 14.02 41.5 1.81
Source: Business Week and Google Finance, as on 15 July, 2010

Top five first generation banksTop five first generation banks A comparative analysisA comparative analysis
1. Islami Bank Bangladesh Limited (DSE ticker: ISLAMIANK) Rating: Outperform
Operating Income BDT MM 2009 2010 E 2011 E
Net Interest Income 8,293.5 10,807.6 12,673.1
Investment Income 115.2 245.0 294.0
Commission, fees, brokerage 3,437.2 4,124.6 4,949.6
Other operating income 481.0 529.1 582.0
Total 12,326.9 15,706.3 18,498.6Profitablility 2009 2010 E 2011 E
Interest Income/Total Income (%) 84.12% 84.65% 84.64%
Non Interest Income/Total Income (%) 15.88% 15.35% 15.36%
Reported Net Profit/Total Income (%) 13.40% 15.11% 14.87%
Net Interest Income/Total Income (%) 32.65% 33.86% 33.41%
Net Interest Margin (%) 4.71% 4.99% 4.99%
Efiiciency & return 2009 2010 E 2011 E
Operating efficiency 36.88% 30.48% 30.76%
Loan/Deposit 87.85% 87.12% 86.39%
ROE 19.92% 21.71% 21.17%
ROA 1.34% 1.58% 1.54%
Growth 2009 2010 E 2011 E
Growth in Interest Income 9.35% 26.44% 18.84%
Growth in Interest Expenses 7.52% 23.98% 19.89%
Growth in Assets 20.54% 19.66% 19.60%
Growth in Loans and advances 19.20% 19.00% 19.00%
Growth in Investments 47.85% 20.00% 20.00%
Growth in Deposits 21.94% 20.00% 20.00%
Earnings growth 27.25% 41.68% 17.01%Per Share 2009 2010 E 2011 E
EPS 45.91 65.05 76.11
BVPS 271.22 327.93 391.03
CFPS 505.67 658.81 845.18
Cash dividend per share 10.00 13.01 15.22Capital Adequacy Ratio 2007 2008 2009
Tier 1 9,219.0 11,272.1 14,675.7
Tier 2 6,546.9 7,300.0 8,944.1
Total Capital 15,765.9 18,572.1 23,619.8
Total assets incl off balance sheet items 250,634.5 288,017.2 340,638.5
Total risk weighted assets 140,971.6 173,289.4 202,756.6
Required ratio 10% 10% 10%
Required capital 14,097.2 17,328.9 20,275.7
Surplus 1,668.8 1,243.1 3,344.2
CAR 11.18% 10.72% 11.65%Asset Quality, MM 2007 2008 2009
NPLs to total loans and advances 2.93% 2.39% 2.35%
Provision for classified loans 1,703.1 1,883.4 2,490.0
Islami Bank Bangladesh Limited (IBBL) started operations in 1983. At that time there was a demand for Shariah-compliant banking in the country and no other bank was available to provide this services. IBBL was the first of its kind in Southeast Asia. It is committed to conducting its banking and investment activities on the basis of interest-free profit-loss sharing system. Because of its first-mover advantage in the market, rela‐tionship with global Islamic banking institution and the backing of one the largest Islamic social/political group in the country, it enjoys a near-monopoly in Islamic banking. It has a large following among clients that do not want to participate in interest-based lending. Consequently, it has a large and loyal client-base that does not move with small changes in deposit or lending rates. Currently IBBL is the largest private sector bank in the country. IBBL achieved impressive growth in loan portfolio, total assets and fee income while maintaining capital adequacy, asset quality, sound management and profitability. IBBL has diversified its business over the past years and offered different types of commercial banking, retail, treasury and capital market services. IBBL has achieved five-year Cumulative Annual Growth Rate (CAGR) of 25.00% in loans & advances. The bank achieved average ROE and ROA of 16.46% and 1.05% re‐spectively in the last five years. Although there are banks that achieved higher growth and profitability, none has the large franchise, loyal client base or financing flexibility that IBBL has. Also, the bank has a lower risk profile than its peers. In the last five years, assets, loans and advances, and de‐posits grew on average by 23.09%, 24.00% and 23.43% respectively. IBBL’s total assets stood at BDT 278.3 billion at year ended 31 December 2009. Asset growth was sub‐dued in 2009 because of change in the political climate and lack of confidence due to the global economic crisis. We are expecting 1% growth in loans and advances in 2010. IBBL’s investment portfolio consists more than 90% in government securities but it has also investment in capital markets through its merchant banking operation.
IBBL had a NPL ratio of 2.35% at the end of 2009 which is
impressive comparative to industry average NPL ratio of
13%. NPL ratio has been decreasing over the years because
of management efficiency in managing non-performing
investments (loans).
Non funded income arises mainly from commission, ex‐
change, brokerage and other operating income. IBBL has
competitive advantages over other banks in Bangladesh
because of their largest distribution network. It has also
competitive advantages over other banks due to their trade
and foreign remittance related business. Currently IBBL is
handling 25% of total remittance of the country.
Company Summary
52-week Price Range (BDT) 430 - 793
Current Price 603.75
12-month Target Price 800
Cash Dividend 13.01
Total Return 35%
Number of Shares MM 74.1
Market Cap BDT MM 44,756.7
Float (% of shares) 61%
Source: DSE web, as on 15 July, 2010
Top five first generation banksTop five first generation banks A comparative analysisA comparative analysis
Income Statement, MM BDT 2007 2008 2009 2010 E 2011 E 2012 E
Interest/Investment Income 14,572.2 19,543.8 21,370.5 27,020.8 32,111.0 38,168.4
Interest/profit paid on deposit and borrowing etc 9,410.6 12,162.1 13,077.0 16,213.3 19,437.9 23,307.5
Net Interest Income 5,161.6 7,381.7 8,293.5 10,807.6 12,673.1 14,860.8
Income from investments in securities/Shares 284.0 408.8 115.2 245.0 294.0 352.8
Commission, Exchange & Brokerage 2,579.0 3,337.5 3,437.2 4,124.6 4,949.6 5,939.5
Other Income 264.3 940.2 481.0 529.1 582.0 640.2
Total Operating Income 8,288.9 12,068.2 12,326.9 15,706.3 18,498.6 21,793.3
Operating Expense 3,126.6 4,115.8 4,546.0 4,787.9 5,690.5 6,765.1
Profit Before Provision 5,162.4 7,952.4 7,780.9 10,918.3 12,808.2 15,028.2
Provision 1,381.5 1,604.6 1,263.2 1,645.0 1,957.6 2,329.5
Pre-Tax Profit 3,780.8 6,347.8 6,517.7 9,273.3 10,850.6 12,698.6
Tax 2,353.5 3,673.0 3,114.1 4,451.2 5,208.3 6,095.3
Profit After Tax 1,427.4 2,674.8 3,403.6 4,822.1 5,642.3 6,603.3
Balance Sheet, MM BDT 2007 2008 2009 2010 E 2011 E 2012 E
Property & Assets:
Cash 17,076.5 31,330.3 37,485.7 48,838.4 62,653.9 79,571.0
Balance with Other Banks & F.I 4,012.3 5,623.2 7,678.4 7,678.4 7,678.4 7,678.4
Money at call .0 .0 .0 .0 .0 .0
Investment 20,365.7 7,532.6 11,136.6 13,363.9 16,036.7 19,244.1
Loan & Advance 144,920.6 180,053.9 214,615.8 255,392.8 303,917.4 361,661.7
Fixed Assets 3,987.2 4,407.2 6,512.4 6,775.7 6,932.2 7,118.2
Other Assets 1,000.0 1,931.9 874.0 961.4 1,057.6 1,163.3
Total Assets 191,362.3 230,879.1 278,302.8 333,010.7 398,276.2 476,436.7
Liabilities & Equities:
Liabilities:
Mudaraba Perpetual Bond 3,000.0 3,000.0 3,000.0 3,000.0 3,000.0 3,000.0
Deposits 166,325.3 200,343.4 244,292.1 293,150.6 351,780.7 422,136.8
Other Liability 10,817.4 13,475.2 10,905.2 12,550.2 14,507.8 16,837.3
Total Liabilities 180,142.7 216,818.6 258,197.3 308,700.8 369,288.5 441,974.1
Shareholder's Equity:
Paid-up 3,801.6 4,752.0 6,177.6 7,413.1 7,413.1 7,413.1
Statutory reserve 3,670.9 4,940.5 6,244.0 6,244.0 6,244.0 6,244.0
Other Reserve 2,796.7 2,942.4 5,830.6 5,830.6 5,830.6 5,830.6
Retained Earning 950.4 1,425.6 1,853.3 4,822.1 9,500.0 14,974.8
Total Equity 11,219.6 14,060.5 20,105.5 24,309.9 28,987.8 34,462.6
Total Liabilities & Equities 191,362.3 230,879.1 278,302.8 333,010.7 398,276.2 476,436.7
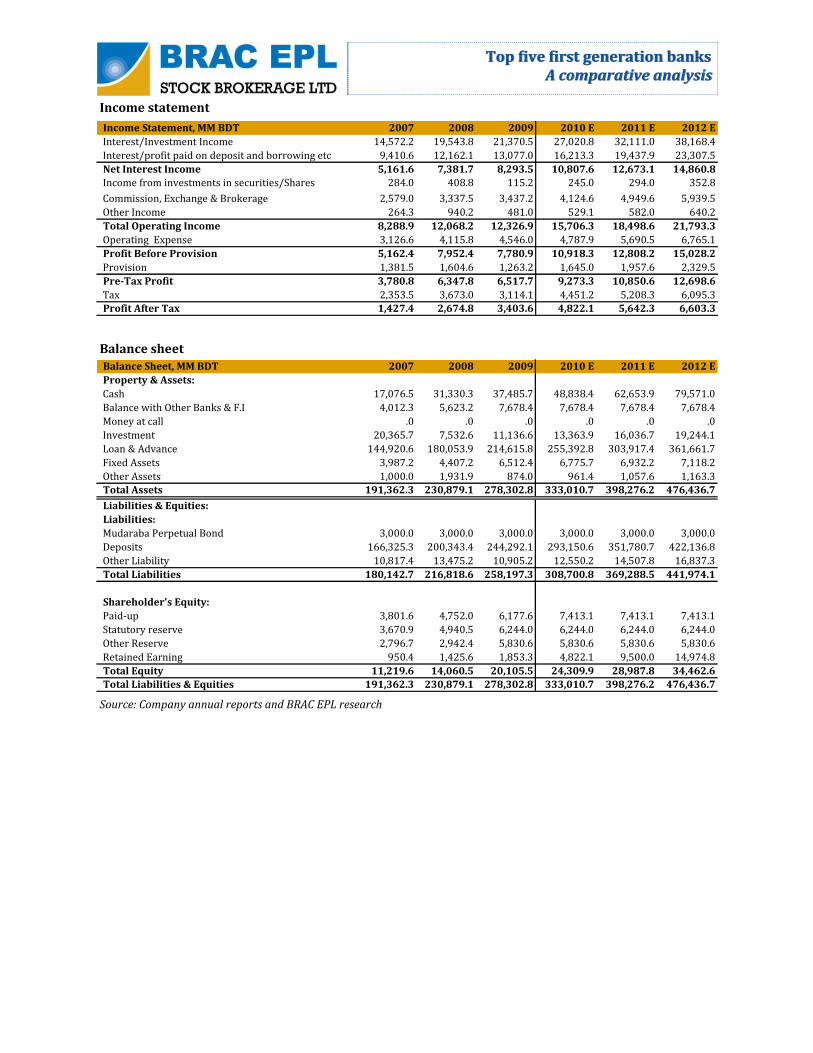
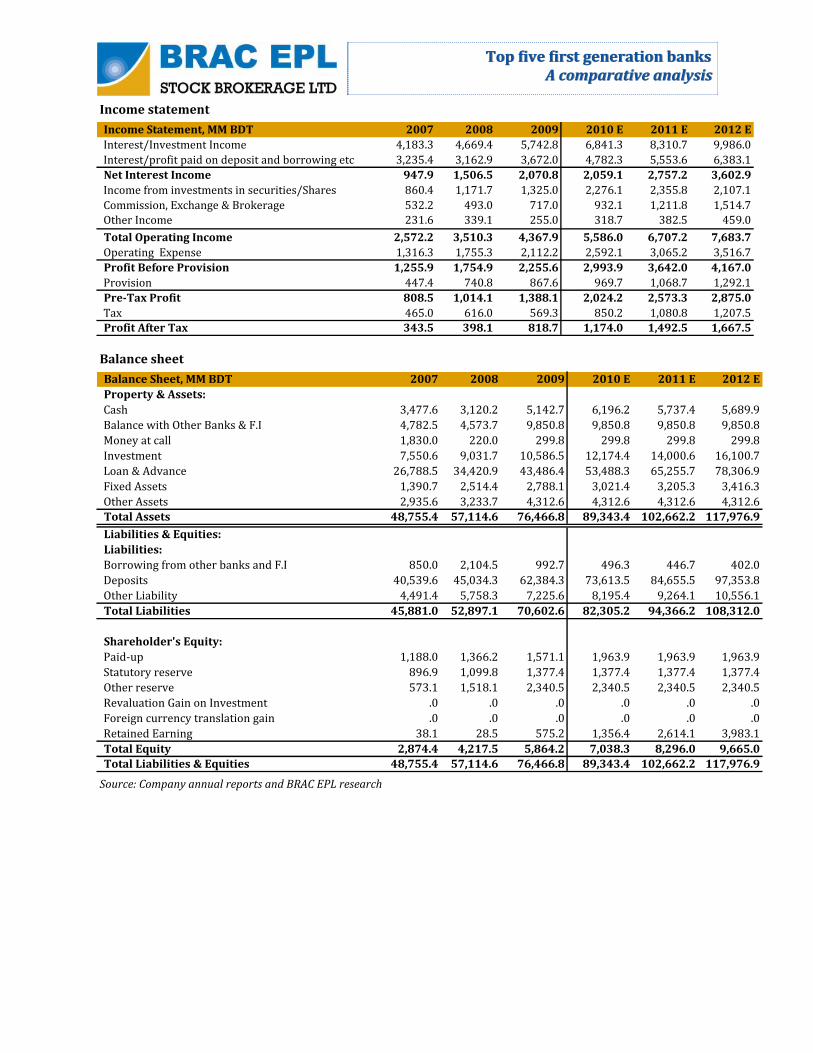
Income statement
Balance sheet
Source: Company annual reports and BRAC EPL research
Top five first generation banksTop five first generation banks A comparative analysisA comparative analysis
Cashflow statement 2007 2008 2009 2010 E 2011 E 2012 E
Operating cash
Net income 4,822.1 5,642.3 6,603.3
Non-cash items 1,908.4 2,270.6 2,701.6
Operating cashflow 3,323.5 6,596.2 4,952.6 6,730.5 7,912.9 9,304.9Increase/decrease in operating assets and liabilities
Investments (2,227.3) (2,672.8) (3,207.3)Loans and advances (40,777.0) (48,524.6) (57,744.3)Deposits and other accounts 48,858.4 58,630.1 70,356.1Operating cashflow 7,371.4 (3,101.1) 6,581.4 5,766.7 7,336.6 9,298.7Investing cashflow
Investment in fixed and intangible assets (526.7) (469.5) (558.1)Investing cashflow (435.8) 12,369.6 (3,323.5) (526.7) (469.5) (558.1)Financing cashflow
Increase/(reduction) in debt .0 .0 .0Dividend payment (617.8) (964.4) (1,128.5)Financing cashflow 2,481.6 .0 .0 (617.8) (964.4) (1,128.5)Beginning cash balance 23,770.1 17,076.5 31,330.3 37,485.7 48,838.4 62,653.9Other Adjustments (19,434.4) (1,610.9) (2,055.2) .0 .0 .0Change in cash 12,740.7 15,864.7 8,210.5 11,352.8 13,815.5 16,917.0Ending cash balance 17,076.5 31,330.3 37,485.7 48,838.4 62,653.9 79,571.0
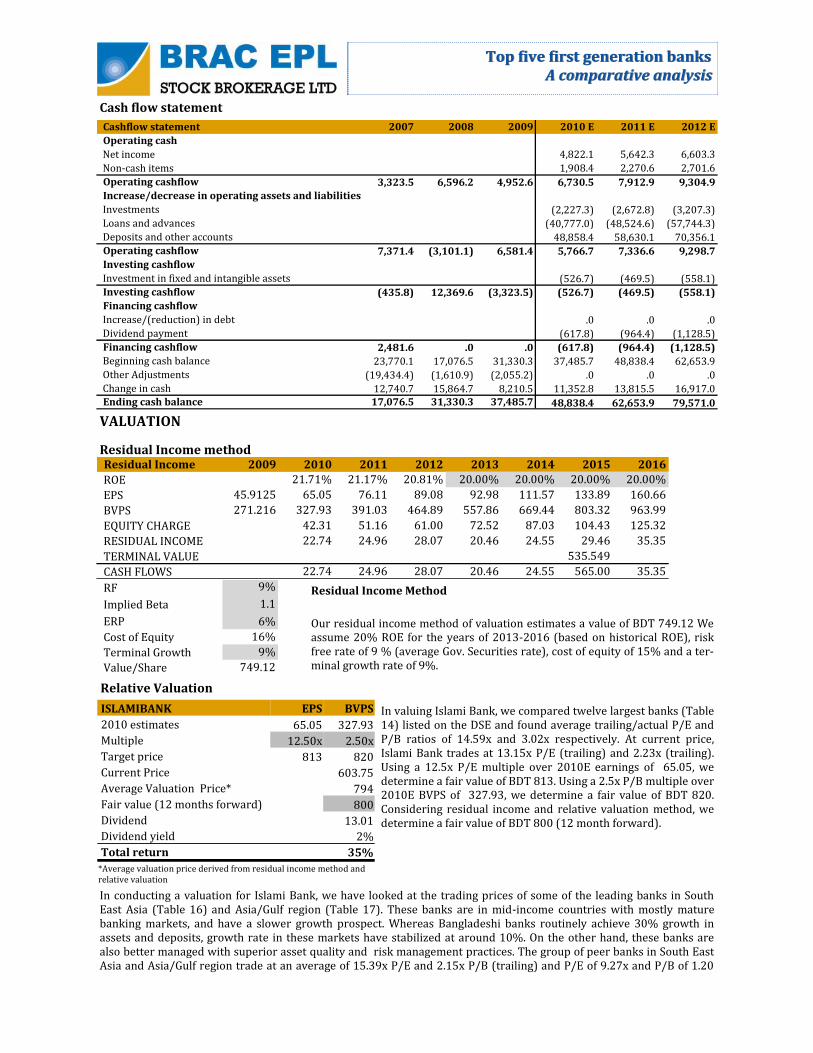
VALUATION
Residual Income method Residual Income 2009 2010 2011 2012 2013 2014 2015 2016
ROE 21.71% 21.17% 20.81% 20.00% 20.00% 20.00% 20.00%
EPS 45.9125 65.05 76.11 89.08 92.98 111.57 133.89 160.66
BVPS 271.216 327.93 391.03 464.89 557.86 669.44 803.32 963.99
EQUITY CHARGE 42.31 51.16 61.00 72.52 87.03 104.43 125.32
RESIDUAL INCOME 22.74 24.96 28.07 20.46 24.55 29.46 35.35
TERMINAL VALUE 535.549
CASH FLOWS 22.74 24.96 28.07 20.46 24.55 565.00 35.35
RF 9%
Implied Beta 1.1
ERP 6%
Cost of Equity 16%
Terminal Growth 9%
Value/Share 749.12
Residual Income Method
Our residual income method of valuation estimates a value of BDT 749.12 We assume 20% ROE for the years of 2013-2016 (based on historical ROE), risk free rate of 9 % (average Gov. Securities rate), cost of equity of 15% and a ter‐minal growth rate of 9%.
Cash flow statement
Relative Valuation
In valuing Islami Bank, we compared twelve largest banks (Table 14) listed on the DSE and found average trailing/actual P/E and P/B ratios of 14.59x and 3.02x respectively. At current price, Islami Bank trades at 13.15x P/E (trailing) and 2.23x (trailing). Using a 12.5x P/E multiple over 2010E earnings of 65.05, we determine a fair value of BDT 813. Using a 2.5x P/B multiple over 2010E BVPS of 327.93, we determine a fair value of BDT 820. Considering residual income and relative valuation method, we determine a fair value of BDT 800 (12 month forward).
In conducting a valuation for Islami Bank, we have looked at the trading prices of some of the leading banks in South East Asia (Table 16) and Asia/Gulf region (Table 17). These banks are in mid-income countries with mostly mature banking markets, and have a slower growth prospect. Whereas Bangladeshi banks routinely achieve 30% growth in assets and deposits, growth rate in these markets have stabilized at around 10%. On the other hand, these banks are also better managed with superior asset quality and risk management practices. The group of peer banks in South East Asia and Asia/Gulf region trade at an average of 15.39x P/E and 2.15x P/B (trailing) and P/E of 9.27x and P/B of 1.20
ISLAMIBANK EPS BVPS
2010 estimates 65.05 327.93
Multiple 12.50x 2.50x
Target price 813 820
Current Price 603.75
Average Valuation Price* 794
Fair value (12 months forward) 800
Dividend 13.01
Dividend yield 2%
Total return 35%
*Average valuation price derived from residual income method and relative valuation
Top five first generation banksTop five first generation banks A comparative analysisA comparative analysis
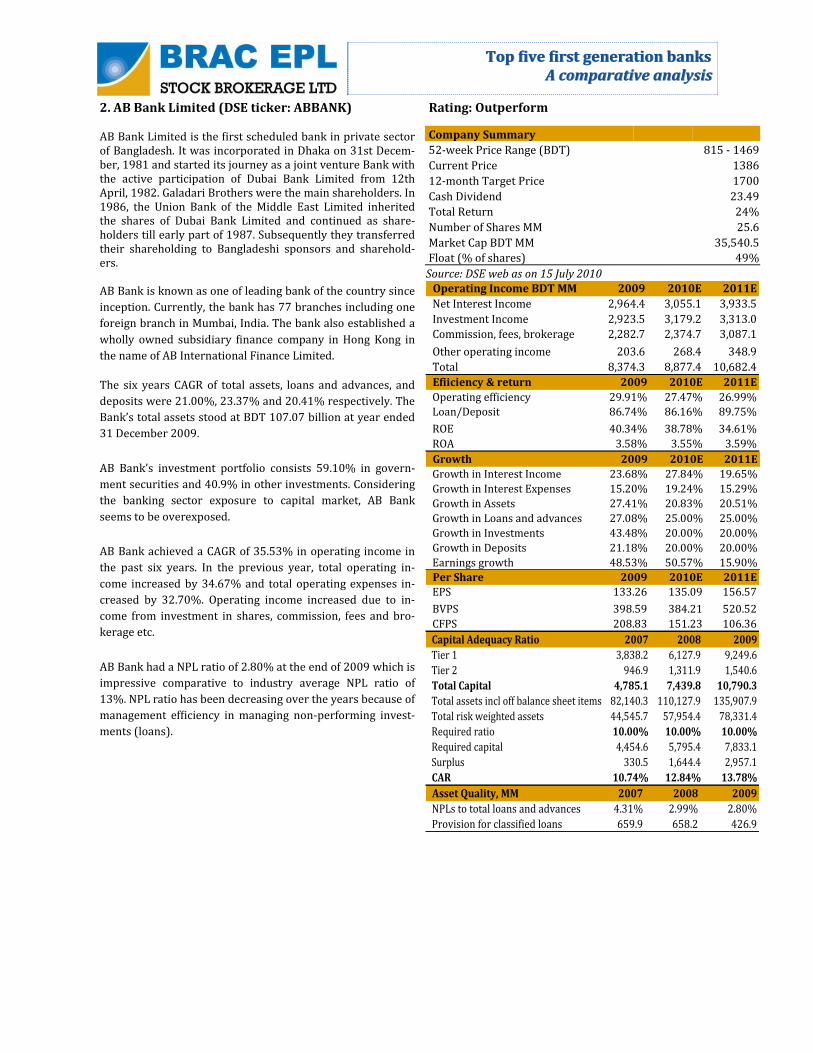
2. AB Bank Limited (DSE ticker: ABBANK)
AB Bank Limited is the first scheduled bank in private sector of Bangladesh. It was incorporated in Dhaka on 31st Decem‐ber, 1981 and started its journey as a joint venture Bank with the active participation of Dubai Bank Limited from 12th April, 1982. Galadari Brothers were the main shareholders. In 1986, the Union Bank of the Middle East Limited inherited the shares of Dubai Bank Limited and continued as share‐holders till early part of 1987. Subsequently they transferred their shareholding to Bangladeshi sponsors and sharehold‐ers. AB Bank is known as one of leading bank of the country since
inception. Currently, the bank has 77 branches including one
foreign branch in Mumbai, India. The bank also established a
wholly owned subsidiary finance company in Hong Kong in
the name of AB International Finance Limited.
The six years CAGR of total assets, loans and advances, and
deposits were 21.00%, 23.37% and 20.41% respectively. The
Bank’s total assets stood at BDT 107.07 billion at year ended
31 December 2009.
AB Bank’s investment portfolio consists 59.10% in govern‐
ment securities and 40.9% in other investments. Considering
the banking sector exposure to capital market, AB Bank
seems to be overexposed.
AB Bank achieved a CAGR of 35.53% in operating income in
the past six years. In the previous year, total operating in‐
come increased by 34.67% and total operating expenses in‐
creased by 32.70%. Operating income increased due to in‐
come from investment in shares, commission, fees and bro‐
kerage etc.
AB Bank had a NPL ratio of 2.80% at the end of 2009 which is
impressive comparative to industry average NPL ratio of
13%. NPL ratio has been decreasing over the years because of
management efficiency in managing non-performing invest‐
ments (loans).
Rating: Outperform
Operating Income BDT MM 2009 2010E 2011E
Net Interest Income 2,964.4 3,055.1 3,933.5
Investment Income 2,923.5 3,179.2 3,313.0
Commission, fees, brokerage 2,282.7 2,374.7 3,087.1
Other operating income 203.6 268.4 348.9
Total 8,374.3 8,877.4 10,682.4
Growth 2009 2010E 2011E
Growth in Interest Income 23.68% 27.84% 19.65%
Growth in Interest Expenses 15.20% 19.24% 15.29%
Growth in Assets 27.41% 20.83% 20.51%
Growth in Loans and advances 27.08% 25.00% 25.00%
Growth in Investments 43.48% 20.00% 20.00%
Growth in Deposits 21.18% 20.00% 20.00%
Earnings growth 48.53% 50.57% 15.90%
Per Share 2009 2010E 2011E
EPS 133.26 135.09 156.57
BVPS 398.59 384.21 520.52
CFPS 208.83 151.23 106.36
Efiiciency & return 2009 2010E 2011E
Operating efficiency 29.91% 27.47% 26.99%
Loan/Deposit 86.74% 86.16% 89.75%
ROE 40.34% 38.78% 34.61%
ROA 3.58% 3.55% 3.59%
Capital Adequacy Ratio 2007 2008 2009
Tier 1 3,838.2 6,127.9 9,249.6
Tier 2 946.9 1,311.9 1,540.6
Total Capital 4,785.1 7,439.8 10,790.3
Total assets incl off balance sheet items 82,140.3 110,127.9 135,907.9
Total risk weighted assets 44,545.7 57,954.4 78,331.4
Required ratio 10.00% 10.00% 10.00%
Required capital 4,454.6 5,795.4 7,833.1
Surplus 330.5 1,644.4 2,957.1
CAR 10.74% 12.84% 13.78%
Asset Quality, MM 2007 2008 2009
NPLs to total loans and advances 4.31% 2.99% 2.80%
Provision for classified loans 659.9 658.2 426.9
Company Summary
52-week Price Range (BDT) 815 - 1469
Current Price 1386
12-month Target Price 1700
Cash Dividend 23.49
Total Return 24%
Number of Shares MM 25.6
Market Cap BDT MM 35,540.5
Float (% of shares) 49%
Source: DSE web as on 15 July 2010

Top five first generation banksTop five first generation banks A comparative analysisA comparative analysis
Income Statement, MM BDT 2007 2008 2009 2010E 2011E 2012E
Interest/Investment Income 5,269.9 7,366.8 9,111.4 9,418.1 11,269.3 14,060.4
Interest/profit paid on deposit and borrowing etc 3,830.6 5,336.2 6,147.0 6,363.0 7,335.8 8,783.8
Net Interest Income 1,439.3 2,030.7 2,964.4 3,055.1 3,933.5 5,276.6
Income from investments in securities/Shares 1,734.3 2,152.9 2,923.5 3,179.2 3,313.0 3,614.2
Commission, Exchange & Brokerage 1,305.3 1,759.0 2,282.7 2,374.7 3,087.1 4,013.2
Other Income 177.7 206.4 203.6 268.4 348.9 453.5
Total Operating Income 4,656.6 6,149.0 8,374.3 8,877.4 10,682.4 13,357.6
Operating Expense 1,331.3 1,850.6 2,504.7 2,438.5 2,882.9 3,542.6
Profit Before Provision 3,325.3 4,298.4 5,869.6 6,438.9 7,799.5 9,814.9
Provision 507.3 697.8 599.0 665.5 877.2 1,096.5
Pre-Tax Profit 2,818.0 3,600.6 5,270.6 5,773.4 6,922.3 8,718.4
Tax 914.5 1,300.0 1,853.4 2,309.4 2,907.4 3,661.7
Profit After Tax 1,903.5 2,300.6 3,417.2 3,464.0 4,014.9 5,056.7
Balance Sheet, MM BDT 2007 2008 2009 2010E 2011E 2012E
Property & Assets:
Cash 4,299.3 4,096.0 5,354.9 3,878.0 2,727.5 761.7
Balance with Other Banks & F.I 1,860.7 2,300.0 2,494.4 2,300.0 2,300.0 2,300.0
Money at call 574.1 1,190.7 600.0 1,190.7 1,190.7 1,190.7
Investment 8,884.6 11,408.5 16,369.3 13,690.2 16,428.3 19,714.0
Loan & Advance 40,915.4 56,708.8 72,063.3 70,886.0 88,607.5 110,759.3
Fixed Assets 2,381.0 2,444.7 2,441.0 2,530.0 2,630.9 2,754.9
Other Assets 4,634.8 5,904.9 7,770.2 7,085.9 8,503.1 10,203.7
Total Assets 63,549.9 84,053.6 107,093.0 101,560.8 122,387.9 147,684.3
Liabilities & Equities:
Liabilities:
Borrowing from other banks and F.I 1,872.0 3,193.3 6,136.3 3,193.3 3,193.3 3,193.3
Deposits 53,375.3 68,560.5 83,082.6 82,272.6 98,727.1 118,472.5
Other Liability 3,790.9 5,577.3 7,653.3 6,242.8 7,120.0 8,216.5
Total Liabilities 59,038.3 77,331.1 96,872.2 91,708.7 109,040.5 129,882.4
Shareholder's Equity:
Paid-up 471.4 495.0 519.8 571.7 743.3 2,229.8
Statutory reserve 503.3 556.3 650.2 772.9 1,356.9 2,066.1
Other Reserve 88.7 67.7 176.1 683.6 715.6 636.8
Retained Earning 1,695.8 1,789.8 3,639.5 4,584.9 8,080.2 12,534.7
Total Equity 4,511.6 6,722.5 10,220.8 9,852.1 13,347.4 17,801.9
Total Liabilities & Equities 63,549.9 84,053.6 107,093.0 101,560.8 122,387.9 147,684.3
Income statement
Balance sheet
Source: Company annual reports and BRAC EPL research

Top five first generation banksTop five first generation banks A comparative analysisA comparative analysis
Cashflow statement 2007 2008 2009 2010E 2011E 2012E
Operating cash
Net income 0 0 0 3,464.0 4,014.9 5,056.7
Non-cash items 0 0 0 836.2 1,079.0 1,344.5
Operating cashflow 3,284.5 2,851.0 4,715.5 4,300.3 5,094.0 6,401.2Increase/decrease in operating assets and liabilities .0 .0 .0 .0 .0 .0Investments .0 .0 .0 (2,281.7) (2,738.0) (3,285.7)Loans and advances .0 .0 .0 (14,177.2) (17,721.5) (22,151.9)Deposits and other accounts .0 .0 .0 13,712.1 16,454.5 19,745.4Operating cashflow 2,147.5 325.6 2,336.8 (3,927.8) (5,422.2) (7,392.7)Investing cashflow
Investment in fixed and intangible assets .0 .0 .0 (256.0) (302.7) (372.0)Investing cashflow (3,912.8) (2,516.1) (5,065.4) (256.0) (302.7) (372.0)Financing cashflow
Increase/(reduction) in debt .0 .0 .0 .0 .0 .0Dividend payment .0 .0 .0 (334.5) (519.6) (602.2)Financing cashflow 176.3 192.0 (308.1) (334.5) (519.6) (602.2)Beginning cash balance 3,247.1 4,299.3 4,096.0 4,096.0 3,878.0 2,727.5Other Adjustments (643.2) (1,055.7) .0 .0 .0 .0Change in cash 1,695.4 852.5 1,678.7 (218.0) (1,150.6) (1,965.8)Ending cash balance 4,299.3 4,096.0 5,354.9 3,878.0 2,727.5 761.7
VALUATION
Residual Income method
Residual Income Method
Our residual income method of valuation estimates a value of BDT 2448 We as‐sume 30% ROE for the years of 2012-2015 (based on historical ROE), risk free rate of 9 % (average Gov. Securities rate), cost of equity of 16% and a terminal growth rate of 7%.
Residual Income 2008 2009 2010 2011 2012 2013 2014 2015
ROE 42% 35% 32% 30% 30% 30% 30%
EPS 90 135 157 197 208 271 352 458
BVPS 262 384 521 694 903 1173 1525 1983
EQUITY CHARGE 42 61 83 111 144 188 244
RESIDUAL INCOME 93 95 114 97 126 164 214
TERMINAL VALUE 2373
CASH FLOWS 93 95 114 97 126 2537 214
RF 9%
Implied Beta 1.1
ERP 6%
Cost of Equity 16%
Terminal Growth 7%
Value/Share 2448
Cash flow statement
Relative Valuation
In valuing AB Bank, we compared twelve largest banks (Table 14) listed on the DSE and found average trailing/actual P/E and P/B ratios of 14.59x and 3.02x respectively. At current price, AB Bank trades at 10.40x P/E (trailing) and 3.48x P/B (trailing). Using a 12.5x P/E multiple over 2010E earnings of 135, we de‐termine a fair value of BDT 1689. Using a 2.5x P/B multiple over 2010E BVPS of 384.21, we determine a fair value of BDT 961. Considering residual income and relative valuation methods, we determine a fair value of BDT 1700 (12 month forward).
In conducting a valuation for AB Bank Bank, we have looked at the trading prices of some of the leading banks in South East Asia (Table 16). These banks are in mid-income countries with mostly mature banking markets, and have a slower growth prospect. Whereas Bangladeshi banks routinely achieve 30% growth in assets and deposits, growth rate in these markets have stabilized at around 10%. On the other hand, these banks are also better managed with superior asset quality and risk management practices. The group of peer banks in South East Asia trade at an average of 15.39x P/E and 2.15x P/B (trailing).
ABBANK EPS BVPS
2010 estimates 135.09 384.21
Multiple 12.50x 2.50x
Target price 1689 961
Current Price 1386
Average Valuation Price* 1699
Fair value (12 months forward) 1700
Dividend 23.49
Dividend yield 2%
Total return 24%
*Average valuation price derived fro residual income method and relative valuation

Top five first generation banksTop five first generation banks A comparative analysisA comparative analysis
3. The City Bank Limited (DSE ticker: CITYBANK) Rating: Under-perform
Operaing Income BDT MM 2009 2010 E 2011 E
Net Interest Income 2,070.8 2,059.1 2,757.2
Investment Income 1,325.0 2,276.1 2,355.8
Commission, fees, brokerage 717.0 932.1 1,211.8
Other operating income 255.0 318.7 382.5
Total 4,367.9 5,586.0 6,707.2
Profitablility 2009 2010 E 2011 E
Interest Income/Total Income (%) 71.43% 65.98% 67.78%
Non Interest Income/Total Income (%) 28.57% 34.02% 32.22%
Reported Net Profit/Total Income (%) 10.18% 11.32% 12.17%
Net Interest Income/Total Income (%) 25.76% 19.86% 22.49%
Net Interest Margin (%) 6.09% 5.77% 5.74%
Efiiciency & return 2009 2010 E 2011 E
Operating efficiency 48.36% 46.40% 45.70%
Loan/Deposit 69.71% 72.66% 77.08%
ROE 16.24% 18.20% 19.47%
ROA 1.23% 1.42% 1.55%Growth 2009 2010 E 2011 E
Growth in Interest Income 22.99% 19.13% 21.48%
Growth in Interest Expenses 16.10% 30.24% 16.13%
Growth in Assets 33.88% 16.84% 14.91%
Growth in Loans and advances 26.34% 23.00% 22.00%
Growth in Investments 17.21% 15.00% 15.00%
Growth in Deposits 38.53% 18.00% 15.00%
Earnings growth 105.65% 43.40% 27.13%
Per Share 2009 2010 E 2011 E
EPS 41.7 59.8 76.0
BVPS 298.6 358.4 422.4
Cash flow per share 261.9 315.5 292.1
Dividend per share - 12.0 15.2
Capital Adequacy Ratio (CAR) 2,007 2008 2009
Tier 1 2,312.7 2,710.8 3,535.1
Tier 2 84.4 1,242.7 1,624.6
Total Capital 2,397.1 3,953.5 5,159.7
Total risk weighted assets 2,503.7 35,918.9 45,714.5
Required ratio 10% 10% 10%
Required capital 250.4 3,591.9 4,571.5
Surplus 2,146.7 361.6 588.3
CAR 12.61% 11.01% 11.29%
Asset Quality 2007 2008 2009
NPLs to total loans and advances 6.24% 6.30% 4.87%
Provision for classified loans, MM 462.8 548.9 231.4
Company Summary
52-week Price Range (BDT) 380 - 1125
Current Price (as at 18 April 2010) 1084.75
12-month Target Price 820
Cash Dividend 11.96
Total Return -23%
Number of Shares MM 19.6
Market Cap BDT MM 21,303.5
Float (% of shares) 87.5%
The City Bank Limited has started its operation in 1983
under the license issued by Bangladesh Bank as one of the
first generation private sector The Bank serves its custom‐
ers at home with 83 branches spread over the country. The
Bank has expanded its services over the years, which co‐
vers wide diversified areas of trade, commerce & industry.
They have always tried to provide different products and
services to the customers through their wide and ever
growing domestic network.
City Bank’s total asset, total loans & advances and total
deposits showing an upward trend over the last seven
years. We are expecting the bank to maintain this growth
in coming years with its large distribution network. Since
inception except for the years in 2000-2005 when the bank
operated as problem bank, recently the bank has been per‐
forming well with its diversified product. During the year
2009, the bank has increased its fee income significantly by
adding some value added services like AMEX credit card
and brokerage services.
The six years CAGR of total assets, loans and advances, and
deposits were 21.56%, 19.71% and 20.83% respectively.
The Bank’s total assets stood at BDT 76.4 billion at year
ended 31 December 2009.
City Bank’s investment portfolio consists 80.00% in gov‐
ernment securities and 20.00% in other investments
The bank achieved 29.22% operating income growth in
2009. Operating income increased due to increase in net
interest income and investment income. We are expecting
handsome growth in fee income in 2010 because of their
brokerage business and some other value added services.
City Bank had a NPL ratio of 4.87 % at the end of 2009. NPL
ratios were relatively high in the years 2007 and 2008
which were 6.24% and 6.30% respectively. The industry
average NPL ratio was of 13% in 2008. NPL ratio has been
decreasing over the years because of management efficien‐
cy in managing non-performing investments (loans).
Top five first generation banksTop five first generation banks A comparative analysisA comparative analysis
Income Statement, MM BDT 2007 2008 2009 2010 E 2011 E 2012 E
Interest/Investment Income 4,183.3 4,669.4 5,742.8 6,841.3 8,310.7 9,986.0
Interest/profit paid on deposit and borrowing etc 3,235.4 3,162.9 3,672.0 4,782.3 5,553.6 6,383.1
Net Interest Income 947.9 1,506.5 2,070.8 2,059.1 2,757.2 3,602.9
Income from investments in securities/Shares 860.4 1,171.7 1,325.0 2,276.1 2,355.8 2,107.1
Commission, Exchange & Brokerage 532.2 493.0 717.0 932.1 1,211.8 1,514.7
Other Income 231.6 339.1 255.0 318.7 382.5 459.0
Total Operating Income 2,572.2 3,510.3 4,367.9 5,586.0 6,707.2 7,683.7
Operating Expense 1,316.3 1,755.3 2,112.2 2,592.1 3,065.2 3,516.7
Profit Before Provision 1,255.9 1,754.9 2,255.6 2,993.9 3,642.0 4,167.0
Provision 447.4 740.8 867.6 969.7 1,068.7 1,292.1
Pre-Tax Profit 808.5 1,014.1 1,388.1 2,024.2 2,573.3 2,875.0
Tax 465.0 616.0 569.3 850.2 1,080.8 1,207.5
Profit After Tax 343.5 398.1 818.7 1,174.0 1,492.5 1,667.5
Balance Sheet, MM BDT 2007 2008 2009 2010 E 2011 E 2012 E
Property & Assets:
Cash 3,477.6 3,120.2 5,142.7 6,196.2 5,737.4 5,689.9
Balance with Other Banks & F.I 4,782.5 4,573.7 9,850.8 9,850.8 9,850.8 9,850.8
Money at call 1,830.0 220.0 299.8 299.8 299.8 299.8
Investment 7,550.6 9,031.7 10,586.5 12,174.4 14,000.6 16,100.7
Loan & Advance 26,788.5 34,420.9 43,486.4 53,488.3 65,255.7 78,306.9
Fixed Assets 1,390.7 2,514.4 2,788.1 3,021.4 3,205.3 3,416.3
Other Assets 2,935.6 3,233.7 4,312.6 4,312.6 4,312.6 4,312.6
Total Assets 48,755.4 57,114.6 76,466.8 89,343.4 102,662.2 117,976.9
Liabilities & Equities:
Liabilities:
Borrowing from other banks and F.I 850.0 2,104.5 992.7 496.3 446.7 402.0
Deposits 40,539.6 45,034.3 62,384.3 73,613.5 84,655.5 97,353.8
Other Liability 4,491.4 5,758.3 7,225.6 8,195.4 9,264.1 10,556.1
Total Liabilities 45,881.0 52,897.1 70,602.6 82,305.2 94,366.2 108,312.0
Shareholder's Equity:
Paid-up 1,188.0 1,366.2 1,571.1 1,963.9 1,963.9 1,963.9
Statutory reserve 896.9 1,099.8 1,377.4 1,377.4 1,377.4 1,377.4
Other reserve 573.1 1,518.1 2,340.5 2,340.5 2,340.5 2,340.5
Revaluation Gain on Investment .0 .0 .0 .0 .0 .0
Foreign currency translation gain .0 .0 .0 .0 .0 .0
Retained Earning 38.1 28.5 575.2 1,356.4 2,614.1 3,983.1
Total Equity 2,874.4 4,217.5 5,864.2 7,038.3 8,296.0 9,665.0
Total Liabilities & Equities 48,755.4 57,114.6 76,466.8 89,343.4 102,662.2 117,976.9
Income statement
Balance sheet
Source: Company annual reports and BRAC EPL research

Top five first generation banksTop five first generation banks A comparative analysisA comparative analysis
Cashflow statement 2007 2008 2009 2010 E 2011 E 2012 E
Operating cash
Net income 1,174.0 1,492.5 1,667.5
Non-cash items 1,125.3 1,252.6 1,503.1
Operating cashflow 505.8 1,569.1 1,885.7 2,299.3 2,745.1 3,170.5Increase/decrease in operating assets and liabilities
Investments (1,588.0) (1,826.2) (2,100.1)Loans and advances (10,001.9) (11,767.4) (13,051.1)Deposits and other accounts 11,229.2 11,042.0 12,698.3Operating cashflow 4,822.1 (2,199.4) 6,376.4 (360.7) (2,551.6) (2,452.9)Investing cashflow
Investment in fixed and intangible assets (388.8) (367.8) (422.0)Investing cashflow (111.1) (1,365.3) (1,063.8) (388.8) (367.8) (422.0)Financing cashflow
Increase/(reduction) in debt (496.3) (49.6) (44.7)Dividend payment .0 (234.8) (298.5)Financing cashflow .0 .0 .0 (496.3) (284.4) (343.2)Beginning cash balance 2,826.4 3,477.6 3,120.2 5,142.7 6,196.2 5,737.4Other Adjustments .0 .0 .0 .0 .0 .0Change in cash 5,216.8 (1,995.6) 7,198.3 1,053.5 (458.7) (47.5)Ending cash balance 3,477.6 3,120.2 5,142.7 6,196.2 5,737.4 5,689.9
VALUATION
Residual Income method
Residual Income Method
Our residual income method of valuation estimates a value of BDT 706.25 We as‐sume 19% ROE for the years of 2012-2015 (based on historical ROE), risk free rate of 9 % (average Gov. Securities rate), cost of equity of 16% and a terminal growth rate of 9%.
Residual Income 2009 2010 2011 2012 2013 2014 2015 2016
ROE 18.2% 19.5% 18.6% 19.0% 19.0% 19.0% 19.0%
EPS 41.7 59.8 76.0 84.9 93.5 111.3 132.4 157.6
BVPS 298.6 358.4 422.4 492.1 585.6 696.9 829.3 986.9
EQUITY CHARGE 46.6 55.9 65.9 76.8 91.4 108.7 129.4
RESIDUAL INCOME 13.2 20.1 19.0 16.7 19.9 23.7 28.2
TERMINAL VALUE 427.2
CASH FLOWS 13.2 20.1 19.0 16.7 19.9 450.9 28.2
RF 9%
Implied Beta 1.1
ERP 6%
Cost of Equity 16%
Terminal Growth 9%
Value/Share 706.25
Cash flow statement
Relative Valuation
In valuing City Bank, we compared twelve largest banks (Table 14) listed on the DSE and found average trailing/actual P/E and P/B ratios of 14.59x and 3.02x respectively. At cur‐rent price, City Bank trades at 20.82x P/E (trailing) and 2.91x (trailing). Using a 12.5x P/E multiple over 2010E earnings of 59.78, we determine a fair value of BDT 897. Using a 2.5x P/B multiple over 2010E BVPS of 358.38, we determine a fair value of BDT 896. Considering residual income and relative valuation, method we determine a fair value of BDT 820 (12 month forward).
In conducting a valuation for City Bank, we have looked at the trading prices of some of the leading banks in South East Asia (Table 16). These banks are in mid-income countries with mostly mature banking markets, and have a slower growth prospect. Whereas Bangladeshi banks routinely achieve 30% growth in assets and deposits, growth rate in these markets have stabilized at around 10%. On the other hand, these banks are also better managed with superior asset quality and risk management practices. The group of peer banks in South East Asia trade at an average of 15.39x P/E and 2.15x P/B (trailing).
CITYBANK EPS BVPS
2010 estimates 59.78 358.38
Multiple 15.00x 2.50x
Fair value (12 months forward) 897 896
Current Price 1084.8
*Average Valuation Price 833
Fair value 820
Dividend 11.96
Dividend yield 1%
Total return -23%
*Average valuation price derived from residual income method and relative valuation
Top five first generation banksTop five first generation banks A comparative analysisA comparative analysis
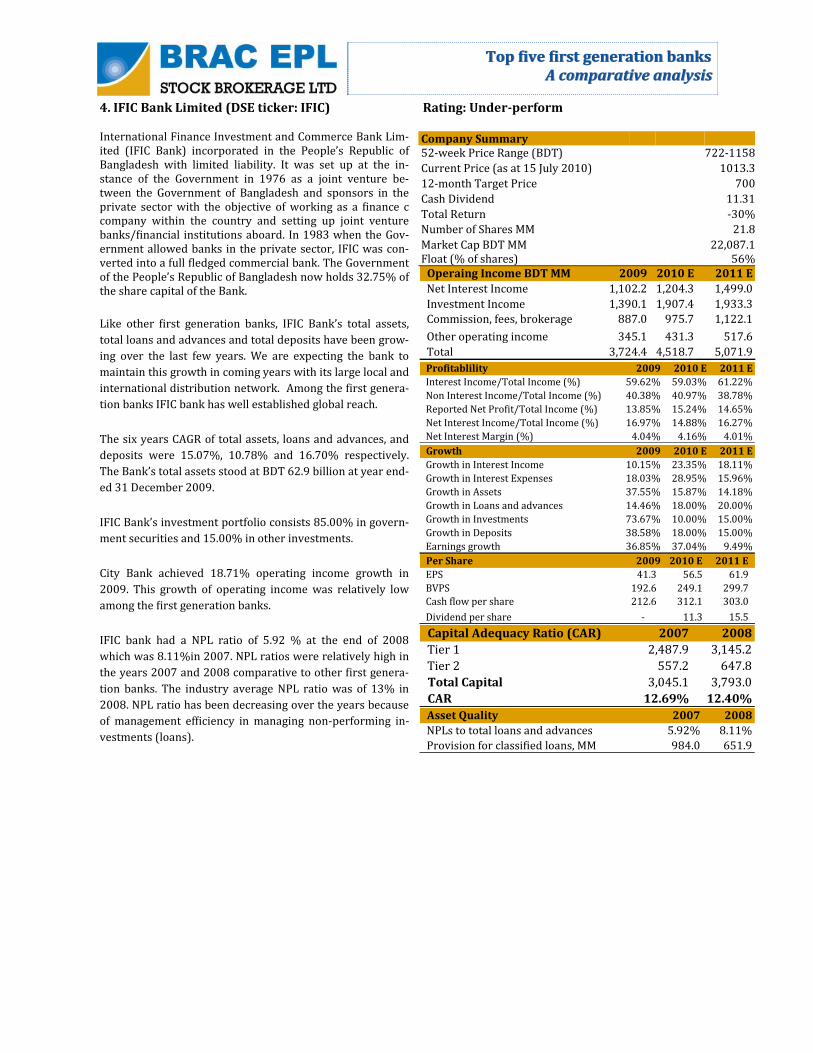
4. IFIC Bank Limited (DSE ticker: IFIC) Rating: Under-perform
Operaing Income BDT MM 2009 2010 E 2011 E
Net Interest Income 1,102.2 1,204.3 1,499.0
Investment Income 1,390.1 1,907.4 1,933.3
Commission, fees, brokerage 887.0 975.7 1,122.1
Other operating income 345.1 431.3 517.6
Total 3,724.4 4,518.7 5,071.9
Profitablility 2009 2010 E 2011 E
Interest Income/Total Income (%) 59.62% 59.03% 61.22%
Non Interest Income/Total Income (%) 40.38% 40.97% 38.78%
Reported Net Profit/Total Income (%) 13.85% 15.24% 14.65%
Net Interest Income/Total Income (%) 16.97% 14.88% 16.27%
Net Interest Margin (%) 4.04% 4.16% 4.01%
Growth 2009 2010 E 2011 E
Growth in Interest Income 10.15% 23.35% 18.11%
Growth in Interest Expenses 18.03% 28.95% 15.96%
Growth in Assets 37.55% 15.87% 14.18%
Growth in Loans and advances 14.46% 18.00% 20.00%
Growth in Investments 73.67% 10.00% 15.00%
Growth in Deposits 38.58% 18.00% 15.00%
Earnings growth 36.85% 37.04% 9.49%
Per Share 2009 2010 E 2011 E
EPS 41.3 56.5 61.9
BVPS 192.6 249.1 299.7
Cash flow per share 212.6 312.1 303.0
Dividend per share - 11.3 15.5
Capital Adequacy Ratio (CAR) 2007 2008
Tier 1 2,487.9 3,145.2
Tier 2 557.2 647.8
Total Capital 3,045.1 3,793.0
CAR 12.69% 12.40%
Asset Quality 2007 2008
NPLs to total loans and advances 5.92% 8.11%
Provision for classified loans, MM 984.0 651.9
Company Summary 52-week Price Range (BDT) 722-1158
Current Price (as at 15 July 2010) 1013.3
12-month Target Price 700
Cash Dividend 11.31
Total Return -30%
Number of Shares MM 21.8
Market Cap BDT MM 22,087.1 Float (% of shares) 56%
International Finance Investment and Commerce Bank Lim‐ited (IFIC Bank) incorporated in the People’s Republic of Bangladesh with limited liability. It was set up at the in‐stance of the Government in 1976 as a joint venture be‐tween the Government of Bangladesh and sponsors in the private sector with the objective of working as a finance c company within the country and setting up joint venture banks/financial institutions aboard. In 1983 when the Gov‐ernment allowed banks in the private sector, IFIC was con‐verted into a full fledged commercial bank. The Government of the People’s Republic of Bangladesh now holds 32.75% of the share capital of the Bank.
Like other first generation banks, IFIC Bank’s total assets,
total loans and advances and total deposits have been grow‐
ing over the last few years. We are expecting the bank to
maintain this growth in coming years with its large local and
international distribution network. Among the first genera‐
tion banks IFIC bank has well established global reach.
The six years CAGR of total assets, loans and advances, and
deposits were 15.07%, 10.78% and 16.70% respectively.
The Bank’s total assets stood at BDT 62.9 billion at year end‐
ed 31 December 2009.
IFIC Bank’s investment portfolio consists 85.00% in govern‐
ment securities and 15.00% in other investments.
City Bank achieved 18.71% operating income growth in
2009. This growth of operating income was relatively low
among the first generation banks.
IFIC bank had a NPL ratio of 5.92 % at the end of 2008
which was 8.11%in 2007. NPL ratios were relatively high in
the years 2007 and 2008 comparative to other first genera‐
tion banks. The industry average NPL ratio was of 13% in
2008. NPL ratio has been decreasing over the years because
of management efficiency in managing non-performing in‐
vestments (loans).

Top five first generation banksTop five first generation banks A comparative analysisA comparative analysis
Income Statement, MM BDT 2007 2008 2009 2010 E 2011 E 2012 E
Interest/Investment Income 2,774.6 3,515.5 3,872.1 4,776.2 5,640.9 6,720.1
Interest/profit paid on deposit and borrowing etc 1,896.5 2,346.8 2,770.0 3,571.9 4,141.9 4,758.8
Net Interest Income 878.0 1,168.7 1,102.2 1,204.3 1,499.0 1,961.4
Income from investments in securities/Shares 1,375.8 693.9 1,390.1 1,907.4 1,933.3 1,729.2
Commission, Exchange & Brokerage 754.8 874.1 887.0 975.7 1,122.1 1,290.4
Other Income 291.3 442.9 345.1 431.3 517.6 621.1
Total Operating Income 3,300.0 3,179.6 3,724.4 4,518.7 5,071.9 5,602.1
Operating Expense 1,797.0 1,557.3 1,764.8 2,022.7 2,303.5 2,590.2
Profit Before Provision 1,502.9 1,622.3 1,959.5 2,496.1 2,768.5 3,011.9
Provision 38.0 305.0 310.0 370.8 441.5 529.8
Pre-Tax Profit 1,464.9 1,317.3 1,649.5 2,125.3 2,327.0 2,482.1
Tax 500.0 660.0 750.0 892.6 977.3 1,042.5
Profit After Tax 964.9 657.3 899.5 1,232.7 1,349.6 1,439.6
Balance Sheet, MM BDT 2007 2008 2009 2010 E 2011 E 2012 E
Property & Assets:
Cash 3,593.5 3,340.4 4,634.0 6,803.3 6,605.4 5,806.1
Balance with Other Banks & F.I 2,359.1 1,919.1 8,155.6 8,155.6 8,155.6 8,155.6
Money at call .0 70.0 200.0 200.0 200.0 200.0
Investment 3,855.7 5,229.9 9,083.0 9,991.2 11,489.9 13,213.4
Loan & Advance 28,361.5 33,018.4 37,793.9 44,596.8 53,516.1 64,219.4
Fixed Assets 383.1 511.5 616.3 717.4 832.6 962.1
Other Assets 1,361.3 1,640.3 2,419.1 2,419.1 2,419.1 2,419.1
Total Assets 39,914.1 45,729.5 62,901.9 72,883.5 83,218.8 94,975.7
Liabilities & Equities:
Liabilities:
Borrowing from other banks and F.I 1,105.2 203.5 1,250.0 625.0 562.5 506.3
Deposits 29,900.1 36,092.2 50,018.0 59,021.2 67,874.4 78,055.5
Other Liability 6,295.1 6,237.0 7,436.4 7,807.2 8,248.7 8,778.5
Total Liabilities 37,300.4 42,532.7 58,704.4 67,453.4 76,685.6 87,340.3
Shareholder's Equity:
Paid-up 670.7 1,341.4 1,743.9 2,179.8 2,179.8 2,179.8
Statutory reserve 952.0 1,215.5 1,545.4 1,545.4 1,545.4 1,545.4
Other reserve 153.1 78.7 179.9 179.9 179.9 179.9
Revaluation Gain on Investment .0 .0 .0 .0 .0 .0
Foreign currency translation gain .0 .0 .0 .0 .0 .0
Retained Earning 838.0 561.1 728.3 1,525.0 2,628.1 3,730.3
Total Equity 2,613.8 3,196.7 4,197.5 5,430.1 6,533.2 7,635.4
Total Liabilities & Equities 39,914.1 45,729.5 62,901.9 72,883.5 83,218.8 94,975.7
Income statement
Balance sheet
Source: Company annual reports and BRAC EPL research

Top five first generation banksTop five first generation banks A comparative analysisA comparative analysis
Cashflow statement 2007 2008 2009 2010 E 2011 E 2012 E
Operating cash
Net income 1,232.7 1,349.6 1,439.6
Non-cash items 471.9 556.7 659.3
Operating cashflow 1,833.5 1,622.0 1,635.9 1,704.6 1,906.3 2,098.9Increase/decrease in operating assets and liabilities
Investments (908.3) (1,498.7) (1,723.5)Loans and advances (6,802.9) (8,919.4) (10,703.2)Deposits and other accounts 9,003.2 8,853.2 10,181.2Operating cashflow (1,182.9) (680.0) 10,108.7 1,292.0 (1,564.9) (2,245.6)Investing cashflow
Investment in fixed and intangible assets (202.3) (230.3) (259.0)Investing cashflow (187.9) (363.7) (437.7) (202.3) (230.3) (259.0)Financing cashflow
Increase/(reduction) in debt (625.0) (62.5) (56.3)Dividend payment .0 (246.5) (337.4)Financing cashflow (2.3) (11.7) (3.5) (625.0) (309.0) (393.7)Beginning cash balance 2,646.8 3,593.5 3,340.4 4,634.0 6,803.3 6,605.4Other Adjustments .0 .0 .0 .0 .0 .0Change in cash 460.4 566.7 11,303.4 2,169.3 (197.9) (799.3)Ending cash balance 3,593.5 3,340.4 4,634.0 6,803.3 6,605.4 5,806.1
VALUATION
Residual Income method
Residual Income Method
Our residual income method of valuation estimates a value of BDT 571.80 We as‐sume 20% ROE for the years of 2013-2016 (based on historical ROE), risk free rate of 9 % (average Gov. Securities rate), cost of equity of 16% and a terminal growth rate of 9%.
Residual Income 2009 2010 2011 2012 2013 2014 2015 2016
ROE 25.6% 22.6% 20.3% 20.0% 20.0% 20.0% 20.0%
EPS 41.3 56.5 61.9 66.0 70.1 84.1 100.9 121.1
BVPS 192.6 249.1 299.7 350.3 420.3 504.4 605.3 726.3
EQUITY CHARGE 30.0 38.9 46.8 54.6 65.6 78.7 94.4
RESIDUAL INCOME 26.5 23.1 19.3 15.4 18.5 22.2 26.6
TERMINAL VALUE 403.5
CASH FLOWS 26.5 23.1 19.3 15.4 18.5 425.7 26.6
RF 9%
Implied Beta 1.1
ERP 6%
Cost of Equity 16%
Terminal Growth 9%
Value/Share 571.80
Cash flow statement
Relative Valuation
In valuing IFIC Bank, we compared twelve largest banks (Table 14) listed on the DSE and found average trailing/actual P/E and P/B ratios of 14.59x and 3.02x respectively. At cur‐rent price, IFIC Bank trades at 19.64x P/E (trailing) and 4.21x (trailing). Using a 12.5x P/E multiple over 2010E earnings of 56.55, we determine a fair value of BDT 707. Using a 2.5x P/B multiple over 2010E BVPS of 249.11, we determine a fair value of BDT 623. Considering residual income and relative valuation, method we determine a fair value of BDT 700 (12 month forward).
In conducting a valuation for IFIC Bank, we have looked at the trading prices of some of the leading banks in South East Asia (Table 16). These banks are in mid-income countries with mostly mature banking markets, and have a slower growth prospect. Whereas Bangladeshi banks routinely achieve 30% growth in assets and deposits, growth rate in these markets have stabilized at around 10%. On the other hand, these banks are also better managed with superior asset quality and risk management practices. The group of peer banks in South East Asia trade at an average of 15.39x P/E and 2.15x P/B (trailing).
IFIC EPS BVPS
2010 estimates 56.55 249.11
Multiple 12.50x 2.50x
Fair value 707 623
Current Price 1013.3
*Average Valuation Price 634
Fair value (12 months forward) 700
Dividend 11.31 Dividend yield 1%
Total return -30%
*Average valuation price derived from residual income method and relative valuation
Top five first generation banksTop five first generation banks A comparative analysisA comparative analysis
5. National Bank Limited (DSE ticker: NBL) Rating: Sector perform
Operating Income BDT MM 2009 2010 E 2011 E
Net Interest Income 2,331.1 3,376.1 4,759.9
Investment Income 1,779.3 2,568.3 2,433.1
Commission, fees, brokerage 1,497.6 1,797.1 2,156.5
Other operating income 942.2 1,177.8 1,472.3
Total 6,550.2 8,919.2 10,821.8
Profitablility 2009 2010 E 2011 E
Interest Income/Total Income (%) 61.79% 61.71% 65.36%
Non Interest Income/Total Income (%) 38.21% 38.29% 34.64%
Reported Net Profit/Total Income (%) 18.86% 20.45% 20.56%
Net Interest Income/Total Income (%) 21.11% 23.32% 27.20%
Net Interest Margin (%) 4.55% 4.84% 5.41%
Efiiciency & return 2009 2010 E 2011 E
Operating efficiency 47.93% 40.57% 40.42%
Loan/Deposit 84.77% 88.30% 89.77%
ROE 27.64% 28.43% 26.27%
ROA 2.54% 2.90% 2.92%
Growth 2009 2010 E 2011 E
Growth in Interest Income 17.86% 30.95% 28.03%
Growth in Interest Expenses 24.91% 23.74% 20.15%
Growth in Assets 27.35% 21.84% 20.07%
Growth in Loans and advances 31.14% 25.00% 22.00%
Growth in Investments 21.16% 20.00% 20.00%
Growth in Deposits 27.66% 20.00% 20.00%
Earnings growth 36.58% 42.18% 21.51%
Per Share 2009 2010 E 2011 E
EPS 47 67 82
BVPS 202 270 351
CFPS 155 176 201
Cash dividend per share 0 0 0
Asset Quality, MM 2007 2008 2009
NPLs to total loans and advances 4.53% 5.39% 5.96%
Provision for classified loans 947.7 1,121.8 1,195.9
Capital Adequacy Ratio 2007 2008 2009
Tier 1 3,742.0 5,259.5 7,329.9
Tier 2 969.5 1,259.7 1,794.7
Total Capital 4,711.5 6,519.1 9,124.6
CAR 13.11% 13.42% 13.56%
Company Summary
52-week Price Range (BDT) 440 - 878
Current Price 837.25
12-month Target Price 900
Cash Dividend 0.00
Total Return 7%
Number of Shares MM 44.1
Market Cap BDT MM 36,940.6
Float (% of shares) 70.69%
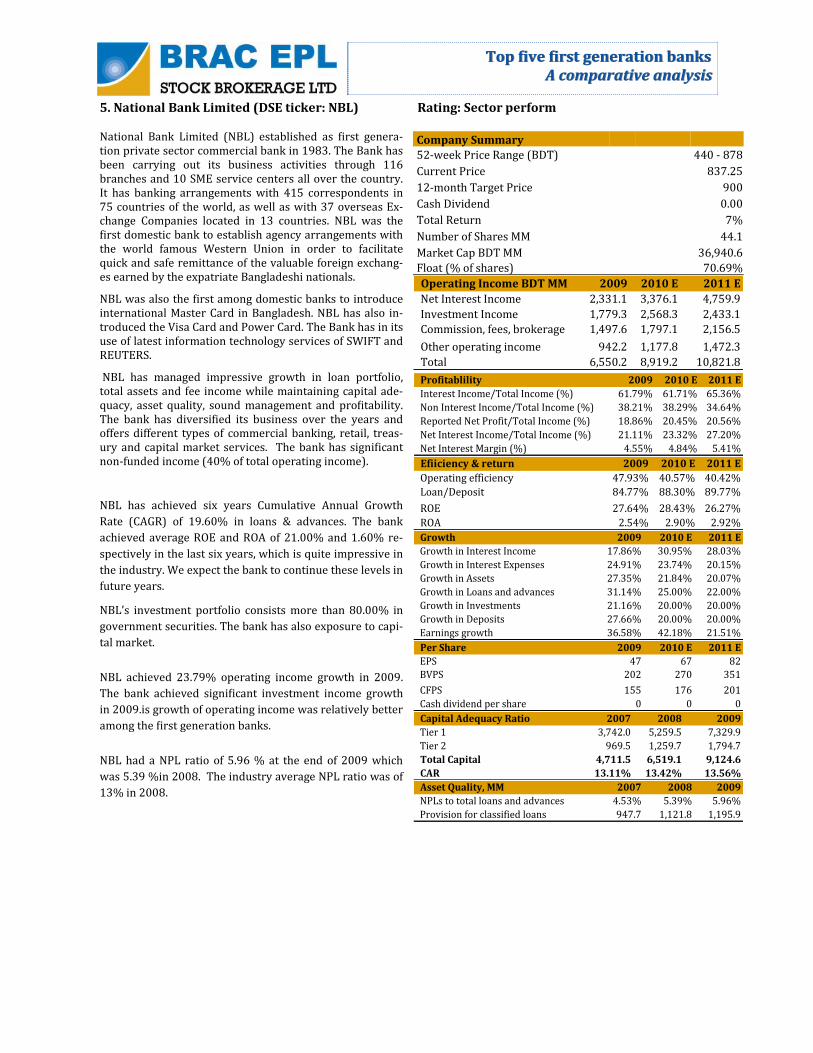
National Bank Limited (NBL) established as first genera‐tion private sector commercial bank in 1983. The Bank has been carrying out its business activities through 116 branches and 10 SME service centers all over the country. It has banking arrangements with 415 correspondents in 75 countries of the world, as well as with 37 overseas Ex‐change Companies located in 13 countries. NBL was the first domestic bank to establish agency arrangements with the world famous Western Union in order to facilitate quick and safe remittance of the valuable foreign exchang‐es earned by the expatriate Bangladeshi nationals.
NBL was also the first among domestic banks to introduce international Master Card in Bangladesh. NBL has also in‐troduced the Visa Card and Power Card. The Bank has in its use of latest information technology services of SWIFT and REUTERS.
NBL has managed impressive growth in loan portfolio, total assets and fee income while maintaining capital ade‐quacy, asset quality, sound management and profitability. The bank has diversified its business over the years and offers different types of commercial banking, retail, treas‐ury and capital market services. The bank has significant non-funded income (40% of total operating income).
NBL has achieved six years Cumulative Annual Growth
Rate (CAGR) of 19.60% in loans & advances. The bank
achieved average ROE and ROA of 21.00% and 1.60% re‐
spectively in the last six years, which is quite impressive in
the industry. We expect the bank to continue these levels in
future years.
NBL’s investment portfolio consists more than 80.00% in
government securities. The bank has also exposure to capi‐
tal market.
NBL achieved 23.79% operating income growth in 2009.
The bank achieved significant investment income growth
in 2009.is growth of operating income was relatively better
among the first generation banks.
NBL had a NPL ratio of 5.96 % at the end of 2009 which
was 5.39 %in 2008. The industry average NPL ratio was of
13% in 2008.
Top five first generation banksTop five first generation banks A comparative analysisA comparative analysis
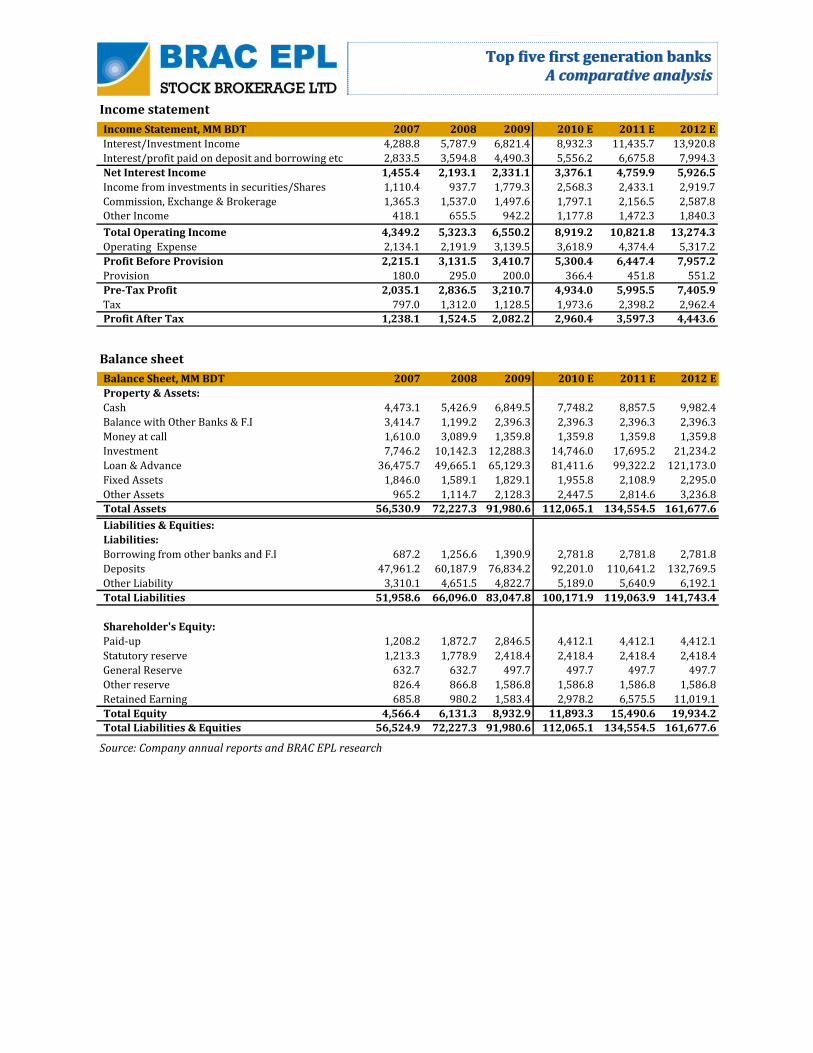
Income Statement, MM BDT 2007 2008 2009 2010 E 2011 E 2012 E
Interest/Investment Income 4,288.8 5,787.9 6,821.4 8,932.3 11,435.7 13,920.8
Interest/profit paid on deposit and borrowing etc 2,833.5 3,594.8 4,490.3 5,556.2 6,675.8 7,994.3
Net Interest Income 1,455.4 2,193.1 2,331.1 3,376.1 4,759.9 5,926.5
Income from investments in securities/Shares 1,110.4 937.7 1,779.3 2,568.3 2,433.1 2,919.7
Commission, Exchange & Brokerage 1,365.3 1,537.0 1,497.6 1,797.1 2,156.5 2,587.8
Other Income 418.1 655.5 942.2 1,177.8 1,472.3 1,840.3
Total Operating Income 4,349.2 5,323.3 6,550.2 8,919.2 10,821.8 13,274.3
Operating Expense 2,134.1 2,191.9 3,139.5 3,618.9 4,374.4 5,317.2
Profit Before Provision 2,215.1 3,131.5 3,410.7 5,300.4 6,447.4 7,957.2
Provision 180.0 295.0 200.0 366.4 451.8 551.2
Pre-Tax Profit 2,035.1 2,836.5 3,210.7 4,934.0 5,995.5 7,405.9
Tax 797.0 1,312.0 1,128.5 1,973.6 2,398.2 2,962.4
Profit After Tax 1,238.1 1,524.5 2,082.2 2,960.4 3,597.3 4,443.6
Balance Sheet, MM BDT 2007 2008 2009 2010 E 2011 E 2012 E
Property & Assets:
Cash 4,473.1 5,426.9 6,849.5 7,748.2 8,857.5 9,982.4
Balance with Other Banks & F.I 3,414.7 1,199.2 2,396.3 2,396.3 2,396.3 2,396.3
Money at call 1,610.0 3,089.9 1,359.8 1,359.8 1,359.8 1,359.8
Investment 7,746.2 10,142.3 12,288.3 14,746.0 17,695.2 21,234.2
Loan & Advance 36,475.7 49,665.1 65,129.3 81,411.6 99,322.2 121,173.0
Fixed Assets 1,846.0 1,589.1 1,829.1 1,955.8 2,108.9 2,295.0
Other Assets 965.2 1,114.7 2,128.3 2,447.5 2,814.6 3,236.8
Total Assets 56,530.9 72,227.3 91,980.6 112,065.1 134,554.5 161,677.6
Liabilities & Equities:
Liabilities:
Borrowing from other banks and F.I 687.2 1,256.6 1,390.9 2,781.8 2,781.8 2,781.8
Deposits 47,961.2 60,187.9 76,834.2 92,201.0 110,641.2 132,769.5
Other Liability 3,310.1 4,651.5 4,822.7 5,189.0 5,640.9 6,192.1
Total Liabilities 51,958.6 66,096.0 83,047.8 100,171.9 119,063.9 141,743.4
Shareholder's Equity:
Paid-up 1,208.2 1,872.7 2,846.5 4,412.1 4,412.1 4,412.1
Statutory reserve 1,213.3 1,778.9 2,418.4 2,418.4 2,418.4 2,418.4
General Reserve 632.7 632.7 497.7 497.7 497.7 497.7
Other reserve 826.4 866.8 1,586.8 1,586.8 1,586.8 1,586.8
Retained Earning 685.8 980.2 1,583.4 2,978.2 6,575.5 11,019.1
Total Equity 4,566.4 6,131.3 8,932.9 11,893.3 15,490.6 19,934.2
Total Liabilities & Equities 56,524.9 72,227.3 91,980.6 112,065.1 134,554.5 161,677.6
Income statement
Balance sheet
Source: Company annual reports and BRAC EPL research
Top five first generation banksTop five first generation banks A comparative analysisA comparative analysis
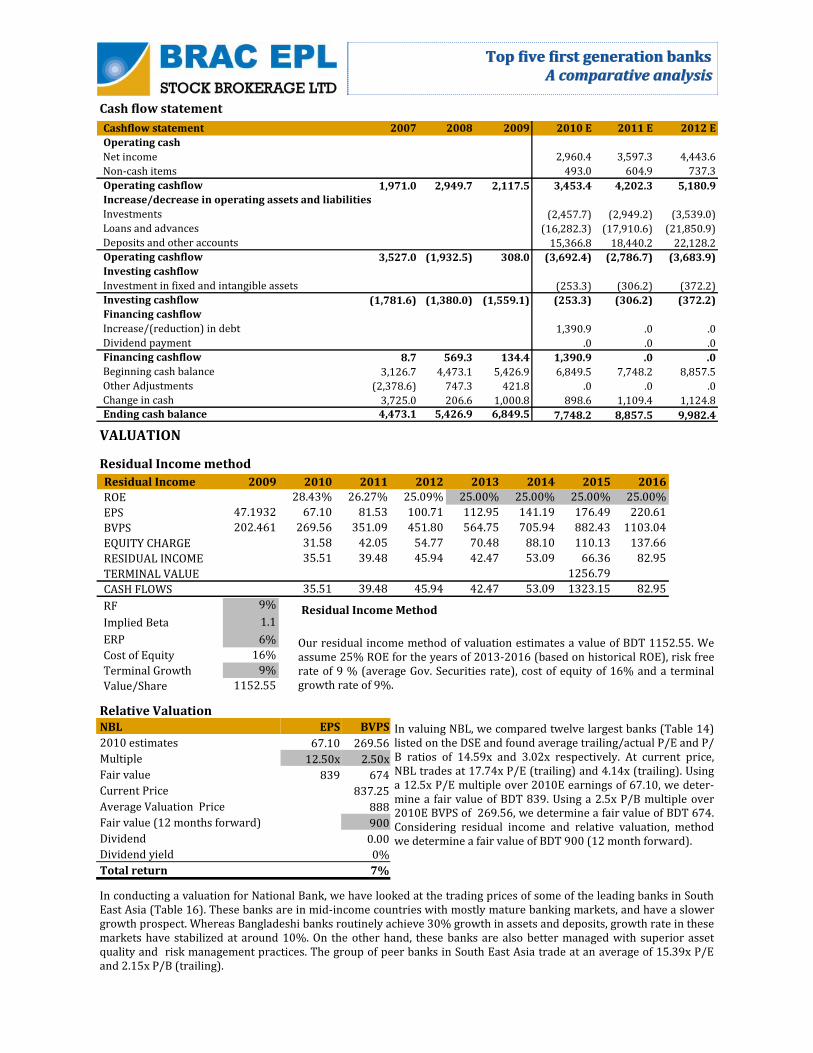
Cashflow statement 2007 2008 2009 2010 E 2011 E 2012 E
Operating cash
Net income 2,960.4 3,597.3 4,443.6
Non-cash items 493.0 604.9 737.3
Operating cashflow 1,971.0 2,949.7 2,117.5 3,453.4 4,202.3 5,180.9Increase/decrease in operating assets and liabilities
Investments (2,457.7) (2,949.2) (3,539.0)Loans and advances (16,282.3) (17,910.6) (21,850.9)Deposits and other accounts 15,366.8 18,440.2 22,128.2Operating cashflow 3,527.0 (1,932.5) 308.0 (3,692.4) (2,786.7) (3,683.9)Investing cashflow
Investment in fixed and intangible assets (253.3) (306.2) (372.2)Investing cashflow (1,781.6) (1,380.0) (1,559.1) (253.3) (306.2) (372.2)Financing cashflow
Increase/(reduction) in debt 1,390.9 .0 .0Dividend payment .0 .0 .0Financing cashflow 8.7 569.3 134.4 1,390.9 .0 .0Beginning cash balance 3,126.7 4,473.1 5,426.9 6,849.5 7,748.2 8,857.5Other Adjustments (2,378.6) 747.3 421.8 .0 .0 .0Change in cash 3,725.0 206.6 1,000.8 898.6 1,109.4 1,124.8Ending cash balance 4,473.1 5,426.9 6,849.5 7,748.2 8,857.5 9,982.4
VALUATION
Residual Income method
Residual Income Method
Our residual income method of valuation estimates a value of BDT 1152.55. We assume 25% ROE for the years of 2013-2016 (based on historical ROE), risk free rate of 9 % (average Gov. Securities rate), cost of equity of 16% and a terminal growth rate of 9%.
Cash flow statement
Residual Income 2009 2010 2011 2012 2013 2014 2015 2016
ROE 28.43% 26.27% 25.09% 25.00% 25.00% 25.00% 25.00%
EPS 47.1932 67.10 81.53 100.71 112.95 141.19 176.49 220.61
BVPS 202.461 269.56 351.09 451.80 564.75 705.94 882.43 1103.04
EQUITY CHARGE 31.58 42.05 54.77 70.48 88.10 110.13 137.66
RESIDUAL INCOME 35.51 39.48 45.94 42.47 53.09 66.36 82.95
TERMINAL VALUE 1256.79
CASH FLOWS 35.51 39.48 45.94 42.47 53.09 1323.15 82.95
RF 9%
Implied Beta 1.1
ERP 6%
Cost of Equity 16%
Terminal Growth 9%
Value/Share 1152.55
Relative Valuation
In valuing NBL, we compared twelve largest banks (Table 14) listed on the DSE and found average trailing/actual P/E and P/B ratios of 14.59x and 3.02x respectively. At current price, NBL trades at 17.74x P/E (trailing) and 4.14x (trailing). Using a 12.5x P/E multiple over 2010E earnings of 67.10, we deter‐mine a fair value of BDT 839. Using a 2.5x P/B multiple over 2010E BVPS of 269.56, we determine a fair value of BDT 674. Considering residual income and relative valuation, method we determine a fair value of BDT 900 (12 month forward).
In conducting a valuation for National Bank, we have looked at the trading prices of some of the leading banks in South East Asia (Table 16). These banks are in mid-income countries with mostly mature banking markets, and have a slower growth prospect. Whereas Bangladeshi banks routinely achieve 30% growth in assets and deposits, growth rate in these markets have stabilized at around 10%. On the other hand, these banks are also better managed with superior asset quality and risk management practices. The group of peer banks in South East Asia trade at an average of 15.39x P/E and 2.15x P/B (trailing).
NBL EPS BVPS
2010 estimates 67.10 269.56
Multiple 12.50x 2.50x
Fair value 839 674
Current Price 837.25
Average Valuation Price 888
Fair value (12 months forward) 900
Dividend 0.00
Dividend yield 0%
Total return 7%
Top five first generation banksTop five first generation banks A comparative analysisA comparative analysis
Analyst Certification: Each research analyst and research associate who authored this document and whose name appears herein certifies that the recommendations and opinions expressed in the research report accurately reflect their personal views about any and all of the securities or issuers discussed therein that are within the coverage universe. Disclaimer: Estimates and projections herein are our own and are based on assumptions that we believe to be reasonable. Information presented herein, while obtained from sources we believe to be reliable, is not guaranteed either as to accuracy or completeness. Neither the information nor any opinion expressed herein constitutes a solicitation of the purchase or sale of any security. As it acts for public companies from time to time, BRAC-EPL may have a relationship with the above mentioned company(s). This report is intended for distribution in only those jurisdictions in which BRAC-EPL is registered and any distribution outside those jurisdictions is strictly prohibited. Compensation of Analysts: The compensation of research analysts is intended to reflect the value of the services they provide to the clients of BRAC-EPL. As with most other employees, the compensation of research analysts is impacted by the overall profitability of the firm, which may include revenues from corporate finance activities of the firm's Corporate Finance department. However, Research analysts' compensation is not directly related to specific corporate finance transaction. General Risk Factors: BRAC-EPL will conduct a comprehensive risk assessment for each company under coverage at the time of initiating research coverage and also revisit this assessment when subsequent update reports are published or material company events occur. Following are some general risks that can impact future operational and financial performance: (1) Industry fundamentals with respect to customer demand or product / service pricing could change expected revenues and earnings; (2) Issues relating to major competitors or market shares or new product expectations could change investor attitudes; (3) Unforeseen developments with respect to the management, financial condition or accounting policies alter the prospective valuation; or (4) Interest rates, currency or major segments of the economy could alter investor confidence and investment prospects. Special Disclosure: BRAC Bank Limited is the majority shareholder of BRAC-EPL Investments Limited and
BRAC-EPL Brokerage Limited.
BRAC EPL Investments Capital Markets Group
Aminul Haque Head of Capital Markets [email protected] 01730317802
Md. Monirul Islam Research Analyst [email protected] 01730357150
Parvez Morshed Chowdhury Research Analyst [email protected] 01730357154
Ali Imam Investment Analyst [email protected] 01730357153
Asif Khan Investment Analyst [email protected] 01730357158
Md. Ashfaque Alam Research Associate [email protected] 01671020956
Khandakar Safwan Saad Research Associate [email protected] 01911420549
BRAC EPL Research www.bracepl.com WW Tower (8th Floor) 68 Motijheel C/A, Dhaka-1000 Tel: +88 02 9514731-40 Fax: +88 02 7116418 E-Mail: [email protected]
IMPORTANT DISCLOSURES
Related Documents