Exhibitors and Attendees in Their Natural Habitat: Tools and Metrics for Analyzing Showsite Behavior to Improve Your Show Roger Lewis - Panelist

Tools And Metrics For Analyzing Showsite Behavior Iaee E Merge 2008
Jul 15, 2015
Welcome message from author
This document is posted to help you gain knowledge. Please leave a comment to let me know what you think about it! Share it to your friends and learn new things together.
Transcript

Exhibitors and Attendees in Their Natural Habitat:
Tools and Metrics for Analyzing Showsite Behavior to Improve Your Show
Roger Lewis - Panelist

Introduction to Tradeshow Booth Analysis
• 2/3 of CMO’s state events are vital
• Key Challenge:
“Difficult to quantify and measure”
• Leads are key tradeshow metrics
• Importance of Metrics in a troubled economy
• Tradeshow Analytics
• Improving ROI
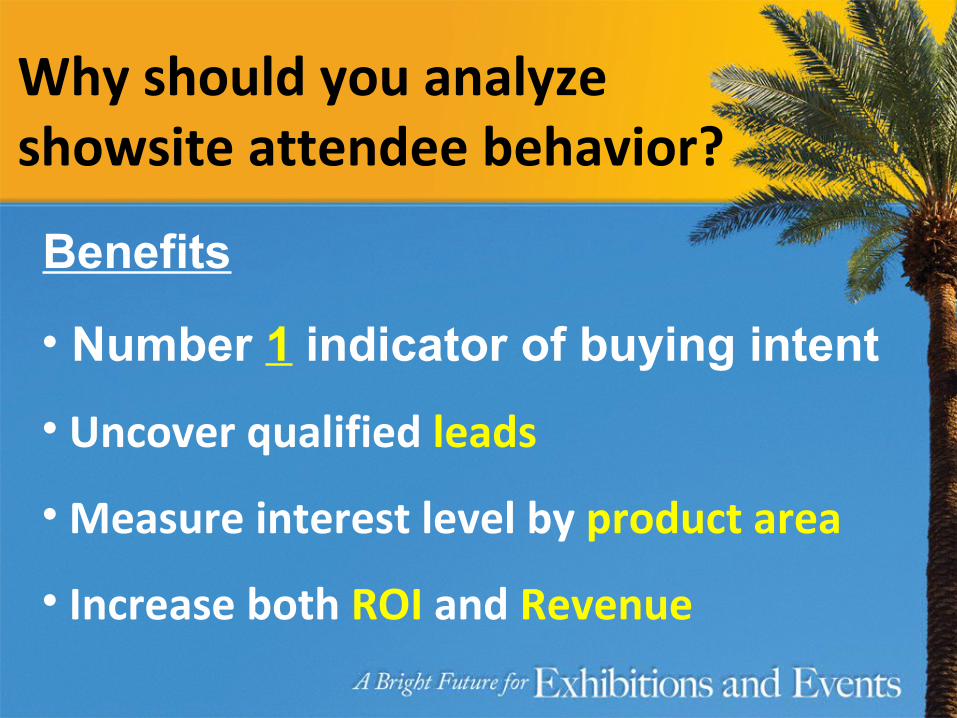
Why should you analyze showsite attendee behavior?
• Number 1 indicator of buying intent
• Uncover qualified leads
• Measure interest level by product area
• Increase both ROI and Revenue
Benefits

Tools to understand attendee behavior in a booth?
• Human Observation
• Video Capture
• RFID

Introduction to RFID
What is RFID?
• RFID = Radio Frequency Identification
• Technology has been in use since WWII and is used in Toll Tags
How do we implement?
• An RFID tag on the badge
• Readers & Antennas are setup at designated areas around the booth

Types
• Spectrum 902 ... 928 MHz Long Range (10-500 ft) 13.6 MHz Close proximity (6 inches)
• Active vs. Passive Passive – Accurate / inexpensive / shorter range (up to 50 ft) Active – Accurate / expensive / long range (up to 500ft)

Benefits

Exhibitors & Attendees in their Natural Habitat

Capture visits & duration to understand attendee interests

Measure interest levelby product area

Where is the executive withbudget looking for a solution?
• Know your audienceKnow your audience
• Increasing Revenue PotentialIncreasing Revenue Potential
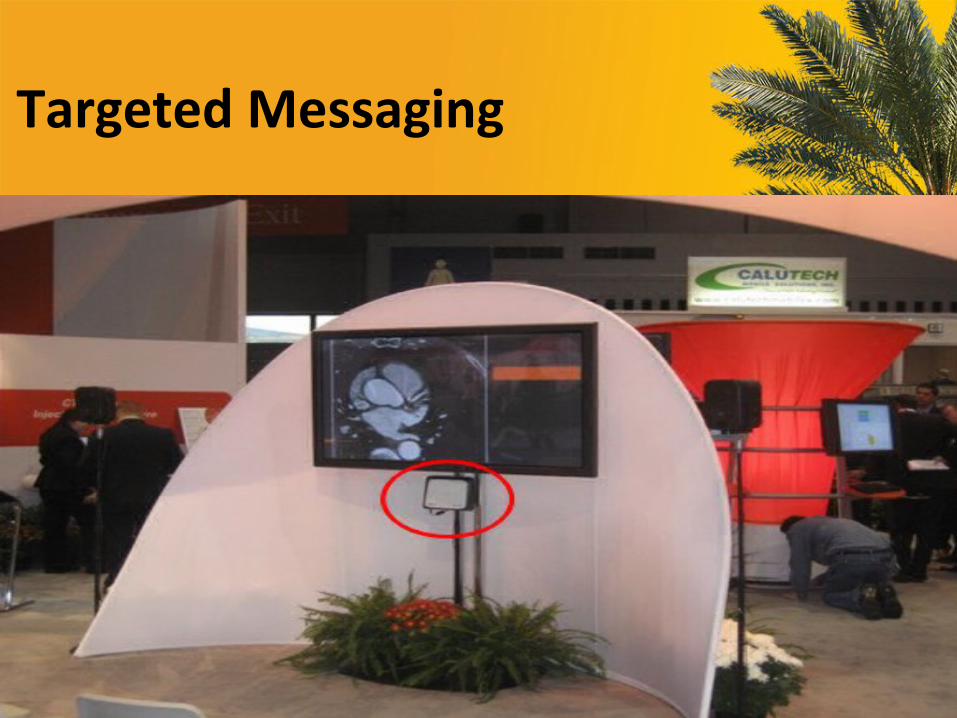
Targeted Messaging
• Know your audienceKnow your audience
• Increasing Revenue PotentialIncreasing Revenue Potential
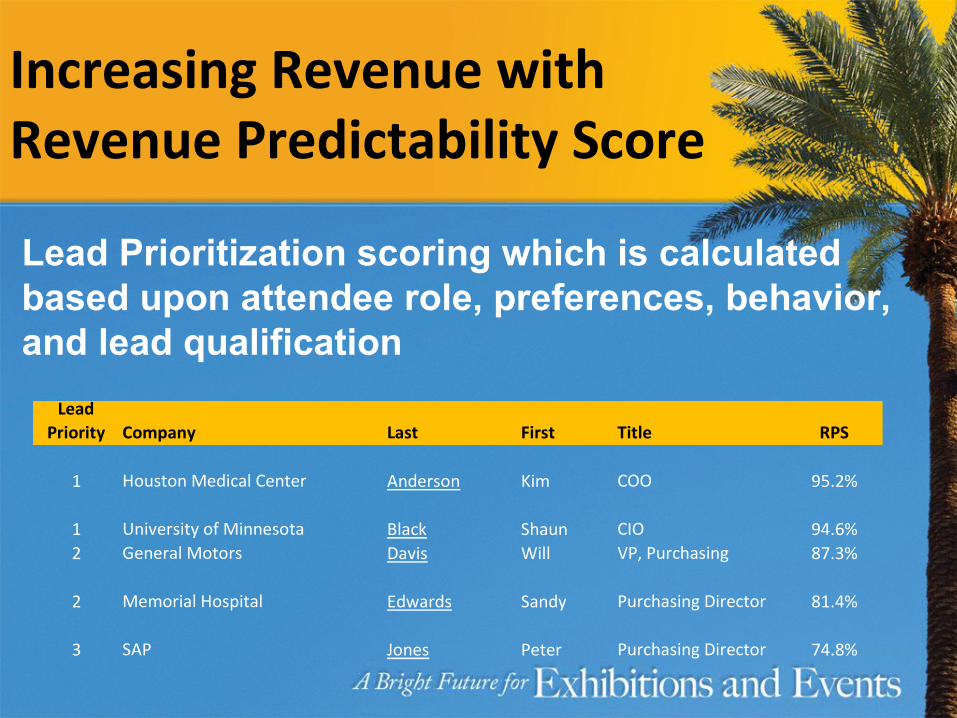
Increasing Revenue withRevenue Predictability Score
Lead Prioritization scoring which is calculated based upon attendee role, preferences, behavior, and lead qualification
LeadPriority Company Last First Title RPS
1 Houston Medical Center Anderson Kim COO 95.2%
1 University of Minnesota Black Shaun CIO 94.6%2 General Motors Davis Will VP, Purchasing 87.3%
2 Memorial Hospital Edwards Sandy Purchasing Director 81.4%
3 SAP Jones Peter Purchasing Director 74.8%

i-Quadrant
Recap
• #1 indicator of purchase intent is behavior
• Technologies such as RFID are being readily adopted because of their ROI
• It is all about Metrics, ROI, and increasing Revenue
Why measure?
– Produce high-impact and highly successful events– Develop events that deliver measurable strategic
business results– Satisfy the real needs and expectations of
participants– Understand data on attitudes, behaviors, interests,
preferences and applications– Provide quantifiable value of events to key
stakeholders: accountability

Which metrics should I capture?
– Attendance figures, broken out by function (buyer, exhibitor, speaker, staff, guest, etc.)
– Basic contact information for each participant– Demographics– Marketing effectiveness: source codes and special links in e-
mails that capture attendee responses to vehicle during the registration process
– Traffic flow and crowd positioning on the show floor relative to specific booths and presentation areas
– Preferences and interests, via survey– Application of knowledge obtained at the event and impact of
that knowledge on business, via ROI study• Definition of ROI
Why ROI?
• Information for analysis provided directly from experts – the participants
• Uses most conservative methods for data collection
• Identifies event impact on business• Accounts for intangible benefits• Data adjusted for confidence factor• Incorporates fully loaded costs

Harness the power of complexity by taming it
taming complexityTM
A little background…
Who is MAYA?

MAYA Design: Who
•taming complexityTMHuman Sciences (Peter Lucas)How people think and form mental models
• Cognitive Psychology• Anthropology• HCI (Human Computer Interaction)
Design (Joe Ballay)Form and Function - makersBrainstorming/Creativity
• Industrial/Graphic Designers• Film Makers• Animators• Architects
Engineering (Jim Morris)Technologists
• Computer Scientists• Electrical Engineers• Mechanical Engineers• Mathematicians

Why was MAYA formed?

1900… 1970 1980 1990
Mor
e
taming complexityTM

1900… 1970 1980 1990
[Printing Press, Telephone System]
Mor
e
$$$
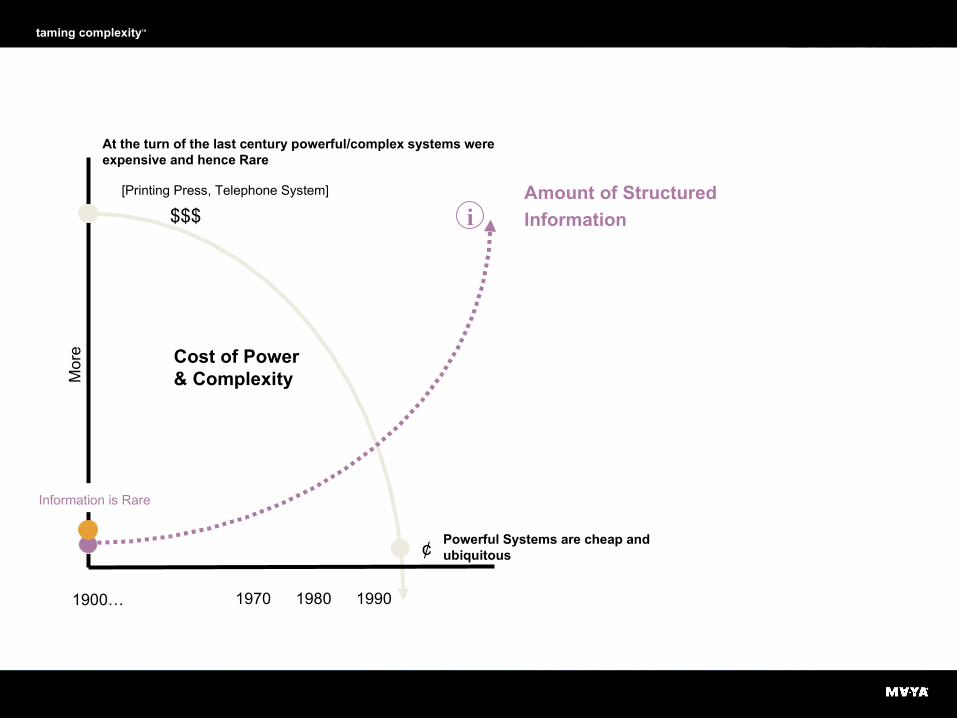
At the turn of the last century powerful/complex systems were expensive and hence Rare
taming complexityTM

1900… 1970 1980 1990
[Printing Press, Telephone System]
Powerful Systems are cheap and ubiquitous
Cost of Power & ComplexityM
ore
$$$
¢
At the turn of the last century powerful/complex systems were expensive and hence Rare
Trend 1: The cost of powerful, complex products and systems has dropped precipitously over the last hundred years.
taming complexityTM

1900… 1970 1980 1990
[Printing Press, Telephone System]
Powerful Systems are cheap and ubiquitous
Cost of Power & ComplexityM
ore
$$$
¢
At the turn of the last century powerful/complex systems were expensive and hence Rare
taming complexityTM

1900… 1970 1980 1990
[Printing Press, Telephone System]
Powerful Systems are cheap and ubiquitous
Cost of Power & ComplexityM
ore
$$$
¢
Information is Rare
At the turn of the last century powerful/complex systems were expensive and hence Rare
taming complexityTM

1900… 1970 1980 1990
[Printing Press, Telephone System] Amount of Structured
Information
Powerful Systems are cheap and ubiquitous
Cost of Power & ComplexityM
ore
$$$
¢
i
Information is Rare
At the turn of the last century powerful/complex systems were expensive and hence Rare
Trend 2: The amount of structured information in the world has exploded with the advent of Radio, TV, and most recently the Internet.
taming complexityTM
1900… 1970 1980 1990
[Printing Press, Telephone System] Amount of Structured
Information
Powerful Systems are cheap and ubiquitous
Cost of Power & ComplexityM
ore
$$$
¢
i
Information is Rare
At the turn of the last century powerful/complex systems were expensive and hence Rare
taming complexityTM

1900… 1970 1980 1990
[Printing Press, Telephone System] Amount of Structured
Information
Powerful Systems are cheap and ubiquitous
Cost of Power & ComplexityM
ore
$$$
¢
i
[Human evolution takes place on a much longer scale]
Information is Rare
At the turn of the last century powerful/complex systems were expensive and hence Rare
taming complexityTM
Trend 3: The ability for Humans to cope with these increases is limited by our own speed to evolve new “capabilities.”

1900… 1970 1980 1990
[Printing Press, Telephone System] Amount of Structured
Information
Powerful Systems are cheap and ubiquitous
Cost of Power & ComplexityM
ore
$$$
¢
i
[Human evolution takes place on a much longer scale]
Information is Rare
MAYA was formed to help close this gap and match information and complex systems to the way people think.
At the turn of the last century powerful/complex systems were expensive and hence Rare
taming complexityTM
“Most Advanced Yet Acceptable” -Raymond Loewy

MAYA | Human-Centered Design
Design
FORMINGCONCEPTING
• Sketching• Ideation• Concept Mapping...
• Representation• Renderings• Models + Prototypes...
Human-Centered Design
OBSERVING EVALUATING
• Interviewing• Field Studies• Contextual Inquiry...
• Questionnaires• Usability Testing• Heuristics...
Participatory Human-Centered Design
We apply design thinking to business challenges…

taming complexityTM
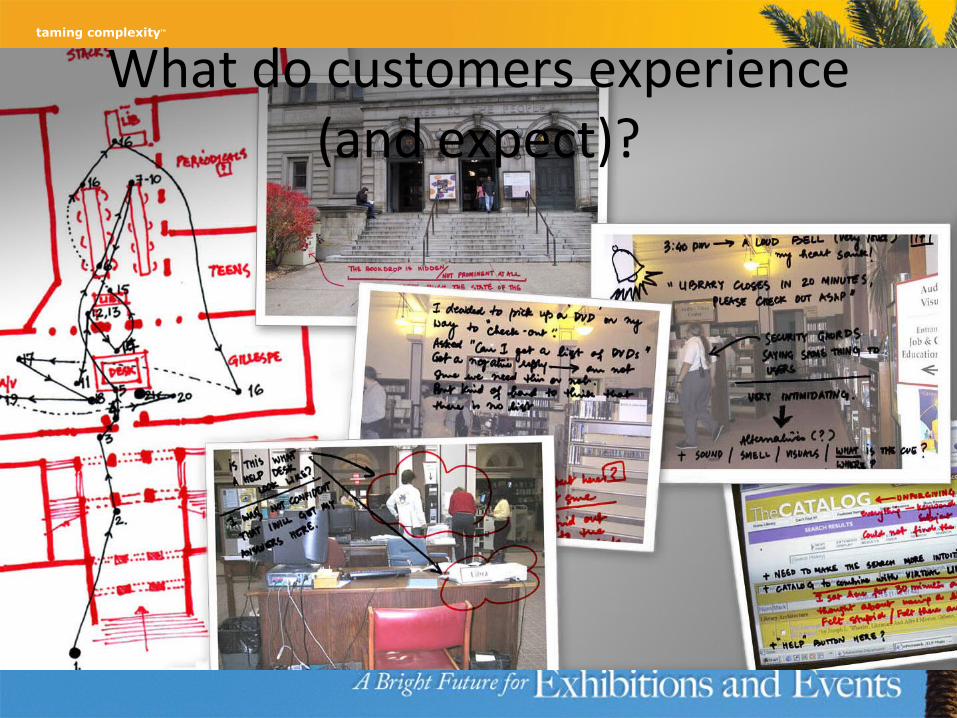
What do customers experience (and expect)?
taming complexityTM
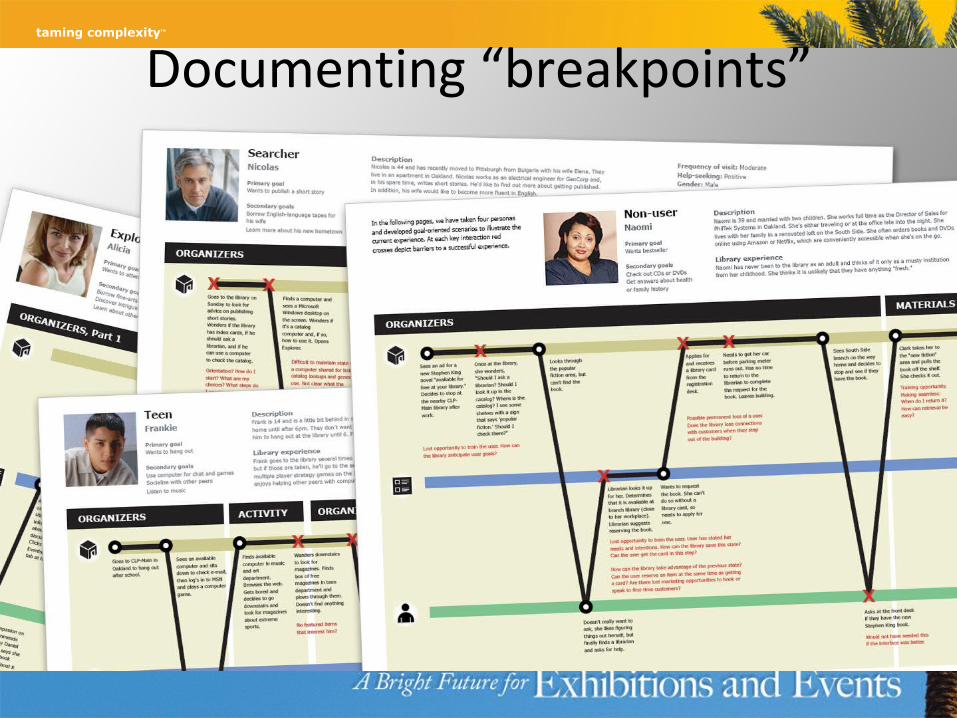
Documenting “breakpoints”taming complexityTM

The Invisible Experience

Attendee-focused

Title

Title
Title


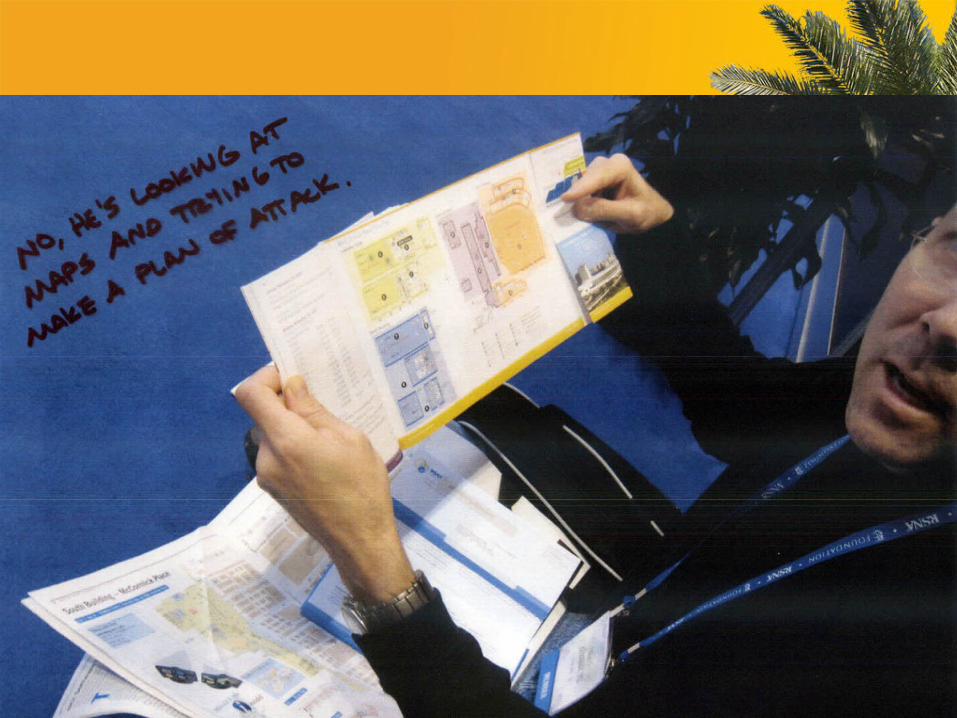
Attendee-Focused…WAYFINDING
ACTIVITYFINDING
INFORMATION ACCESS AND PACKAGING
SOCIAL NETWORKING

Exhibitor-focused

Voice of the customer . . .
Wary
Pressured
Disrespected
Frustrated
Anxious
Victimized
First-time exhibitor
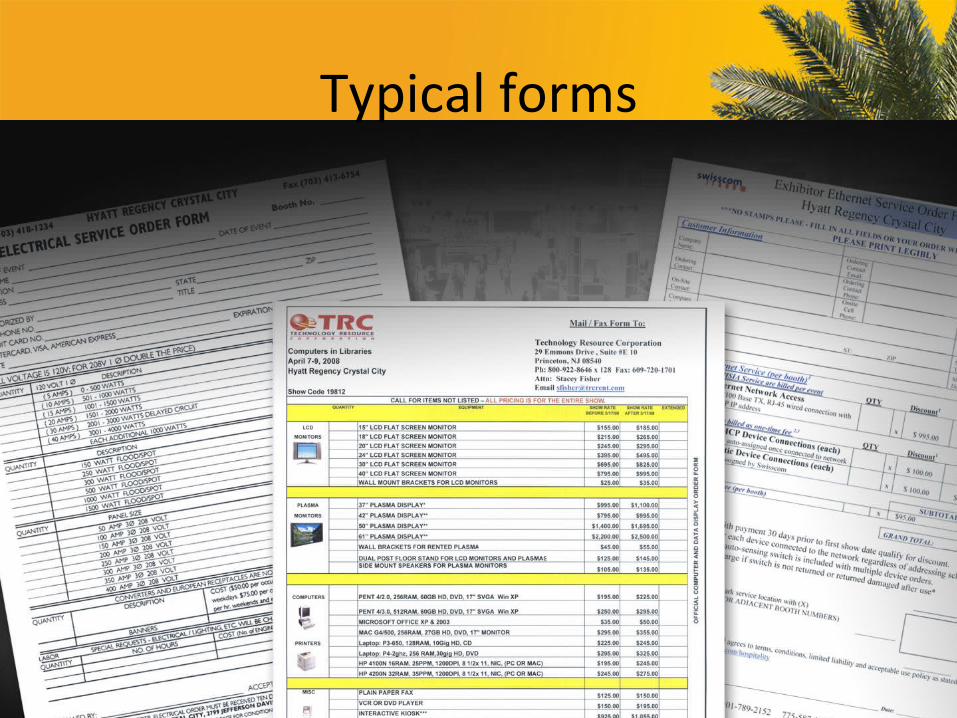
Typical forms

Title
Often key information is managed like this…
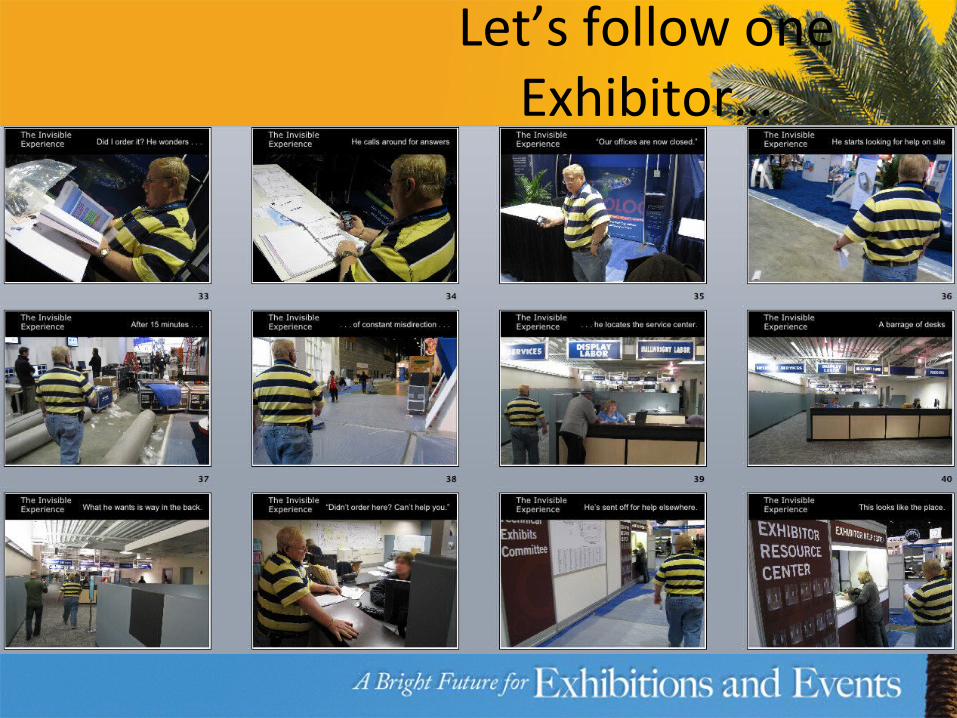
Let’s follow one Exhibitor…
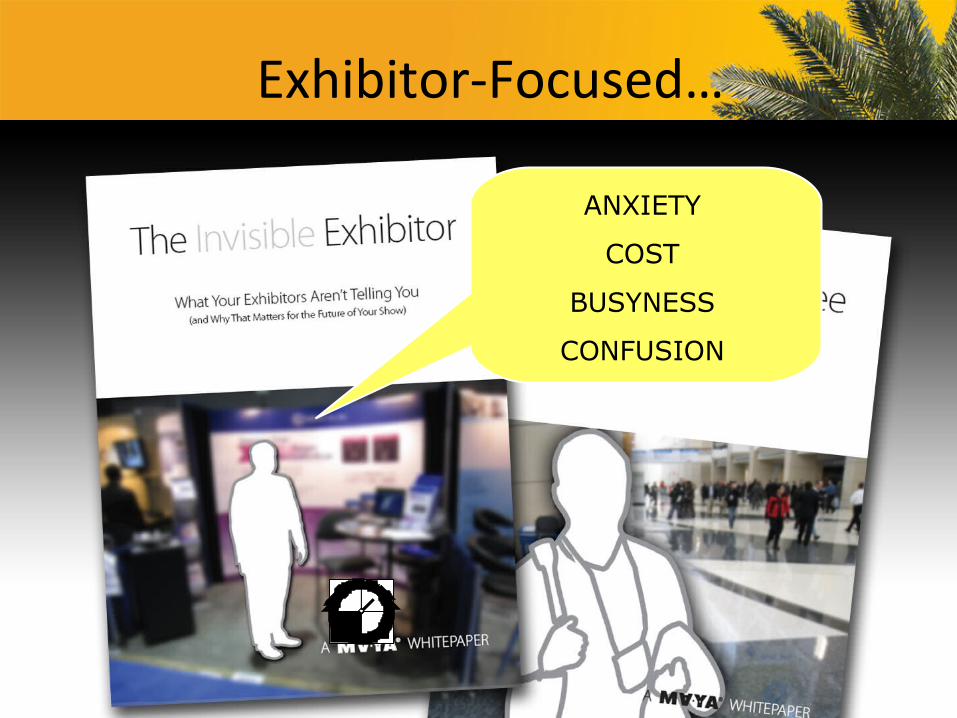
Exhibitor-Focused…
ANXIETY
COST
BUSYNESS
CONFUSION

For details, check out the white papers.
Related Documents