Tool Supported Detection and Judgment of Nonconformance in Process Execution Nico Zazworka, Victor R. Basili Department of Computer Science University of Maryland College Park, USA {nico,basili}@cs.umd.edu Forrest Shull Fraunhofer Center for Experimental Software Engineering Maryland College Park, USA [email protected] Abstract In the past decades the Software Engineering community has proposed a large collection of software development life cycles, models, and processes. The goal of a major set of these processes is to assure that the product is finished within time and budget, and that a predefined set of functional and non functional requirements (e.g. quality goals) are satisfied at delivery time. Based upon the assumption that there is a real relationship between the process applied and the characteristics of the product developed from that process, we developed a tool-supported approach that uses process nonconformance detection to identify potential risks in achieving the required process characteristics. In this paper we present the approach and a feasibility study that demonstrates its use on a large-scale software development project in the aerospace domain. We demonstrate that our approach, in addition to meeting the criteria above, can be applied to a real system of reasonable size; can represent a useful and adequate set of rules of relevance in such an environment; and can detect relevant examples of process nonconformance that provide useful insight to the project manager. Keywords: Process Conformance, Process Verification, Risk Assessment, Process Measurement, Software Visualization 1. Introduction Software engineering process is an important contributor to the development of quality software products within time and within budget. In many cases, the application of tested development processes is the best mechanism for maximizing the chances of achieving a predefined set of functional and nonfunctional requirements and minimizing risks. The term “software engineering process” has been defined as “the system of all tasks and the supporting tools, standards, methods, and practices involved in the production and evolution of a software product throughout the software life cycle.” [1] As such, software engineering processes can encompass decisions about macro-level issues, such as the best way to organize the overall software lifecycle, as well as very specific issues, such as what risk indicators to monitor and what to do when they are observed. The degree of detail and rigor in defining software development processes should ideally vary from one organization to another, and be aligned to the business and technical goals of the organization. Common to all software processes is the need to assess the behavior of developers in actual practice against the processes themselves: The best process will not actually result in improvement if never executed. Effectively assessing process conformance requires making a decision about the appropriate next step when mismatches are found between process and practice. Such mismatches can sometimes indicate issues where practice can be improved, and sometimes issues where impractical processes can be better adapted to the specific development context. To address these issues we propose a tool-supported approach to process assessment. Our approach is general enough that many different types of process rules can be formulated, and indeed, we expect that different types of rules will be necessary in different types of organizations. We argue that, to be useful in practice, such an approach needs to: Require minimal changes to existing work habit and minimal additional effort on the part of software developers, ideally using existing data or information to reason about process conformance; Detect process nonconformance as quickly as possible, to allow corrective actions to be taken if necessary; Allow the investigation of causes and risks due to process nonconformance, for example to rule out false positives or instances where the practice is appropriate and the process may need to change.

Welcome message from author
This document is posted to help you gain knowledge. Please leave a comment to let me know what you think about it! Share it to your friends and learn new things together.
Transcript

Tool Supported Detection and Judgment of Nonconformance in Process Execution
Nico Zazworka, Victor R. Basili
Department of Computer Science
University of Maryland
College Park, USA
{nico,basili}@cs.umd.edu
Forrest Shull
Fraunhofer Center for Experimental Software
Engineering Maryland
College Park, USA
Abstract
In the past decades the Software Engineering
community has proposed a large collection of software
development life cycles, models, and processes. The
goal of a major set of these processes is to assure that
the product is finished within time and budget, and that
a predefined set of functional and non functional
requirements (e.g. quality goals) are satisfied at
delivery time. Based upon the assumption that there is
a real relationship between the process applied and the
characteristics of the product developed from that
process, we developed a tool-supported approach that
uses process nonconformance detection to identify
potential risks in achieving the required process
characteristics. In this paper we present the approach
and a feasibility study that demonstrates its use on a
large-scale software development project in the
aerospace domain. We demonstrate that our approach,
in addition to meeting the criteria above, can be
applied to a real system of reasonable size; can
represent a useful and adequate set of rules of
relevance in such an environment; and can detect
relevant examples of process nonconformance that
provide useful insight to the project manager.
Keywords: Process Conformance, Process Verification,
Risk Assessment, Process Measurement, Software
Visualization
1. Introduction
Software engineering process is an important contributor to the development of quality software products within time and within budget. In many cases, the application of tested development processes is the best mechanism for maximizing the chances of achieving a predefined set of functional and nonfunctional requirements and minimizing risks.
The term “software engineering process” has been defined as “the system of all tasks and the supporting
tools, standards, methods, and practices involved in
the production and evolution of a software product throughout the software life cycle.” [1] As such, software engineering processes can encompass decisions about macro-level issues, such as the best way to organize the overall software lifecycle, as well as very specific issues, such as what risk indicators to monitor and what to do when they are observed. The degree of detail and rigor in defining software development processes should ideally vary from one organization to another, and be aligned to the business and technical goals of the organization.
Common to all software processes is the need to assess the behavior of developers in actual practice against the processes themselves: The best process will not actually result in improvement if never executed. Effectively assessing process conformance requires making a decision about the appropriate next step when mismatches are found between process and practice. Such mismatches can sometimes indicate issues where practice can be improved, and sometimes issues where impractical processes can be better adapted to the specific development context.
To address these issues we propose a tool-supported approach to process assessment. Our approach is general enough that many different types of process rules can be formulated, and indeed, we expect that different types of rules will be necessary in different types of organizations. We argue that, to be useful in practice, such an approach needs to:
Require minimal changes to existing work habit and minimal additional effort on the part of software developers, ideally using existing data or information to reason about process conformance;
Detect process nonconformance as quickly as possible, to allow corrective actions to be taken if necessary;
Allow the investigation of causes and risks due to process nonconformance, for example to rule out false positives or instances where the practice is appropriate and the process may need to change.
In this paper, we present our approach and a feasibility study that demonstrates its use on a large-scale software development project in the aerospace domain. We demonstrate that our approach, in addition to meeting the criteria above, can be applied to a real system of reasonable size; can represent a useful and adequate set of rules of relevance in such an environment; and can detect relevant examples of process nonconformance that provide useful insight to the project manager.
Why monitor the process? We begin by assuming that there is a relationship
between the process and the product, i.e., we perform certain processes to assure certain product characteristics. For example, if we expect a system to be safe, we should be analyzing safety hazards, building a hazard tracking system. If we are not performing any of these tasks, then the final product is in risk of not being safe. Or, if we expect a system to be reliable, we might select a set of process such as requirements reviews, design, reviews, code reviews, various testing techniques with the goal of maximizing the reliability of the final system. The set of processes are chosen based upon experience, past history of success, etc. The more evidence we have, the better the chances are that we will achieve success with respect to our goal. So, if we can evaluate whether the process is being followed or not, we have an insight into whether we are at risk of achieving the goals for the project.
The major assumption here is that there is a relationship between the selected processes and the project characteristics. One can argue that in the field of software development, this relationship is not always clear, i.e., we do not always have sufficient evidence that a particular set of processes will yield a particular characteristic. However, testing the expected relationships and building knowledge about the relation between process and product is necessary ingredient of any engineering field. We need to be able to identify and be assured of this relationship. For now, we can say that if a set of processes represents our best understanding about how to achieve the desired system qualities, then not performing the processes correctly presents a risk to the development project. Measuring and monitoring the lack of process conformance in executing the chosen processes provides valuable information about the risk that the final product will not have the specified requirements.
1.1 Process Conformance
Process conformance is a measure of how much the executed process complies with the defined process. In a software project, it is important that "the process which is carried out and observed is the same as the
process intended” [2]. We argue in the next section that in most scenarios we cannot assess the executed process in enough detail to assure that the executed process fully complies with the planned, defined process. However, the weaker form of validation, i.e. the detection of process violations (or process nonconformities), is possible and useful.
1.1.1 Defining and Measuring the Process We can view processes as recipes to guide
developers in order to achieve a consistent level of execution quality. They typically can be divided into activities, tasks, and methods [3] and provide a (partial) order of execution. In some cases this order can be described in natural language, in other cases models and methods exist [4] to express the order in a more formal manner (e.g. flow charts, finite state machines). In order to define a process in all detail multiple, complimentary viewpoints have to be supported by the model and definition [5]. Two example viewpoints are the functional viewpoint that describes the steps that have to be carried out (what is done), and the behavioral viewpoint that defines when and how these steps are performed.
The two main issues with measuring the executed process are: what can we measure and what does it cost to measure it.
First, we may not be able to measure all aspects of a process, especially those activities executed outside the measurement environment, i.e. in the heads of the programmers.
Second, we need to worry about the cost of measuring. Depending on the granularity of the process definition, it can be very costly to collect all process data needed to confirm that the process has been totally conformed. Another concern one have to have in mind is that the more data is collected (e.g. through human effort), the higher the chance to interfere with the measured process itself (e.g. though a Hawthorne effect [6]).
To minimize cost we check only those more critical steps, and more specifically those that can be checked automatically without any human effort. This focuses our attention on where we might use the human effort to check further. Plus, we can provide support for interpreting what we see in both cases. As we will demonstrate, this type of nonconformance checking is both possible and cost effective.
1.1.2 Partial Nonconformance Detection
Our approach to measuring process conformance is to identify a partial set of nonconformities; that is a subset of all occurring process nonconformities. It does

neither require a complete process definition down to the last level of detail, nor a complete set of measurements characterizing all aspects of the process. This allows us to tailor the detection process specifically to the project at hand, i.e., depending on what data is available or can be collected cheaply, how detailed are the processes themselves, where can the greatest insights be achieved. As the feasibility study will demonstrate, even a partial set of nonconformities is rich enough to give the project manager insight into the quality of process execution.
Given the process plan, the detection of nonconformities is done by analyzing a set of intermediate products resulting from the application of the process, and testing whether expected properties hold. Intermediate products can include available code components, schedules, test plans, etc. Tested properties can include items such as completion dates, size, defects detected, and many others. Nonconformities are patterns in the historical data that do not comply with the specified process.
The second step in the approach is to relate nonconformities to risks for not achieving the process’ goal. To do this, we provide a visualization framework that helps users judge if an occurring nonconformity represents a real risk or not. As the feasibility study will show, not all process nonconformities result in an immediate risk. In our opinion it is a necessary step to provide the project manager with sufficient information to make decisions about whether, how, and when to make changes to the software development project (e.g. the process definitions, resources).
2. Related Work
A need for checking process conformance has been widely noted in the field of software process improvement and quality management. Various ISO standards emphasize process conformance: ISO 9000 recommends we "initiate action to prevent the occurrence of any nonconformities relating to product, process and quality system" [7] and ISO 12207 on software life cycle processes states "It shall be assured that those life cycle processes (...) comply with the contract and adhere to the plans."[8].
Further evidence exists, that we cannot assume that processes are executed the way intended. In an empirical study investigating reading techniques conducted by Lanubile and Vissagio [9] the researchers found that "(...) less than one third of Checklist reviewers could be trusted to have used the checklist and one fifth of the PBR reviewers could be trusted to have followed the assigned scenario." They conclude that "This experiment provides evidence that process conformance issues play a critical role in the successful application of reading techniques and more generally,
software process tools." The study was performed in a classroom with students, however there is no good reason - and to our knowledge no empirical evidence - that processes executed in professional environments comply with their definition by default. The feasibility study conducted later in this paper further provides evidence for this claim.
2.1 Process Measurement
As stated in earlier work [2] one crucial requirement to judge process conformance is to observe and measure the process itself, e.g. through observation of programmers or measurement of intermediate versions of the product. Several techniques with different payoffs exist [10]. Cognitive laboratory settings where programmers are constantly observed by multiple researchers through a one sided mirror might give the most insight but are unrealistic to realize in professional settings due to cost and artificiality of the setting. The chance of introducing a Hawthorne Effect [6], in which observees behave differently (e.g. follow a process more closely) because they are observed, is very high in laboratory settings. A less intrusive method is remote monitoring (e.g. by capturing screen content). However this method bears high cost in post analysis and brings along security and privacy issues, e.g. when screen areas are captured with personal information such as email. The third method for collecting process data is taking predefined measurements from various sources ranging from measures reported by the programmers themselves (e.g. effort sheets, questionnaires) to non intrusive collection tools that capture performed actions for a set of applications (e.g. Hackystat [11] and UMDInst[12]) to automatically computed measures based on probes from code repositories and bug tracking systems. This mix of information can give, if wisely chosen, a fair amount of insight. We offer a selection process in the approach section.
2.2 Process Conformance Evaluation
Approaches to detect process violations in the context of software engineering processes have been proposed by Cook and Wolf [13]. Their approach focuses on measuring the distance between a predefined process model and a sequence of events. They use different distance measures including parameterized, weighted distances to account for different severities of violations (i.e. some events are more severe if they are missed than others). Our approach differs in two ways: first we do not require capturing full event sequences (or deriving them from of the historical data), and second we help a human to judge the severity or risk of the nonconformities by providing insight into the collected data. In some sense Cook and Wolf’s approach is more complete in terms of the amount of

nonconformities detected, but also more expensive by requiring the extraction or capturing of all executed events represented in the model. Future work will focus on assessing the completeness and precision to compare this approach to ours.
Another approach to quantify the agreement between the executed process and the planned process is measuring the outputs of the process, namely the quality and time taken, to calculate a deviation vector as presented in [2]. This approach does not take the followed process steps into account, but only the outputs. It is capable of detecting deviations on the functional and behavioral level, even if it is not able to distinguish both. However, there are some drawbacks. First the approach can only be applied after the process execution when results are available, second it requires a good estimate of the expected process output variables, and third it does not give insight into which steps have been violated and therefore provides less information about the causes of the deviations.
3. Proposed Approach
The following section describes the nonconformance and risk assessment approach we developed to find nonconformities in the executed process. Before describing the tasks and techniques used, we derive a set of requirements the approach should satisfy.
3.1 Requirements
As already pointed out earlier, requirements for an approach detecting risks regarding non process conformance include non interference with ongoing processes and ideally minimal overhead for data collection activities.
Another requirement for our approach is the detection of process nonconformities during execution of the process. Previous work focused on validating conformance at the end of the process (e.g. through questionnaires and post data analysis [9]). Detecting and reporting the above stated risks during execution is highly beneficial for the outcome of the project. Early detection and prediction techniques can help to select the according countermeasures to minimize impacts to the schedule and final product quality.
In addition to detecting nonconformities, techniques are needed to assign risks and uncover causes. Simply detecting nonconformities with no insight as to where causes can be found and without judgment of the risk level is of limited use for the project manager who has to make decisions about further steps.
Last, we need to ensure that the knowledge gained in the process can be used in future projects. This includes information starting from the initial set of non conformance detection algorithms and risk definitions chosen at the beginning of the project, to information regarding which risks arise during execution and what impact they have on the goals, and finally to which countermeasures are taken and what impact they have in reducing the risks. Therefore formalization in the form of templates is necessary to collect experience
Table 1: The process conformance template
Process Name A unique identifier.
Process
Description
(Semi) formal description of the process (in a representation of choice).
Process Goal The characteristic the process should improve or ensure on the final product.
Collected Data Enumeration of data sources that are used to detect nonconformance. It should be indicated which of the data sources are collected automatically (or implicitly for other purposes), and which ones do require manual collection efforts.
Nonconformance
Items
A list of situations that do not conform to the process description and can be measured / detected. Description of how the available data sources are used to detect the situations.
Figure 1: Process flow for nonconformance detection and risk assessment approach
(conformance approach)

about the risk assessment. This structured information can then be stored in an experience base [14] to be beneficial for future projects.
3.2 Conformance Process
Based on the requirements defined in the last chapter our proposed non conformance detection and risk assessment approach (in the following sections simply referred to as conformance approach) is specified as a set of steps that accompany the executed processes. Figure 1 shows the conformance approach from a top level view; a precise description for each step is given in the each of the next subsections. We recommend that the necessary steps are executed by a person in an analyst role (or in a small project setting the manager her/himself) to avoid interference with the ongoing processes (performed by the development team) and to avoid a bias of any kind. To help the reader understand the following ideas, we are going to use one process from the feasibility study as an example throughout the description.
3.2.1 Process and Nonconformance Definition
The first step (Figure 1: step 1) is to define the processes intended to execute in some manner. For each process a process conformance template is filled out. An empty template is given in Table 1. The first item to be filled in is a semi formal description of the process. We are not restricted to any specific representation of the process since processes are defined in many different ways. The requirement is solely that in the next step one can define patterns in the collected data that do not comply with the definition. In our feasibility study we used finite state machines (FSM) and lists (Excel spreadsheets) as definitions. One could also think of using less formal descriptions, like unambiguous natural language expressions such as "Every class should have one according testing class at any time," or baselines (e.g. “The number of classes infected with ‘god class’ code smells should not exceed 10% of the system size” [15]). The second field is the goal of the process that describes which quality attributes the process should assure or improve.
Example In our study each developed component was
expected to go through a defined life cycle that can be expressed by the non deterministic FSM given in Figure 2. The life cycle process starts with coding. Once the component is developed successive unit testing and code reviews are applied until no more defects can be found. Developers were asked to report the dates when they finished the testing and review tasks (including fixing the detected defects) for each component. Automatically collected data was provided by the code repository (i.e. CVS 1 ). The states TESTING and REVIEW could be further decomposed. In our example, the granularity of the given model is sufficient for the conformance detection presented in the next sections.
In a second step the analyst extends this template by
specifying a set of non conformance rules. Nonconformance rules are measurable situations that violate the process definition and are the key idea of our approach. To define a set of nonconformance rules the analyst describes patterns appearing in the collected data that do not conform to the process.
Example In our study example, one can imagine many
situations that violate the process definition (FSM). The following (incomplete) enumeration lists some of them:
1. Changes (e.g. modifications, additions,
deletions) to components that already completed the life cycle.
1 http://www.nongnu.org/cvs/
Figure 2: The expected testing and review
process for each component (fd = number of found defects).
2. Omission of one or both of the quality assurance tasks, unit testing and code review.
3. Omission of bug fixing after defects were found. 4. No retesting and re-review after bug fixing. The data collected during process execution
restricts the analyst in the amount of nonconformities that can be checked. In other words, which of the above nonconformities can be detected, and which not, depends on the amount and type of collected data. As an example, checking a nonconformance for item 3 (omission of bug fixing after detecting bugs) was not possible since no data about reported bugs was available for analysis. However, the data provided allows generating nonconformance items for situation 1: If a component is changed in the code repository after it is reported as reviewed and tested (taking the later date of both) then this does not conform to the process definition.
There is a strong relationship between the amount of
possible nonconformance items and the amount of automatically and manually collected data:
The more data collected, the higher the number of possible nonconformities that the analyst can specify and detect.
To decide on the amount and type of collected data a GQM approach [16] can be applied, that is selecting the right measures, based on the most important quality goals, and type of nonconformities the manager is most interested in.
In general, automatically collected data should be favored, especially if the data is already collected implicitly for other purposes (e.g. code repositories, bug tracking systems). The amount of supplementary, manually collected data (e.g. effort and activity sheets, interviews, etc.) should be kept as small as possible. As a rule of thumb, the payoff in these cases (e.g. measured as return on investment) should be high when a nonconformance is found. In other words, the expenses invested in data collection should be lower than the expected expenses caused to fix the effects of the nonconformities.
Last, it is important to have in mind that manual data collection activities should not interfere with the planned process. The concept of non process conformance rules bears a strong analogy to assertions in the methodology of software testing and verification. Both approaches specify predicates (i.e. nonconformance rules) that are checked at run time of the model (i.e. the executed process) to detect violations (i.e. nonconformities) against its specification (i.e. the planned process). Finding a nonconformance item identifies logical inconsistencies in the execution of the process. However, finding no violations does not
guarantee a process execution conform to the specification.
3.2.2 Nonconformance Detection and Judgment
Once the nonconformities are defined, automated
tools can be applied to detect them using the data sources listed in the process definition (Figure 1: step 2). Depending on the granularity of the data collection process, (e.g. daily or weekly commits to the code repository and reporting of self reported data) the detection of nonconformance items can be done over night or on weekends. Automated reports of nonconformities can be used immediately for further analysis.
The next step to be addressed is the judgment of how much risk the detection of a nonconformance bears according to the goal of the process (Figure 1: step 3). Differentiating between different risks is necessary for several reasons:
First, the nonconformance item can express a quantitative measure. In our feasibility study example, nonconformity is reported if at least one class has been changed after the reported testing and review date. Further, the detection algorithm reports for how many classes this applies. If this number is relatively small compared to the total number of classes in the system (e.g. < 1%) the analyst would assign a lower risk than if this would be the case for a major part (e.g. 20%) of the system.
Second, there are situations where a manual inspection can help to improve the risk assessment. To illustrate, the reader should consider again the example given in the previous section. To judge whether the files changed after testing and review pose a threat to correctness, the analyst needs to inspect the source code changes themselves. If these changes are solely changes that do not change the program behavior then they do not pose a threat to the correctness of the program and can be assigned a lower risk or even no risk. Examples for these kinds of changes are modifying documentation, reformatting code without changing the semantics, internal renaming of variables, etc. On the contrary, code modifications changing the behavior are a potential threat and bear a higher risk. If the set of inspected items is too large to be inspected in this manual process a random sample can be drawn to make the judgment with the help of a maximum likelihood estimate.
In order to support the steps we implemented a tool that performs nonconformity detection and helps the analyst to visually investigate the data infected with nonconformities. A detailed description is given in Chapter 5.
After gaining enough insight the analyst can use the results to interview the right developers in order to get a broader understanding why the nonconformities occur. The interview should focus on finding cause-effect relationships and problems with the defined process. As an example, causes of nonconformities in the testing and review process could include:
• Programmers forgot to retest and re-review the code.
• There was not enough time for testing and review.
• Programmers did the retesting and re-review, but the self reported data was not updated after the activity.
• Programmers decided that the changes do not introduce new defects.
• Changes were made by one programmer, but the programmer responsible for testing and review was not informed.
• Programmers deviate from the process because retest and re-review after each change is too cumbersome.
This information will help to construct possible solutions. These are presented to the manager in the next step.
3.2.3 Advice and Rule Improvement
The last two steps (Figure 1: steps 4a and 4b) focus on outputs helpful for the manager and the definition of the nonconformance rules. The first activity (advice) focuses on giving the manager concrete options that will increase the agreement between executed and planned process. The two possible directions are to modify the planned process in a way that it complies more with the executed process, or to find ways to enforce the planned process (e.g. by providing additional resources). The first case can be understood as tailoring the planned process to its execution environment.
The last step in the iterative conformance process is to change the process description and nonconformance detection according to the changes and observations made. It is crucial, for the use of the knowledge in future projects, to record the observations (e.g. nonconformance items and interpretations), the changes to the template (including the reasoning why they were chosen), and the effects observed afterwards.
4. Feasibility Study
An initial feasibility study was performed on data captured during a software development project from an industrial software application. The study demonstrates on the one hand that there is a sufficient amount of nonconformance in the execution of processes in real world examples, and on the other that the approach we
are taking is applicable and powerful enough to uncover real risks in such projects. However, since the nonconformance detection is performed after the project’s lifetime it was not possible to influence the process executions, such as changing processes and reevaluating the impact of the changes.
4.1 Study Context
The development time of the target application from the domain of aerospace was two years and split into four phases. Seven programmers worked on developing the software and were required to deliver a running and tested version (build) at the end of each phase. The final size of the application was 83 000 lines of code distributed over nearly 2000 components (Java classes). The following analysis focuses on the first and second phase of the project.
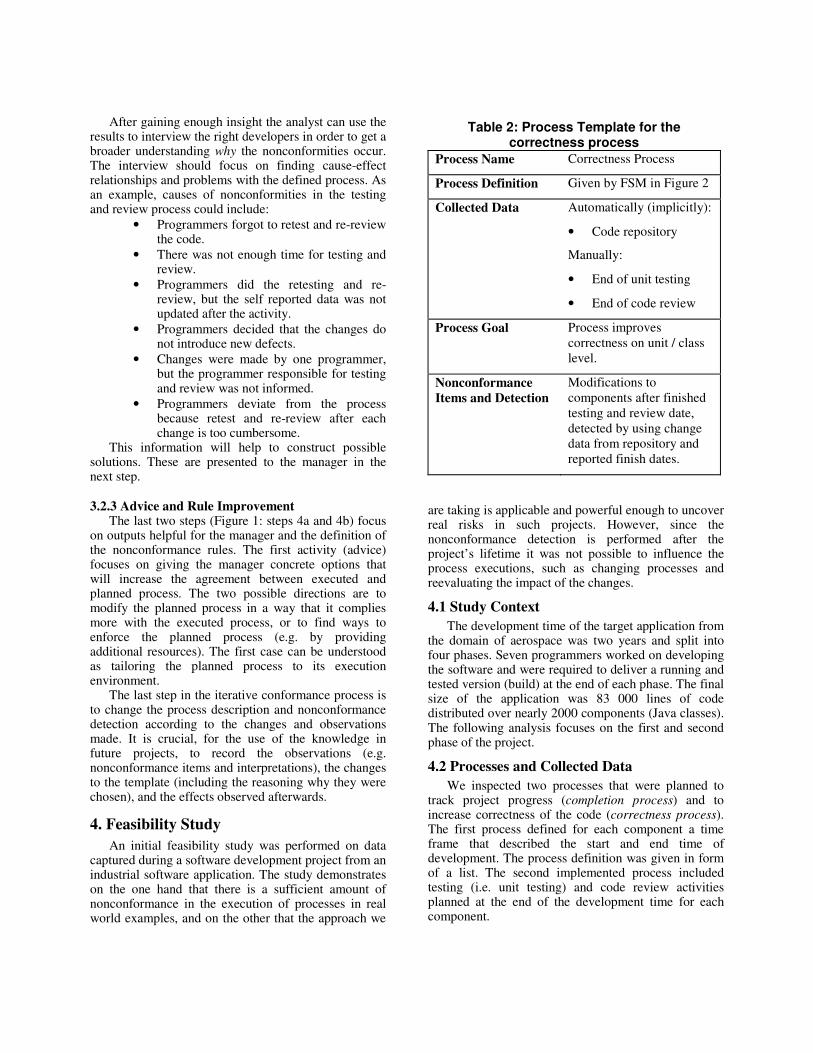
4.2 Processes and Collected Data
We inspected two processes that were planned to track project progress (completion process) and to increase correctness of the code (correctness process). The first process defined for each component a time frame that described the start and end time of development. The process definition was given in form of a list. The second implemented process included testing (i.e. unit testing) and code review activities planned at the end of the development time for each component.
Table 2: Process Template for the correctness process
Process Name Correctness Process
Process Definition Given by FSM in Figure 2
Collected Data Automatically (implicitly):
• Code repository
Manually:
• End of unit testing
• End of code review
Process Goal Process improves correctness on unit / class level.
Nonconformance
Items and Detection
Modifications to components after finished testing and review date, detected by using change data from repository and reported finish dates.
Automatically collected data was gathered through the version control system. Further, programmers had to fill in weekly information about when code review and testing activities (including bug fixing) were completed. Both of these mechanisms were part of the normal work environment at this organization.
We created nonconformance process templates for both processes. The examples given in Chapter 3 already illuminate the generation of nonconformance rules for the correctness process. For completeness, both process templates are given in Table 2 and Table 3.
4.3 Nonconformance Detection and Risk
Assessment
We applied algorithms implementing these nonconformance items on the given data. A description of the developed tool framework for nonconformance detection and visualization is given in Chapter 5. For demonstration we plotted the number of detected nonconformance items for both processes in Figure 3 and
Figure 4. Both graphs show the first months of development.
Both graphs show an increasing number of nonconformance items over time. In the case of process completion the number of delayed classes increases from the beginning on. Further, the amount of unexpected classes (i.e. classes not defined in the plan) is very high: the repository contains more unexpected classes at any time than actually planned and developed
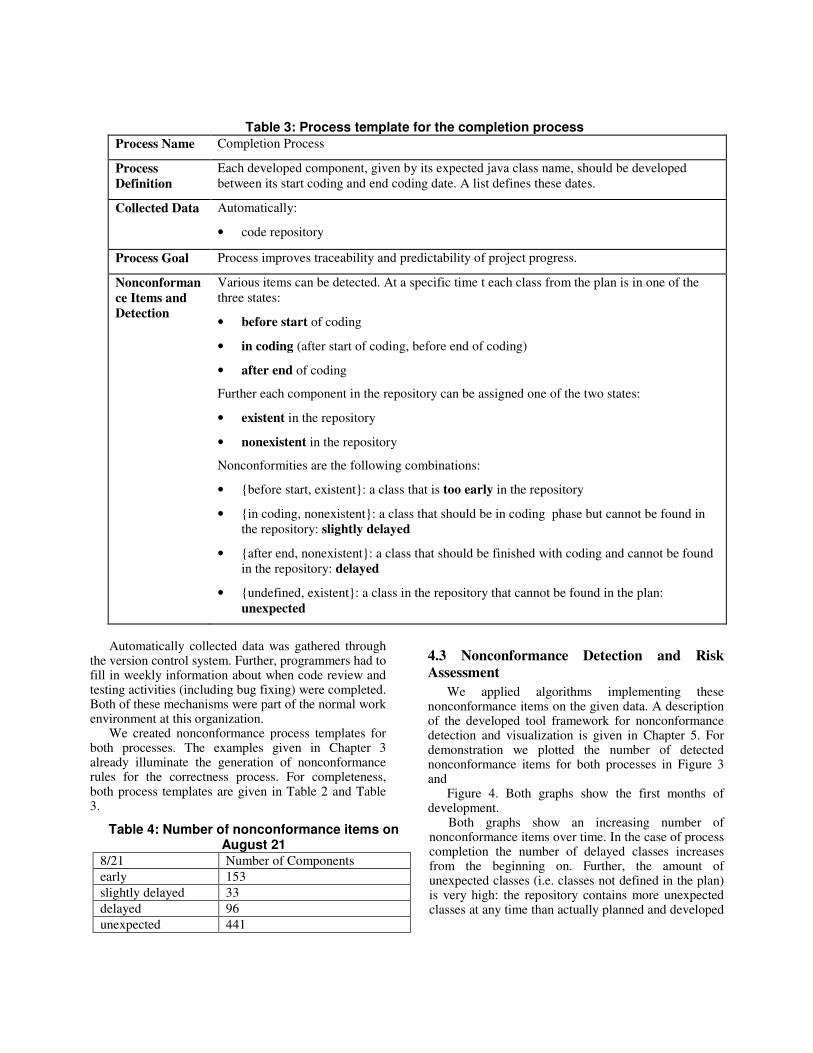
Table 3: Process template for the completion process
Process Name Completion Process
Process
Definition
Each developed component, given by its expected java class name, should be developed between its start coding and end coding date. A list defines these dates.
Collected Data Automatically:
• code repository
Process Goal Process improves traceability and predictability of project progress.
Nonconforman
ce Items and
Detection
Various items can be detected. At a specific time t each class from the plan is in one of the three states:
• before start of coding
• in coding (after start of coding, before end of coding)
• after end of coding
Further each component in the repository can be assigned one of the two states:
• existent in the repository
• nonexistent in the repository
Nonconformities are the following combinations:
• {before start, existent}: a class that is too early in the repository
• {in coding, nonexistent}: a class that should be in coding phase but cannot be found in the repository: slightly delayed
• {after end, nonexistent}: a class that should be finished with coding and cannot be found in the repository: delayed
• {undefined, existent}: a class in the repository that cannot be found in the plan:
unexpected
Table 4: Number of nonconformance items on August 21
8/21 Number of Components
early 153
slightly delayed 33
delayed 96
unexpected 441

classes. The number of classes being developed too early is high in the beginning and decreases; this is logical since these classes fall into the "on time" category once their planned start date is reached.
As for the correctness process, the number of modified components after testing/review increases steadily from September on. In the end of the plotted time period 50 classes were are marked.
To judge the risks posed by the detected items it is necessary to investigate the data closer. This is done on a recurring basis. As example for this paper we picked two fixed dates for demonstration.
4.3.1 Process Completion Risk Judgment
Figure 3 and Table 4 show that after 50% percent of project duration (08/21) of the first phase the number of nonconformance items is already alarming high: To make sense out of these numbers a visualization approach can help to get insight into various aspects of the nonconformities. Our developed tool framework, described in Section 5, maps the detected nonconformance items back to the observed data (i.e. the source code repository). The goal is to give the analyst enough information to either judge the risk immediately, or to give guidance to the developers that have to be interviewed to make a judgment. The visualizations therefore give information about:
• When nonconformities occur: This helps to judge if certain events (such as a change of process) trigger nonconformities, or if the number of nonconformities is (abruptly) increasing, or decreasing.
• Where nonconformities occur: This helps to get insight into the distribution of nonconformities over the population of elements (i.e. source code files), and judge if certain parts (or clusters) of the software are more affected (e.g. packages) than others.
• Who is involved: This helps to find the right developers for further interviews.
The visualization implements these three dimensions in space (when = x axis, where = y axis) and color (color = developer).
Our initial hypothesis by looking at Figure 3 was that the developers were falling more and more behind plan (based on the increase in the number of delayed components) and that the high number of unexpected files can be explained by the import of external libraries that were not defined in the plan.
However, the visual analysis of the four categories showed that all the nonconformance types were distributed fairly uniformly over the number of developers and the parts (packages) of the software system. Further, components marked as unexpected were modified heavily and could be found in almost any of the packages. An example package is visualized in Figure 6. It shows two sudden increases (September
Figure 3: Found nonconformance items for
the completion process. The replanning that was done after end of phase one (10/27)
shows up in the graph as a drop. Further, the graph shows the conform components
(labeled as “on time”): the lower ones are the components already developed according to
plan, the upper ones are the ones not yet developed according to plan.
0200400600800
100012001400160018002000
13-J
un
13-J
ul
13-A
ug
13-S
ep
13-O
ct
13-N
ov
13-D
ec
13-J
an
13-F
ebN
um
ber
of
co
mp
on
en
ts
unexpected early
on time (not yet developed) slightly delayed
delayed on time (developed)
Figure 4: Found nonconformance items for
process correctness: the red fraction represents the number of components modified after a completed testing and
review cycle. The risk of introducing defects into the code is high for these components.
0
50
100
150
200
250
300
350
10-J
ul
24-J
ul
7-A
ug
21-A
ug
4-S
ep
18-S
ep
2-O
ct
16-O
ct
30-O
ct
13-N
ov
27-N
ov
Changed after test/review
Not changed after test/review
Nu
mb
er
of
co
mp
on
en
ts

and October) of unexpected components developed by two programmers. At this time we were able to interview a project participant with our results. The participant explained that the static design of the application (developed in the design phase down to class level) was changed by the programmers during the development. In many cases, bigger classes were broken down into multiple smaller classes. This can explain the amount of delayed classes (big classes) and unexpected classes (smaller classes). The developers did not report those modifications, because the process did not implement this step. Therefore the components in the project plan were never updated with this information.
One might now ask which risks this divergence between the project plan and the actual development implies for the process goal. Remembering the goal of the process (traceability and predictability of project progress) one can argue that the risk is high that the plan cannot provide a precise trace and prediction anymore, because it differs significantly from the system developed in reality.
A second question a project manager would be certainly interested in is: will my project be delayed? This question cannot be answered directly. The developers claim to have implemented the necessary functionality into the split classes of the system. The project plan however, is not defined in terms of functionality – it is therefore impossible to check if the functionality in the unexpected classes sums up to the functionalities in the delayed classes.
It is worthwhile mentioning that in reality the first phase of the project was delayed by two weeks.
4.3.2 Process Correctness Risk Judgment
Figure 4 indicates that the number of components
modified after testing/review increases significantly on October 8th. For each of the 24 nonconformance items the visualization can be used to assess the risk introduced. To demonstrate, we used the visualization features described in Figure 5 to distinguish six kinds of changes. We assigned two different risk levels based on the impact the change can have on program correctness (see also Table 5):
• changing documentation (d) - no risk • code formatting, e.g. changing code indent,
deleting blank lines (no syntactical change) (cf) - no risk
• code rewriting (syntax change, but no semantic change) (cr) - no risk
• add/delete of debugging (e.g. system.out.print) statements (so) - no risk
• semantic code changes (sc) - high risk
• addition of new functionality (af) - high risk • deletion of functionality (df) - high risk The last three categories pose a threat to correctness
since these kinds of changes require retesting and re-reviewing the component. After finding risk items the manager might be interested in the reasons for these late modifications. Therefore, the analysis keeps track of the names of the programmers performing the changes to guide interview sessions.
In cases where a complete manual inspection of all affected files is too costly, the analyst might either want to draw a random sample from the set of affected components in order to estimate the total number of high risk items, or focus on the ones that are promise to pose a high risk first. In later case, the relative code churn measured after the testing/review date can be helpful to guide to these components [17]. Table 5 shows an excerpt of the risk judgment for October 8th.
The analysis showed that more than half of the nonconformance items included dangerous changes. The risk that the correctness process will not achieve its optimal performance is certainly elevated by these items.
4.3.3 Advice and Rule Improvement
Since the investigated project was not observed at development time (but a-posteriori) we did not have the
Table 5: Risk assessment for a random selection of nonconformance items. For
each component the types of changes are listed (“+” mean the type is present). Five
components (a,b,f,g,h) include change types with high risk. The churn measure
shows how much lines of code relative to the T/R (test/review) date was changed,
e.g. 50% means that half the of lines were changed.
Component d cf
cr
so
s
c
a
f
d
f
Churn (%)
Comp_a + + + + + 30
Comp_b + + + + + + 698
Comp_c + 4
Comp_d + + 2
Comp_e + 2
Comp_f + + + 12
Comp_g + + + 3
Comp_h + + 35
chance yet to give advice directly to the manager and to measure the impact on the nonconformities and risks. However, if we would have the chance then we would have advised to tailor the completion process to account for design changes during the development time of the project. Further we would advise to retest and review the detected and analyzed classes that pose a risk to correctness in later states of the development phase.
As rule improvements, one can think of further optimizing the detection algorithms for the correctness process: they could eliminate more false positives by checking for the type of changes automatically in most cases (documentation changes, code formatting changes, and debugging changes).
5. Tool Framework
In order to detect nonconformities and to assess risks we built a tool (CodeVizard) that is capable of gathering, mining, and visualizing information from source control repositories (such as CVS and Subversion2).
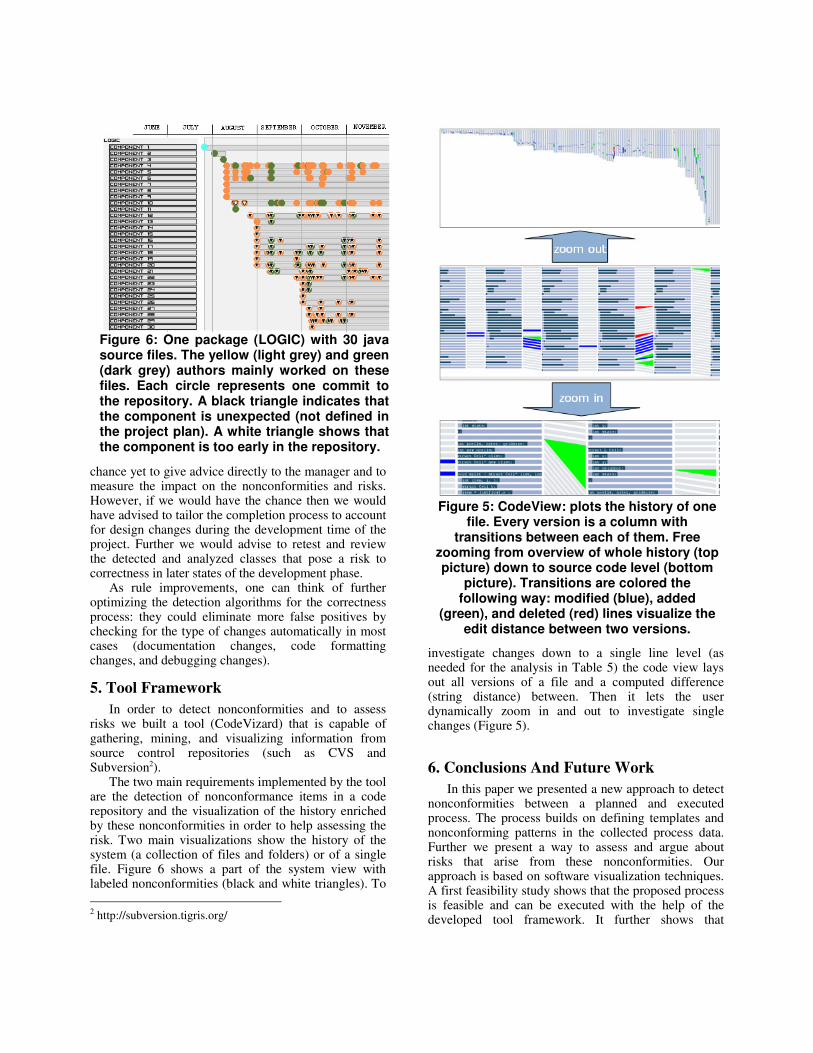
The two main requirements implemented by the tool are the detection of nonconformance items in a code repository and the visualization of the history enriched by these nonconformities in order to help assessing the risk. Two main visualizations show the history of the system (a collection of files and folders) or of a single file. Figure 6 shows a part of the system view with labeled nonconformities (black and white triangles). To
2 http://subversion.tigris.org/
investigate changes down to a single line level (as needed for the analysis in Table 5) the code view lays out all versions of a file and a computed difference (string distance) between. Then it lets the user dynamically zoom in and out to investigate single changes (Figure 5).
6. Conclusions And Future Work
In this paper we presented a new approach to detect nonconformities between a planned and executed process. The process builds on defining templates and nonconforming patterns in the collected process data. Further we present a way to assess and argue about risks that arise from these nonconformities. Our approach is based on software visualization techniques. A first feasibility study shows that the proposed process is feasible and can be executed with the help of the developed tool framework. It further shows that
Figure 6: One package (LOGIC) with 30 java source files. The yellow (light grey) and green (dark grey) authors mainly worked on these files. Each circle represents one commit to the repository. A black triangle indicates that the component is unexpected (not defined in the project plan). A white triangle shows that the component is too early in the repository.
Figure 5: CodeView: plots the history of one file. Every version is a column with
transitions between each of them. Free zooming from overview of whole history (top picture) down to source code level (bottom
picture). Transitions are colored the following way: modified (blue), added
(green), and deleted (red) lines visualize the edit distance between two versions.
differences between the planned and executed process occur in even in very process-driven industrial development environments and that (at least a meaningful subset) of them can be found with the approach.
Further our approach satisfies the requirement of mainly building on automatically collected data. The examples in the posterior study used mostly data that was collected for version control. Finally we show that with our approach and this kind of data it was possible to find deviations right from the start of the planned processes and continuously during their execution.
Having shown the feasibility of our approach, we are working now on working with ongoing development projects and providing the output of our approach in a more timely way. This will better allow us to test whether the nonconformities that we find are useful for monitoring the project in an ongoing way. This work will also allow us to compare the cost, coverage, and precision of our approach to more typical work practices.
7. Acknowledgment
This research was supported in part by NSF grant CF0438933, "Flexible High Quality Design for Software" to the University of Maryland. The authors would like to thank Daniela Cruzes, Steffen Olbrich, and Frank Herman for their contributions to this work.
8. References
[1] Werth .“Lecture Notes on Software Process
Improvement” by Laurie Honour Werth, document number CMU/SEI-93-EM-8, copyright 1993 by Carnegie Mellon University. http://www2.umassd.edu/SWPI/curriculummodule/em8.part1.pdf
[2] S. Sørumgård. “Verification of Process Conformance in Empirical Studies of Software Development”. Ph.D. thesis, Norwegian University of Science and Technology, 1997.
[3] Marvin V. Zelkowitz and Dolores Wallace. Experimental Models for Software Diagnosis. Technical report NISTR 5889, September 1996.
[4] A. Finkelstein, J. Kramer, B. Nuseineh (eds.). Software Process Modeling. John Wiley RSP, 1994.
[5] Kellner, M. I. 1988. Representation formalisms for software process modelling. In Proceedings of the 4th international Software Process Workshop on Representing and Enacting the Software Process (Devon, United Kingdom). C. Tully, Ed. ACM, New York, NY, 93-96.
[6] Roethlisberger, Fritz J., and W. J. Dickson. Management and the Worker. Harvard University Press, 1939.
[7] Quality systems - Model for quality assurance in design, development, production, installation and servicing. International Organization for Standardization, 1993.
[8] Information Technology - Software life cycle processes. International Organization for Standardization, 1995.
[9] Lanubile, F. and Visaggio, G., “Evaluating Defect Detection Techniques for Software Requirements Inspections”, ISERN Report no. 00-08, 2000.
[10] Silva, L.F.S.; Travassos, G.H., "Tool-supported unobtrusive evaluation of software engineering process conformance," Empirical Software Engineering, 2004. ISESE '04. Proceedings. 2004 International Symposium on , vol., no., pp. 127-135, 19-20 Aug. 2004
[11] Johnson, P.M.; Hongbing Kou; Agustin, J.M.; Qin Zhang; Kagawa, A.; Yamashita, T., "Practical automated process and product metric collection and analysis in a classroom setting: lessons learned from Hackystat-UH," Empirical Software Engineering, 2004. ISESE '04. Proceedings. 2004 International Symposium on , vol., no., pp. 136-144, 19-20 Aug. 2004
[12] Lorin Hochstein, Taiga Nakamura, Forrest Shull, Nico Zazworka, Victor R. Basili, Marvin V. Zelkowitz “An Environment for Conducting Families of Software Engineering Experiments”, Advances in Computers (ed. by Marvin Zelkowitz), Vol. 74, ElseVier, 2008
[13] Cook, J. E. and Wolf, A. L. 1998. Discovering models of software processes from event-based data. ACM Trans. Softw. Eng. Methodol. 7, 3 (Jul. 1998), 215-249.
[14] Basili, V., Caldiera, G., and Rombach, D. Experience Factory. Encyclopedia of Software Engineering Volume 1:469-476, Marciniak, J. ed. John Wiley & Sons, 1994
[15] M. Fowler. Refactoring: Improving the Design of Existing Code. Addison-Wesley, 1999.
[16] Basili, V. R. 1992 Software Modeling and Measurement: the Goal/Question/Metric Paradigm. Technical Report. University of Maryland at College Park.
[17] Nagappan, N.; Ball, T., "Use of relative code churn measures to predict system defect density," Software Engineering, 2005. ICSE 2005. Proceedings. 27th International Conference on , vol., no., pp. 284-292, 15-21 May 2005
Related Documents