Too Many Asian Americans: Affirmative Discrimination in Elite College Admissions Althea Nagai, Ph.D. Research Fellow Center for Equal Opportunity Linda Chavez, Chairman Roger Clegg, President & General Counsel 7700 Leesburg Pike, Suite 231 Falls Church, VA 22043 Phone 703-442-0066 Fax 703-442-0449 www.ceousa.org EMBARGOED UNTIL MAY 22, 2018

Welcome message from author
This document is posted to help you gain knowledge. Please leave a comment to let me know what you think about it! Share it to your friends and learn new things together.
Transcript

Too Many Asian Americans: Affirmative Discrimination in Elite College Admissions
Althea Nagai, Ph.D. Research Fellow
Center for Equal Opportunity
Linda Chavez, Chairman Roger Clegg, President & General Counsel 7700 Leesburg Pike, Suite 231 Falls Church, VA 22043 Phone 703-442-0066 Fax 703-442-0449 www.ceousa.org
EMBARGOED UNTIL
MAY 22, 2018

i
Table of Contents Executive Summary ............................................................................................................. 1Acknowledgments ............................................................................................................... 3Introduction ......................................................................................................................... 4
The Asian American Population Explosion .................................................................... 6Asian American Enrollment ............................................................................................ 7
Caltech and MIT .................................................................................................................. 9Racial/Ethnic Composition, Fall 2016 ............................................................................ 9Trends in Enrollment ..................................................................................................... 10
And Then There’s Harvard ................................................................................................ 13Comparing Racial & Ethnic Groups: Espenshade & Radford’s Findings ........................ 15
Applicants with High SAT Scores by Race and Ethnicity ............................................ 16The Role of Extracurricular Activities .......................................................................... 18The “Softer” Factors ...................................................................................................... 19
The Consequences of Holistic Admission ......................................................................... 19Appendix A. Categories of Race and Ethnicity ................................................................. 21Appendix B. Public Universities ....................................................................................... 21
List of Figures Figure 1. Asian American Population (in Thousands) ........................................................ 6Figure 2. Asian American Undergraduate Enrollment Over Time ..................................... 7Figure 3. Asian Americans’ Steep & Steady Rise at Caltech ............................................ 11Figure 4. A Ceiling on Asian Americans at MIT .............................................................. 12Figure 5. The Sharp Rise of and the Ceiling on Asian Americans at Harvard .................. 13Figure 6. Admission Rate by Race at Private Elite Universities for Those with SATs from
1400 to 1600 .............................................................................................................. 17
List of Tables Table 1. Racial-Ethnic Composition of Undergraduates, Caltech & MIT, Fall 2016 ....... 10Table 2. Admission Rates by Race at Elite Private Institutions, Fall 1997 ....................... 15Table 3. Undergraduate Admission Rate by SAT, at Elite Schools .................................. 16

1
Executive Summary
Asian Americans are “overrepresented” in certain elite schools relative to their numbers in the U.S. population. In pursuit of racial and ethnic diversity, these schools will admit some Asian American applicants but not as many as their academic qualifications would justify. As a case study, I examine three private universities and Asian American enrollment in those universities over time.
No “Ceiling” on Asian Americans at Caltech But One at MIT and Harvard
• Caltech has no affirmative action. The number of Asian American undergraduates hasincreased, quite steeply since 2000. They make up more than 40% of Caltech studentstoday.
• MIT uses race as a factor in admissions, but not legacy connections. The rise innumber of Asian Americans at MIT is halted in the 1990s. Peaking at 29%, thepercentage of Asian Americans at MIT has stalled at around 26%.
• At Harvard, Asian Americans as a percentage of all undergraduates sharply increasedto 21%, then significantly dropped and has stayed at roughly 17%. Harvard uses raceas a factor in admissions, along with legacy connections.

2
• Even when statistically controlling for other variables including social class, gender, extracurricular activities, test scores and grades, AP classes, and athletics, Asian American applicants were less likely to be admitted to America’s elite colleges and universities compared to whites, African Americans, and Hispanics, according to scholars Thomas J. Espenshade and Alexandria Walton Radford of Princeton University.
• So-called holistic admissions and diversity goals enable discrimination against Asian
American applicants, much as the Harvard plan of the 1920s, also using holistic admissions, did against Jewish applicants.
3
Acknowledgments
I would like to thank Linda Chavez and the staff at the Center for Equal Opportunity for giving me the chance to work on this essay on Asian Americans and elite university and college admissions.
I especially want to thank Terry Eastland, for his close reading and numerous
comments. I also want to thank Rudy Gersten and Roger Clegg for suggestions and critique
of the manuscripts.

4
Introduction
Americans have long recognized that elite universities and colleges play a critical role in making it to the top of American society. A “big name” college degree, say from Harvard or Princeton, signals that one has been “approved” to enter the American elite. Such degree signaling does not guarantee entry, but it is definitely a big help. Yet because most elite schools use race and ethnicity as a factor in deciding whom to admit, their admissions procedures are often hotly debated.
In this context, many Asian Americans1 believe there is an admissions “ceiling” at
some of our most competitive universities. This ceiling, in their view, limits the number of seats for which Asian American applicants may compete, and thus denies entry to Asian Americans who otherwise would be admitted, but for the fact they are of the “wrong race.”
This belief is so prevalent among young, ambitious Asian Americans that many
try to hide their identity when applying. Aaron Mak, a Chinese American student at Yale, admitted, “[T]hat effort . . . involved erasing it in order to appear white, or at least less Asian.”2 Mak wrote two personal essays, one on living with his immigrant Chinese grandfather for the University of California schools, where race is not a factor in admissions. The other essay for Yale made no mention of his ethnic roots. For Yale, he declined to check the race/ethnicity box, he picked a major that ran counter to stereotype, and he stayed away from activities associated with Asian Americans, spending time on other matters. “I quit piano, viewing the instrument as a totem of my race’s overeager striving in America. I opted to spend much of my time writing plays and film reviews—pursuits I genuinely did find rewarding but which I also chose so I wouldn’t be pigeonholed.”3
Concern about discrimination in admissions against Asian Americans goes
beyond the ethnic community. The 2006 National Association for College Admission Counseling annual meeting held a session titled, “Too Asian?” Panelists noted that teachers, counselors, and admissions officers tended to see Asian Americans as a group rather than as individuals,4 and that admissions consultants advised Asian American clients to choose extracurricular activities and prospective majors that worked against
1 “Asian Americans” refer to persons with ancestry from East Asia, Southeast Asia, and the Indian subcontinent. See Appendix A, Defining Race and Ethnicity. 2 Aaron Mak, “The Price of Admission: Asians Shouldn’t Have to Hide Their Heritage When Applying to College. I Did—and I’ll Always Regret It.” Slate, December 5, 2017. http://www.slate.com/articles/life/education/2017/12/the_price_of_college_admission_for_asian_americans.html 3 Mak, “The Price of Admission: Asians Shouldn’t Have to Hide Their Heritage.” 4 Dave Barry, “Asian Admission Angst,” College Confidential, n.d. https://www.collegeconfidential.com/admit/asian-admissions-angst/
5
stereotype, as Aaron Mak did. The Princeton Review said having an Asian last name might be a disadvantage for an Asian American applicant.5 Getting around “being Asian,” as another admissions official put it, had become an admissions strategy by 2006 and is all the more so one today, with countless blogs on college admissions full of discussions about what an Asian American should do in order to get in where.6
Almost a century ago, A. Lawrence Lowell, president of Harvard, introduced a
new approach to admissions called “the Harvard Plan.” Thus, the college would now consider, in addition to academic qualifications, nonacademic factors—e.g., where a student grew up, extracurricular activities, personal interviews, teachers’ letters of recommendation, and the like.7
Many years later, in the 1979 landmark Bakke case on affirmative action, Justice
Lewis Powell hailed the Harvard plan, tweaked over the years but still in operation at the school today and since. Over the years it has been adopted in key respects by many elite schools. Often called an “holistic” approach to admissions, it has enabled schools to affirmatively discriminate against members of a racial or ethnic group in order to admit less qualified applicants, ostensibly to achieve “diversity.” Notably, when the Harvard plan was put in place, a school representative said the university hoped to reduce “their 25% Hebrew total to 15%.”8
Asian Americans believe they are “the new Jews”—the racial group that today
encounters a ceiling on their prospects for admission.9 In 2014, the Students for Fair Admissions (SFFA) filed suit against Harvard College, claiming that it discriminates against Asian Americans by holding them to higher academic standards than members of other racial and ethnic groups, including whites.10 The same case could be made against many other elite universities and colleges, private and public.
5 “The Harvard Plan That Failed Asian Americans,” Harvard Law Review, 131, December 7, 2017, p. 604, note 8. https://harvardlawreview.org/2017/12/the-harvard-plan-that-failed-asian-americans/ 6 “Asians Have a Harder Time Getting into a Top College? Is It Because of Affirmative Action?” College Confidential, February 25, 2016. https://talk.collegeconfidential.com/college-admissions/1865113-asians-have-a-harder-time-getting-into-a-top-college-is-it-because-of-affirmative-action.html. 7 Martha Graham Synnott, The Opened Door: Discrimination and Admissions at Harvard, Yale, and Princeton, 1900-1970, With a New Introduction by the Author (New Brunswick, NJ: Transaction Publishers, 2010); Jerome Karabel, The Chosen: The Hidden History of Admission and Exclusion at Harvard, Yale, and Princeton (Boston, MA: Houghton, Mifflin and Company, 2005), p. 77-109. 8 Quoted in Synnott, p. 110. 9 Daniel Golden and Ron Unz have amassed a wealth of interviews (Golden) and data (Unz) supporting the point. Daniel Golden, The Price of Admission: How America's Ruling Class Buys Its Way Into Elite Colleges—and Who Gets Left Outside the Gates (New York, NY, US: Crown Publishing Group/Random House, 2006); Ron Unz, “The Myth of American Meritocracy: Are Elite University Admissions Based on Meritocracy and Diversity as Claimed?” The American Conservative, November 28, 2012. http://www.unz.com/runz/the-myth-of-american-meritocracy/. 10 Students for Fair Admissions, Inc. v. President & Fellows of Harvard College, 308 F.R.D. 39 (D. Mass, 2015) (No. 14-cv-14176), http://samv91khoyt2i553a2t1s05i-wpengine.netdna-ssl.com/wp-content/uploads/2014/11/SFFA-v.-Harvard-Complaint.pdf. One Asian American member of SFFA graduated first in his class, had a perfect ACT score of 36, was a National Merit semifinalist, captain of the
6
This essay examines whether Asian American applicants, like Jewish applicants
in the early twentieth century, are regularly passed over for less academically qualified applicants. I begin by presenting enrollment data trends for three extremely selective schools—Caltech, MIT, and Harvard. Harvard uses legacy status and race/ethnicity as two factors in admission. MIT employs race/ethnicity as a factor but not legacy status, while Caltech uses neither. Comparing these schools shows in detail how the ceiling limits Asian American enrollment.
I then examine the statistical evidence regarding Asian American enrollment at
America’s elite private universities, summarizing findings in Espenshade and Radford’s extensive statistical study—findings that are ignored save for one, the frequently-cited 140 extra SAT points needed by Asian Americans to have the same chance of admission as white applicants.
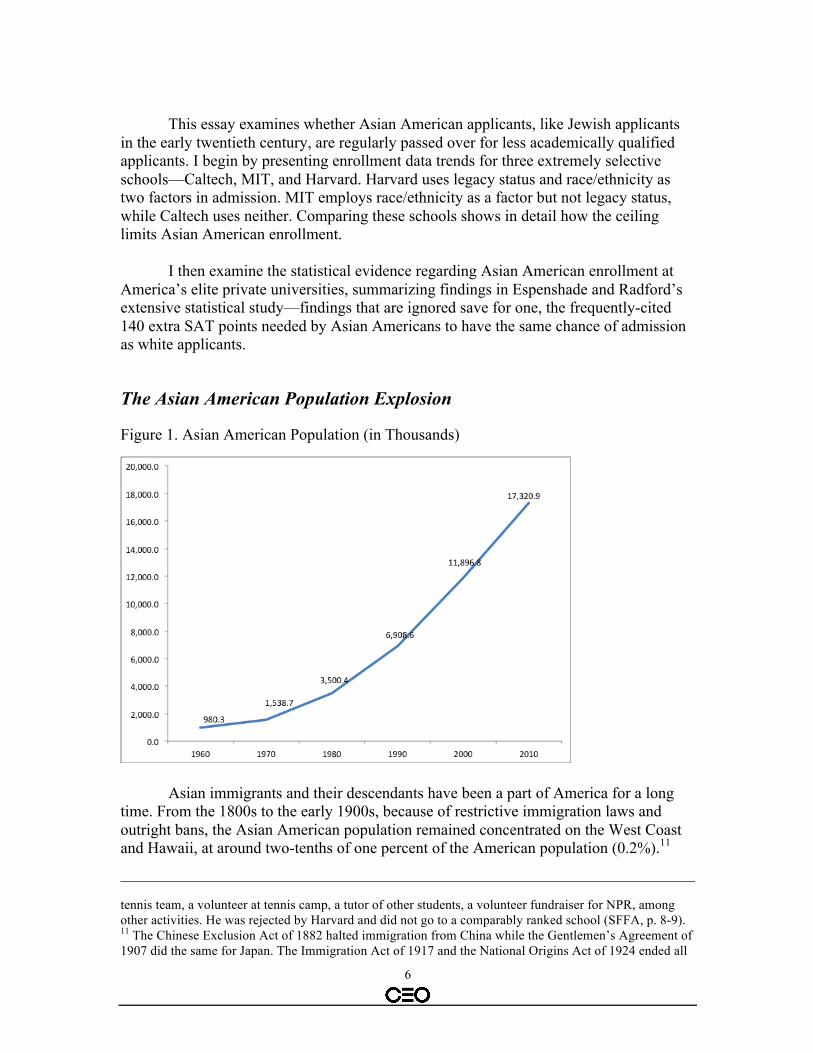
The Asian American Population Explosion
Figure 1. Asian American Population (in Thousands)
Asian immigrants and their descendants have been a part of America for a long time. From the 1800s to the early 1900s, because of restrictive immigration laws and outright bans, the Asian American population remained concentrated on the West Coast and Hawaii, at around two-tenths of one percent of the American population (0.2%).11
tennis team, a volunteer at tennis camp, a tutor of other students, a volunteer fundraiser for NPR, among other activities. He was rejected by Harvard and did not go to a comparably ranked school (SFFA, p. 8-9). 11 The Chinese Exclusion Act of 1882 halted immigration from China while the Gentlemen’s Agreement of 1907 did the same for Japan. The Immigration Act of 1917 and the National Origins Act of 1924 ended all

7
After immigration reform, the Asian American population has grown exponentially. In 1960, it was roughly 980,000. By 2010, that number had increased more than ten-fold, past 17 million.12
With an increase in population has come an increase in the numbers going to
college.
Asian American Enrollment
Figure 2. Asian American Undergraduate Enrollment Over Time13
In 1960, approximately 16,000 Asian Americans were attending college. That number rose to 60,000 in 1970 and reached almost 250,000 in 1980. Since then the number of Asian Americans in college has more than quadrupled, to more than a million in 2015 (see Figure 2 above).
immigration from Asia. See summary of individual pieces of legislation on the History Channel’s website, for example, History Channel, “Chinese Exclusion Act,” https://www.history.com/topics/chinese-exclusion-act. 12 The summary statistics are generated from the U.S. Census. “Asian” combines Chinese, Japanese, “Other Asian/Pacific Islander,” and those of mixed racial/ethnic heritage that includes Asian. See IPUMS USA, “U.S. Census Data for Social, Economic, and Health Research.” https://usa.ipums.org/usa/ 13 IPUMS USA, “U.S. Census Data for Social, Economic, and Health Research;” National Center for Education Statistics, “Table 306.10. Total Fall Enrollment in Degree-Granting Postsecondary Institutions, By Level of Enrollment, Sex, Attendance Status, and Race/Ethnicity of Student: Selected Years, 1976 Through 2015,” Digest of Education Statistics, October 2016. https://nces.ed.gov/programs/ digest/d16/tables/dt16_306.10.asp

8
Given those developments, one might expect to see a steep rise in the number of Asian Americans applying to and enrolled at America’s elite schools. This has happened at some places, but not as much at certain colleges and universities.
The question is why. My argument is that there is a limit, a ceiling on how many
Asian American applicants a school will admit. The New York Times has shown that whites and especially Asian Americans in elite universities are “overrepresented” compared to their percentage of the U.S. college age population. In contrast, blacks and Hispanics are “underrepresented.” While the college-age population of blacks and Hispanics has grown substantially, Hispanic freshman enrollment at elite schools has grown at a slower pace. And black freshman enrollment at elite schools has remained flat.14 For the sake of diversity, the argument goes, race must be used as a factor in admissions. And as a result, Asian Americans who would be admitted but for the ceiling have been discriminated against, certainly as a matter of fact, and most likely in a way that is not consistent with the constraints on such discrimination that the Supreme Court has established.
To summarize: the number of Asian Americans at certain elite institutions has
remained steady or somewhat declined over the past 20 years. This appears at least in part to be a function of holistic admissions and a school’s diversity goals, which entails the use of negative racial preferences against Asian Americans. This type of preference stands in contrast to a positive racial preference, or what is generally meant by racial preferences. With the latter, preferences are of sufficient size to boost the chances of otherwise less competitive applicants of certain races and ethnicity and admit them. With negative racial preferences, the process works in the other direction, effectively subtracting some degree of academic achievement from the applications of Asian Americans, making them less competitive and often denying them admission. (Preferences can also work to increase the chances of an athlete or one with legacy, donor, or celebrity ties.)
I shall contrast two similar elite private schools to show what I mean by negative
racial preferences against Asian Americans—the California Institute of Technology (Caltech) and the Massachusetts Institute of Technology (MIT). I then look at Harvard, where legacy admissions play an important role alongside race as a factor (it has been
14 The Times ignores the academic gap between blacks and Hispanics compared to whites and Asians, in terms of test scores, AP scores, high school grade point averages, high school class rank and other measures of academic qualifications. But the piece does acknowledge 1) that black and Hispanic underrepresentation is often due to inadequate academic preparation (e.g., lack of good teachers and counselors, no advanced courses, inadequate supplemental materials), starting from elementary school; 2) that affirmative action is no magic bullet; and 3) that blacks and Hispanics “have gained ground at less selective colleges and universities.” The article recognizes in passing that “the growth of Asian enrollment has slowed at some schools.” Jeremy Ashkenas, Haeyoun Park, and Adam Pearce, “Even with Affirmative Action, blacks and Hispanics are More Underrepresented at Top Colleges than 35 Years Ago,” New York Times, August 24, 2017. https://www.nytimes.com/interactive/2017/08/24/us/affirmative-action.html

9
noted that 30% of the first-year class at Harvard have legacy ties). The statistics cover the period from 1980 to 2016.15
Caltech and MIT
Caltech and MIT are ranked in the top 10, according to the latest US News ranking of national universities.16 Noted internationally for an emphasis on science, technology, engineering, and mathematics (STEM), Caltech and MIT admit roughly eight percent of applicants. MIT, in the Northeast, and Caltech, in southern California, are areas with large numbers of Asian Americans. MIT has more undergraduates (4,524 versus 979 in Fall 2016) and offers more undergraduate majors.
Neither MIT nor Caltech use legacy status as a factor in admissions, defined as
having at least one parent graduated with a bachelor’s degree from the institution.17 But Caltech, unlike Harvard and MIT, does not employ race and ethnicity as a factor either.
Here I will use Caltech as the basis for comparison—what a school looks like
when it has no legacy preferences and does not impose a ceiling on the number of Asian Americans admitted.
Racial/Ethnic Composition, Fall 2016
The table below displays the racial/ethnic composition of the undergraduate student body for Caltech and MIT in Fall 2016.
15 Data and statistics for individual institutions such as Caltech, MIT, and Harvard are available via the National Center for Education Statistics (US Education Department) only from 1980. Statistics from 1980 to 2011 are also in Appendix C, Racial and Ethnic Enrollments at Elite Universities, in Ron Unz, “The Myth of American Meritocracy: Quantitative Sources and Methods,” The American Conservative, November 21, 2012. http://www.unz.com/supplement/meritocracy-appendices/ 16 Descriptions of the universities are also provided on the U.S. News website. U.S. News & World Report, “ National Universities Rankings,” September 12, 2017. https://www.usnews.com/best-colleges/rankings/national-universities. 17 Those admitted with legacy connections or those selected by the university’s development office because of their parent’s celebrity or wealth were more likely to enroll (i.e., to provide a high “yield rate”). According to one former admission officer at Duke University, this is due to their academic qualifications being significantly lower and not being admitted to comparable schools where they had no connections. See Thomas J. Espenshade and Alexandria Walton Radford, No Longer Separate, Not Yet Equal: Race and Class in Elite College Admission and Campus Life (Princeton, NJ: Princeton University Press, 2009) p. 77-78.

10
Table 1. Racial-Ethnic Composition of Undergraduates, Caltech & MIT, Fall 201618
Caltech MIT AfrAm 1% 6% Hispanic 12% 15% Asian Am 43% 26% White 29% 35% Foreign 9% 10% Other 6% 9%
Asian Americans. At Caltech, which, as noted, has no legacy or affirmative
action admittees, Asian Americans make up a much larger percentage of the student body than they do at MIT. In fact, they make up the largest racial/ethnic group on campus—43% of undergraduates at Caltech are Asian American, compared to 26% at MIT.
Underrepresented Minorities. Affirmative action at MIT results in a larger
percentage of underrepresented minorities (URMs) at MIT. African Americans make up one percent of those at Caltech versus six percent of students at MIT. Some 12% of students at Caltech are Hispanic versus 15% at MIT.
Whites. The largest difference is in the percentage of white students. Making up
the second largest racial/ethnic group, 29% of those enrolled at Caltech are white—14 points less than the Asian American students (43%). In contrast, whites are the largest racial group at MIT (35%) and are 9 points larger than the percentage of Asian Americans (26%). But note that they do not make up half or more of MIT undergraduates.
Trends in Enrollment
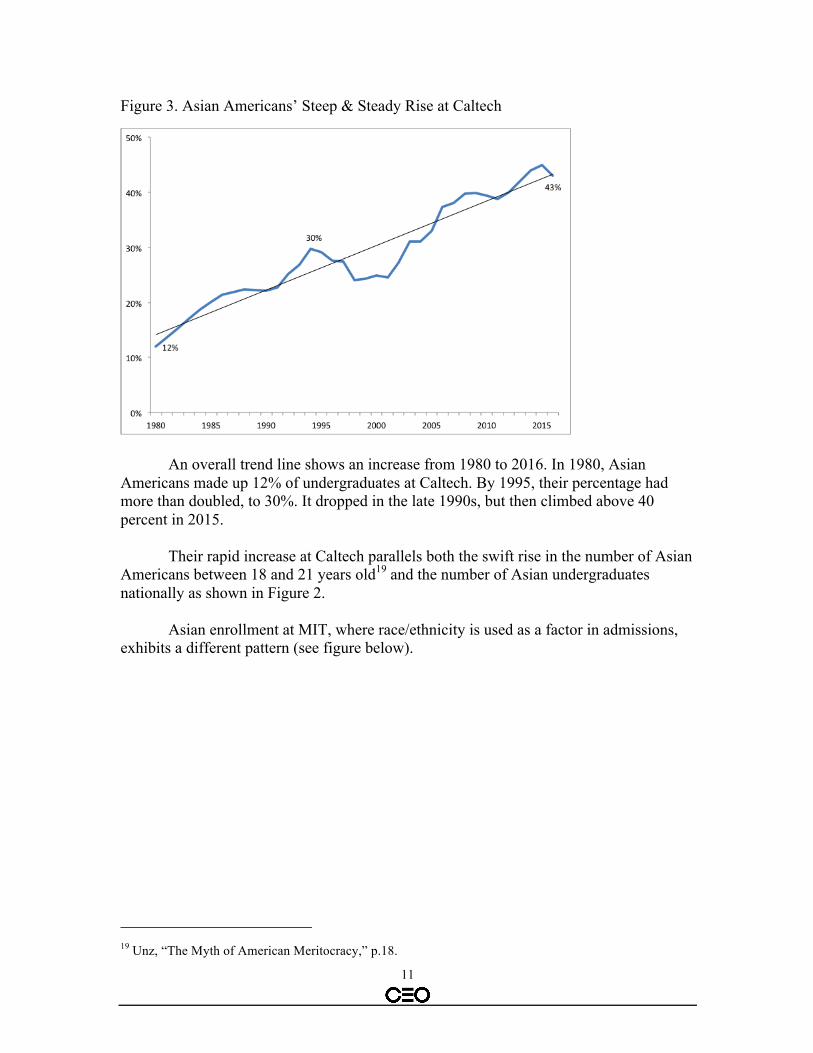
The pattern of Asian American enrollment differs between the two schools. At Caltech, Asian Americans as a percentage of the student body rose steadily from the 1980s (see Figure 3 below).
18 Calculated from National Center for Education Statistics, U.S. Dept. of Education, “California Institute of Technology” and “Massachusetts Institute of Technology,” College Navigator, Fall 2016. https://nces.ed.gov/collegenavigator/?q=California+Institute+of+Technology&s=all&id=110404; https://nces.ed.gov/collegenavigator/?q=Massachusetts+Institute+of+Technology&s=all&id=166683
11
Figure 3. Asian Americans’ Steep & Steady Rise at Caltech
An overall trend line shows an increase from 1980 to 2016. In 1980, Asian Americans made up 12% of undergraduates at Caltech. By 1995, their percentage had more than doubled, to 30%. It dropped in the late 1990s, but then climbed above 40 percent in 2015.
Their rapid increase at Caltech parallels both the swift rise in the number of Asian
Americans between 18 and 21 years old19 and the number of Asian undergraduates nationally as shown in Figure 2.
Asian enrollment at MIT, where race/ethnicity is used as a factor in admissions,
exhibits a different pattern (see figure below).
19 Unz, “The Myth of American Meritocracy,” p.18.

12
Figure 4. A Ceiling on Asian Americans at MIT
The overall trend line is non-linear. It shows a sharp increase then a gradual
decline. In 1980, 5% of undergrads at MIT were Asian Americans. Asian Americans formed an increasing larger percentage of MIT undergraduates until the mid-1990s, reaching a peak of 29% in 1995. But then Asian American enrollment tapers off and gradually declines.
On the whole, the Asian American proportion of undergraduates at MIT has
stayed under 30 percent. Is there an upper limit here? And if so, is that by design? An act of affirmative discrimination?
13
And Then There’s Harvard
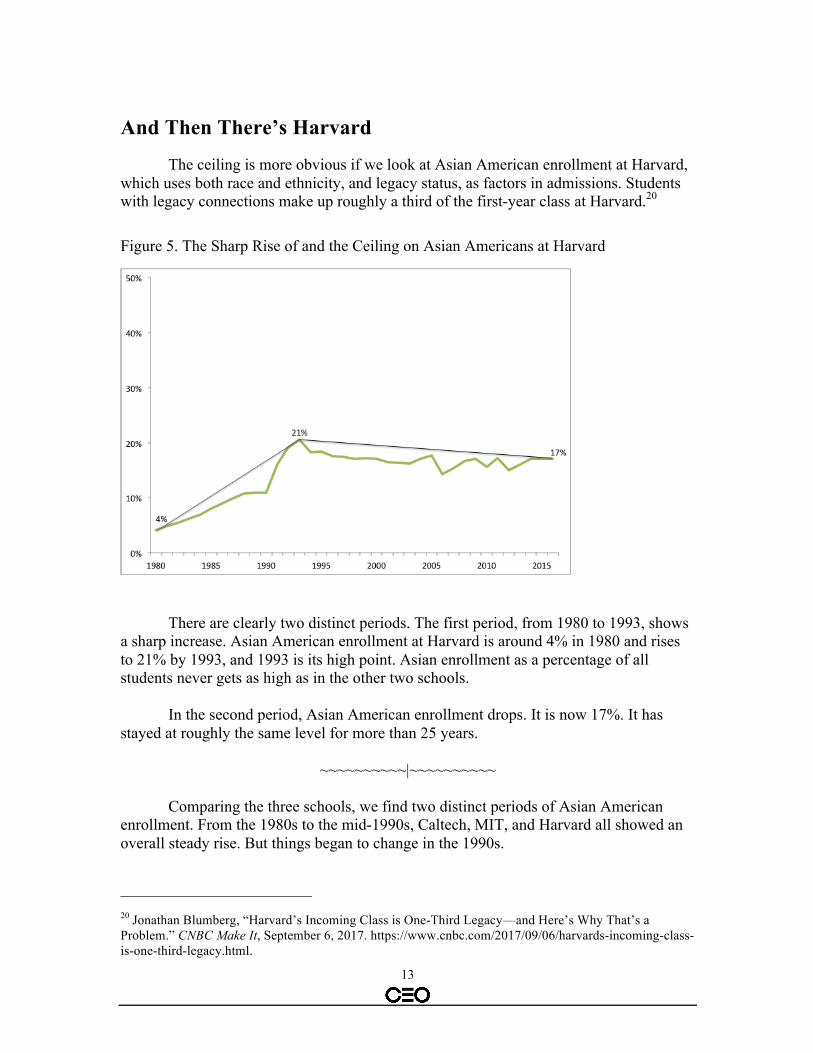
The ceiling is more obvious if we look at Asian American enrollment at Harvard, which uses both race and ethnicity, and legacy status, as factors in admissions. Students with legacy connections make up roughly a third of the first-year class at Harvard.20
Figure 5. The Sharp Rise of and the Ceiling on Asian Americans at Harvard
There are clearly two distinct periods. The first period, from 1980 to 1993, shows
a sharp increase. Asian American enrollment at Harvard is around 4% in 1980 and rises to 21% by 1993, and 1993 is its high point. Asian enrollment as a percentage of all students never gets as high as in the other two schools.
In the second period, Asian American enrollment drops. It is now 17%. It has
stayed at roughly the same level for more than 25 years.
~~~~~~~~~~|~~~~~~~~~~
Comparing the three schools, we find two distinct periods of Asian American enrollment. From the 1980s to the mid-1990s, Caltech, MIT, and Harvard all showed an overall steady rise. But things began to change in the 1990s.
20 Jonathan Blumberg, “Harvard’s Incoming Class is One-Third Legacy—and Here’s Why That’s a Problem.” CNBC Make It, September 6, 2017. https://www.cnbc.com/2017/09/06/harvards-incoming-class-is-one-third-legacy.html.
14
• At Caltech, a school with no affirmative action and no preferences of any kind, the number of Asian Americans generally increases.
• The rise is halted at MIT. It matches the Caltech rise from 1980 to the mid-
1990s, peaking at 29%. Since then, the percentage of Asian Americans at MIT has stalled at around 26%.
• At Harvard, it sharply rises, then significantly drops, and stays at roughly 17%
during the next two decades. So, the complicated picture is this. The number of Asian Americans at elite
schools has risen dramatically, and Asian Americans are “overrepresented” relative to their numbers in the U.S. population. Yet, as before with the Ivy League’s treatment of Jewish students, certain elite schools will only admit some Asian American applicants, but not too many. And indeed, not as many as their academic achievements would suggest.
How large is the “negative” race preference? Here the findings of Espenshade and
Radford’s book, No Longer Separate, Not Yet Equal, are worth noting. Espenshade and Radford found evidence of negative race preferences among elite universities in the 1990s. They subsequently translated their statistical probabilities into 140 extra SAT points needed by Asian American applicants to have the same odds of admissions as whites, an extra 270 SAT points compared to Hispanics, and 450 points compared to blacks. Hypothetically, all other factors being equal, if the typical white applicant admitted to an elite private school had an SAT score of 1400, an Asian American applicant would need a score of 1540, a black applicant would need a 1090, and a Hispanic candidate would need one of 1270 to have the same probability of admission.21 But there is so much more embedded in their findings.
21 Espenshade and Radford, p. 92.

15
Comparing Racial & Ethnic Groups: Espenshade & Radford’s Findings
The racial-ethnic make-up of applicants for public and private universities is not readily accessible. Nor is the racial-ethnic make-up of those admitted and enrolled. If there are disparities between the racial-ethnic composition of those who applied and those who were admitted, they are not easily found out.
Major academic data sets contain applicant data regarding race and ethnicity for
private schools, for example, as part of Espenshade and Radford’s Not Yet Separate, Not Yet Equal. But they are restricted-access data, unlike government data. For public universities, applicant statistics and admission rates by race and ethnicity can be calculated through FOIA requests if allowed by an individual state (e.g., Michigan but not Pennsylvania).22
Espenshade and Radford published the results of eight of the most elite schools in
the U.S. (the schools are not identified). As with many statistical studies, summary statistics are presented for four racial/ethnic groups (blacks, Hispanics, Asians, and whites), while Native Hawaiian-Other Pacific Islander and American Indian-Alaskan Native are dropped from analysis.23 The summary statistics show that even 20 years ago, Asian Americans had the lowest admission rates for elite private colleges and universities (see table below).
Table 2. Admission Rates by Race at Elite Private Institutions, Fall 199724
Admission Rate African Am 31% Hispanic 27% Asian Am 18% White 26%
In 1997, when Espenshade and Radford collected their data, elite private
institutions admitted 31% of African American applicants, 27% of Hispanic applicants, and 26% of whites. Those admission rates were much higher than the 18% rate for Asian Americans.
22 CEO studies of racial and ethnic preferences at state universities and colleges relied on FOIAs so we could conduct our own data analysis. See Appendix B for comments on studying public flagship universities and a list of CEO studies of racial-ethnic preferences at major public institutions of higher education. 23 Our studies at the Center for Equal Opportunity classify groups in the same manner, with analysis focusing on four racial/ethnic groups (African American, Hispanic, Asian American, and white) with American Indian/Alaskan Native and Native Hawaiian-Other Pacific Islander dropped for a lack of sufficient cases. See Appendix A for definition of categories. 24 Table based on Espenshade and Radford, p. 80. Number of applicants to the elite private institutions in study=2,796 unweighted, 52,051 weighted, p. 71. All data are weighted.

16
And this was more than 20 years ago. Are the admission rates for Asian
applicants to elite private schools worse now? How much do they differ from admission rates for blacks, Hispanics, and whites? We don’t know because the racial-ethnic breakdown of applicants to a given elite school and the school’s admission rates by race and ethnicity are not readily available through federal databases.
In examining their data, Espenshade and Radford compared admission rates
within SAT ranges (combining math and verbal). And as one would expect, the higher an applicant’s SAT scores, the better the individual’s chances of admission, with elite public schools easier to get into than the elite private schools.
Table 3. Undergraduate Admission Rate by SAT, at Elite Schools25
Combined SAT Ranges < 1000 1000-1199 1200-1399 1400-1600 Public 41% 54% 55% 75% Private 2% 12% 18% 37%
While 41% of public university applicants were admitted with combined scores under 1000, the private schools admitted only 2% of applicants with such low scores. Of those applicants in the second and third tier (1000-1199 and 1200-1399, respectively), public universities admitted more than half the applicants (54% and 55%, respectively). In contrast, private schools admitted only 12% and 18% of applicants.
Finally, among all applicants with combined scores from 1400 to 1600, 75% of
applicants to elite public universities were admitted. Even at the top level, the private universities admitted only 37% with such scores.
Applicants with High SAT Scores by Race and Ethnicity
Espenshade and Radford then looked at admission rates by race and SAT ranges, for public and private schools separately.26 Admission rates to elite private schools rose as SAT ranges increased, for all racial/ethnic groups. However, in their graph of race and SAT ranges (Figure 3.6 in their book), the admission rates for black and Hispanic applicants in each range were significantly higher than the admission rates for whites, and they were lowest for Asian American applicants.
The authors pointed out that racial and ethnic disparities also occur among
applicants with SAT scores ranging from 1400 and 1600. In their only explication of the actual admission rates by race and SAT range, Espenshade and Radford noted that elite
25 Espenshade and Radford, p. 83. 26 Their graph however has no data label for each group and SAT range. One has to estimate it based on the figure. See Figure 3.6. Proportion of Students Admitted, by SAT Ranges and by Race, Private NSCE Institutions, 1997, Espenshade and Radford, p. 82.

17
private schools admitted 77 percent of blacks with SAT scores ranging from 1400 to 1600; 48 percent of Hispanic applicants in that SAT range; and 40 percent of whites. The Asian American admission rate was much lower—30%. The racial/ethnic disparities in admission rates for applicants in the top SAT range are striking when seen in the figure below.
Figure 6. Admission Rate by Race at Private Elite Universities for Those with SATs from 1400 to 160027
As this graph shows, blacks were admitted at more than twice the rate of Asian Americans. The gap in admission rates was 18 percentage points between Hispanics and Asians, and 10 points between whites and Asians.
This admission gap was effectively explained by further calculations performed
by Espenshade and Radford. Logistic regression analysis was conducted on public and private universities separately, using race-ethnicity, social class, gender, citizenship, athlete, legacy, National Merit scholar, test scores, AP tests, high school rank and/or GPA, and high school type as variables.
There was still a statistically significant, negative impact upon Asian American
applicants even when controlling for all other demographic and academic variables.28
27 Based on information in Espenshade and Radford, p. 81. 28 Their odds ratios are presented in a four-page table. Espenshade and Radford, Table 3.4, Odds Ratios from Logistic Regression Estimates of the Effect of Race and Social Class on Admission Probabilities to Public and Private NSCE Institutions, Fall 1997, p. 85-89. There are statistically significant odds ratios of less than 1.00 relative to whites and differential effects when interaction terms are created for race and class, plus adding in the numerous demographic and academic variables. For blacks and Hispanics, there is an independent positive race effect, despite SES, as there is a negative one for Asians.
18
(Not surprisingly, Asian Americans tend to regard “being Asian” as a negative factor in their applications to elite private universities.)
These statistical calculations were the basis of Espenshade and Radford’s
portrayal of the SAT “bump” needed by Asian American applicants. Statistically controlling for the other variables, Asian American applicants needed a combined SAT of 140 points to match the admissions probability of whites, 270 to match the one for Hispanics, and 450 to match African Americans.
The Role of Extracurricular Activities
But maybe the disparities were a function of extracurricular activities. In other words, that African Americans, Hispanics, and whites had more extracurricular activities than did Asians Americans and were deemed better applicants as result. If this is the case, then Harvard could have been crediting extracurricular activities in order to limit the number of Asian American students—similar to what it did starting in the 1920s, the negative effect then absorbed by Jewish applicants.
Espenshade and Radford found that black, Hispanic, Asian and white applicants
showed similar participation rates in various types of activities except for academics and athletics;29 and that Asian applicants participated in academic extracurricular activities more than other groups but also had the most leadership awards and positions, followed closely by Hispanics, then whites and African Americans.
But extracurricular activities at this level of competitiveness have never been
significant, except for those recruited for college sports. According to one former admissions officer, an applicant must stand out at a national level; being “well rounded” doesn’t count. Another private college consultant (and former admission officer at Dartmouth College notes that being captain of a sports team, first-chair in an orchestra, or senior class president does not make one stand out.30
As for athletics,31 whites participated significantly more (74%) than Hispanics
(64%), African Americans (64%), and Asian Americans (56%). The differences among groups were statistically significant.
Note, however, that a majority of Asian Americans, against the stereotype,
participated in some high school sport.32
29 Espenshade and Radford, p. 30-32. 30 cited in Espenshade and Radford, p. 29. 31 Athletics include cheerleading, pep squad, intramural, junior varsity and varsity sports. Espenshade and Radford, p. 31, 32. 32 Espenshade and Radford, p. 35.

19
The “Softer” Factors
But don’t other things like letters of recommendation and personal essays matter? Espenshade and Radford, after conducting their extensive logistic regression analyses, did acknowledge an Asian American disadvantage but then said that it could have been explained by “other factors that admission officers have access to in applicants’ folder and that are not in our data set.”33
By this logic, letters of recommendation, personal essays, and face-to-face
interviews would have to be so much more positive for blacks, Hispanics, and whites than for Asian Americans so as to statistically explain away race as a negative factor for Asian applicants. Those “soft factors” would have to be so overwhelmingly favorable to the other racial/ethnic groups over Asian Americans that being Asian American is merely a statistically significant proxy in admission statistics.
But this alternative explanation lacks any substantial evidence. It plays into the
stereotype of Asian Americans as narrow academic nerds—and not a good fit for entry into the American elite.
~~~~~~~~~~|~~~~~~~~~~ The Consequences of Holistic Admission
Asian Americans’ quick rise and fall at Harvard recalls the Jewish pattern of the 1920s, when Harvard and the other Ivy League colleges shifted from an admissions process that emphasized academic qualifications to one that looked at the whole person—a “holistic” approach encompassing non-academic factors. As a result, Jewish enrollment peaked in the 1920s before dropping to 15% and remaining roughly at that level until after World War II. Today’s Harvard plan still employs a holistic process, using factors such as where an applicant grew up, high school quality, extracurricular activities, legacy status, and more subjective criteria such as teacher recommendations, personal essays, and interviews.
Harvard and the other private elite universities function as the gatekeepers to the
American elite. Legacy, celebrity status, and donor connections emerge as admission factors, along with race/ethnicity, academic qualifications, and many “soft” elements.
But there’s only a fixed number of places in any first-year class, and more and
more applicants compete for them.34 The Asian American ceiling, like the Jewish ceiling in the 1920s, seems to be the work of admission committees weighing multiple factors to
33 Espenshade and Radford, p. 128. 34 Harvard introduced the use of a fixed number of slots in the 1920s to further limit the number of Jewish students at Harvard. Karabel, p. 101.
20
get the “proper” mix of an educational diversity that includes racial and ethnic diversity in particular.
In the past, holistic admission plans allowed some Jewish students at Harvard, just
fewer of them. Today holistic admissions at Harvard and other elite schools enable them to implement a reverse affirmative action plan for Asian Americans by treating them differently from other students on account of their race. This ultimately limits the number of Asian Americans who become part of the American elite—a result some Americans unfortunately may wish for. After all, “too many Asians” is not a good thing. Said one former admissions officer, “[O]ur elite campuses would look like UCLA and Berkeley . . .. That wouldn’t be good for Asians or anyone else.”35 Why not?
35 Quoted in “The Harvard Plan that Failed Asian Americans,” p. 616.

21
Appendix A. Categories of Race and Ethnicity
Education data are based on a minimum of five racial/ethnic categories: American Indian or Alaskan Native, Asian or Pacific Islander (until 2007), black, Hispanic, and white. All federal agencies (e.g., the U.S. Census, the National Center for Education Statistics) must adhere to the classifications established by the U.S. Office of Management and Budget. In 2007, “Native Hawaii and Other Pacific Islander” was set up as a separate category from “Asian.” Persons are designated ethnically as Hispanic or non-Hispanic and asked to identify their race (e.g., white, black, American Indian). They may also designate one or more racial group identity.
The definitions are as follows: Hispanic or Latino – An indication that the
person traces his or her origin or descent to Mexico, Puerto Rico, Cuba, Central and South America, and Other Spanish cultures regardless of race; American Indian or Alaska Native – A person having origins in any of the original peoples of North America and who maintains cultural identification through tribal affiliation or community recognition; Asian – A person having origins in any of the original peoples of the Far East, Southeast Asia, or the Indian subcontinent including, for example, Cambodia, China, India, Japan, Korea, Malaysia, Pakistan, the Philippine Islands, Thailand, and Vietnam; Black or African American – A person having origins in any of the black racial groups of Africa; Native Hawaiian or Other Pacific Islander – A person having origins in any of the original peoples of Hawaii, Guam, Samoa, or other Pacific Islands; White – A person having origins in any of the original peoples of Europe, the Middle East, or North Africa.36
Appendix B. Public Universities
There are several flagship public universities (e.g., Berkeley, UCLA, and the University of Michigan) where racial preferences in admissions are illegal. They are less competitive than the elite private schools and rank much lower in the US News rankings. They award substantial in-state preferences, which are not based on race and ethnicity and are not a factor in the private school admissions process. The public flagships are also much less expensive compared to the elite privates.
For these reasons, the students attending public flagships that do not use race as a
factor may be substantially different than those attending the elite private schools. The Center for Equal Opportunity has published statistical studies on racial and
ethnic preferences in admissions to public universities and colleges. Many of the studies use applicant data that includes their admission status (admit-reject), race/ethnicity, SAT
36 In 1977, OMB issued its first government-wide directive standardizing the government’s racial and ethnic categories. See National Center for Education Statistics, U.S. Education Department, n.d. “Appendix A: Revisions to the Standards for the Classification of Federal Data on Race and Ethnicity,” https://nces.ed.gov/programs/handbook/data/pdf/Appendix_A.pdf .

22
and ACT scores, high school grade point average and/or class rank, gender, if they had some legacy connection, and their residency status (in-state versus out-of-state). Racial preferences in admissions were found in Michigan (before Proposal 2 banned such action), Oklahoma, Virginia, Wisconsin, Ohio State, Miami University of Ohio, Maryland, and the U.S. Military and U.S. Naval Academies. Racial preferences were also found in several public medical and law schools (e.g., Virginia, Michigan, Nebraska, Maryland, Arizona State and the University of Arizona.). The studies are on the CEO website (scroll to bottom of page), http://www.ceousa.org/affirmative-action/affirmative-action-news/education.

23
CENTER FOR EQUAL OPPORTUNITY
The Center for Equal Opportunity (CEO) is a non-profit research institution
established under Section 501(c)(3) of the Internal Revenue Code. CEO sponsors conferences, supports research, and publishes policy briefs and monographs
on issues related to race, ethnicity, and public policy.
Linda Chavez, Chairman
Related Documents