Cerebral Cortex doi:10.1093/cercor/bhq268 Association between Functional Connectivity Hubs and Brain Networks Dardo Tomasi 1 and Nora D. Volkow 1,2 1 National Institute on Alcohol Abuse and Alcoholism, Bethesda, MD 20892, USA and 2 National Institute on Drug Abuse, Bethesda, MD 20892, USA Address correspondence to Dr Dardo Tomasi, Laboratory of Neuroimaging (LNI/NIAAA), Medical Department, Building 490, Brookhaven National Laboratory, 30 Bell Avenue, Upton, NY 11973, USA. Email: [email protected]. Functional networks are usually accessed with ‘‘resting-state’’ functional magnetic resonance imaging using preselected ‘‘seeds’’ regions. Frequently, however, the selection of the seed locations is arbitrary. Recently, we proposed local functional connectivity density mapping (FCDM), an ultrafast data-driven to locate highly connected brain regions (functional hubs). Here, we used the functional hubs obtained from local FCDM to determine the func- tional networks of the resting state in 979 healthy subjects without a priori hypotheses on seed locations. In addition, we computed the global functional connectivity hubs. Seven networks covering 80% of the gray matter volume were identified. Four major cortical hubs (ventral precuneus/posterior cingulate, inferior parietal cortex, cuneus, and postcentral gyrus) were linked to 4 cortical networks (default mode, dorsal attention, visual, and somatosensory). Three subcortical networks were associated to the major subcortical hubs (cerebellum, thalamus, and amygdala). The networks differed in their resting activity and topology. The higher coupling and overlap of subcortical networks was associated to higher contribution of short-range functional connectivity in thalamus and cerebellum. Whereas cortical local FCD hubs were also hubs of long-range connectivity, which corroborates the key role of cortical hubs in network architecture, subcortical hubs had minimal long-range connectivity. The significant variability among functional networks may underlie their sensitivity/resilience to neuropathology. Keywords: functional connectivity, 1000 functional connectomes Introduction Which brain networks support the resting conscious state and how are they organized? Magnetic resonance imaging (MRI) studies assessing the functional connectivity of the human brain in resting conditions have identified large-scale brain networks that have been linked to neurodegenerative diseases (Seeley et al. 2009). Of these, the default mode network (DMN) is the most conspicuous since its activity is highest in resting conditions, whereas it decreases during goal-oriented task performance (Shulman et al. 1997). Traditionally, the functional connectivity among brain regions is assessed using preselected regions-of-interest (ROIs) (i.e., ‘‘seeds regions’’) from which the time-varying blood oxygenation level--dependent MRI signals are extracted to compute their correlation with signals in other brain areas (Biswal et al. 1995). However, these methods are limited because they relay strongly on a priori selection of the location of the seed regions. Thus, the nature and number of independent networks supporting the resting state of brain function are still uncertain. A data-driven approach based on graph theory was recently proposed to assess the distribution of functional hubs in the human brain from MRI data sets (van den Heuvel et al. 2008; Buckner et al. 2009). This method is based on the computation of the number of functional connections per voxel (edges in graph theory), does not require a priori selection of seed regions, and was shown to exhibit good correspondence with structural connectivity studies that used diffusion tensor imaging (van den Heuvel et al. 2009). Prominent functional hubs were recently identified in the DMN as well as in dorsal parietal and prefrontal regions using this approach (Buckner et al. 2009). We hypothesized that in resting conditions, these hub regions would be functionally connected to minimally overlapping networks that would have different topological architecture. We aimed to test this hypothesis in a large sample of brain images of healthy subjects from the open access image database ‘‘1000 Functional Connectomes Project’’ (Biswal et al. 2010). We used functional connectivity density mapping (FCDM; Tomasi and Volkow 2010), a novel ultrafast (1000 times faster) method that is sensitive to the number of local functional connections of the brain regions. Using this approach, we showed that the local functional connectivity density (lFCD) has a ‘‘scale-free’’ distribution in the brain (Tomasi and Volkow 2010), with few hubs and numerous weakly connected nodes, which is consistent with the emergence of scaling in neural networks (Barabasi and Albert 1999; Achard et al. 2006; Barabasi 2009; He et al. 2010). Thus, armed with FCDM and the image database of the 1000 Functional Connectomes Project, we aimed to determine the properties of the resting state networks associated to the major lFCD hubs in cortical and subcortical brain regions. We hypothe- sized that the networks connected to the hubs would have minimal overlap and different scale-free topology and that the entire DMN would be connected to the main lFCD hub in the brain. Materials and Methods Subjects We used resting-state functional connectivity data sets corresponding to 979 healthy subjects (for demographic information, see Table 1) from 19 of the research sites of the image repository 1000 Functional Connectomes Project, which can be assessed at http://www.nitrc.org/ projects/fcon_1000/. Data sets from the remaining 16 sites were not included because they were not available (pending verification of institutional review board status) at the time of the study or did not meet the imaging acquisition criteria of the study (3 s > time repetition, full brain coverage, time points > 100, spatial resolution better than 4 mm). Functional Hub Mapping Image preprocessing was performed with the Statistical Parameter Mapping package SPM2 (Wellcome Trust Centre for Neuroimaging). A 12-parameter affine transformation was used for realignment and for spatial normalization to the stereotactic space of the Montreal Published by Oxford University Press 2011. Cerebral Cortex Advance Access published January 31, 2011 at Brookhaven National Laboratory on February 1, 2011 cercor.oxfordjournals.org Downloaded from

Welcome message from author
This document is posted to help you gain knowledge. Please leave a comment to let me know what you think about it! Share it to your friends and learn new things together.
Transcript
Cerebral Cortex
doi:10.1093/cercor/bhq268
Association between Functional Connectivity Hubs and Brain Networks
Dardo Tomasi1 and Nora D. Volkow1,2
1National Institute on Alcohol Abuse and Alcoholism, Bethesda, MD 20892, USA and 2National Institute on Drug Abuse, Bethesda,
MD 20892, USA
Address correspondence to Dr Dardo Tomasi, Laboratory of Neuroimaging (LNI/NIAAA), Medical Department, Building 490, Brookhaven National
Laboratory, 30 Bell Avenue, Upton, NY 11973, USA. Email: [email protected].
Functional networks are usually accessed with ‘‘resting-state’’functional magnetic resonance imaging using preselected ‘‘seeds’’regions. Frequently, however, the selection of the seed locationsis arbitrary. Recently, we proposed local functional connectivitydensity mapping (FCDM), an ultrafast data-driven to locate highlyconnected brain regions (functional hubs). Here, we used thefunctional hubs obtained from local FCDM to determine the func-tional networks of the resting state in 979 healthy subjects withouta priori hypotheses on seed locations. In addition, we computed theglobal functional connectivity hubs. Seven networks covering 80%of the gray matter volume were identified. Four major cortical hubs(ventral precuneus/posterior cingulate, inferior parietal cortex,cuneus, and postcentral gyrus) were linked to 4 cortical networks(default mode, dorsal attention, visual, and somatosensory). Threesubcortical networks were associated to the major subcorticalhubs (cerebellum, thalamus, and amygdala). The networks differedin their resting activity and topology. The higher coupling and overlapof subcortical networks was associated to higher contribution ofshort-range functional connectivity in thalamus and cerebellum.Whereas cortical local FCD hubs were also hubs of long-rangeconnectivity, which corroborates the key role of cortical hubs innetwork architecture, subcortical hubs had minimal long-rangeconnectivity. The significant variability among functional networksmay underlie their sensitivity/resilience to neuropathology.
Keywords: functional connectivity, 1000 functional connectomes
Introduction
Which brain networks support the resting conscious state and
how are they organized? Magnetic resonance imaging (MRI)
studies assessing the functional connectivity of the human
brain in resting conditions have identified large-scale brain
networks that have been linked to neurodegenerative diseases
(Seeley et al. 2009). Of these, the default mode network (DMN)
is the most conspicuous since its activity is highest in resting
conditions, whereas it decreases during goal-oriented task
performance (Shulman et al. 1997).
Traditionally, the functional connectivity among brain
regions is assessed using preselected regions-of-interest (ROIs)
(i.e., ‘‘seeds regions’’) from which the time-varying blood
oxygenation level--dependent MRI signals are extracted to
compute their correlation with signals in other brain areas
(Biswal et al. 1995). However, these methods are limited
because they relay strongly on a priori selection of the location
of the seed regions. Thus, the nature and number of
independent networks supporting the resting state of brain
function are still uncertain. A data-driven approach based on
graph theory was recently proposed to assess the distribution
of functional hubs in the human brain from MRI data sets
(van den Heuvel et al. 2008; Buckner et al. 2009). This method
is based on the computation of the number of functional
connections per voxel (edges in graph theory), does not
require a priori selection of seed regions, and was shown to
exhibit good correspondence with structural connectivity
studies that used diffusion tensor imaging (van den Heuvel
et al. 2009). Prominent functional hubs were recently identified
in the DMN as well as in dorsal parietal and prefrontal regions
using this approach (Buckner et al. 2009). We hypothesized
that in resting conditions, these hub regions would be
functionally connected to minimally overlapping networks that
would have different topological architecture.
We aimed to test this hypothesis in a large sample of brain
images of healthy subjects from the open access image
database ‘‘1000 Functional Connectomes Project’’ (Biswal
et al. 2010). We used functional connectivity density mapping
(FCDM; Tomasi and Volkow 2010), a novel ultrafast (1000
times faster) method that is sensitive to the number of local
functional connections of the brain regions. Using this
approach, we showed that the local functional connectivity
density (lFCD) has a ‘‘scale-free’’ distribution in the brain
(Tomasi and Volkow 2010), with few hubs and numerous
weakly connected nodes, which is consistent with the
emergence of scaling in neural networks (Barabasi and Albert
1999; Achard et al. 2006; Barabasi 2009; He et al. 2010).
Thus, armed with FCDM and the image database of the 1000
Functional Connectomes Project, we aimed to determine the
properties of the resting state networks associated to the major
lFCD hubs in cortical and subcortical brain regions. We hypothe-
sized that thenetworks connected to thehubswouldhaveminimal
overlap and different scale-free topology and that the entire DMN
would be connected to the main lFCD hub in the brain.
Materials and Methods
SubjectsWe used resting-state functional connectivity data sets corresponding
to 979 healthy subjects (for demographic information, see Table 1)
from 19 of the research sites of the image repository 1000 Functional
Connectomes Project, which can be assessed at http://www.nitrc.org/
projects/fcon_1000/. Data sets from the remaining 16 sites were not
included because they were not available (pending verification of
institutional review board status) at the time of the study or did not
meet the imaging acquisition criteria of the study (3 s > time
repetition, full brain coverage, time points > 100, spatial resolution
better than 4 mm).
Functional Hub MappingImage preprocessing was performed with the Statistical Parameter
Mapping package SPM2 (Wellcome Trust Centre for Neuroimaging). A
12-parameter affine transformation was used for realignment and for
spatial normalization to the stereotactic space of the Montreal
Published by Oxford University Press 2011.
Cerebral Cortex Advance Access published January 31, 2011 at B
rookhaven National Laboratory on F
ebruary 1, 2011cercor.oxfordjournals.org
Dow
nloaded from
Neurological Institute (MNI). Subsequent spatial normalization was
carried out with medium regularization, 16 nonlinear iterations, a voxel
size of 3 3 3 3 3 mm3, and the SPM2 EPI.mnc template. Motion-related
signal fluctuations were removed from the time-varying data using
multilinear regression with the 6 realignment parameters, and 0.01–
0.10 Hz band-pass temporal filtering was applied to remove magnetic
field drifts of the scanner (Foerster et al. 2005) and physiologic noise of
high-frequency components (Cordes et al. 2001) using IDL (ITT Visual
Information Solutions).
Local FCD
The Pearson linear correlation coefficient, R, was used to evaluate the
strength of the functional connectivity between voxels. Functional
connections with correlation coefficient, R > 0.6, were considered
significant. The number of significant functional connections per voxel
in the ‘‘local cluster,’’ k, was computed using a 3D searching algorithm
developed in IDL.
Gobal FCD
We implemented a high-resolution (3 mm isotropic) voxelwise
approach based on graph theory methods to compute the total number
of functional connections in gray matter, K, to contrast the lFCD
measures with traditional measures of graph theory approaches (van
den Heuvel et al. 2008; Buckner et al. 2009). For this purpose,
a threshold R > 0.6 was used to compute K. Note that differently to the
lFCD calculation, the computation of K was not restricted to the local
cluster. Thus, this computer-demanding approach computed 4.05 3 109
paired correlations per subject and was optimally implementer in C
programming language to speed up the calculation of the global FCD
(gFCD), which in average required 3 h per subject in a 2 GHz-Xeon
Windows XP platform.
To minimize the differences in the functional anatomy of the brain
across subjects (Friston et al. 2007), spatial smoothing (8 mm) was
applied to lFCD and gFCD maps using SPM2.
Statistical AnalysesThe distribution of the lFCD varied across research centers, likely due
to differences in acquisition parameters, instruments, demographic
variables, and potential differences in resting conditions (e.g., eyes
opened/closed, awake/sleep, etc.). The use of a single scaling factor for
each research site, 1/k0, reflecting the mean lFCD across subjects and
voxels in the brain, k0, allowed us to normalize the distribution of the
lFCD and merge the data sets from different research sites (Tomasi and
Volkow 2010). Similarly, a single scaling factor for each research site,
1/K0, reflecting the mean gFCD across subjects and voxels in the brain,
K0, allowed us to normalize the distribution of the gFCD and merge the
data sets from different research sites.
Network ClassificationWe aimed to map networks functionally connected to the functional
hubs that cover at least 80% of the gray matter volume. However, the
number of hubs was constrained to a minimum in order to minimize
the complexity of the results. For this purpose, the most prominent
lFCD hubs in cortical and subcortical regions were identified based on
their strength (k/k0) and their volume. Four cortical (PC-VP, Brodmann
area, BA 23/31; inferior parietal cortex, BA40; cuneus, BA18; and
postcentral, BA 5) and 3 subcortical (cerebellum, thalamus, and
amygdala) hubs with local lFCD-maxima (k/k0 > 2) within a spherical
searching volume exceeding 20 mL were used as ROIs for subsequent
seed--voxel correlation analyses (Table 2). The global component of
the functional MRI (fMRI) signal fluctuations was removed from the
time series to minimize global effects of heart rate and respiration.
The Fisher transform was used to convert the step distributed
correlation coefficients into normally distributed correlation coeffi-
cients. These rescaled correlation maps were computed, smoothed
(8 mm), and uploaded into simple t-tests for group analyses of
functional connectivity in SPM2, independently for each seed region.
Voxels with P < 10–15 were considered functionally connected to the
hubs across subjects. The MNI coordinates of the cluster maxima
were transformed to the Talairach stereotactic space using a best-fit
transform (icbm_spm2tal; http://brainmap.org/icbm2tal/) that mini-
mizes bias associated with reference frame and scaling (Lancaster et al.
2007). The brain regions were labeled according to the Talairach
daemon (http://www.talairach.org/; Lancaster et al. 2000) and a query
range of 5 mm to account for the spatial uncertainty of the MRI signal
(Tomasi and Caparelli 2007), which results from macrovascular and
susceptibility effect as well as image postprocessing steps. We further
checked the labels of the hubs using the Automated Anatomical
Labeling (AAL) atlas (Tzourio-Mazoyer et al. 2002) and the Brodmann
atlas, which is included in the MRIcro software (http://www.cabiatl
.com/mricro/).
ROI AnalysesA binary mask for each of the 7 functional connectivity networks
defined above was created for the whole group of subjects. The
volumes of the networks and their overlap, the average correlation
strength between networks and between hubs and between hubs ad
networks, and the probability distribution of the lFCD were evaluated
within each of these 7 masks using IDL.
Results
Functional Hubs
The lFCD was higher for ventral than for dorsal lateral as well
as for posterior than for anterior regions. The more prominent
hubs (local maxima of the lFCD distribution) in the cortex
were located in the posterior cingulate/ventral precuneus
(PC-VP, BA 23/31, the global maxima of the lFCD), inferior
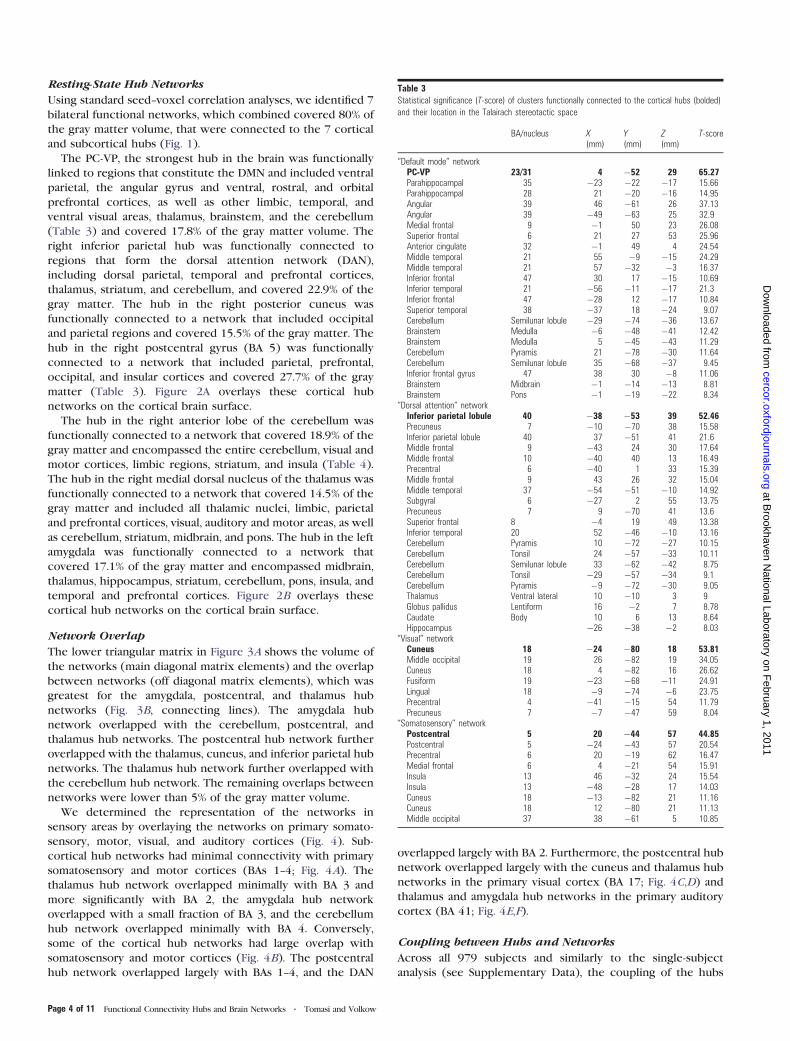
Table 1Available demographic data for the selected resting-state functional MRI datasets from the
image repository for the 1000 Functional Connectomes Project
Dataset Subjects Age (years)
Baltimore 8M/15F 20--40Bangor 20M/0F 19--38Beijing 76M/122F 18--26Berlin 13M/13F 23--44Cambridge 75M/123F 18--30MIT 18M/20F 20--32Cleveland 11M/20F 24--60Dallas 12M/12F 20--71Leiden 23M/8F 20--27Leipzig 16M/21F 20--42Newark 9M/10F 21--39New York A 40M/19F 20--49New York B 8M/12F 18--46NYU_TRT 10M/17F 22--49Ontario 11 subjects N/AOrangeburg 15M/5F 20--55Oulu 37M/66F 20--23Oxford 12M/10F 20--35Queensland 11M/8F 20--34Saint Louis 14M/17F 21--29Taipei A 14 subjects N/ATaipei B 8 subjects N/A
Table 2Strength of the major functional hubs in cortical and subcortical brain regions and their location in
the Talairach stereotactic space
Hub regions X (mm) Y (mm) Z (mm) lFCD (k/k0) gFCD (K/K0)
PC-VP 4 �52 29 9.0 8.1Inferior parietal �38 �53 39 6.1 3.5Cuneus �24 �80 18 5.3 5.9Postcentral 20 �44 57 4.8 3.4Cerebellum �9 �56 �20 4.5 1.5Thalamus �12 �19 8 4.0 1.4Amygdala 24 �6 �15 2.1 2.3
Page 2 of 11 Functional Connectivity Hubs and Brain Networks d Tomasi and Volkow
at Brookhaven N
ational Laboratory on February 1, 2011
cercor.oxfordjournals.orgD
ownloaded from
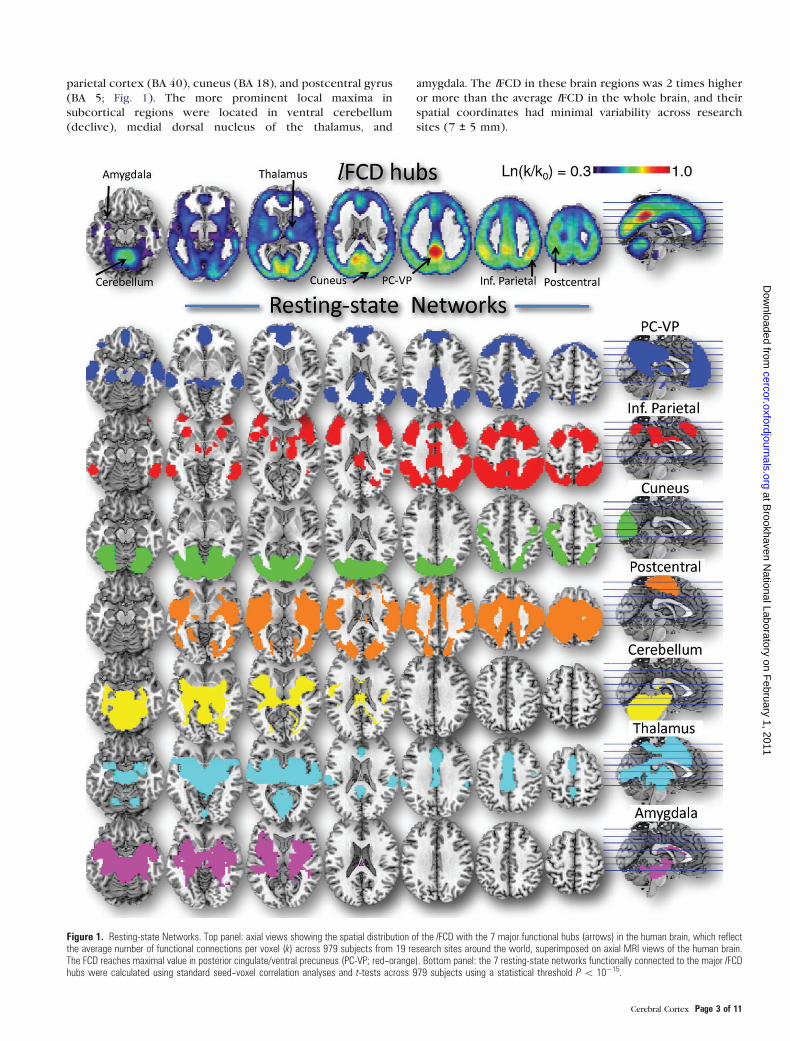
parietal cortex (BA 40), cuneus (BA 18), and postcentral gyrus
(BA 5; Fig. 1). The more prominent local maxima in
subcortical regions were located in ventral cerebellum
(declive), medial dorsal nucleus of the thalamus, and
amygdala. The lFCD in these brain regions was 2 times higher
or more than the average lFCD in the whole brain, and their
spatial coordinates had minimal variability across research
sites (7 ± 5 mm).
Figure 1. Resting-state Networks. Top panel: axial views showing the spatial distribution of the lFCD with the 7 major functional hubs (arrows) in the human brain, which reflectthe average number of functional connections per voxel (k) across 979 subjects from 19 research sites around the world, superimposed on axial MRI views of the human brain.The FCD reaches maximal value in posterior cingulate/ventral precuneus (PC-VP; red--orange). Bottom panel: the 7 resting-state networks functionally connected to the major lFCDhubs were calculated using standard seed--voxel correlation analyses and t-tests across 979 subjects using a statistical threshold P\ 10�15.
Cerebral Cortex Page 3 of 11
at Brookhaven N
ational Laboratory on February 1, 2011
cercor.oxfordjournals.orgD
ownloaded from
Resting-State Hub Networks
Using standard seed--voxel correlation analyses, we identified 7
bilateral functional networks, which combined covered 80% of
the gray matter volume, that were connected to the 7 cortical
and subcortical hubs (Fig. 1).
The PC-VP, the strongest hub in the brain was functionally
linked to regions that constitute the DMN and included ventral
parietal, the angular gyrus and ventral, rostral, and orbital
prefrontal cortices, as well as other limbic, temporal, and
ventral visual areas, thalamus, brainstem, and the cerebellum
(Table 3) and covered 17.8% of the gray matter volume. The
right inferior parietal hub was functionally connected to
regions that form the dorsal attention network (DAN),
including dorsal parietal, temporal and prefrontal cortices,
thalamus, striatum, and cerebellum, and covered 22.9% of the
gray matter. The hub in the right posterior cuneus was
functionally connected to a network that included occipital
and parietal regions and covered 15.5% of the gray matter. The
hub in the right postcentral gyrus (BA 5) was functionally
connected to a network that included parietal, prefrontal,
occipital, and insular cortices and covered 27.7% of the gray
matter (Table 3). Figure 2A overlays these cortical hub
networks on the cortical brain surface.
The hub in the right anterior lobe of the cerebellum was
functionally connected to a network that covered 18.9% of the
gray matter and encompassed the entire cerebellum, visual and
motor cortices, limbic regions, striatum, and insula (Table 4).
The hub in the right medial dorsal nucleus of the thalamus was
functionally connected to a network that covered 14.5% of the
gray matter and included all thalamic nuclei, limbic, parietal
and prefrontal cortices, visual, auditory and motor areas, as well
as cerebellum, striatum, midbrain, and pons. The hub in the left
amygdala was functionally connected to a network that
covered 17.1% of the gray matter and encompassed midbrain,
thalamus, hippocampus, striatum, cerebellum, pons, insula, and
temporal and prefrontal cortices. Figure 2B overlays these
cortical hub networks on the cortical brain surface.
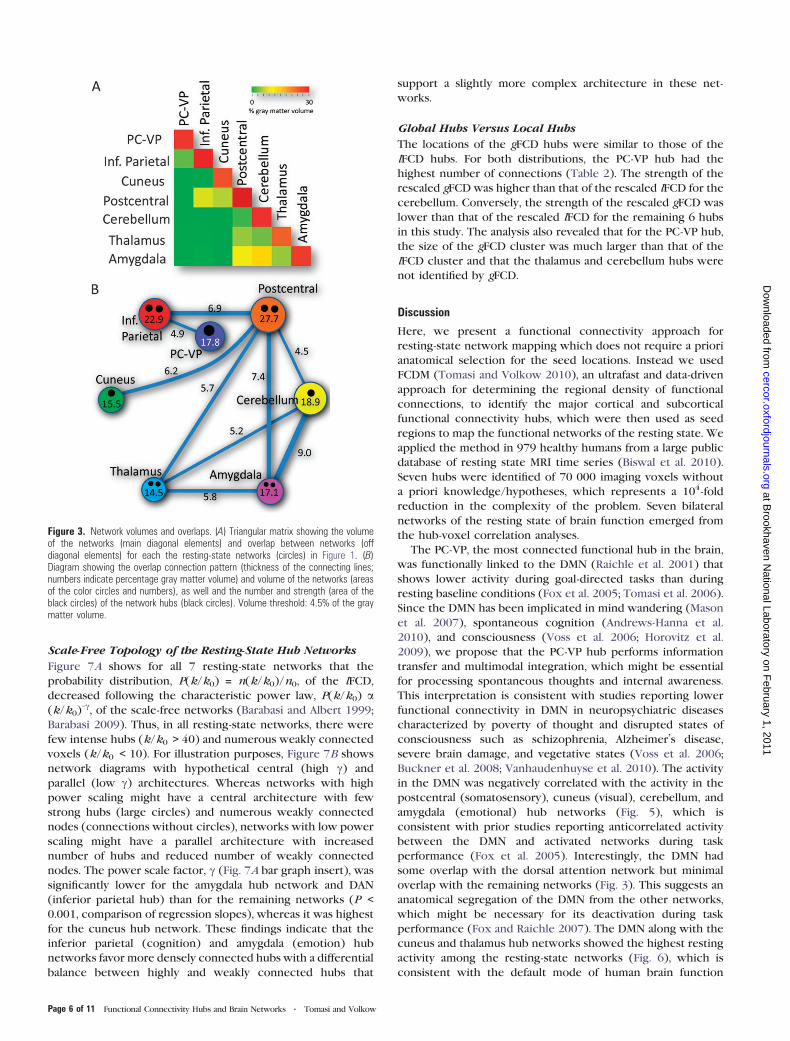
Network Overlap
The lower triangular matrix in Figure 3A shows the volume of
the networks (main diagonal matrix elements) and the overlap
between networks (off diagonal matrix elements), which was
greatest for the amygdala, postcentral, and thalamus hub
networks (Fig. 3B, connecting lines). The amygdala hub
network overlapped with the cerebellum, postcentral, and
thalamus hub networks. The postcentral hub network further
overlapped with the thalamus, cuneus, and inferior parietal hub
networks. The thalamus hub network further overlapped with
the cerebellum hub network. The remaining overlaps between
networks were lower than 5% of the gray matter volume.
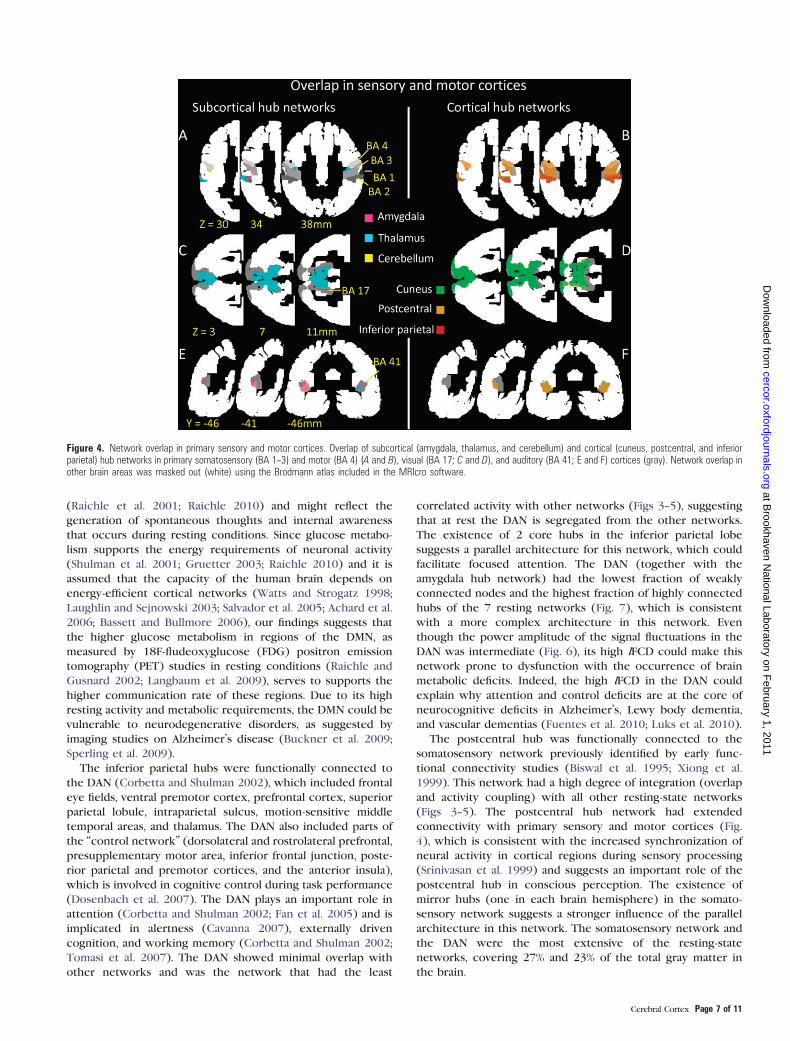
We determined the representation of the networks in
sensory areas by overlaying the networks on primary somato-
sensory, motor, visual, and auditory cortices (Fig. 4). Sub-
cortical hub networks had minimal connectivity with primary
somatosensory and motor cortices (BAs 1--4; Fig. 4A). The
thalamus hub network overlapped minimally with BA 3 and
more significantly with BA 2, the amygdala hub network
overlapped with a small fraction of BA 3, and the cerebellum
hub network overlapped minimally with BA 4. Conversely,
some of the cortical hub networks had large overlap with
somatosensory and motor cortices (Fig. 4B). The postcentral
hub network overlapped largely with BAs 1--4, and the DAN
overlapped largely with BA 2. Furthermore, the postcentral hub
network overlapped largely with the cuneus and thalamus hub
networks in the primary visual cortex (BA 17; Fig. 4C,D) and
thalamus and amygdala hub networks in the primary auditory
cortex (BA 41; Fig. 4E,F).
Coupling between Hubs and Networks
Across all 979 subjects and similarly to the single-subject
analysis (see Supplementary Data), the coupling of the hubs
Table 3Statistical significance (T-score) of clusters functionally connected to the cortical hubs (bolded)
and their location in the Talairach stereotactic space
BA/nucleus X(mm)
Y(mm)
Z(mm)
T-score
‘‘Default mode’’ networkPC-VP 23/31 4 �52 29 65.27Parahippocampal 35 �23 �22 �17 15.66Parahippocampal 28 21 �20 �16 14.95Angular 39 46 �61 26 37.13Angular 39 �49 �63 25 32.9Medial frontal 9 �1 50 23 26.08Superior frontal 6 21 27 53 25.96Anterior cingulate 32 �1 49 4 24.54Middle temporal 21 55 �9 �15 24.29Middle temporal 21 57 �32 �3 16.37Inferior frontal 47 30 17 �15 10.69Inferior temporal 21 �56 �11 �17 21.3Inferior frontal 47 �28 12 �17 10.84Superior temporal 38 �37 18 �24 9.07Cerebellum Semilunar lobule �29 �74 �36 13.67Brainstem Medulla �6 �48 �41 12.42Brainstem Medulla 5 �45 �43 11.29Cerebellum Pyramis 21 �78 �30 11.64Cerebellum Semilunar lobule 35 �68 �37 9.45Inferior frontal gyrus 47 38 30 �8 11.06Brainstem Midbrain �1 �14 �13 8.81Brainstem Pons �1 �19 �22 8.34
‘‘Dorsal attention’’ networkInferior parietal lobule 40 �38 �53 39 52.46Precuneus 7 �10 �70 38 15.58Inferior parietal lobule 40 37 �51 41 21.6Middle frontal 9 �43 24 30 17.64Middle frontal 10 �40 40 13 16.49Precentral 6 �40 1 33 15.39Middle frontal 9 43 26 32 15.04Middle temporal 37 �54 �51 �10 14.92Subgyral 6 �27 2 55 13.75Precuneus 7 9 �70 41 13.6Superior frontal 8 �4 19 49 13.38Inferior temporal 20 52 �46 �10 13.16Cerebellum Pyramis 10 �72 �27 10.15Cerebellum Tonsil 24 �57 �33 10.11Cerebellum Semilunar lobule 33 �62 �42 8.75Cerebellum Tonsil �29 �57 �34 9.1Cerebellum Pyramis �9 �72 �30 9.05Thalamus Ventral lateral 10 �10 3 9Globus pallidus Lentiform 16 �2 7 8.78Caudate Body 10 6 13 8.64Hippocampus �26 �38 �2 8.03
‘‘Visual’’ networkCuneus 18 �24 �80 18 53.81Middle occipital 19 26 �82 19 34.05Cuneus 18 4 �82 16 26.62Fusiform 19 �23 �68 �11 24.91Lingual 18 �9 �74 �6 23.75Precentral 4 �41 �15 54 11.79Precuneus 7 �7 �47 59 8.04
‘‘Somatosensory’’ networkPostcentral 5 20 �44 57 44.85Postcentral 5 �24 �43 57 20.54Precentral 6 20 �19 62 16.47Medial frontal 6 4 �21 54 15.91Insula 13 46 �32 24 15.54Insula 13 �48 �28 17 14.03Cuneus 18 �13 �82 21 11.16Cuneus 18 12 �80 21 11.13Middle occipital 37 38 �61 5 10.85
Page 4 of 11 Functional Connectivity Hubs and Brain Networks d Tomasi and Volkow
at Brookhaven N
ational Laboratory on February 1, 2011
cercor.oxfordjournals.orgD
ownloaded from
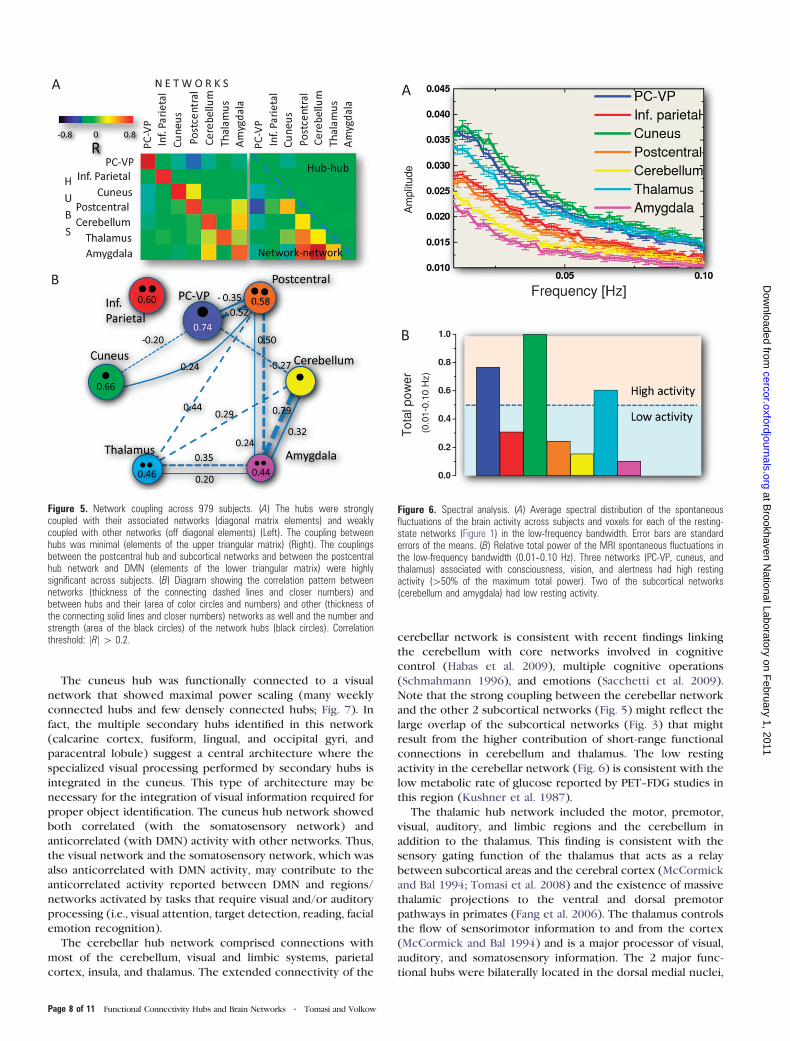
with their corresponding networks (diagonal correlation
matrix elements; Fig. 5A left) was much stronger than with
other networks (off diagonal elements) and the coupling
between the PC-VP hub and the DMN was maximal. The
resting-state activity in the cerebellum hub was significantly
correlated with the average activity in the amygdala hub
network. Similarly, the resting-state activity in the PC-VP hub
was significantly anticorrelated with the average activity in the
postcentral hub network. There was minimal coupling be-
tween hubs (elements of the upper triangular correlation
matrix; Fig. 5A right panel) and a much stronger coupling
between networks (elements of the lower triangular correla-
tion matrix; Fig. 5A right panel). Specifically, the average signals
in the subcortical hub networks (networks defined by hubs in
cerebellum, thalamus, and amygdala) and the postcentral hub
network were significantly correlated (R > 0.3), whereas the
amygdala and cerebellum hub networks and the amygdala and
postcentral hub networks showed the strongest positive
coupling and the DMN and the postcentral hub network and
the DMN and the cuneus hub network showed the strongest
negative coupling (Fig. 5B).
Spectral Distribution of the Resting Brain Activity
The spectral distributions in Figure 6 show the 0.01–0.10 Hz
low-frequency bandwidth of the average MRI signal time series
across 979 subjects and imaging voxels for each of the 7
resting-state networks. While the analysis of single-subject data
highlighted resonance frequencies that vary across subjects
and imaging voxels (not shown), the average resting-state
activity in each of the networks (Fig. 6A) did not show any
resonance frequency and exhibited a monotonic decrease as
a function of frequency that reflects the signal averaging across
subjects and imaging voxels in the networks. The average
power amplitude of the resting-state activity in the low-
frequency bandwidth was highest for the DMN, consistently
with previous studies (Zuo et al. 2010), and for the cuneus and
thalamus hub networks and lowest for the cerebellum and
amygdala hub networks (Fig. 6B).
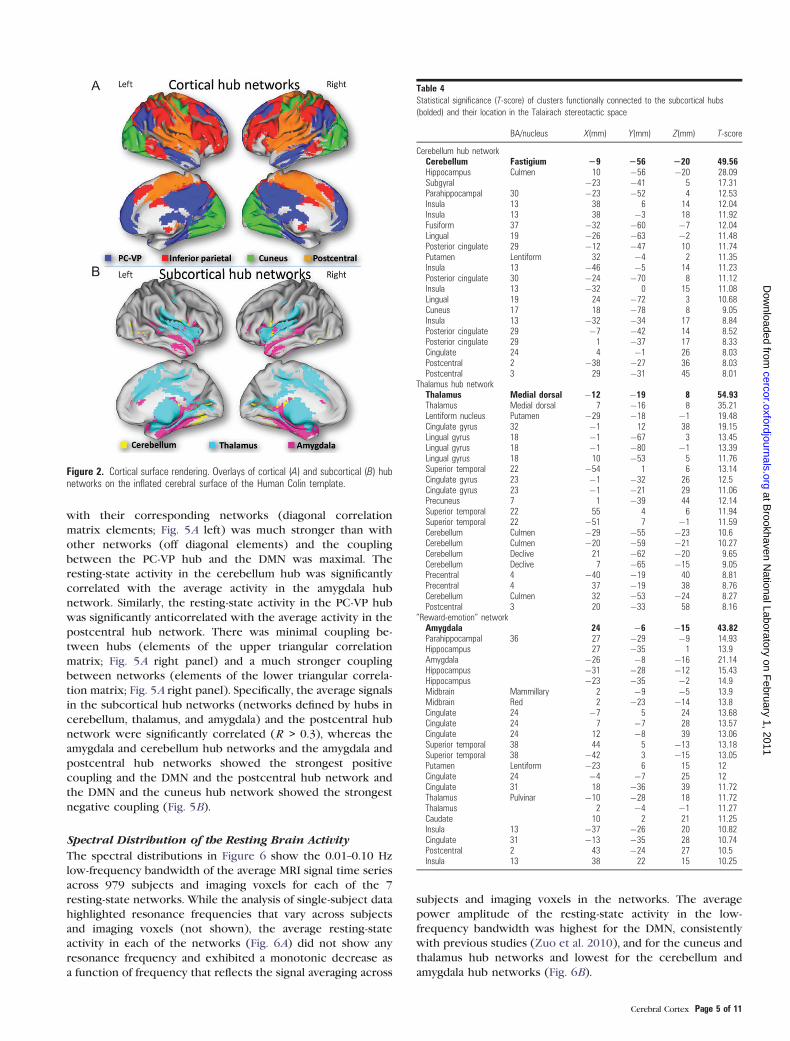
Figure 2. Cortical surface rendering. Overlays of cortical (A) and subcortical (B) hubnetworks on the inflated cerebral surface of the Human Colin template.
Table 4Statistical significance (T-score) of clusters functionally connected to the subcortical hubs
(bolded) and their location in the Talairach stereotactic space
BA/nucleus X(mm) Y(mm) Z(mm) T-score
Cerebellum hub networkCerebellum Fastigium 29 256 220 49.56Hippocampus Culmen 10 �56 �20 28.09Subgyral �23 �41 5 17.31Parahippocampal 30 �23 �52 4 12.53Insula 13 38 6 14 12.04Insula 13 38 �3 18 11.92Fusiform 37 �32 �60 �7 12.04Lingual 19 �26 �63 �2 11.48Posterior cingulate 29 �12 �47 10 11.74Putamen Lentiform 32 �4 2 11.35Insula 13 �46 �5 14 11.23Posterior cingulate 30 �24 �70 8 11.12Insula 13 �32 0 15 11.08Lingual 19 24 �72 3 10.68Cuneus 17 18 �78 8 9.05Insula 13 �32 �34 17 8.84Posterior cingulate 29 �7 �42 14 8.52Posterior cingulate 29 1 �37 17 8.33Cingulate 24 4 �1 26 8.03Postcentral 2 �38 �27 36 8.03Postcentral 3 29 �31 45 8.01
Thalamus hub networkThalamus Medial dorsal �12 �19 8 54.93Thalamus Medial dorsal 7 �16 8 35.21Lentiform nucleus Putamen �29 �18 �1 19.48Cingulate gyrus 32 �1 12 38 19.15Lingual gyrus 18 �1 �67 3 13.45Lingual gyrus 18 �1 �80 �1 13.39Lingual gyrus 18 10 �53 5 11.76Superior temporal 22 �54 1 6 13.14Cingulate gyrus 23 �1 �32 26 12.5Cingulate gyrus 23 �1 �21 29 11.06Precuneus 7 1 �39 44 12.14Superior temporal 22 55 4 6 11.94Superior temporal 22 �51 7 �1 11.59Cerebellum Culmen �29 �55 �23 10.6Cerebellum Culmen �20 �59 �21 10.27Cerebellum Declive 21 �62 �20 9.65Cerebellum Declive 7 �65 �15 9.05Precentral 4 �40 �19 40 8.81Precentral 4 37 �19 38 8.76Cerebellum Culmen 32 �53 �24 8.27Postcentral 3 20 �33 58 8.16
‘‘Reward-emotion’’ networkAmygdala 24 �6 �15 43.82Parahippocampal 36 27 �29 �9 14.93Hippocampus 27 �35 1 13.9Amygdala �26 �8 �16 21.14Hippocampus �31 �28 �12 15.43Hippocampus �23 �35 �2 14.9Midbrain Mammillary 2 �9 �5 13.9Midbrain Red 2 �23 �14 13.8Cingulate 24 �7 5 24 13.68Cingulate 24 7 �7 28 13.57Cingulate 24 12 �8 39 13.06Superior temporal 38 44 5 �13 13.18Superior temporal 38 �42 3 �15 13.05Putamen Lentiform �23 6 15 12Cingulate 24 �4 �7 25 12Cingulate 31 18 �36 39 11.72Thalamus Pulvinar �10 �28 18 11.72Thalamus 2 �4 �1 11.27Caudate 10 2 21 11.25Insula 13 �37 �26 20 10.82Cingulate 31 �13 �35 28 10.74Postcentral 2 43 �24 27 10.5Insula 13 38 22 15 10.25
Cerebral Cortex Page 5 of 11
at Brookhaven N
ational Laboratory on February 1, 2011
cercor.oxfordjournals.orgD
ownloaded from
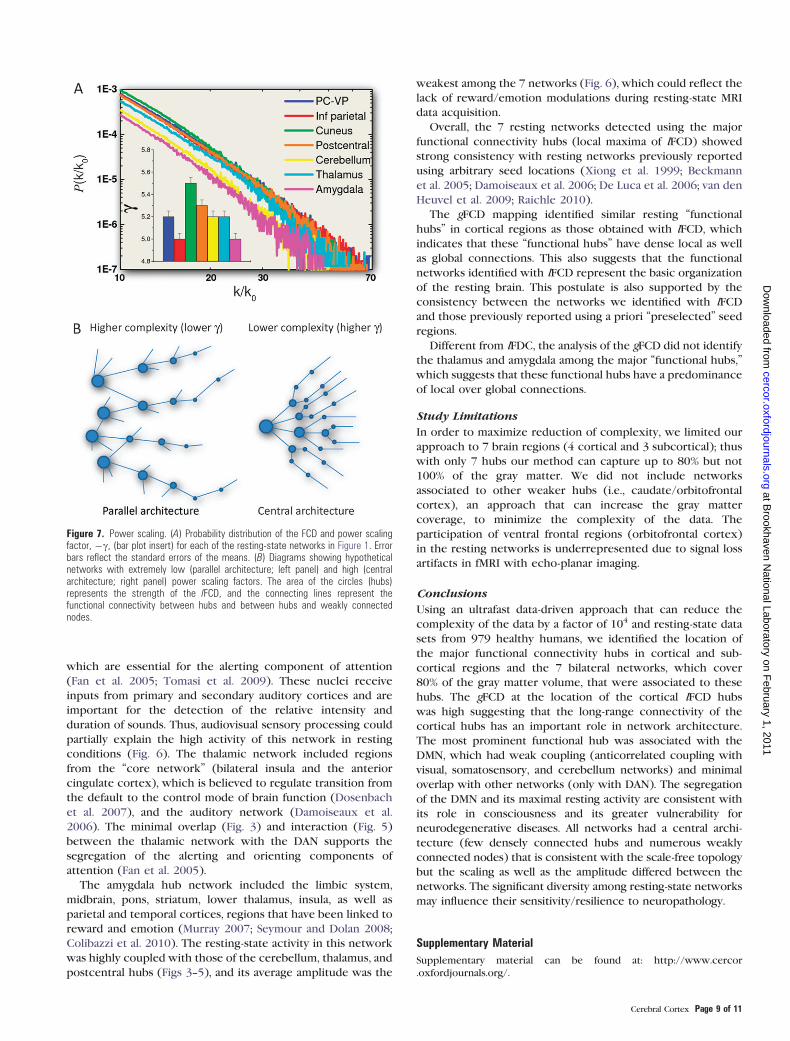
Scale-Free Topology of the Resting-State Hub Networks
Figure 7A shows for all 7 resting-state networks that the
probability distribution, P(k/k0) = n(k/k0)/n0, of the lFCD,
decreased following the characteristic power law, P(k/k0) a(k/k0)
–c, of the scale-free networks (Barabasi and Albert 1999;
Barabasi 2009). Thus, in all resting-state networks, there were
few intense hubs (k/k0 > 40) and numerous weakly connected
voxels (k/k0 < 10). For illustration purposes, Figure 7B shows
network diagrams with hypothetical central (high c) and
parallel (low c) architectures. Whereas networks with high
power scaling might have a central architecture with few
strong hubs (large circles) and numerous weakly connected
nodes (connections without circles), networks with low power
scaling might have a parallel architecture with increased
number of hubs and reduced number of weakly connected
nodes. The power scale factor, c (Fig. 7A bar graph insert), was
significantly lower for the amygdala hub network and DAN
(inferior parietal hub) than for the remaining networks (P <
0.001, comparison of regression slopes), whereas it was highest
for the cuneus hub network. These findings indicate that the
inferior parietal (cognition) and amygdala (emotion) hub
networks favor more densely connected hubs with a differential
balance between highly and weakly connected hubs that
support a slightly more complex architecture in these net-
works.
Global Hubs Versus Local Hubs
The locations of the gFCD hubs were similar to those of the
lFCD hubs. For both distributions, the PC-VP hub had the
highest number of connections (Table 2). The strength of the
rescaled gFCD was higher than that of the rescaled lFCD for the
cerebellum. Conversely, the strength of the rescaled gFCD was
lower than that of the rescaled lFCD for the remaining 6 hubs
in this study. The analysis also revealed that for the PC-VP hub,
the size of the gFCD cluster was much larger than that of the
lFCD cluster and that the thalamus and cerebellum hubs were
not identified by gFCD.
Discussion
Here, we present a functional connectivity approach for
resting-state network mapping which does not require a priori
anatomical selection for the seed locations. Instead we used
FCDM (Tomasi and Volkow 2010), an ultrafast and data-driven
approach for determining the regional density of functional
connections, to identify the major cortical and subcortical
functional connectivity hubs, which were then used as seed
regions to map the functional networks of the resting state. We
applied the method in 979 healthy humans from a large public
database of resting state MRI time series (Biswal et al. 2010).
Seven hubs were identified of 70 000 imaging voxels without
a priori knowledge/hypotheses, which represents a 104-fold
reduction in the complexity of the problem. Seven bilateral
networks of the resting state of brain function emerged from
the hub-voxel correlation analyses.
The PC-VP, the most connected functional hub in the brain,
was functionally linked to the DMN (Raichle et al. 2001) that
shows lower activity during goal-directed tasks than during
resting baseline conditions (Fox et al. 2005; Tomasi et al. 2006).
Since the DMN has been implicated in mind wandering (Mason
et al. 2007), spontaneous cognition (Andrews-Hanna et al.
2010), and consciousness (Voss et al. 2006; Horovitz et al.
2009), we propose that the PC-VP hub performs information
transfer and multimodal integration, which might be essential
for processing spontaneous thoughts and internal awareness.
This interpretation is consistent with studies reporting lower
functional connectivity in DMN in neuropsychiatric diseases
characterized by poverty of thought and disrupted states of
consciousness such as schizophrenia, Alzheimer’s disease,
severe brain damage, and vegetative states (Voss et al. 2006;
Buckner et al. 2008; Vanhaudenhuyse et al. 2010). The activity
in the DMN was negatively correlated with the activity in the
postcentral (somatosensory), cuneus (visual), cerebellum, and
amygdala (emotional) hub networks (Fig. 5), which is
consistent with prior studies reporting anticorrelated activity
between the DMN and activated networks during task
performance (Fox et al. 2005). Interestingly, the DMN had
some overlap with the dorsal attention network but minimal
overlap with the remaining networks (Fig. 3). This suggests an
anatomical segregation of the DMN from the other networks,
which might be necessary for its deactivation during task
performance (Fox and Raichle 2007). The DMN along with the
cuneus and thalamus hub networks showed the highest resting
activity among the resting-state networks (Fig. 6), which is
consistent with the default mode of human brain function
Figure 3. Network volumes and overlaps. (A) Triangular matrix showing the volumeof the networks (main diagonal elements) and overlap between networks (offdiagonal elements) for each the resting-state networks (circles) in Figure 1. (B)Diagram showing the overlap connection pattern (thickness of the connecting lines;numbers indicate percentage gray matter volume) and volume of the networks (areasof the color circles and numbers), as well and the number and strength (area of theblack circles) of the network hubs (black circles). Volume threshold: 4.5% of the graymatter volume.
Page 6 of 11 Functional Connectivity Hubs and Brain Networks d Tomasi and Volkow
at Brookhaven N
ational Laboratory on February 1, 2011
cercor.oxfordjournals.orgD
ownloaded from
(Raichle et al. 2001; Raichle 2010) and might reflect the
generation of spontaneous thoughts and internal awareness
that occurs during resting conditions. Since glucose metabo-
lism supports the energy requirements of neuronal activity
(Shulman et al. 2001; Gruetter 2003; Raichle 2010) and it is
assumed that the capacity of the human brain depends on
energy-efficient cortical networks (Watts and Strogatz 1998;
Laughlin and Sejnowski 2003; Salvador et al. 2005; Achard et al.
2006; Bassett and Bullmore 2006), our findings suggests that
the higher glucose metabolism in regions of the DMN, as
measured by 18F-fludeoxyglucose (FDG) positron emission
tomography (PET) studies in resting conditions (Raichle and
Gusnard 2002; Langbaum et al. 2009), serves to supports the
higher communication rate of these regions. Due to its high
resting activity and metabolic requirements, the DMN could be
vulnerable to neurodegenerative disorders, as suggested by
imaging studies on Alzheimer’s disease (Buckner et al. 2009;
Sperling et al. 2009).
The inferior parietal hubs were functionally connected to
the DAN (Corbetta and Shulman 2002), which included frontal
eye fields, ventral premotor cortex, prefrontal cortex, superior
parietal lobule, intraparietal sulcus, motion-sensitive middle
temporal areas, and thalamus. The DAN also included parts of
the ‘‘control network’’ (dorsolateral and rostrolateral prefrontal,
presupplementary motor area, inferior frontal junction, poste-
rior parietal and premotor cortices, and the anterior insula),
which is involved in cognitive control during task performance
(Dosenbach et al. 2007). The DAN plays an important role in
attention (Corbetta and Shulman 2002; Fan et al. 2005) and is
implicated in alertness (Cavanna 2007), externally driven
cognition, and working memory (Corbetta and Shulman 2002;
Tomasi et al. 2007). The DAN showed minimal overlap with
other networks and was the network that had the least
correlated activity with other networks (Figs 3--5), suggesting
that at rest the DAN is segregated from the other networks.
The existence of 2 core hubs in the inferior parietal lobe
suggests a parallel architecture for this network, which could
facilitate focused attention. The DAN (together with the
amygdala hub network) had the lowest fraction of weakly
connected nodes and the highest fraction of highly connected
hubs of the 7 resting networks (Fig. 7), which is consistent
with a more complex architecture in this network. Even
though the power amplitude of the signal fluctuations in the
DAN was intermediate (Fig. 6), its high lFCD could make this
network prone to dysfunction with the occurrence of brain
metabolic deficits. Indeed, the high lFCD in the DAN could
explain why attention and control deficits are at the core of
neurocognitive deficits in Alzheimer’s, Lewy body dementia,
and vascular dementias (Fuentes et al. 2010; Luks et al. 2010).
The postcentral hub was functionally connected to the
somatosensory network previously identified by early func-
tional connectivity studies (Biswal et al. 1995; Xiong et al.
1999). This network had a high degree of integration (overlap
and activity coupling) with all other resting-state networks
(Figs 3--5). The postcentral hub network had extended
connectivity with primary sensory and motor cortices (Fig.
4), which is consistent with the increased synchronization of
neural activity in cortical regions during sensory processing
(Srinivasan et al. 1999) and suggests an important role of the
postcentral hub in conscious perception. The existence of
mirror hubs (one in each brain hemisphere) in the somato-
sensory network suggests a stronger influence of the parallel
architecture in this network. The somatosensory network and
the DAN were the most extensive of the resting-state
networks, covering 27% and 23% of the total gray matter in
the brain.
Figure 4. Network overlap in primary sensory and motor cortices. Overlap of subcortical (amygdala, thalamus, and cerebellum) and cortical (cuneus, postcentral, and inferiorparietal) hub networks in primary somatosensory (BA 1--3) and motor (BA 4) (A and B), visual (BA 17; C and D), and auditory (BA 41; E and F) cortices (gray). Network overlap inother brain areas was masked out (white) using the Brodmann atlas included in the MRIcro software.
Cerebral Cortex Page 7 of 11
at Brookhaven N
ational Laboratory on February 1, 2011
cercor.oxfordjournals.orgD
ownloaded from
The cuneus hub was functionally connected to a visual
network that showed maximal power scaling (many weekly
connected hubs and few densely connected hubs; Fig. 7). In
fact, the multiple secondary hubs identified in this network
(calcarine cortex, fusiform, lingual, and occipital gyri, and
paracentral lobule) suggest a central architecture where the
specialized visual processing performed by secondary hubs is
integrated in the cuneus. This type of architecture may be
necessary for the integration of visual information required for
proper object identification. The cuneus hub network showed
both correlated (with the somatosensory network) and
anticorrelated (with DMN) activity with other networks. Thus,
the visual network and the somatosensory network, which was
also anticorrelated with DMN activity, may contribute to the
anticorrelated activity reported between DMN and regions/
networks activated by tasks that require visual and/or auditory
processing (i.e., visual attention, target detection, reading, facial
emotion recognition).
The cerebellar hub network comprised connections with
most of the cerebellum, visual and limbic systems, parietal
cortex, insula, and thalamus. The extended connectivity of the
cerebellar network is consistent with recent findings linking
the cerebellum with core networks involved in cognitive
control (Habas et al. 2009), multiple cognitive operations
(Schmahmann 1996), and emotions (Sacchetti et al. 2009).
Note that the strong coupling between the cerebellar network
and the other 2 subcortical networks (Fig. 5) might reflect the
large overlap of the subcortical networks (Fig. 3) that might
result from the higher contribution of short-range functional
connections in cerebellum and thalamus. The low resting
activity in the cerebellar network (Fig. 6) is consistent with the
low metabolic rate of glucose reported by PET--FDG studies in
this region (Kushner et al. 1987).
The thalamic hub network included the motor, premotor,
visual, auditory, and limbic regions and the cerebellum in
addition to the thalamus. This finding is consistent with the
sensory gating function of the thalamus that acts as a relay
between subcortical areas and the cerebral cortex (McCormick
and Bal 1994; Tomasi et al. 2008) and the existence of massive
thalamic projections to the ventral and dorsal premotor
pathways in primates (Fang et al. 2006). The thalamus controls
the flow of sensorimotor information to and from the cortex
(McCormick and Bal 1994) and is a major processor of visual,
auditory, and somatosensory information. The 2 major func-
tional hubs were bilaterally located in the dorsal medial nuclei,
Figure 5. Network coupling across 979 subjects. (A) The hubs were stronglycoupled with their associated networks (diagonal matrix elements) and weaklycoupled with other networks (off diagonal elements) (Left). The coupling betweenhubs was minimal (elements of the upper triangular matrix) (Right). The couplingsbetween the postcentral hub and subcortical networks and between the postcentralhub network and DMN (elements of the lower triangular matrix) were highlysignificant across subjects. (B) Diagram showing the correlation pattern betweennetworks (thickness of the connecting dashed lines and closer numbers) andbetween hubs and their (area of color circles and numbers) and other (thickness ofthe connecting solid lines and closer numbers) networks as well and the number andstrength (area of the black circles) of the network hubs (black circles). Correlationthreshold: jRj[ 0.2.
Figure 6. Spectral analysis. (A) Average spectral distribution of the spontaneousfluctuations of the brain activity across subjects and voxels for each of the resting-state networks (Figure 1) in the low-frequency bandwidth. Error bars are standarderrors of the means. (B) Relative total power of the MRI spontaneous fluctuations inthe low-frequency bandwidth (0.01--0.10 Hz). Three networks (PC-VP, cuneus, andthalamus) associated with consciousness, vision, and alertness had high restingactivity ([50% of the maximum total power). Two of the subcortical networks(cerebellum and amygdala) had low resting activity.
Page 8 of 11 Functional Connectivity Hubs and Brain Networks d Tomasi and Volkow
at Brookhaven N
ational Laboratory on February 1, 2011
cercor.oxfordjournals.orgD
ownloaded from
which are essential for the alerting component of attention
(Fan et al. 2005; Tomasi et al. 2009). These nuclei receive
inputs from primary and secondary auditory cortices and are
important for the detection of the relative intensity and
duration of sounds. Thus, audiovisual sensory processing could
partially explain the high activity of this network in resting
conditions (Fig. 6). The thalamic network included regions
from the ‘‘core network’’ (bilateral insula and the anterior
cingulate cortex), which is believed to regulate transition from
the default to the control mode of brain function (Dosenbach
et al. 2007), and the auditory network (Damoiseaux et al.
2006). The minimal overlap (Fig. 3) and interaction (Fig. 5)
between the thalamic network with the DAN supports the
segregation of the alerting and orienting components of
attention (Fan et al. 2005).
The amygdala hub network included the limbic system,
midbrain, pons, striatum, lower thalamus, insula, as well as
parietal and temporal cortices, regions that have been linked to
reward and emotion (Murray 2007; Seymour and Dolan 2008;
Colibazzi et al. 2010). The resting-state activity in this network
was highly coupled with those of the cerebellum, thalamus, and
postcentral hubs (Figs 3--5), and its average amplitude was the
weakest among the 7 networks (Fig. 6), which could reflect the
lack of reward/emotion modulations during resting-state MRI
data acquisition.
Overall, the 7 resting networks detected using the major
functional connectivity hubs (local maxima of lFCD) showed
strong consistency with resting networks previously reported
using arbitrary seed locations (Xiong et al. 1999; Beckmann
et al. 2005; Damoiseaux et al. 2006; De Luca et al. 2006; van den
Heuvel et al. 2009; Raichle 2010).
The gFCD mapping identified similar resting ‘‘functional
hubs’’ in cortical regions as those obtained with lFCD, which
indicates that these ‘‘functional hubs’’ have dense local as well
as global connections. This also suggests that the functional
networks identified with lFCD represent the basic organization
of the resting brain. This postulate is also supported by the
consistency between the networks we identified with lFCD
and those previously reported using a priori ‘‘preselected’’ seed
regions.
Different from lFDC, the analysis of the gFCD did not identify
the thalamus and amygdala among the major ‘‘functional hubs,’’
which suggests that these functional hubs have a predominance
of local over global connections.
Study Limitations
In order to maximize reduction of complexity, we limited our
approach to 7 brain regions (4 cortical and 3 subcortical); thus
with only 7 hubs our method can capture up to 80% but not
100% of the gray matter. We did not include networks
associated to other weaker hubs (i.e., caudate/orbitofrontal
cortex), an approach that can increase the gray matter
coverage, to minimize the complexity of the data. The
participation of ventral frontal regions (orbitofrontal cortex)
in the resting networks is underrepresented due to signal loss
artifacts in fMRI with echo-planar imaging.
Conclusions
Using an ultrafast data-driven approach that can reduce the
complexity of the data by a factor of 104 and resting-state data
sets from 979 healthy humans, we identified the location of
the major functional connectivity hubs in cortical and sub-
cortical regions and the 7 bilateral networks, which cover
80% of the gray matter volume, that were associated to these
hubs. The gFCD at the location of the cortical lFCD hubs
was high suggesting that the long-range connectivity of the
cortical hubs has an important role in network architecture.
The most prominent functional hub was associated with the
DMN, which had weak coupling (anticorrelated coupling with
visual, somatosensory, and cerebellum networks) and minimal
overlap with other networks (only with DAN). The segregation
of the DMN and its maximal resting activity are consistent with
its role in consciousness and its greater vulnerability for
neurodegenerative diseases. All networks had a central archi-
tecture (few densely connected hubs and numerous weakly
connected nodes) that is consistent with the scale-free topology
but the scaling as well as the amplitude differed between the
networks. The significant diversity among resting-state networks
may influence their sensitivity/resilience to neuropathology.
Supplementary Material
Supplementary material can be found at: http://www.cercor
.oxfordjournals.org/.
Figure 7. Power scaling. (A) Probability distribution of the FCD and power scalingfactor, �c, (bar plot insert) for each of the resting-state networks in Figure 1. Errorbars reflect the standard errors of the means. (B) Diagrams showing hypotheticalnetworks with extremely low (parallel architecture; left panel) and high (centralarchitecture; right panel) power scaling factors. The area of the circles (hubs)represents the strength of the lFCD, and the connecting lines represent thefunctional connectivity between hubs and between hubs and weakly connectednodes.
Cerebral Cortex Page 9 of 11
at Brookhaven N
ational Laboratory on February 1, 2011
cercor.oxfordjournals.orgD
ownloaded from
Funding
National Institutes of Alcohol Abuse and Alcoholism
(2RO1AA09481).
Notes
Conflict of Interest : None declared.
References
Achard S, Salvador R, Whitcher B, Suckling J, Bullmore E. 2006.
A resilient, low-frequency, small-world human brain functional
network with highly connected association cortical hubs. J Neuro-
sci. 26:63--72.
Andrews-Hanna JR, Reidler JS, Sepulcre J, Poulin R, Buckner RL. 2010.
Functional-anatomic fractionation of the brain’s default network.
Neuron. 65:550--562.
Barabasi AL. 2009. Scale-free networks: a decade and beyond. Science.
325:412--413.
Barabasi AL, Albert R. 1999. Emergence of scaling in random networks.
Science. 286:509--512.
Bassett DS, Bullmore E. 2006. Small-world brain networks. Neuroscien-
tist. 12:512--523.
Beckmann CF, DeLuca M, Devlin JT, Smith SM. 2005. Investigations into
resting-state connectivity using independent component analysis.
Philos Trans R Soc Lond B Biol Sci. 360:1001--1013.
Biswal B, Yetkin FZ, Haughton VM, Hyde JS. 1995. Functional
connectivity in the motor cortex of resting human brain using
echo-planar MRI. Magn Reson Med. 34:537--541.
Biswal BB, Mennes M, Zuo XN, Gohel S, Kelly C, Smith SM,
Beckmann CF, Adelstein JS, Buckner RL, Colcombe S, et al. 2010.
Toward discovery science of human brain function. Proc Natl Acad
Sci U S A. 107:4734--4739.
Buckner RL, Andrews-Hanna JR, Schacter DL. 2008. The brain’s default
network: anatomy, function, and relevance to disease. Ann N Y Acad
Sci. 1124:1--38.
Buckner RL, Sepulcre J, Talukdar T, Krienen FM, Liu H, Hedden T,
Andrews-Hanna JR, Sperling RA, Johnson KA. 2009. Cortical hubs
revealed by intrinsic functional connectivity: mapping, assessment
of stability, and relation to Alzheimer’s disease. J Neurosci.
29:1860--1873.
Cavanna AE. 2007. The precuneus and consciousness. CNS Spectr.
12:545--552.
Colibazzi T, Posner J, Wang Z, Gorman D, Gerber A, Yu S, Zhu H,
Kangarlu A, Duan Y, Russell JA, et al. 2010. Neural systems
subserving valence and arousal during the experience of induced
emotions. Emotion. 10:377--389.
Corbetta M, Shulman GL. 2002. Control of goal-directed and stimulus-
driven attention in the brain. Nat Rev Neurosci. 3:201--215.
Cordes D, Haughton VM, Arfanakis K, Carew JD, Turski PA, Moritz CH,
Quigley MA, Meyerand ME. 2001. Frequencies contributing to
functional connectivity in the cerebral cortex in ‘‘resting-state’’ data.
AJNR Am J Neuroradiol. 22:1326--1333.
Damoiseaux JS, Rombouts SA, Barkhof F, Scheltens P, Stam CJ, Smith SM,
Beckmann CF. 2006. Consistent resting-state networks across
healthy subjects. Proc Natl Acad Sci U S A. 103:13848--13853.
De Luca M, Beckmann CF, De Stefano N, Matthews PM, Smith SM. 2006.
fMRI resting state networks define distinct modes of long-distance
interactions in the human brain. Neuroimage. 29:1359--1367.
Dosenbach NU, Fair DA, Miezin FM, Cohen AL, Wenger KK,
Dosenbach RA, Fox MD, Snyder AZ, Vincent JL, Raichle ME, et al.
2007. Distinct brain networks for adaptive and stable task control in
humans. Proc Natl Acad Sci U S A. 104:11073--11078.
Fan J, McCandliss BD, Fossella J, Flombaum JI, Posner MI. 2005. The
activation of attentional networks. Neuroimage. 26:471--479.
Fang PC, Stepniewska I, Kaas JH. 2006. The thalamic connections of
motor, premotor, and prefrontal areas of cortex in a prosimian
primate (Otolemur garnetti). Neurosci. 143:987--1020.
Foerster B, Tomasi D, Caparelli EC. 2005. Magnetic field shift due to
mechanical vibration in functional magnetic resonance imaging.
Magn Reson Med. 54:1261--1267.
Fox MD, Raichle ME. 2007. Spontaneous fluctuations in brain activity
observed with functional magnetic resonance imaging. Nat Rev
Neurosci. 8:700--711.
Fox MD, Snyder AZ, Vincent JL, Corbetta M, Van Essen DC, Raichle ME.
2005. The human brain is intrinsically organized into dynamic,
anticorrelated functional networks. Proc Natl Acad Sci U S A.
102:9673--9678.
Friston K, Ashburner J, Kiebel S, Nichols T, Penny W. 2007. Statistical
Parametric Mapping: the analysis of functional brain images. London:
Academic Press.
Fuentes LJ, Fernandez PJ, Campoy G, Antequera MM, Garcıa-Sevilla J,
Antunez C. 2010. Attention network functioning in patients with
dementia with Lewy bodies and Alzheimer’s disease. Dement
Geriatr Cogn Disord. 29:139--145.
Gruetter R. 2003. Glycogen: the forgotten cerebral energy store.
J Neurosci Res. 74:179--183.
Habas C, Kamdar N, Nguyen D, Prater K, Beckmann CF, Menon V,
Greicius MD. 2009. Distinct cerebellar contributions to intrinsic
connectivity networks. J Neurosci. 29:8586--8594.
He BJ, Zempel JM, Snyder AZ, Raichle ME. 2010. The temporal
structures and functional significance of scale-free brain activity.
Neuron. 66:353--369.
Horovitz SG, Braun AR, Carr WS, Picchioni D, Balkin TJ, Fukunaga M,
Duyn JH. 2009. Decoupling of the brain’s default mode
network during deep sleep. Proc Natl Acad Sci U S A. 106:
11376--11381.
Kushner M, Tobin M, Alavi A, Chawluk J, Rosen M, Fazekas F, Alavi J,
Reivich M. 1987. Cerebellar glucose consumption in normal and
pathologic states using fluorine-FDG and PET. J Nucl Med.
28:1667--1670.
Lancaster JL, Tordesillas-Gutierrez D, Martinez M, Salinas F, Evans A,
Zilles K, Mazziotta JC, Fox PT. 2007. Bias between MNI and
Talairach coordinates analyzed using the ICBM-152 brain template.
Human Brain Mapp. 28:1194--1205.
Lancaster JL, Woldorff MG, Parsons LM, Liotti M, Freitas CS, Rainey L,
Kochunov PV, Nickerson D, Mikiten SA, Fox PT. 2000. Automated
Talairach atlas labels for functional brain mapping. Hum Brain Mapp.
10:120--131.
Langbaum JB, Chen K, Lee W, Reschke C, Bandy D, Fleisher AS,
Alexander GE, Foster NL, Weiner MW, Koeppe RA, et al. 2009.
Alzheimer’s disease neuroimaging initiative. Neuroimage.
45:1107--1116.
Laughlin SB, Sejnowski TJ. 2003. Communication in neuronal networks.
Science. 301:1870--1874.
Luks TL, Oliveira M, Possin KL, Bird A, Miller BL, Weiner MW,
Kramer JH. 2010. Atrophy in two attention networks is associated
with performance on a Flanker task in neurodegenerative disease.
Neuropsychologia. 48:165--170.
Mason MF, Norton MI, Van Horn JD, Wegner DM, Grafton ST,
Macrae CN. 2007. Wandering minds: the default network and
stimulus-independent thought. Science. 315:393--395.
McCormick DA, Bal T. 1994. Sensory gating mechanisms of the
thalamus. Curr Opin Neurobiol. 4:550--556.
Murray EA. 2007. The amygdala, reward and emotion. Trends Cogn Sci.
11:489--497.
Raichle ME, Gusnard DA. 2002. Appraising the brain’s energy budget.
Proc Nat Acad Sci U S A. 99:10237--10239.
Raichle ME. 2010. Two views of brain function. Trends Cogn Sci.
14:180--190.
Raichle ME, MacLeod AM, Snyder AZ, Powers WJ, Gusnard DA. 2001. A
default mode of brain function. Proc Natl Acad Sci U S A.
98:676--682.
Sacchetti B, Scelfo B, Strata P. 2009. Cerebellum and emotional
behavior. Neuroscience. 162:756--762.
Salvador R, Suckling J, Coleman MR, Pickard JD, Menon D,
Bullmore E. 2005. Neurophysiological architecture of functional
magnetic resonance images of human brain. Cereb Cortex.
15:1332--1342.
Schmahmann JD. 1996. From movement to thought: anatomic
substrates of the cerebellar contribution to cognitive processing.
Hum Brain Mapp. 4:174--198.
Page 10 of 11 Functional Connectivity Hubs and Brain Networks d Tomasi and Volkow
at Brookhaven N
ational Laboratory on February 1, 2011
cercor.oxfordjournals.orgD
ownloaded from
Seeley WW, Crawford RK, Zhou J, Miller BL, Greicius MD. 2009.
Neurodegenerative diseases target large-scale human brain net-
works. Neuron. 62:42--52.
Seymour B, Dolan R. 2008. Emotion, decision making, and the amygdala.
Neuron. 58:662--671.
Shulman GL, Corbetta M, Fiez JA, Buckner RL, Miezin FM, Raichle ME,
Petersen SE. 1997. Searching for activations that generalize over
tasks. Hum Brain Mapp. 5:317--322.
Shulman RG, Hyder F, Rothman DL. 2001. Lactate efflux and
the neuroenergetic basis of brain function. NMR Biomed.
14:389--396.
Sperling RA, Laviolette PS, O’Keefe K, O’Brien J, Rentz DM,
Pihlajamaki M, Marshall G, Hyman BT, Selkoe DJ, Hedden T, et al.
2009. Amyloid deposition is associated with impaired default
network function in older persons without dementia. Neuron.
63:178--188.
Srinivasan R, Russell DP, Edelman GM, Tononi G. 1999. Increased
synchronization of neuromagnetic responses during conscious
perception. J Neurosci. 19:5435--5448.
Tomasi D, Caparelli EC. 2007. Macrovascular contribution in
activation patterns of working memory. J Cereb Blood Flow Metab.
27:33--42.
Tomasi D, Chang L, Caparelli EC, Ernst T. 2007. Different activation
patterns for working memory load and visual attention load. Brain
Res. 1132:158--165.
Tomasi D, Chang L, Caparelli EC, Ernst T. 2008. Sex differences in
sensory gating of the thalamus during auditory interference of visual
attention tasks. Neurosci. 151:1006--1015.
Tomasi D, Ernst T, Caparelli EC, Chang L. 2006. Common deactivation
patterns during working memory and visual attention tasks: an intra-
subject fMRI study at 4 Tesla. Hum Brain Mapp. 27:694--705.
Tomasi D, Volkow ND. 2010. Functional connectivity density mapping.
Proc Natl Acad Sci U S A. 107:9885--9890.
Tomasi D, Wang RL, Telang F, Boronikolas V, Jayne MC, Wang GJ,
Fowler JS, Volkow ND. 2009. Impairment of attentional networks
after 1 night of sleep deprivation. Cereb Cortex. 19:233--240.
Tzourio-Mazoyer N, Landeau B, Papathanassiou D, Crivello F, Etard
ODelcroix N, Mazoyer B, Joliot M. 2002. Automated anatomical
labeling of activations in SPM using a macroscopic anatomical
parcellation of the MNI MRI single-subject brain. Neuroimage.
15:273--289.
van den Heuvel MP, Mandl RC, Kahn RS, Hulshoff Pol HE. 2009.
Functionally linked resting-state networks reflect the underlying
structural connectivity architecture of the human brain. Hum Brain
Mapp. 30:3127--3141.
van den Heuvel MP, Stam CJ, Boersma M, Hulshoff Pol HE. 2008. Small-
world and scale-free organization of voxel-based resting-state
functional connectivity in the human brain. Neuroimage.
43:528--539.
Vanhaudenhuyse A, Noirhomme Q, Tshibanda LJ, Bruno MA,
Boveroux P, Schnakers C, Soddu A, Perlbarg V, Ledoux D,
Brichant JF, et al. 2010. Default network connectivity reflects the
level of consciousness in non-communicative brain-damaged
patients. Brain. 133:161--171.
Voss HU, Ulucx AM, Dyke JP, Watts R, Kobylarz EJ, McCandliss BD,
Heier LA, Beattie BJ, Hamacher KA, Vallabhajosula S, et al. 2006.
Possible axonal regrowth in late recovery from the minimally
conscious state. J Clin Invest. 116:2005--2011.
Watts DJ, Strogatz SH. 1998. Collective dynamics of ’small-world’
networks. Nature. 393:440--442.
Xiong J, Parsons LM, Gao JH, Fox PT. 1999. Interregional connectivity to
primary motor cortex revealed using MRI resting state images. Hum
Brain Mapp. 8:151--156.
Zuo XN, Di Martino A, Kelly C, Shehzad ZE, Gee DG, Klein DF,
Castellanos FX, Biswal BB, Milham MP. 2010. The oscillating brain:
complex and reliable. Neuroimage. 49:1432--1445.
Cerebral Cortex Page 11 of 11
at Brookhaven N
ational Laboratory on February 1, 2011
cercor.oxfordjournals.orgD
ownloaded from
Related Documents