Welcome message from author
This document is posted to help you gain knowledge. Please leave a comment to let me know what you think about it! Share it to your friends and learn new things together.
Transcript
Tom Clark, Patricia Engelking and Kari Palmer of the Water Assessment and Reporting Section of the Environmental Analysis and Outcomes Division prepared this report, with assistance from other staff in the Municipal, Industrial, Regional, and the Environmental Analysis and Outcomes divisions.
Cost to prepare this report: Total staff hours: 342 Salary and fringe costs: $12,641 Production costs: $175
An electronic version of this report can be found on the MPCA web site at http://www.pca.state.mn.us/hot/legislature/reports/index.html This report can be made available in other formats, including Braille, large type, or audiotape upon request. This report is printed on paper with at least 30 percent post-consumer recycled paper.
Table of Contents
List of Tables and Figures..................................................................................................................... ii
Foreword .............................................................................................................................................. iii
Introduction and Summary ....................................................................................................................1
Chapter 1: Air Pollutant Emissions Overview......................................................................................6
Carbon Dioxide..........................................................................................................................7
Criteria Air Pollutant Emissions ................................................................................................9
Air Quality Index (AQI) ....................................................................................................11
Particulate Matter.........................................................................................................................13
Ammonia............................................................................................................................19
Sulfur Dioxide....................................................................................................................20
Nitrogen Oxides .................................................................................................................22
Ozone .................................................................................................................................24
Volatile Organic Compounds ............................................................................................25
Carbon Monoxide ..............................................................................................................27
Lead ...................................................................................................................................29 Mercury ...................................................................................................................................31
Air Toxics ................................................................................................................................33
Chapter 2: Water Pollutant Discharges Overview..............................................................................41
Major Water Discharge Parameters and Trends ......................................................................42
Total Suspended Solids......................................................................................................43
Biochemical Oxygen Demand (BOD ................................................................................44
Total Phosphorus ...............................................................................................................45
Nitrogen .............................................................................................................................46
Nonpoint Source Pollution.......................................................................................................47
Emerging Issues of Concern in Minnesota’s Environment .....................................................53
lrp-ear-2sy07
List of Tables
Table 1: Minnesota Air Pollution Emission Estimates, 2001-2005.................................................... 2 Table 2: Minnesota Water Pollution Discharge Estimates from Major Point Sources, 2001-2005 ... 3 Table 3: 2002 Minnesota Air Toxics Emissions Inventory Statewide Summary.............................. 34
List of Figures Sources of Carbon Dioxide Emissions from Fossil Fuel Burning in Minnesota, 2005....................... 7 Carbon Dioxide Emission Trends from Fossil Fuel Burning in Minnesota, 2001-2005..................... 8 AQI Days for Selected Cities in Minnesota, 2006............................................................................. 12 Sources of Direct Fine Particulate (PM2.5) Emissions in Minnesota, 2002 ....................................... 15 PM2.5 Composition in Minnesota in 2004.......................................................................................... 16 Sources of Direct PM10 Emissions in Minnesota, 2002 and 2005..................................................... 17 PM10 Point-Source Emission Trends by Sector in Minnesota, 2001-2005........................................ 18 Sources of Ammonia Emissions in Minnesota, 2002 ........................................................................ 19 Sources of Sulfur Dioxide Emissions in Minnesota, 2002 and 2005 ................................................ 20 Sulfur Dioxide Point-Source Emission Trends by Sector in Minnesota, 2001-2005 ........................ 21 Sources of Nitrogen Oxide Emissions in Minnesota, 2002 and 2005 ............................................... 22 Nitrogen Oxide Point-Source Emission Trends by Sector in Minnesota, 2001-2005 ....................... 23 Sources of Volatile Organic Compounds in Minnesota, 2002 and 2005........................................... 25 Volatile Organic Compound Point-Source Emission Trends by Sector in Minnesota, 2001-2005... 26 Sources of Carbon Monoxide Emissions in Minnesota, 2002 and 2005 ........................................... 27 Carbon Monoxide Point-Source Emissions Trends by Sector in Minnesota, 2001-2005 ................. 28 Sources of Lead Emissions in Minnesota, 2002 and 2005 ................................................................ 29 Lead Point Source Emission Trends by Sector in Minnesota, 2001-2005 ........................................ 30 Sources of Atmospheric Mercury Deposition to Minnesota.............................................................. 31 Trends in Minnesota Mercury Emissions from Human Activities, 1990-2005................................. 32 Contribution of Principal Source Categories to 2002 Air Toxics Emissions in Minnesota .............. 38 Contribution of Major Categories to 2002 Point Source Air Toxics Emissions in Minnesota.......... 39 Contribution of Major Categories to 2002 Area Source Air Toxics Emissions in Minnesota .......... 39 Contribution of Major Categories to 2002 Mobile Source Air Toxics Emissions in Minnesota ...... 40 Total Annual Pollutant Load by Basin from Major Wastewater Treatment Facilities, 2005 ............. 42 Total Suspended Solids Discharges from Major Point Sources, 2005 .............................................. 43 Biochemical Oxygen Demand Discharges from Major Point Sources, 2005.................................... 44 Total Phosphorus Discharges from Major Point Sources, 2005 ........................................................ 45 Ammonia Discharges from Major Point Sources, 2005 .................................................................... 46 Pollutant Trends at Minnesota Milestone Sites ................................................................................. 48 Pollution Reduction Benefits: All BMPs Including Easements, LARS (1997-2002) and eLINK (2003-2005......................................................................................................................... 51
ii
Foreword
The Annual Pollution Report statute requires the Minnesota Pollution Control Agency (MPCA) to estimate to the best of its ability the total amounts of air and water pollution emitted in the state during the most recent calendar year for which data are available. The statute further directs the MPCA to estimate the percentage increase or decrease over the previous calendar year, and to estimate the relative contributions of the various sources of these emissions and discharges to the environment. The MPCA prepares numerous scientific, policy and program progress reports on a routine basis. The Annual Pollution Report, prepared each year since 1996, is unique in its approach among the many MPCA reports and publications. It has evolved to include new kinds of information, such as discharges of toxic air pollutants, greenhouse gas emissions, and emerging issues of concern as these kinds of data have become available. The following observations of some advantages and limitations of this kind of report are presented for interested parties to add context and invite suggestions for improvements. Advantages of the inventory approach
The Annual Pollution Report is the only MPCA report that specifically asks for an accounting of emissions and discharges. Such inventories are inherently important, as understanding emission amounts and sources is fundamental in protecting the environment and human health.
The report attempts to track trends year to
year, which is valuable if data are reliable.
The report covers both air and water pollutants in one document, instead of separate reports, reminding readers of the potential for cross-media impacts.
The report shows relative contributions of
various pollution sources to the total.
Minn. Statutes 116.011 Annual pollution report. A goal of the pollution control agency is to reduce the amount of pollution that is emitted in the state. By April 1 of each year, the pollution control agency shall report the best estimate of the agency of the total volume of water and air pollution that was emitted in the state in the previous calendar year for which data are available. The agency shall report its findings for both water and air pollution: (1) in gross amounts, including the percentage increase or decrease over the previous calendar year; and (2) in a manner which will demonstrate the magnitude of the various sources of water and air pollution. HIST: 1995 c 247 art 1 s 36; 2001 c 187 s 3 Copyright 2001 by the Office of Revisor of Statutes, State of Minnesota.
Challenges to the inventory report approach
There is currently no reliable way to quantify the volumes of water pollutants released by nonpoint sources in the form of polluted runoff, such as city streets, construction sites and farm fields. This is a major gap in inventorying pollutants discharged, for a category highly culpable for water quality impairments.
Nonpoint source water pollutant estimates are highlighted in basin-loading studies, which attempt to
quantify the amounts of specific pollutants entering a given watershed from specific sources, both point and nonpoint. While this falls short of being able to quantify nonpoint source discharges statewide, it represents an important first step to better understanding the relative contributions of point and nonpoint sources to specific watersheds, which in turn can guide local and state officials in planning for water quality improvements.
iii
Challenges, cont.
Aggregating data into total volumes lacks the important context of relative risk. Pollutants emitted in smaller volumes can have a greater impact than some emitted in tremendously larger volumes. Volume figures are not able to indicate whether such emissions and discharges are acceptable or unacceptable from a risk assessment perspective.
The most current pollutant emissions and discharge data are usually at least two years behind real
time, sometimes more, depending on the type of pollutants. Air emission estimates are frequently revised as industrial output models and factors used to estimate emissions are refined. Year-to-year comparisons are not always reliable, as methodologies for estimating emissions are still evolving.
Outlook Several important national, regional and state actions that will reduce pollutant emissions and discharges now and in the future were enacted recently and are worth mentioning: Clean Air Interstate Rule: EPA adopted its Clean Air Interstate Rule (CAIR) in 2005 which sets up
a cap-and-trade system for 28 states to help lower emissions of sulfur dioxide (SO2) and nitrogen oxides (NOx) which are implicated in acid rain, particle and ozone formation and visibility impairment. CAIR should result in a significant decrease in SO2 and NOx in Minnesota.
Cleaner Diesel: Diesel exhaust emissions from trucks and buses contribute to many of the priority air issues in Minnesota. Work is being done to lower diesel emissions by providing cleaner diesel fuel and building and retrofitting engines so they run more cleanly.
o Midwest Clean Diesel Initiative: Minnesota is part of the Midwest Clean Diesel Initiative which was formed in January 2007. As part of the National Clean Diesel campaign, the Midwest Clean Diesel Initiative plans to bring forward a number of voluntary programs designed to reduce emissions from the diesel fleet.
o Blue Skyways: The Blue Skyways Collaborative was created to improve air quality by encouraging voluntary air emissions reductions in North America’s heartland. Participants collaborate in planning and implementing projects that use innovations in diesel engines, alternative fuels and renewable energy technologies.
o Project Green Fleet: Through Blue Skyways, the State recently received a grant to help fund “Project Green Fleet,” which is overseen by the Minnesota Environmental Initiative’s Clean Air Minnesota. The project seeks to reduce emissions from diesel school buses by installing control equipment. These retrofits can reduce tailpipe emissions of certain air pollutants by 40 to 90 percent and dramatically reduce pollution inside the bus. Using this grant and other sponsorships, Project Green Fleet will retrofit over 500 buses by the end of 2007.
o Clean Air Highway Diesel Rule: This rule requires a 97 percent reduction in the sulfur content of highway diesel fuel, from its current level of 500 parts per million (ppm), to 15 ppm. As of October 2006, Ultra-Low Sulfur Diesel (USLD) is available at most retail stations. ULSD is needed to allow engine and vehicle manufacturers to meet 2007 emission standards. As a result, each 2007 and newer truck and bus will be more than 90 percent cleaner than current models.
iv
Next Generation Energy Initiative: In December 2006, the Pawlenty adminstration announced its Next Generation Energy Initiative to help reduce climate change. The Initiative outlines three major strategies: More Renewable Energy, More Energy Conservation and Fewer Carbon Emissions. These strategies are expected to help stabilize Minnesota’s CO2 emissions. As a first step, Governor Pawlenty signed a renewable energy law in February 2007, which will require 25 percent of Minnesota’s electricity to come from renewable sources by 2020.
Metropolitan Emissions Reduction Project: In March 2004, the Minnesota Public Utilities Commission approved a proposal by Xcel Energy to retrofit several of its coal-fired power plants to achieve impressive emission reductions while increasing available capacity on Xcel Energy's system. The Allen S. King power plant in Oak Park Heights will be renovated with state-of-the-art pollution controls. The refurbished plant is expected to begin much cleaner operation in July 2007. St. Paul's High Bridge power plant and Minneapolis' Riverside power plant will both be changed from coal to cleaner-burning natural gas. High Bridge is currently under construction and is expected to be in commercial operation in May 2008, while the repowered Riverside plant is planned to begin commercial operation in May 2009. In its entirety, this project is expected to achieve a projected 95 percent reduction in nitrogen oxides and sulfur dioxide emissions, an 81 percent reduction in mercury emissions, a 70 percent reduction in particulate matter with a diameter less than 10 microns and a nine percent reduction in carbon dioxide.
Clean Water Legacy Act (CWLA): In June 2006, the Legislature passed and Governor Pawlenty signed this important new water quality law. The CWLA accelerates testing of Minnesota's surface and ground water; provides resources to develop specific plans to clean up Minnesota's most contam-inated waters; and designates funding to existing state and local programs to improve water quality.
The CWLA emphasizes leveraging additional federal, local and private resources where possible. Start-up funding of nearly $25 million was provided for 2006 and the Act creates a citizen advisory group called the Clean Water Council. Funding is derived from a combination of state general fund, general obligation bonding, and the Environmental and Natural Resources Trust Fund. Additional funding will be considered in the 2007 Session Biennial Budget process.
Phosphorus Rulemaking: Current agency rulemaking efforts propose a 1 milligram per liter
phosphorus effluent discharge limit for all new or expanding point sources discharging more than 200,000 gallons per day of wastewater. Application of this rule when promulgated will result in reducing the point source contribution of phosphorus to waters of the state from approximately 25 percent to 13 percent.
The MPCA has significantly expanded and improved public access to environmental data available electronically through its Environmental Data Access Initiative, funded by the Legislature. Water quality data and air quality data from all over the state are now easily available at this link: http://www.pca.state.mn.us/data/eda/index.cfm As this system continues to grow and evolve, the MPCA will evaluate new reporting formats for presenting annual pollution data. The agency welcomes suggestions from interested parties for upgrading the current reporting process to better meet the purpose envisioned in the statute.
v

1
Introduction and Summary
The Minnesota Pollution Control Agency (MPCA) is required to submit to the Legislature an annual report of the volume of pollution emitted or discharged to the state's air and water resources. The basis of the MPCA's 2007 Annual Pollution Report is the 2005 MPCA Greenhouse Gas Inventory, the 2002 and 2005 Minnesota Criteria Pollutant Emission Inventories, the 2002 Air Toxics Emission Inventory and the 2005 Water Quality National Pollutant Discharge Elimination System (NPDES) Discharge Monitoring Reports. Annual emission and discharge estimates are one important component of tracking progress on air and water pollution, and for tracking performance and relative contributions of pollution sources. The MPCA also regularly prepares reports on the physical, chemical and biological conditions measured in the environment, and on pollutants of special concern to human health and the environment. These reports and others are available on the Internet and are referenced throughout this document for readers who would like additional context and information.
Air Emissions In this report, the MPCA reports on emissions of major air pollutants including carbon dioxide (the principal greenhouse gas), criteria air pollutants (pollutants with national ambient air quality standards), and air toxics. Global climate change is a continuing concern worldwide. Therefore, Minnesota emissions of the principal greenhouse gas, carbon dioxide, are included for 2005. The statewide emissions were calculated using a variety of fuel use data sources. In 2005, 115 million short tons of CO2 were emitted in Minnesota. The MPCA reports data from its own Minnesota Criteria Pollutant Emission Inventory, using data generated in the state. The major air pollutants summarized in this report include particulate matter, ammonia, sulfur dioxide, nitrogen oxides, volatile organic compounds, carbon monoxide
About Emission Inventories Completing air pollutant emission inventories is a time-intensive process. For example, to develop the point source part of the Criteria Pollutant Emission Inventory for the year 2005, facilities with MPCA permits had until April 1, 2006 to submit their 2005 emissions estimates to the MPCA. Agency staff then compiled these emission estimates into a draft Criteria Pollutant Emission Inventory, which was sent back to the facilities for review in October 2006. Facilities completed their review by November, 2006. MPCA staff then reviewed the changes and completed the inventory for 2005 in January 2007. The Minnesota Air Toxics Emission Inventory and the area and mobile source components of the Criteria Pollutant Emission Inventory are completed once every three years to coincide with the three-year cycle of the U.S. EPA's National Emission Inventory. MPCA staff develops emissions estimates for the Air Toxics Emission Inventory based upon the completed Criteria Pollutant Emission Inventory, the assistance of permittees, and available information from other state and federal agencies.
2
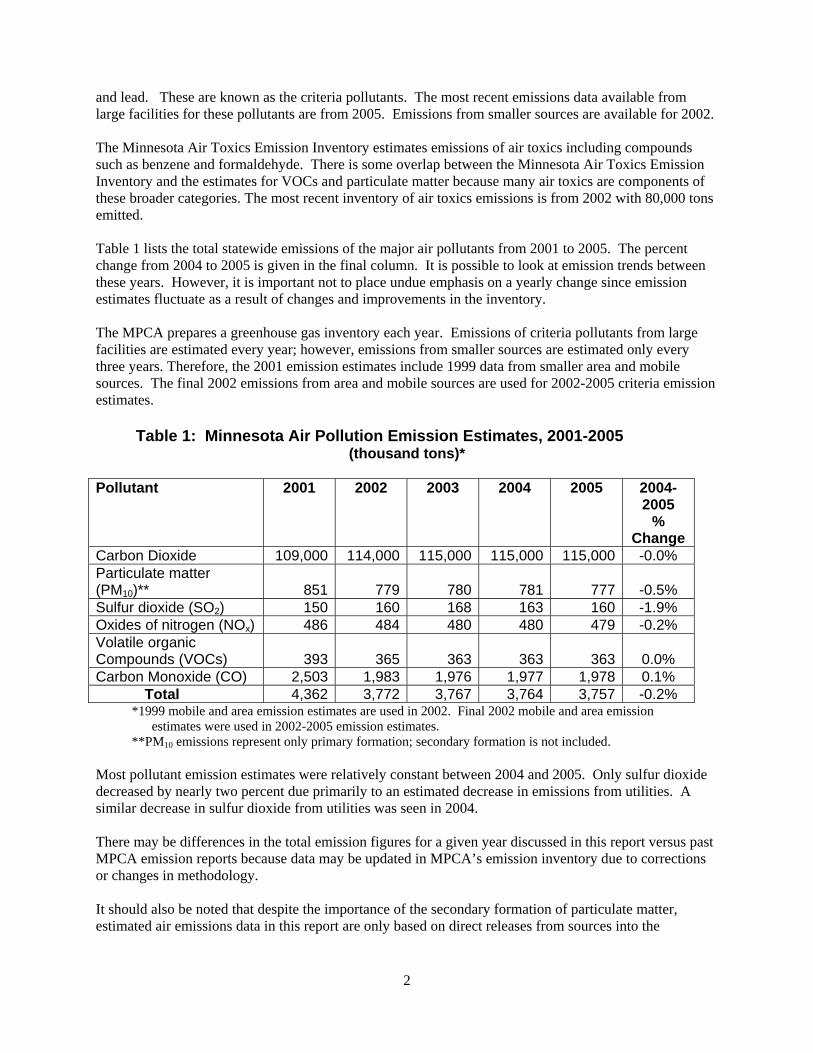
and lead. These are known as the criteria pollutants. The most recent emissions data available from large facilities for these pollutants are from 2005. Emissions from smaller sources are available for 2002. The Minnesota Air Toxics Emission Inventory estimates emissions of air toxics including compounds such as benzene and formaldehyde. There is some overlap between the Minnesota Air Toxics Emission Inventory and the estimates for VOCs and particulate matter because many air toxics are components of these broader categories. The most recent inventory of air toxics emissions is from 2002 with 80,000 tons emitted. Table 1 lists the total statewide emissions of the major air pollutants from 2001 to 2005. The percent change from 2004 to 2005 is given in the final column. It is possible to look at emission trends between these years. However, it is important not to place undue emphasis on a yearly change since emission estimates fluctuate as a result of changes and improvements in the inventory. The MPCA prepares a greenhouse gas inventory each year. Emissions of criteria pollutants from large facilities are estimated every year; however, emissions from smaller sources are estimated only every three years. Therefore, the 2001 emission estimates include 1999 data from smaller area and mobile sources. The final 2002 emissions from area and mobile sources are used for 2002-2005 criteria emission estimates. Table 1: Minnesota Air Pollution Emission Estimates, 2001-2005
(thousand tons)*
Pollutant 2001 2002 2003 2004 2005 2004-2005
% Change
Carbon Dioxide 109,000 114,000 115,000 115,000 115,000 -0.0% Particulate matter (PM10)** 851 779 780 781
777
-0.5%
Sulfur dioxide (SO2) 150 160 168 163 160 -1.9% Oxides of nitrogen (NOx) 486 484 480 480 479 -0.2% Volatile organic Compounds (VOCs) 393 365 363 363
363
0.0%
Carbon Monoxide (CO) 2,503 1,983 1,976 1,977 1,978 0.1% Total 4,362 3,772 3,767 3,764 3,757 -0.2%
*1999 mobile and area emission estimates are used in 2002. Final 2002 mobile and area emission estimates were used in 2002-2005 emission estimates. **PM10 emissions represent only primary formation; secondary formation is not included.
Most pollutant emission estimates were relatively constant between 2004 and 2005. Only sulfur dioxide decreased by nearly two percent due primarily to an estimated decrease in emissions from utilities. A similar decrease in sulfur dioxide from utilities was seen in 2004. There may be differences in the total emission figures for a given year discussed in this report versus past MPCA emission reports because data may be updated in MPCA’s emission inventory due to corrections or changes in methodology. It should also be noted that despite the importance of the secondary formation of particulate matter, estimated air emissions data in this report are only based on direct releases from sources into the
3
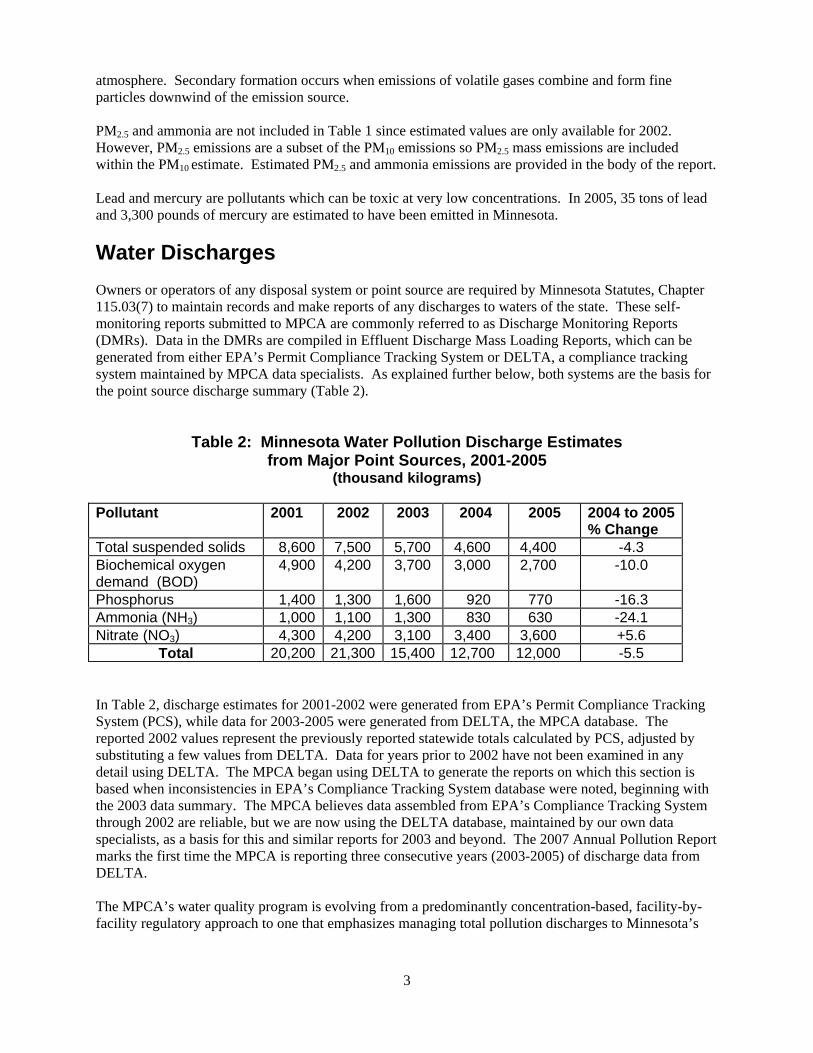
atmosphere. Secondary formation occurs when emissions of volatile gases combine and form fine particles downwind of the emission source. PM2.5 and ammonia are not included in Table 1 since estimated values are only available for 2002. However, PM2.5 emissions are a subset of the PM10 emissions so PM2.5 mass emissions are included within the PM10 estimate. Estimated PM2.5 and ammonia emissions are provided in the body of the report. Lead and mercury are pollutants which can be toxic at very low concentrations. In 2005, 35 tons of lead and 3,300 pounds of mercury are estimated to have been emitted in Minnesota. Water Discharges Owners or operators of any disposal system or point source are required by Minnesota Statutes, Chapter 115.03(7) to maintain records and make reports of any discharges to waters of the state. These self-monitoring reports submitted to MPCA are commonly referred to as Discharge Monitoring Reports (DMRs). Data in the DMRs are compiled in Effluent Discharge Mass Loading Reports, which can be generated from either EPA’s Permit Compliance Tracking System or DELTA, a compliance tracking system maintained by MPCA data specialists. As explained further below, both systems are the basis for the point source discharge summary (Table 2).
Table 2: Minnesota Water Pollution Discharge Estimates from Major Point Sources, 2001-2005
(thousand kilograms) Pollutant 2001 2002 2003 2004 2005 2004 to 2005
% Change Total suspended solids 8,600 7,500 5,700 4,600 4,400 -4.3 Biochemical oxygen demand (BOD)
4,900 4,200 3,700 3,000 2,700 -10.0
Phosphorus 1,400 1,300 1,600 920 770 -16.3 Ammonia (NH3) 1,000 1,100 1,300 830 630 -24.1 Nitrate (NO3) 4,300 4,200 3,100 3,400 3,600 +5.6
Total 20,200 21,300 15,400 12,700 12,000 -5.5 In Table 2, discharge estimates for 2001-2002 were generated from EPA’s Permit Compliance Tracking System (PCS), while data for 2003-2005 were generated from DELTA, the MPCA database. The reported 2002 values represent the previously reported statewide totals calculated by PCS, adjusted by substituting a few values from DELTA. Data for years prior to 2002 have not been examined in any detail using DELTA. The MPCA began using DELTA to generate the reports on which this section is based when inconsistencies in EPA’s Compliance Tracking System database were noted, beginning with the 2003 data summary. The MPCA believes data assembled from EPA’s Compliance Tracking System through 2002 are reliable, but we are now using the DELTA database, maintained by our own data specialists, as a basis for this and similar reports for 2003 and beyond. The 2007 Annual Pollution Report marks the first time the MPCA is reporting three consecutive years (2003-2005) of discharge data from DELTA. The MPCA’s water quality program is evolving from a predominantly concentration-based, facility-by-facility regulatory approach to one that emphasizes managing total pollution discharges to Minnesota’s
4
waters. The current report represents a continuing effort to improve our capacity to accurately perform loading analyses. Due to the multi-year life of permit requirements, however, many of our permits do not yet contain monitoring and reporting requirements that enable efficient, computerized calculations of total pollutant loadings. As we re-issue permits and further assess our data, we will continue to build our capability in this area. In some cases, values calculated using DELTA vary substantially from those previously derived from PCS. There are two substantial, documented differences between the totals from PCS and those from DELTA. Both of these differences result in the loadings calculated by PCS being greater than those calculated using DELTA. When accounting for reported values that are less than a detection limit, PCS uses 100 percent of the
reported numerical component of the value in its calculations; in the calculations performed using DELTA for this report, 50 percent of the reported numerical value was used.
Due to errors arising from the complexity of the permit, the PCS-calculated loadings for the City of
Austin for 2002 and 2003 were from 10 to 60 times greater than actual loadings. In addition to the specific variances and adjustments highlighted above, there are a number of additional sources of variation, both up and down, that potentially impact year-by-year comparisons: Approximately 10,000 individually reported values have been incorporated into the yearly totals.
These reported values are derived from an even larger set of raw data that has been summarized and interpreted by permittees before submission to the MPCA, generally in ways that are optimized for concentration-based compliance determination, not environmental assessment.
The loading calculations incorporate a number of data interpretation decisions that can legitimately be
made in a variety of ways.
Reporting requirements can vary with each permit issuance, resulting in significant variation in parameters and limit types, unmonitored parameters and unmonitored reporting periods, making year-by-year comparisons difficult.
The loading calculations do not currently account for unmonitored or missing parameters and periods,
so a facility that only monitors or reports quarterly on a pollutant, for example, is presumed to discharge that pollutant only in the months that were reported.
Wastewater treatment facilities regularly experience variations in influent strength, influent flow and
facility performance. The 2005 figures represent the combined loading from 85 major municipal and industrial discharges of more than one million gallons per day to waters of the state. These major facilities represent approximately 85 percent of the total volume of discharge to waters of the state from point sources. The remaining 15 percent comes from many smaller municipal and industrial facilities. Although discharges from these facilities are small, they can have significant impacts on individual lakes and stream segments. Of the 85 major facilities reporting in 2005, 44 showed an increase in total loading over 2004, 38 showed a decrease in total loading, and three facilities reported insufficient data to allow a determination to be made. The recent decrease in total loading to waters of the state (Table 2) represents a return to the year-to-year downward trend noted from 1997-2000. Both 2001 (when the Mississippi River was above flood stage for over a month during the spring) and 2002 (a record wet year in many areas, with frequent high-
5
intensity rainfall events) were unusual in terms of both the amount and intensity of precipitation, and this may be reflected in the higher pollutant discharge values noted for those years. In 2003, spring snowmelt, runoff and precipitation returned to a more “normal” pattern, and this is further reflected in the overall decrease in total loading for 2004, as shown by decreases in total suspended solids (TSS), biochemical oxygen demand (BOD), phosphorus (P) and ammonia (NH3) for the statewide database. In 2005, annual precipitation totals were below normal over much of the state and by early 2006, concerns about abnormally dry conditions began to surface, mainly in northern Minnesota. When examining overall trends in pollutant loadings over the years, it should be noted that improvements intended to enhance biological phosphorus removal at the Metropolitan Council Environmental Services Metropolitan Plant (Metro Plant) have significantly improved the plant’s overall performance, particularly in the secondary clarifier. Due to the volume of waste treated by the Metro Plant, these improvements are a major contributor to verifiable reductions in the reported water pollutant loadings over the last several years. For example, during the period 2003-2005, phosphorus loading from the Metro Plant was reduced by 66% and total loading was reduced by 72 percent. Point source contributions of nitrate and phosphorus to waters of the state are still small compared to nonpoint contributions of these pollutants from sources such as agricultural and urban runoff. Point sources tend to have the greatest impact on receiving waters during periods of low precipitation and stream flow, while nonpoint sources are most significant during periods of high precipitation and stream flow. However, it is difficult to measure directly the effects of nonpoint pollution on Minnesota’s lakes, rivers and ground water. Best estimates suggest that approximately 86 percent of water pollution in Minnesota can be attributed to nonpoint sources, while about 14 percent comes from point sources. The MPCA continues to investigate better ways to assess and measure nonpoint pollution, but nonpoint source monitoring is expensive and often requires a more complex, labor-intensive (and therefore more costly) monitoring network than measuring volume and quality of discharge from pipes. The MPCA continues to conduct loading studies for a number of watersheds in the state. In this year’s report, we take a closer look at the Shingle Creek watershed where best management practices (BMPs) are being implemented to reduce the impact of road salt and other deicing chemicals on waters of the state.
6
Chapter 1: Air Pollutant Emissions Overview
Thousands of chemicals are emitted into the air. Many of these are air pollutants that can directly or indirectly affect human health, reduce visibility, cause property damage and harm the environment. For these reasons, the MPCA attempts to reduce the amount of air pollutants released into the air. In order to understand how much pollution is released and to track the success of reduction strategies, the MPCA estimates the emissions of certain air pollutants released in Minnesota.
Greenhouse Gases
Although greenhouse gases do not necessarily directly harm human health, their increase in concentration can lead to global climate change. The principal greenhouse gas emitted is carbon dioxide (CO2). MPCA tracks CO2 emissions in Minnesota.
Criteria Pollutants
The 1970 Clean Air Act identified six major air pollutants that were present in high concentrations throughout the United States called “criteria pollutants.” These air pollutants are particulate matter (PM10), sulfur dioxide (SO2), nitrogen oxides (NOx), ozone (O3), carbon monoxide (CO) and lead (Pb). Fine particles (PM2.5) were later included as a criteria pollutant. The Minnesota Criteria Pollutant Emission Inventory estimates emissions of five criteria pollutants (PM10, SO2, NOx, CO and Pb). Ozone is not directly emitted, so a group of ozone precursors called volatile organic compounds (VOCs) is included instead. PM2.5 and ammonia (which contributes to PM2.5 formation) emissions were estimated for the first time for the 2002 emissions inventory. The Criteria Pollutant Emissions section also includes a summary of the MPCA’s Air Quality Index (AQI) data for 2006.
Air Toxics
Many other chemicals are released in smaller amounts than the criteria pollutants, but are still toxic. The EPA refers to chemicals that can cause serious health and environmental hazards as hazardous air pollutants or air toxics. Air toxics include chemicals such as benzene, formaldehyde, acrolein, mercury and polycyclic organic matter. Minnesota data come from the 2002 Minnesota Air Toxics Emission Inventory. This report is limited to a summary and discussion of emissions of various air pollutants in Minnesota. However, the MPCA has prepared several other reports that discuss air pollution trends and emissions in more detail. Please reference the following reports for more information regarding air pollution. Air Quality in Minnesota: Challenges and Opportunities—2007 Report to the Legislature http://www.pca.state.mn.us/publications/reports/lr-airqualityreport-2007.html Air Quality in Minnesota: Progress and Priorities—2005 Report to the Legislature http://www.pca.state.mn.us/publications/reports/lr-airqualityreport-2005.html Air Quality in Minnesota: Into the Future—2003 Report to the Legislature http://www.pca.state.mn.us/publications/reports/lr-airqualityreport-2003.html
7
Carbon Dioxide Carbon dioxide is a gas that is principally formed from the combustion of fossil fuels such as oil, gas, and coal. It is the most important greenhouse gas that contributes to warming of the earth’s atmosphere. Many greenhouse gases occur naturally, but fossil fuel burning and other human activities are adding gases to the natural mix at an accelerated rate.
Emissions Data and Sources
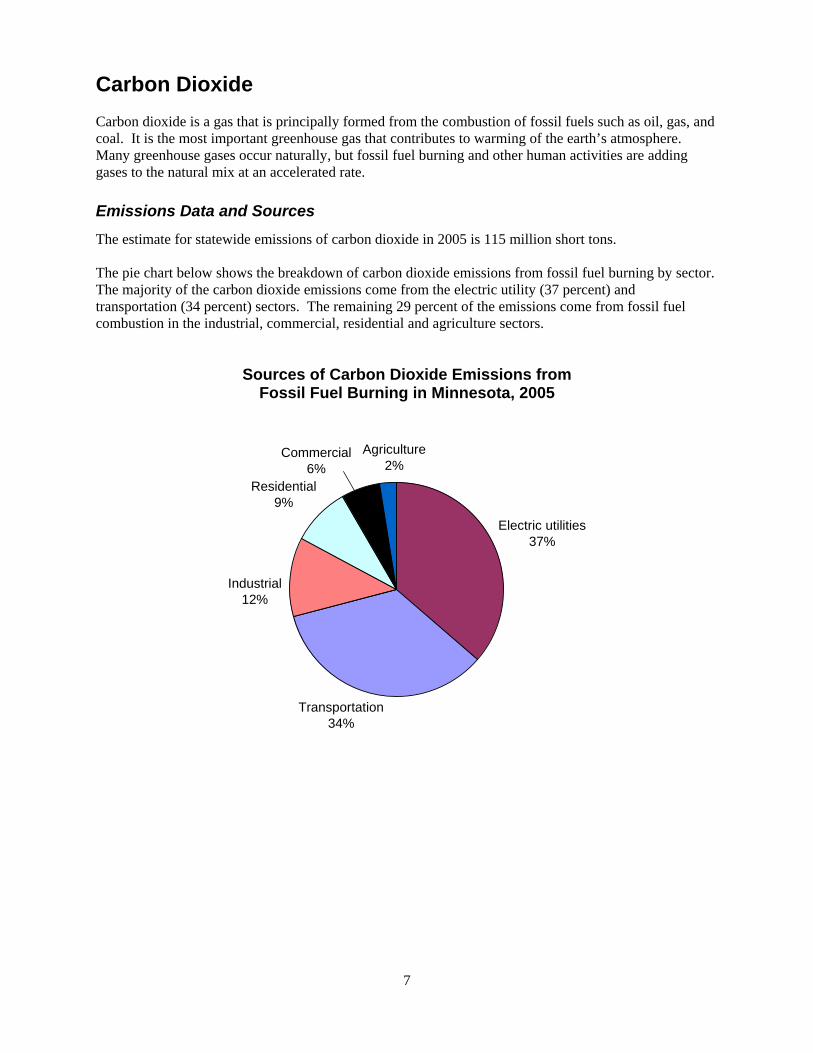
The estimate for statewide emissions of carbon dioxide in 2005 is 115 million short tons. The pie chart below shows the breakdown of carbon dioxide emissions from fossil fuel burning by sector. The majority of the carbon dioxide emissions come from the electric utility (37 percent) and transportation (34 percent) sectors. The remaining 29 percent of the emissions come from fossil fuel combustion in the industrial, commercial, residential and agriculture sectors.
Sources of Carbon Dioxide Emissions from Fossil Fuel Burning in Minnesota, 2005
Electric utilities37%
Transportation 34%
Commercial6%
Residential9%
Industrial12%
Agriculture2%
8
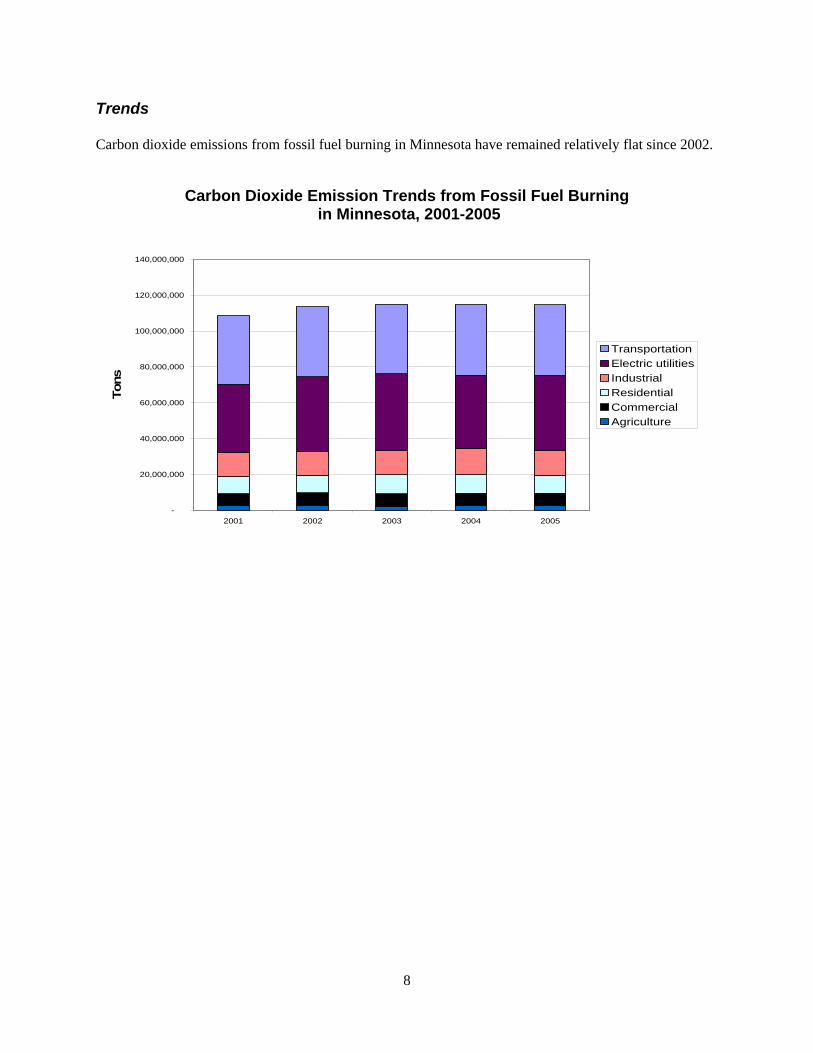
Trends Carbon dioxide emissions from fossil fuel burning in Minnesota have remained relatively flat since 2002.
Carbon Dioxide Emission Trends from Fossil Fuel Burning in Minnesota, 2001-2005
-
20,000,000
40,000,000
60,000,000
80,000,000
100,000,000
120,000,000
140,000,000
2001 2002 2003 2004 2005
Tons
TransportationElectric utilitiesIndustrialResidentialCommercialAgriculture
9
Criteria Air Pollutant Emissions
Minnesota’s Emission Inventory Rule requires all facilities in Minnesota that have an air emissions permit to submit an annual emission inventory report to the Minnesota Pollution Control Agency (MPCA). The report quantifies emissions of the regulated pollutants listed below:
particulate matter less than 10 microns in diameter (PM10)
sulfur dioxide (SO2)
nitrogen oxides (NOx)
volatile organic compounds (VOCs)
carbon monoxide (CO)
lead (Pb)
The emission inventory is used to track the actual pollutant emissions of each facility and to determine the type and quantity of pollutants being emitted into the atmosphere. Ozone is a criteria pollutant that is not directly emitted, so a group of ozone precursors called volatile organic compounds (VOCs) is included instead. The data are then used to calculate an annual emission fee for each facility. Starting with the 2002 inventory, MPCA has also begun estimating PM2.5 and ammonia emissions. The Minnesota Criteria Pollutant Emission Inventory estimates emissions from permitted facilities every year in order to fulfill the Minnesota rule. In addition, every three years, the MPCA estimates emissions from two other principal source categories: area sources and mobile sources. Overall, the Minnesota Criteria Pollution Emission Inventory includes emissions from three principal source categories.
1. Point Sources: Typically large, stationary sources with relatively high emissions, such as electric power plants and refineries. A "major" source emits a threshold amount (or more) of at least one criteria pollutant, and must be inventoried and reported.
2. Area Sources: Typically stationary sources, but generally smaller sources of emissions than point sources. Examples include dry cleaners, gasoline service stations and residential wood combustion. Area sources may also include a diffuse stationary source, such as wildfires or agricultural tilling. These sources do not individually produce sufficient emissions to qualify as point sources. For example, a single gas station typically will not qualify as a point source, but collectively the emissions from many gas stations may be significant.
3. Mobile Sources: Mobile sources are broken up into two categories; on-road vehicles and non-road sources. On-road vehicles include vehicles operated on highways, streets and roads. Non-road sources are off-road vehicles and portable equipment powered by internal combustion engines. Lawn and garden equipment, construction equipment, aircraft and locomotives are examples of non-road sources.
The Minnesota Criteria Pollutant Emission Inventory is complete for point sources through 2005. Emission estimates are available for area and mobile sources for 2002. When 2005 summary data are given, they includes area and mobile data from 2002 and point source data from 2005. This report presents trend data for point sources from 2001-2005.
10
With each new inventory, improvements are made in terms of pollutants covered, source categories included, and the accuracy of emission estimates. Therefore, changes in the way emissions are calculated may affect trends, even if there was no real increase or decrease in emissions. The reader may note differences in the total emission figures for a given year discussed in this report, versus previous emission reports the MPCA has published, because data may be updated in past emission inventories due to corrections or changes in methodology. Also, preliminary 2002 emissions data were reported in the 2006 Annual Pollution Report. Finalized 2002 data are reported in this year’s report resulting in small differences in emission values between the two reports. In addition, despite the importance of secondary formation for some pollutants (e.g. PM2.5), estimated air emissions data in this report are based on direct releases from sources into the atmosphere. Secondary formation of pollutants is not included in the estimates because there is currently no reliable way to estimate their quantity. However, models to predict secondary formation of particles are under development. Find more information on the Minnesota Criteria Pollutant Emission Inventory: http://www.pca.state.mn.us/air/criteria-emissioninventory.html See the MPCA Environmental Data Access web site to download MPCA emission estimates: http://www.pca.state.mn.us/data/edaAir/index.cfm Find more information on criteria air pollutants in the following EPA web site: http://www.epa.gov/air/urbanair/index.html See the EPA AIRData web site to download EPA criteria pollutant emission estimates: http://www.epa.gov/air/data/index.html
11
Air Quality Index (AQI)
The Air Quality Index (AQI) was developed by the EPA to provide a simple, uniform way to report daily air quality conditions.
In Minnesota, four criteria pollutants are used to calculate the AQI: ground-level ozone, sulfur dioxide, carbon monoxide and fine particles (PM2.5). High AQI days in Minnesota are usually the result of elevated levels of ozone or PM2.5. The AQI is currently calculated for the Brainerd area, Detroit Lakes, Duluth, Ely, Marshall, Rochester, St. Cloud, and the Twin Cities area. A new site was added to the network in Grand Portage, Minnesota this year. All pollutants are not monitored at each location.
The AQI translates each pollutant measurement to a common index, set at 100 to reflect when health effects might be expected in sensitive populations. The pollutant with the highest index value is used to determine the overall AQI. The table below shows the different AQI categories along with the corresponding index range.
AQI Color Legend:
Good 0-50 Moderate 51-100 Unhealthy for Sensitive Groups 101-150 Unhealthy 151-200 Very Unhealthy 201-300
The AQI in Minnesota cities rarely reaches the Unhealthy range; however, many citizens are affected by air quality in the Unhealthy for Sensitive Groups category.
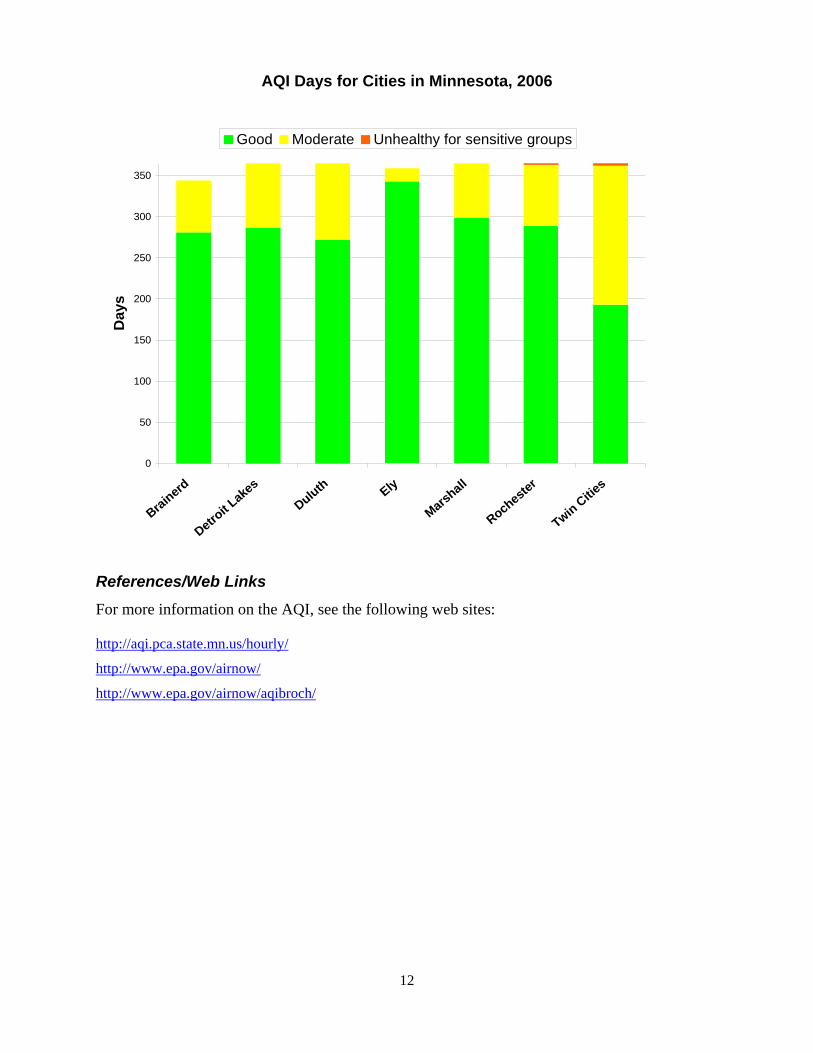
The chart on the next page displays the number of Good, Moderate, Unhealthy for Sensitive Groups and Unhealthy days for several cities in Minnesota that were monitored every day in 2006. Days are categorized by the highest AQI level calculated anytime during that day. The Grand Portage site is not included because data were not available for the entire year. The EPA may report different AQI summary totals for Minnesota because the MPCA and EPA use different methods to calculate the AQI.
The air quality throughout Minnesota in 2006 was better than in 2005 as measured by the number of Unhealthy or Unhealthy for Sensitive Groups days (days with AQI values greater than 100). The differences were Brainerd (3 to 0), Duluth (4 to 0), Rochester (4 to 2), and Twin Cities (8 to 3). In 2006, the Twin Cities had 193 Good air quality days, 169 Moderate air quality days and three days that were considered Unhealthy for Sensitive Groups. Yearly variations in weather patterns can affect air quality. The Twin Cities area likely has the highest number of Moderate and Unhealthy for Sensitive Groups days because it has a higher population and more sources of ozone and PM2.5 than the other regions.
12
AQI Days for Cities in Minnesota, 2006
0
50
100
150
200
250
300
350
Brainerd
Detroit L
akes
Duluth Ely
Marshall
Rochester
Twin Cities
Day
sGood Moderate Unhealthy for sensitive groups
References/Web Links
For more information on the AQI, see the following web sites: http://aqi.pca.state.mn.us/hourly/
http://www.epa.gov/airnow/
http://www.epa.gov/airnow/aqibroch/
13
Particulate Matter Particulate matter is the general term for particles found in the air. Some particles are seen as soot or smoke while others are so small they can only be detected with an electron microscope. Particles less than or equal to 2.5 microns (μm) in diameter are known as “fine” particles. PM10 refers to all particles less than or equal to 10 μm in diameter. Both PM10 and PM2.5 can be inhaled into the lungs. These particles then accumulate in the respiratory system and are associated with numerous adverse health effects, which are briefly described in the following sections. Particulate matter also causes adverse impacts to the environment. Fine particles are the major cause of reduced visibility in parts of the United States. In addition, when particles containing nitrogen and sulfur deposit onto land or water bodies, they may affect nutrient balances and acidity. This can result in the depletion of nutrients in the soil, damage to sensitive forests and farm crops, and diversity changes in ecosystems. Particulate matter also causes soiling and erosion damage to materials and buildings.
14
PM2.5 Fine particles are a chemically and physically diverse mixture of different sizes of very small particles. Most are smaller than 2.5 microns. These particles contain a complex mixture of chemicals, including ammonium sulfate, ammonium nitrate, particle-bound water, black carbon (elemental carbon), hundreds or thousands of organic compounds, and inorganic material including soil and metals. Fine particles can be inhaled deeply into the lung. These particles then accumulate in the respiratory system. Some of the very small particles enter the bloodstream where they can result in a range of serious health effects. Studies of exposures to PM2.5 have been linked with increased hospital admissions and deaths from cardiovascular and respiratory problems. Specifically, elevated fine particles are associated with a rise in heart attacks; acute and chronic bronchitis; asthma attacks; respiratory symptoms; and reduced lung function growth and increased respiratory illness in children. For three days in 2006, levels of fine particles were Unhealthy for Sensitive Groups in the Twin Cities area. PM2.5 was also responsible for the majority of Moderate air quality days. The number of Moderate days is significant because EPA estimates greater overall public health impacts associated with the Moderate days than the relatively fewer Unhealthy for Sensitive Groups days. Unlike ozone, which is typically elevated in the hot summer months, fine particles can be a problem throughout the year.
Emissions Data and Sources
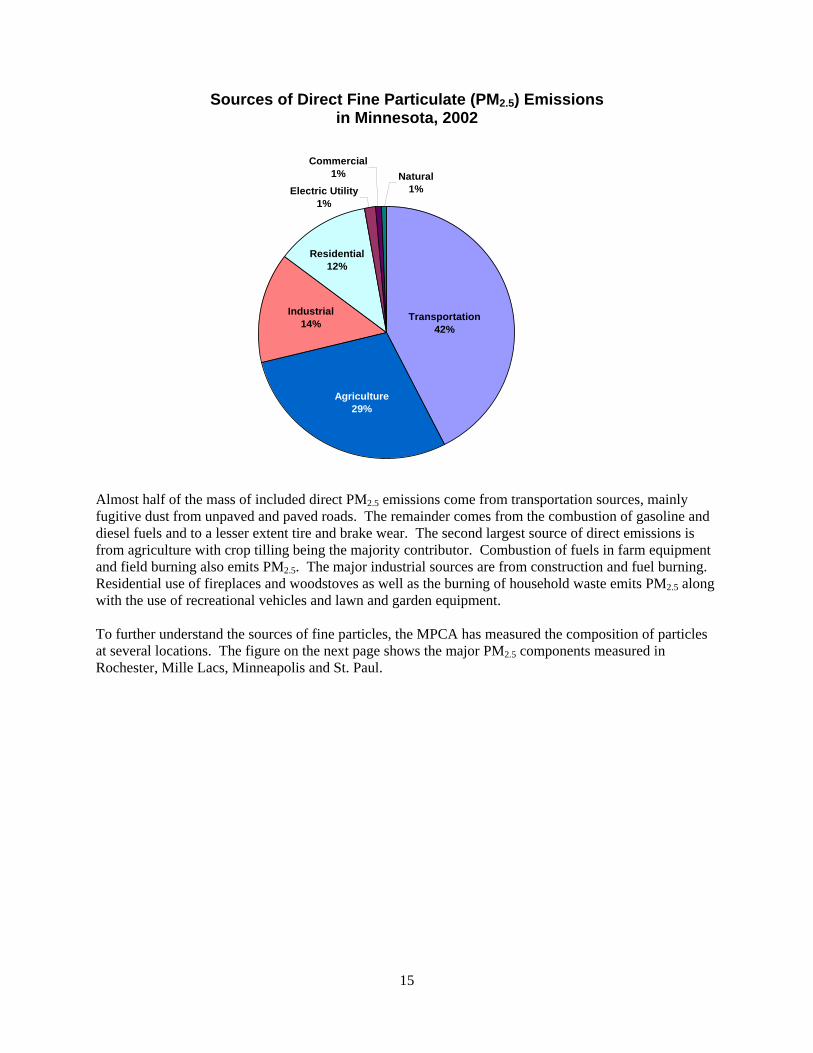
PM2.5 is present in the air as a result of many different emission sources. Some fine particles are directly emitted to the air as solid or liquid particles. Others result “secondarily” from chemical reactions between gaseous pollutants (called precursors) and natural materials in the atmosphere. These “secondarily” formed particles may be relatively more or less abundant depending on the presence of the precursor chemicals and the atmospheric conditions, such as temperature, sunlight, and humidity. The MPCA estimate for statewide direct emissions of PM2.5 in 2002 is 169,000 tons. This includes the PM2.5 directly emitted from sources included in the MPCA emission inventory; however, it does not include secondarily formed PM2.5. While the figure below shows important direct emission sources of PM2.5, it does not accurately explain the sources contributing to PM2.5 in the ambient air for the following reasons.
Secondarily formed particles can be an important, though changing, fraction of the fine particles in the air particularly during the summer months;
Whether directly emitted or chemically formed in the air, PM2.5 can travel hundreds or thousands of
miles, and a significant amount of the PM2.5 in Minnesota air results from emissions elsewhere.;
The composition of PM2.5 can change over time;
The larger heavier particles in PM2.5 may settle from the air in the vicinity of the emission source; and,
Some natural processes which cause direct PM2.5 emissions (for example blowing dust) are not
included in the inventory.
15
Sources of Direct Fine Particulate (PM2.5) Emissions
in Minnesota, 2002
Electric Utility1%
Commercial1% Natural
1%
Residential12%
Industrial14%
Agriculture 29%
Transportation42%
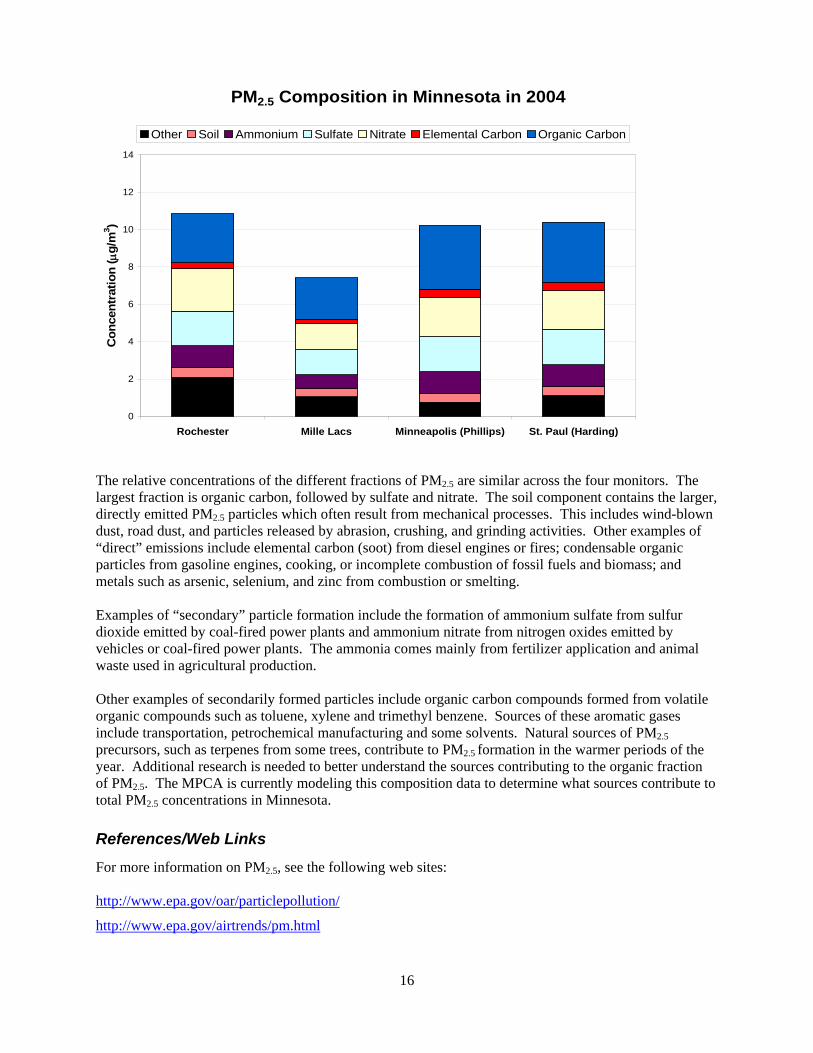
Almost half of the mass of included direct PM2.5 emissions come from transportation sources, mainly fugitive dust from unpaved and paved roads. The remainder comes from the combustion of gasoline and diesel fuels and to a lesser extent tire and brake wear. The second largest source of direct emissions is from agriculture with crop tilling being the majority contributor. Combustion of fuels in farm equipment and field burning also emits PM2.5. The major industrial sources are from construction and fuel burning. Residential use of fireplaces and woodstoves as well as the burning of household waste emits PM2.5 along with the use of recreational vehicles and lawn and garden equipment. To further understand the sources of fine particles, the MPCA has measured the composition of particles at several locations. The figure on the next page shows the major PM2.5 components measured in Rochester, Mille Lacs, Minneapolis and St. Paul.
16
PM2.5 Composition in Minnesota in 2004
0
2
4
6
8
10
12
14
Rochester Mille Lacs Minneapolis (Phillips) St. Paul (Harding)
Con
cent
ratio
n ( μ
g/m
3 )
Other Soil Ammonium Sulfate Nitrate Elemental Carbon Organic Carbon
The relative concentrations of the different fractions of PM2.5 are similar across the four monitors. The largest fraction is organic carbon, followed by sulfate and nitrate. The soil component contains the larger, directly emitted PM2.5 particles which often result from mechanical processes. This includes wind-blown dust, road dust, and particles released by abrasion, crushing, and grinding activities. Other examples of “direct” emissions include elemental carbon (soot) from diesel engines or fires; condensable organic particles from gasoline engines, cooking, or incomplete combustion of fossil fuels and biomass; and metals such as arsenic, selenium, and zinc from combustion or smelting. Examples of “secondary” particle formation include the formation of ammonium sulfate from sulfur dioxide emitted by coal-fired power plants and ammonium nitrate from nitrogen oxides emitted by vehicles or coal-fired power plants. The ammonia comes mainly from fertilizer application and animal waste used in agricultural production. Other examples of secondarily formed particles include organic carbon compounds formed from volatile organic compounds such as toluene, xylene and trimethyl benzene. Sources of these aromatic gases include transportation, petrochemical manufacturing and some solvents. Natural sources of PM2.5 precursors, such as terpenes from some trees, contribute to PM2.5 formation in the warmer periods of the year. Additional research is needed to better understand the sources contributing to the organic fraction of PM2.5. The MPCA is currently modeling this composition data to determine what sources contribute to total PM2.5 concentrations in Minnesota.
References/Web Links
For more information on PM2.5, see the following web sites: http://www.epa.gov/oar/particlepollution/
http://www.epa.gov/airtrends/pm.html
17
PM10
Exposure to PM10 particles is primarily associated with the aggravation of respiratory conditions such as asthma. PM10 has also been linked to cardiovascular mortality and related health effects, but many studies indicate a stronger association between PM2.5 and these health effects. PM10 includes all particles with aerodynamic diameters less than 10 microns. PM10 particles are generally emitted from sources such as vehicles traveling on unpaved roads, materials handling, and crushing and grinding operations, and windblown dust. These particles can settle rapidly from the atmosphere within hours, and their spatial impact is typically limited (compared to PM2.5) because they tend to fall out of the air in the downwind area near their emissions point.
Emissions Data and Sources
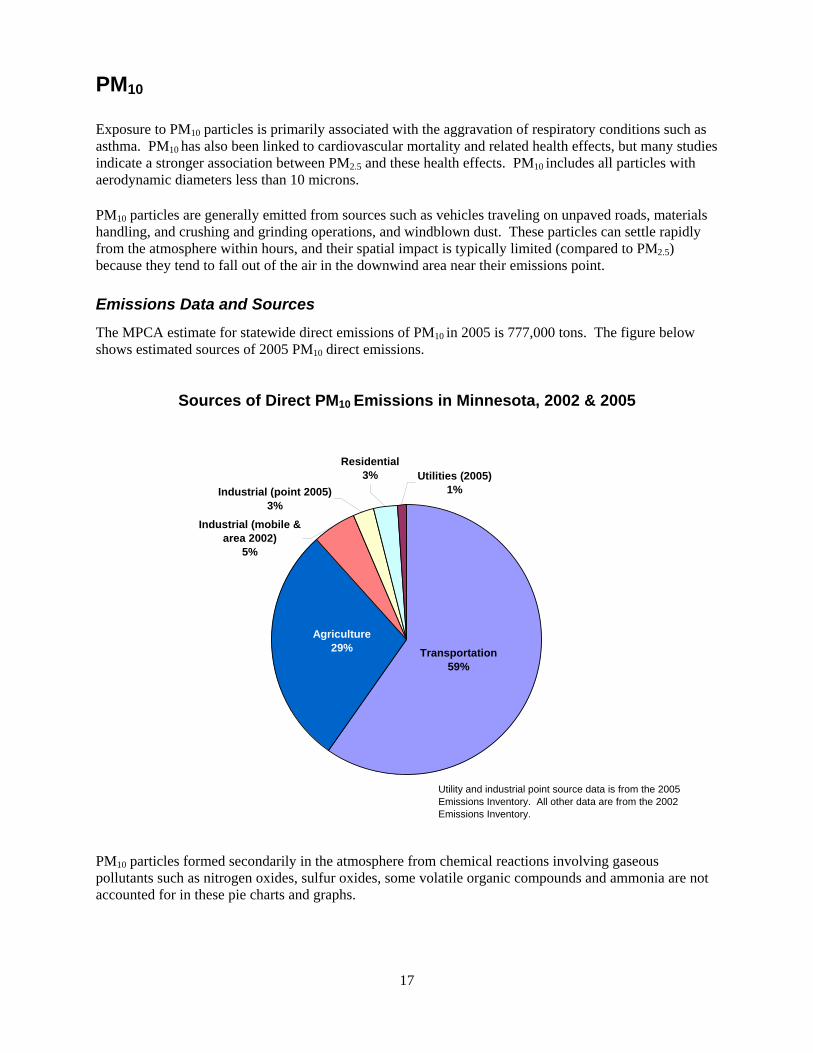
The MPCA estimate for statewide direct emissions of PM10 in 2005 is 777,000 tons. The figure below shows estimated sources of 2005 PM10 direct emissions.
Sources of Direct PM10 Emissions in Minnesota, 2002 & 2005
Industrial (mobile & area 2002)
5%
Industrial (point 2005)3%
Residential3% Utilities (2005)
1%
Transportation59%
Agriculture29%
Utility and industrial point source data is from the 2005 Emissions Inventory. All other data are from the 2002 Emissions Inventory.
PM10 particles formed secondarily in the atmosphere from chemical reactions involving gaseous pollutants such as nitrogen oxides, sulfur oxides, some volatile organic compounds and ammonia are not accounted for in these pie charts and graphs.

18
Transportation sources contribute 59 percent of direct PM10 emissions. The majority of transportation source emissions are the result of dust from roads. Agricultural production contributes 29 percent of direct PM10 emissions with dust from tilling as the largest contributor. Combustion of fuels in farm equipment and field burning also emits PM10. The major industrial sources are from construction and fuel burning. Residential use of fireplaces and woodstoves as well as the burning of household waste emits PM10 along with the use of recreational vehicles and lawn and garden equipment
Although most of the mass of PM10 emissions come from soils carried by the wind, these sources tend to be located away from people and are often larger particles, which are less of a human health concern. Particles emitted from combustion sources such as cars, wood stoves, and industrial and commercial combustion are generally smaller, more toxic and more often released in populated areas.
Trends
In 2005, point sources contributed 4 percent to the total state PM10 emissions. PM10 emissions had been slowly increasing since 2001 until 2005 when there was a drop in emissions from the mining sector due to methodology and emission factor changes including new stack test factors.
PM10 Point-Source Emission Trends by Sector in Minnesota, 2001-2005
0
5,000
10,000
15,000
20,000
25,000
30,000
35,000
2001 2002 2003 2004 2005
Tons
ManufacturingUtilitiesMiningRefineriesPulp & PaperOther
References/Web Links
For more information on PM10, see the following web site: http://www.epa.gov/oar/particlepollution/
19
Ammonia Ammonia is a significant component of fine particulate (PM2.5). Ammonia combines with sulfur dioxide and nitrogen dioxides to form ammonium sulfate and ammonium nitrate particles. Ammonia is included for the first time in the 2002 Minnesota Criteria Pollutant Emission Inventory.
Emissions Data and Sources
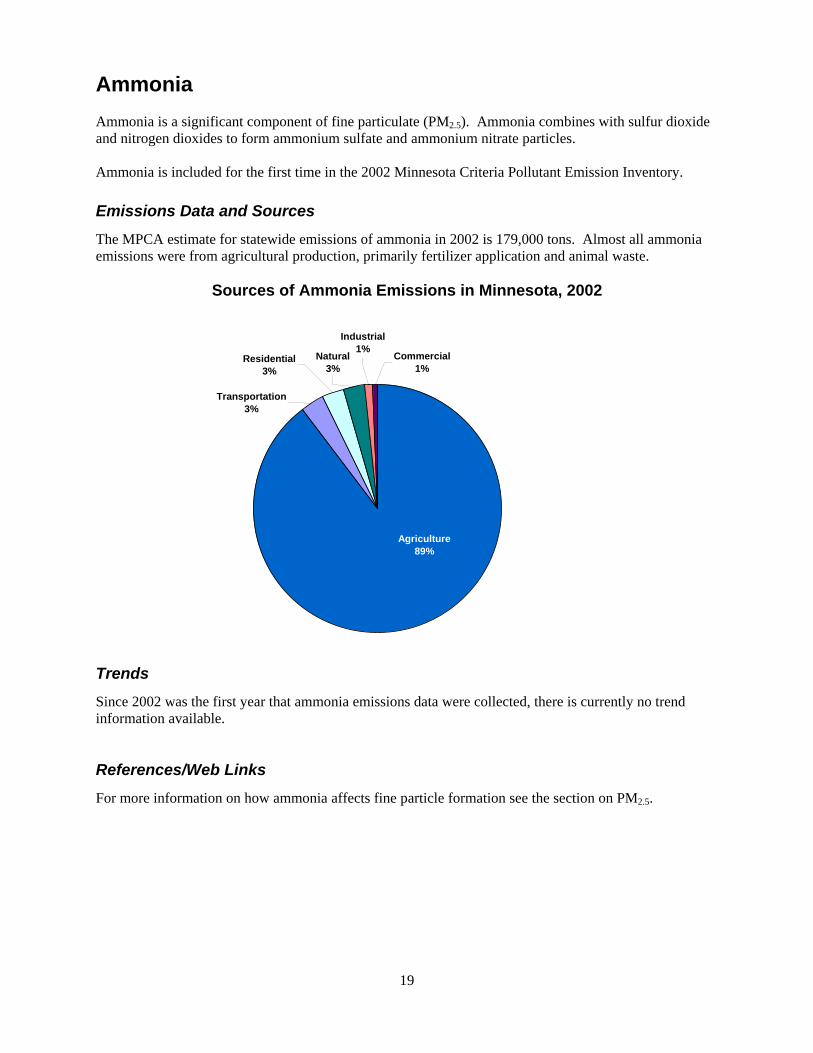
The MPCA estimate for statewide emissions of ammonia in 2002 is 179,000 tons. Almost all ammonia emissions were from agricultural production, primarily fertilizer application and animal waste.
Sources of Ammonia Emissions in Minnesota, 2002
Transportation3%
Commercial1%
Residential3%
Natural3%
Industrial1%
Agriculture89%
Trends
Since 2002 was the first year that ammonia emissions data were collected, there is currently no trend information available.
References/Web Links
For more information on how ammonia affects fine particle formation see the section on PM2.5.
20
Sulfur Dioxide Sulfur dioxide (SO2) belongs to the family of sulfur oxide gases. It is a colorless gas that can be detected by taste and odor at concentrations as low as 0.3 parts per million. Sulfur oxide gases are formed when fuel containing sulfur (mainly coal and oil) is burned and during metal smelting and other industrial processes. SO2 reacts with other chemicals in the air to form tiny sulfate particles. It is difficult to distinguish between health effects due to SO2 exposure and those due to fine particulate exposure. The major health effects of concern associated with exposures to high concentrations of SO2, sulfate aerosols and fine particles include impaired breathing, respiratory illness, alterations in the lung’s defenses, aggravation of existing respiratory and cardiovascular disease, and mortality. Children, asthmatics and the elderly may be particularly sensitive. SO2 also causes significant environmental damage. SO2 reacts with other substances in the air to form acids, which fall to earth as rain, fog, snow, or dry particles. Acid rain damages forests and crops, changes the makeup of soil, and makes lakes and streams acidic and unsuitable for fish. Continued exposure changes the number and variety of plants and animals in an ecosystem. In addition, SO2 accelerates the decay of buildings and monuments and is a major cause of reduced visibility due to haze in Minnesota.
Emissions Data and Sources
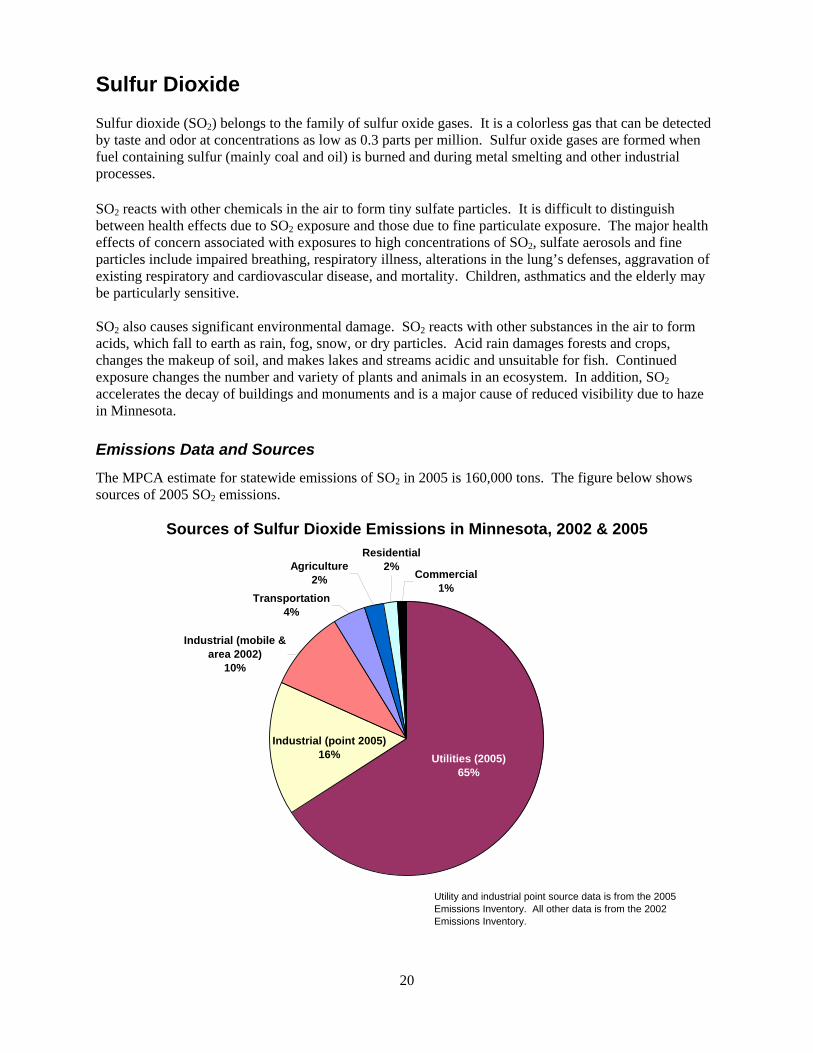
The MPCA estimate for statewide emissions of SO2 in 2005 is 160,000 tons. The figure below shows sources of 2005 SO2 emissions.
Sources of Sulfur Dioxide Emissions in Minnesota, 2002 & 2005
Transportation4%
Agriculture2%
Residential2%
Commercial1%
Industrial (mobile & area 2002)
10%
Industrial (point 2005)16% Utilities (2005)
65%
Utility and industrial point source data is from the 2005 Emissions Inventory. All other data is from the 2002 Emissions Inventory.

21
The majority (65 percent) of SO2 emissions come from utilities, primarily coal-burning electricity generation sources. Sixteen percent comes from industrial point sources while 10 percent is the result of smaller industrial burning of coal, distillate oil and prescribed burning. Burning diesel fuel and distillate oil for transportation, agriculture, residential and commercial use makes up the bulk of remaining SO2 emissions.
Trends
Point sources contribute 81 percent to the total state SO2 emissions. Emissions from point sources have remained relatively constant since 2001 with slightly decreasing emissions in 2004 and 2005. Coal-burning utilities are the greatest emitters of SO2. Between 2004 and 2005, emissions from manufacturing increased slightly, with all other categories decreasing or remaining constant.
Sulfur Dioxide Point-Source Emission Trends by Sector in Minnesota, 2001-2005
0
20,000
40,000
60,000
80,000
100,000
120,000
140,000
160,000
2001 2002 2003 2004 2005
Tons
ManufacturingUtilitiesMiningRefineriesPulp & PaperOther
References/Web Links
For more information on sulfur dioxide, see the following web site: http://www.epa.gov/oar/urbanair/so2/index.html
22
Nitrogen Oxides Nitrogen oxides (NOx) is the generic term for a group of highly reactive gases, all of which contain nitrogen and oxygen in varying amounts. The two primary constituents are nitric oxide (NO) and nitrogen dioxide (NO2). NO is a colorless, odorless gas that is readily oxidized in the atmosphere to NO2. NO2 exists as a brown gas that gives photochemical smog its yellowish-brown color. NOx is reported because NO and NO2 continuously cycle between the two species. NOx form when fuel is burned at high temperatures. NO is the principal oxide of nitrogen produced in combustion processes. NOx contribute to a wide range of human health effects. NO2 can irritate the lungs and lower resistance to respiratory infection (such as influenza). More importantly, NOx are a major precursor both to ozone and to fine particulate matter (PM2.5). As discussed in the ozone and PM2.5 sections of this report, exposure to these pollutants is associated with serious adverse health effects. High NOx concentrations also have environmental impacts. Deposition of nitrogen can lead to fertilization, eutrophication, or acidification of terrestrial, wetland and aquatic systems. This can result in changes in species number and composition such as the reduction of fish and shellfish populations. In addition, nitrous oxide (N2O), another component of NOx, is a greenhouse gas that contributes to global warming.
Emissions Data and Sources
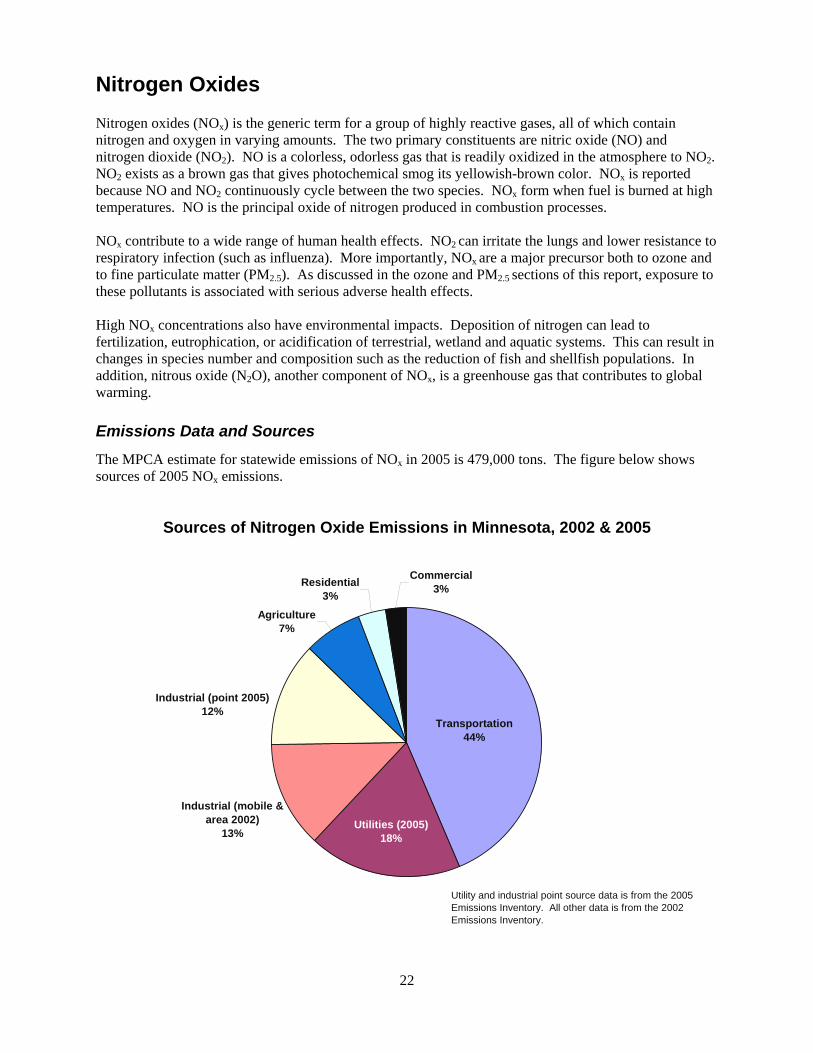
The MPCA estimate for statewide emissions of NOx in 2005 is 479,000 tons. The figure below shows sources of 2005 NOx emissions.
Sources of Nitrogen Oxide Emissions in Minnesota, 2002 & 2005
Residential3%
Agriculture7%
Commercial3%
Industrial (point 2005)12%
Industrial (mobile & area 2002)
13%Utilities (2005)
18%
Transportation44%
Utility and industrial point source data is from the 2005 Emissions Inventory. All other data is from the 2002 Emissions Inventory.
23
Nearly half of NOx emissions come from the transportation sector, primarily from highway vehicles and railroads burning diesel and gasoline fuels. Utilities contribute 18 percent of NOx emissions. The largest utility emitters are coal-fired power plants. Natural-gas fired mining facilities also contribute significant NOx emissions. Industrial sources emit 25 percent of total NOx largely from burning distillate oil and coal in boilers and from burning liquid petroleum gas (LPG) and diesel fuel in industrial and construction equipment. The remaining 13 percent of NOx emissions are mainly the result of fuel burning in agricultural equipment, residential and commercial heating, and non-road vehicles and equipment.
Trends
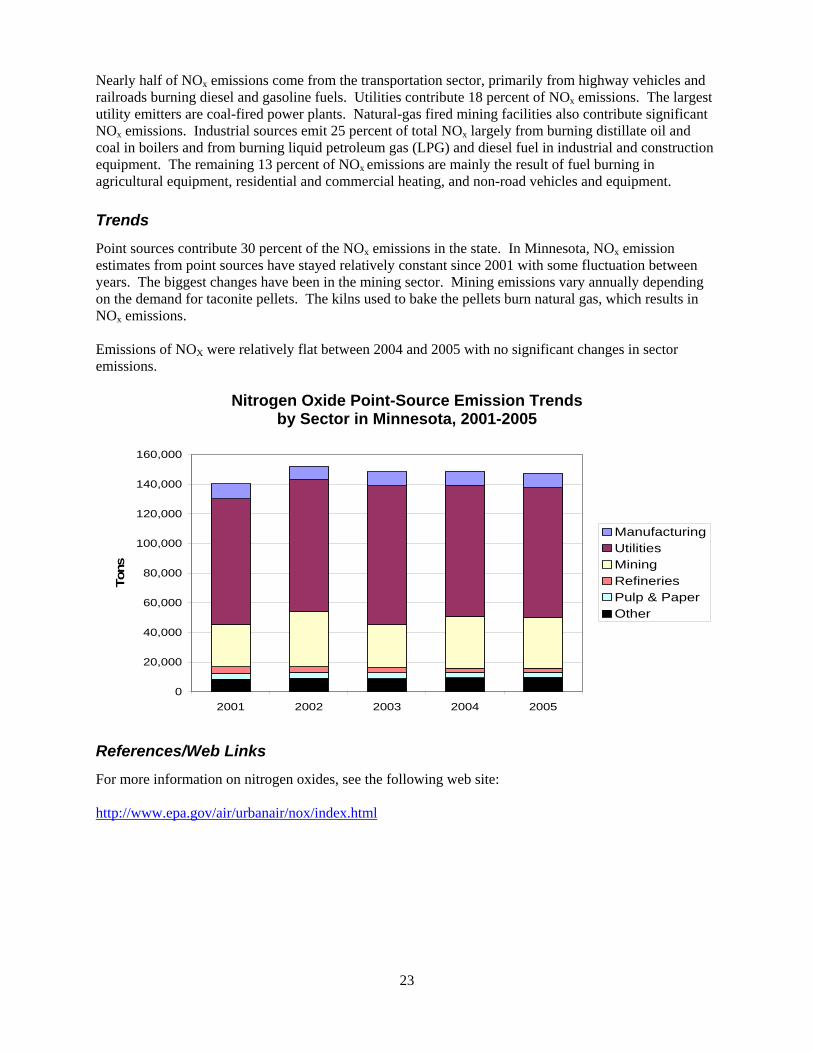
Point sources contribute 30 percent of the NOx emissions in the state. In Minnesota, NOx emission estimates from point sources have stayed relatively constant since 2001 with some fluctuation between years. The biggest changes have been in the mining sector. Mining emissions vary annually depending on the demand for taconite pellets. The kilns used to bake the pellets burn natural gas, which results in NOx emissions. Emissions of NOX were relatively flat between 2004 and 2005 with no significant changes in sector emissions.
Nitrogen Oxide Point-Source Emission Trends
by Sector in Minnesota, 2001-2005
0
20,000
40,000
60,000
80,000
100,000
120,000
140,000
160,000
2001 2002 2003 2004 2005
Tons
ManufacturingUtilitiesMiningRefineriesPulp & PaperOther
References/Web Links
For more information on nitrogen oxides, see the following web site: http://www.epa.gov/air/urbanair/nox/index.html
24
Ozone Ozone is an odorless, colorless gas composed of three atoms of oxygen. Naturally occurring ozone in the upper atmosphere helps protect the earth’s surface from ultraviolet radiation. However, at elevated concentrations, ground-level ozone can irritate the respiratory system, reduce lung function, aggravate asthma, increase people’s susceptibility to respiratory illnesses such as pneumonia and bronchitis, and cause permanent lung damage. Children, active adults, and people with respiratory diseases are particularly sensitive to ozone.
Emissions Data and Sources Emissions of ozone are not reported because ozone is not normally emitted directly into the air. Instead, it is created when “ozone precursors” such as nitrogen oxides (NOx) and volatile organic compounds (VOCs) react in a hot stagnant atmosphere. Since heat and sunlight are needed for ozone to be produced, elevated levels of ozone in Minnesota are normally seen on very hot summer afternoons. Ozone precursors come from a variety of sources. NOx can form when fuels are burned at high temperatures. The major NOx sources are combustion processes from highway vehicles and power plants. VOCs are emitted from a variety of sources, including industrial sources, motor vehicles and consumer products. NOx and VOCs are also emitted by naturally occurring sources such as soil and vegetation. See the nitrogen oxides and volatile organic compounds sections of this report for more information regarding 2005 emissions of ozone precursors.
References/Web Links
For more information on ozone, see the following web sites: http://www.epa.gov/air/ozonepollution/
http://www.epa.gov/airtrends/ozone.html
http://www.pca.state.mn.us/air/ozonestudy.html
25
Volatile Organic Compounds Volatile organic compounds (VOCs) are compounds containing the elements carbon and hydrogen that exist in the atmosphere primarily as gases because of their low vapor pressure. VOCs are defined in federal rules as chemicals that participate in forming ozone. Therefore, only gaseous hydrocarbons that are photochemically reactive and participate in the chemical and physical atmospheric reactions that form ozone and other photochemical oxidants are considered VOCs. Many VOCs are also air toxics and can have harmful effects on human health and the environment. However, VOCs are regulated as a criteria pollutant because they are precursors to ozone. See the sections on ozone and air toxics for related human health and environmental effects.
Emissions Data and Sources
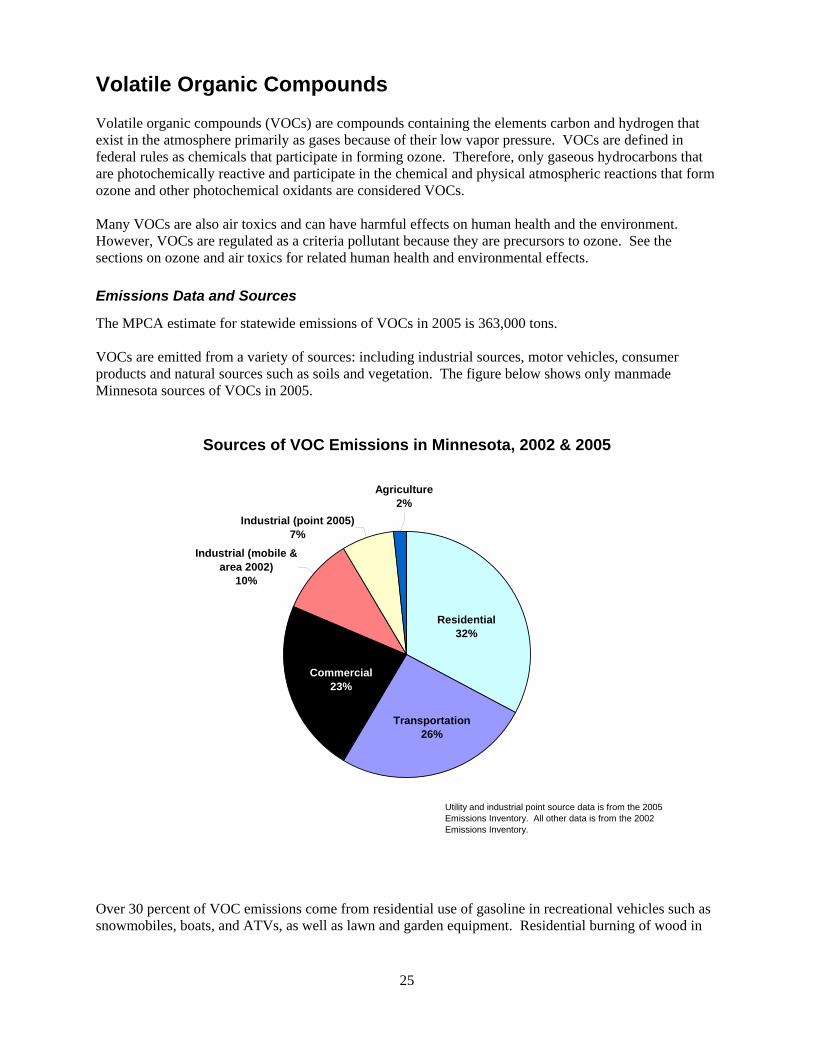
The MPCA estimate for statewide emissions of VOCs in 2005 is 363,000 tons. VOCs are emitted from a variety of sources: including industrial sources, motor vehicles, consumer products and natural sources such as soils and vegetation. The figure below shows only manmade Minnesota sources of VOCs in 2005.
Sources of VOC Emissions in Minnesota, 2002 & 2005
Industrial (mobile & area 2002)
10%
Industrial (point 2005)7%
Commercial23%
Transportation26%
Residential32%
Agriculture2%
Utility and industrial point source data is from the 2005 Emissions Inventory. All other data is from the 2002 Emissions Inventory.
Over 30 percent of VOC emissions come from residential use of gasoline in recreational vehicles such as snowmobiles, boats, and ATVs, as well as lawn and garden equipment. Residential burning of wood in
26
fireplaces and woodstoves and household waste burning also emits significant VOCs. The transportation sector emits 26 percent of VOC emissions, while the storage and transport of gasoline, pesticide applications, and surface coatings contribute the bulk of the 23 percent of VOC emissions from the commercial sector. The remaining 19 percent of emissions come primarily from industrial surface coating and degreasing and fuel combustion in industrial and agriculture equipment.
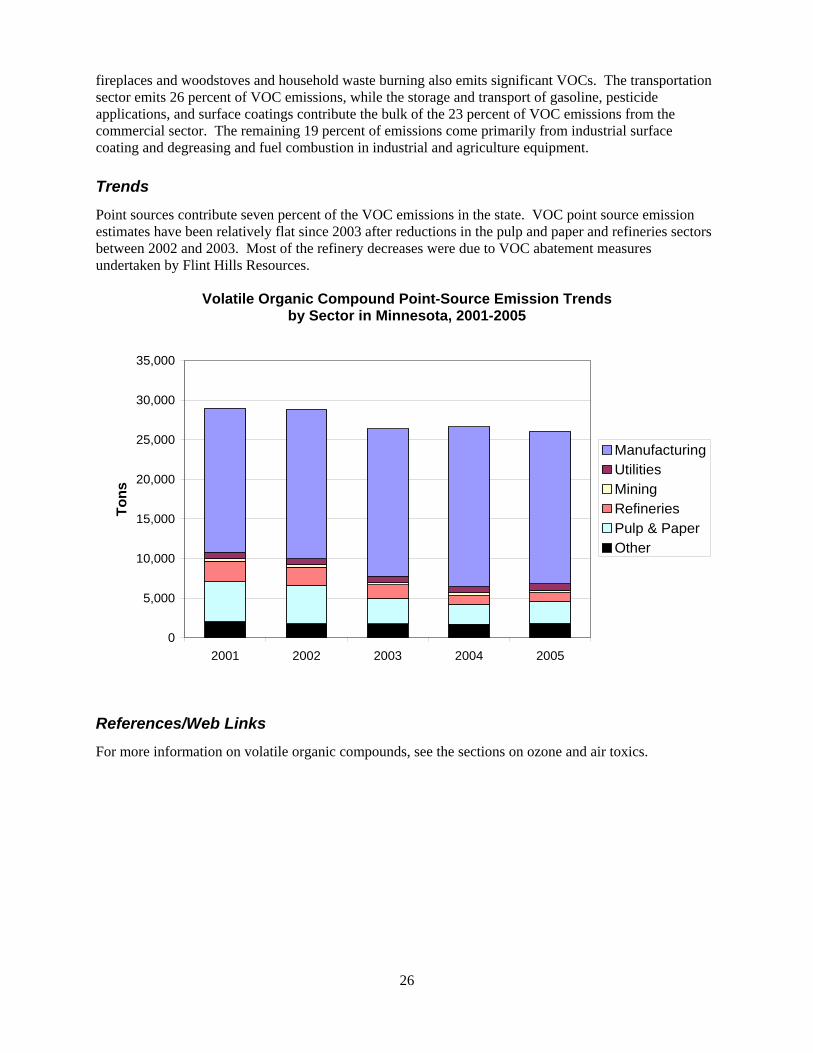
Trends Point sources contribute seven percent of the VOC emissions in the state. VOC point source emission estimates have been relatively flat since 2003 after reductions in the pulp and paper and refineries sectors between 2002 and 2003. Most of the refinery decreases were due to VOC abatement measures undertaken by Flint Hills Resources.
Volatile Organic Compound Point-Source Emission Trends by Sector in Minnesota, 2001-2005
0
5,000
10,000
15,000
20,000
25,000
30,000
35,000
2001 2002 2003 2004 2005
Tons
ManufacturingUtilitiesMiningRefineriesPulp & PaperOther
References/Web Links
For more information on volatile organic compounds, see the sections on ozone and air toxics.

27
Carbon Monoxide Carbon monoxide (CO) is a colorless and odorless toxic gas formed when carbon in fuels is not burned completely. CO enters the bloodstream and reduces the delivery of oxygen to the body’s organs and tissues. The health threat from CO is most serious for those who suffer from cardiovascular disease. At higher concentrations it also affects healthy individuals. Exposure to elevated CO levels is associated with impaired visual perception, work capacity, manual dexterity, learning ability and performance of complex tasks. Prolonged exposure to high levels can lead to death. At concentrations commonly found in the ambient air, CO does not appear to have adverse effects on plants, wildlife or materials. However, CO is oxidized to form carbon dioxide (CO2), a contributor to climate change.
Emissions Data and Sources
The MPCA estimate for statewide emissions of CO in 2005 is 1,978,000 tons. The figure below shows sources of 2005 CO emissions.
Sources of Carbon Monoxide Emissions in Minnesota, 2002 & 2005
Industrial (point 2005)1%
Transportation69%
Residential17%
Commercial7%
Agriculture2%
Industrial (mobile & area 2002)
4%
Industrial point source data is from the 2005 Emissions Inventory. All other data is from the 2002 Emissions Inventory.
The majority of CO emissions come from the transportation sector, mainly from the combustion of gasoline in highway vehicles. Residential burning of wood in woodstoves and fireplaces and combustion
28
of fuels in recreational vehicles such as snowmobiles, boats, golf carts, and ATVs as well as lawn and garden equipment contribute 17 percent to CO emissions. The remaining 14 percent of emissions comes from commercial, industrial and agricultural combustion sources.
Trends
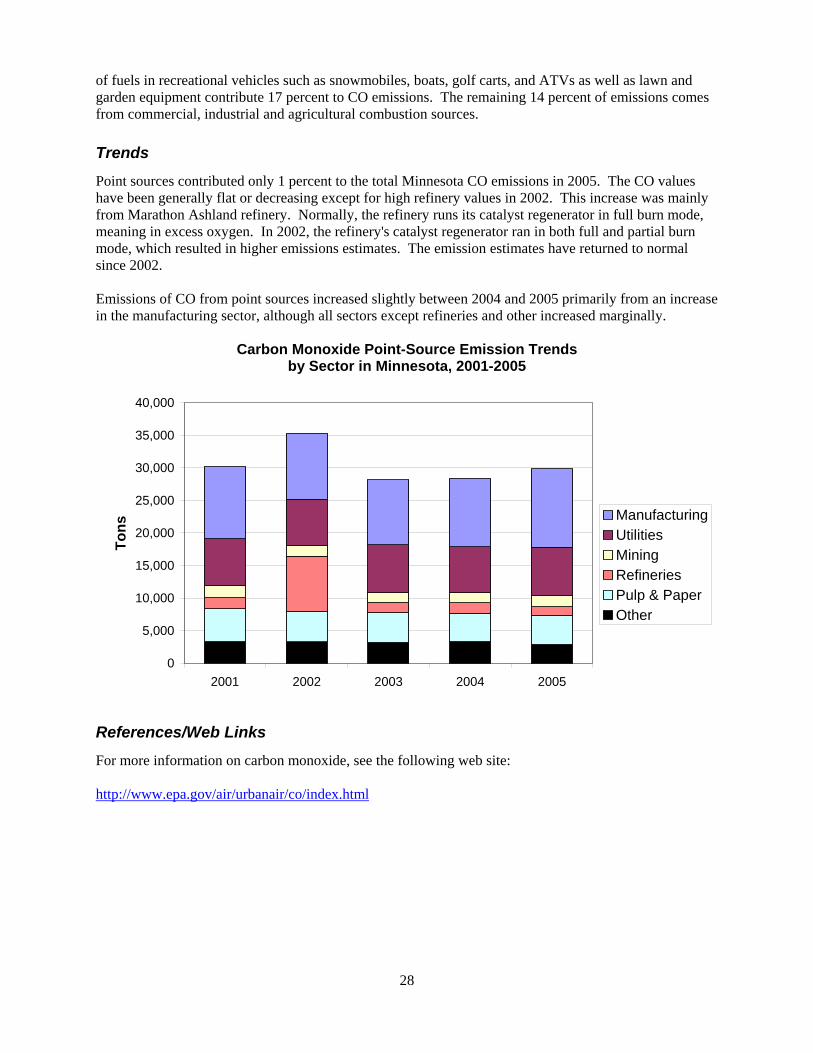
Point sources contributed only 1 percent to the total Minnesota CO emissions in 2005. The CO values have been generally flat or decreasing except for high refinery values in 2002. This increase was mainly from Marathon Ashland refinery. Normally, the refinery runs its catalyst regenerator in full burn mode, meaning in excess oxygen. In 2002, the refinery's catalyst regenerator ran in both full and partial burn mode, which resulted in higher emissions estimates. The emission estimates have returned to normal since 2002. Emissions of CO from point sources increased slightly between 2004 and 2005 primarily from an increase in the manufacturing sector, although all sectors except refineries and other increased marginally.
Carbon Monoxide Point-Source Emission Trends by Sector in Minnesota, 2001-2005
0
5,000
10,000
15,000
20,000
25,000
30,000
35,000
40,000
2001 2002 2003 2004 2005
Tons
ManufacturingUtilitiesMiningRefineriesPulp & PaperOther
References/Web Links
For more information on carbon monoxide, see the following web site: http://www.epa.gov/air/urbanair/co/index.html
29
Lead Lead (Pb) is a metal found naturally in the environment as well as in manufactured products. In the past, the major sources of lead emissions were motor vehicles and industrial sources. Since lead in gasoline was phased out, air emissions and ambient air concentrations have decreased dramatically. Currently, metals processing (lead and other metals smelters) and aircraft using leaded fuel are the primary sources of lead emissions. Lead causes damage to organs such as the kidneys and liver and may lead to high blood pressure and increased heart disease. In addition, exposure to lead may contribute to osteoporosis and reproductive disorders. Most importantly, lead exposure causes brain and nerve damage to fetuses and young children, resulting in seizures, behavioral disorders, memory problems, mood changes, learning deficits and lowered IQ. Elevated lead levels are also detrimental to animals and to the environment. Wild and domestic animals experience the same kind of effects as people exposed to lead. Elevated levels of lead in the water can cause reproductive damage in some aquatic life and cause blood and neurological changes in fish.
Emissions Data and Sources
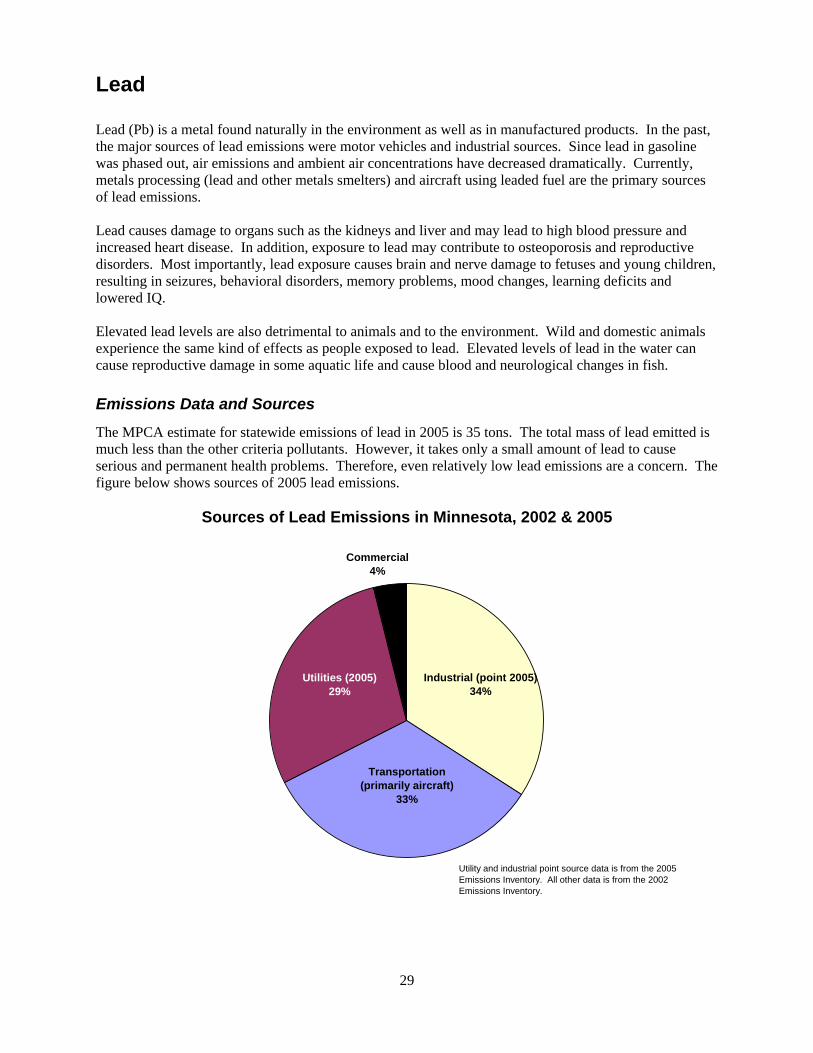
The MPCA estimate for statewide emissions of lead in 2005 is 35 tons. The total mass of lead emitted is much less than the other criteria pollutants. However, it takes only a small amount of lead to cause serious and permanent health problems. Therefore, even relatively low lead emissions are a concern. The figure below shows sources of 2005 lead emissions.
Sources of Lead Emissions in Minnesota, 2002 & 2005
Commercial4%
Utilities (2005)29%
Transportation (primarily aircraft)
33%
Industrial (point 2005)34%
Utility and industrial point source data is from the 2005 Emissions Inventory. All other data is from the 2002 Emissions Inventory.
30
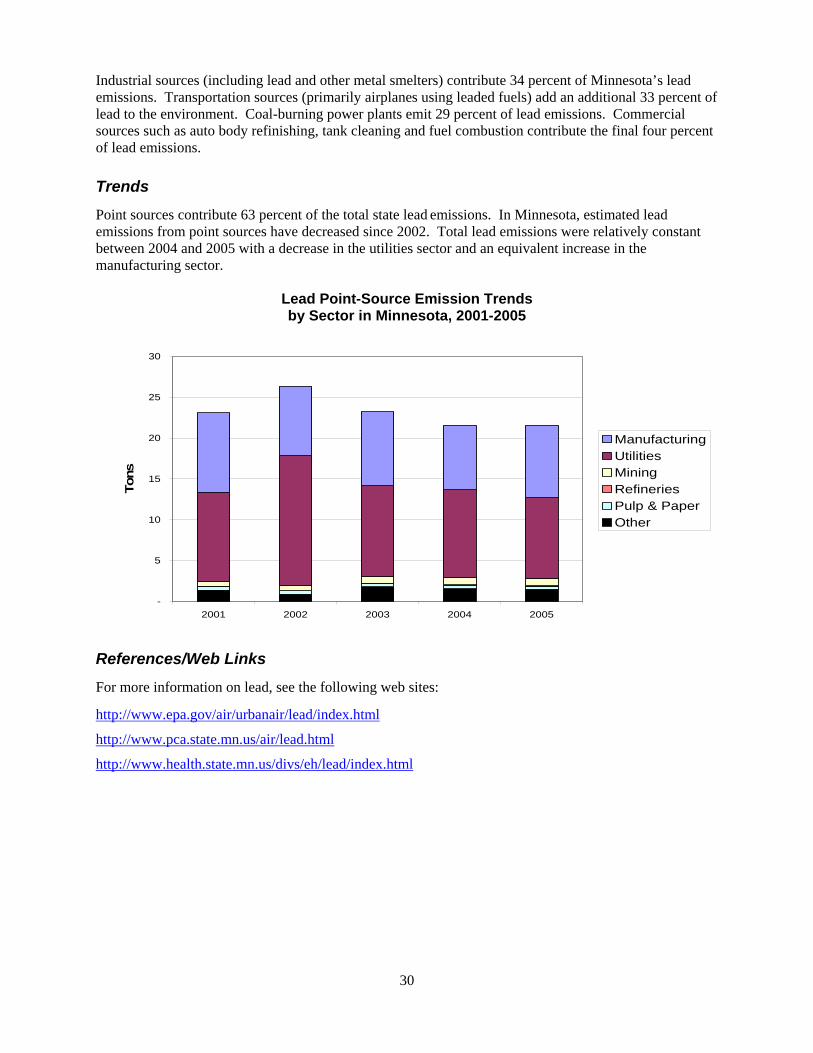
Industrial sources (including lead and other metal smelters) contribute 34 percent of Minnesota’s lead emissions. Transportation sources (primarily airplanes using leaded fuels) add an additional 33 percent of lead to the environment. Coal-burning power plants emit 29 percent of lead emissions. Commercial sources such as auto body refinishing, tank cleaning and fuel combustion contribute the final four percent of lead emissions.
Trends
Point sources contribute 63 percent of the total state lead emissions. In Minnesota, estimated lead emissions from point sources have decreased since 2002. Total lead emissions were relatively constant between 2004 and 2005 with a decrease in the utilities sector and an equivalent increase in the manufacturing sector.
Lead Point-Source Emission Trends by Sector in Minnesota, 2001-2005
-
5
10
15
20
25
30
2001 2002 2003 2004 2005
Tons
ManufacturingUtilitiesMiningRefineriesPulp & PaperOther
References/Web Links
For more information on lead, see the following web sites:
http://www.epa.gov/air/urbanair/lead/index.html http://www.pca.state.mn.us/air/lead.html
http://www.health.state.mn.us/divs/eh/lead/index.html

31
Mercury
Mercury contamination of fish is a well documented problem in Minnesota. The Minnesota Department of Health advises people to restrict their consumption of fish due to mercury from virtually every lake tested. Nearly all — more than 95 percent — of the mercury in Minnesota lakes and rivers comes from the atmosphere. Consequently, the data presented here only include atmospheric releases.
Emissions Data and Sources
Mercury emitted to the atmosphere due to human activities is divided by the MPCA into three categories: (1) Emissions resulting from energy production, (2) emissions due to the use and disposal of mercury in products, and (3) emissions due to taconite processing. Sources of Atmospheric Mercury Deposition to Minnesota Minnesota Mercury Emissions 2005
Energy Production
(mostly coal) 58%
Product Disposal
22%
Taconite Processing
20%
Natural Emissions
30%
Global Emissions
30%
Regional Emissions
40%
Minnesota Mercury Emissions (about 10% of all deposition)
Because mercury vapor can be transported long distances by the atmosphere, most of Minnesota’s emissions are deposited in other states and countries, and Minnesota receives their emissions. Minnesota emits about as much mercury as the state receives, and about 90 percent of Minnesota’s emissions are carried by the wind out of state. MPCA staff estimates that only about 10 percent of mercury deposition in Minnesota is the result of emissions originating within the state. MPCA staff estimates that the remaining 90 percent of the deposition is due to three roughly equal sources: 30 percent from human-generated sources in the rest of North America, 30 percent from human sources in the rest of the world, and 30 percent naturally cycling mercury.

32
Trends
MPCA staff estimates that total mercury emissions in Minnesota declined significantly from 1990 to 2000. In 1990, emissions are estimated to have been about 11,300 pounds. By 2005, mostly due to discontinued use of mercury in products and mandated controls on incineration of solid waste, emissions were about 3,300 pounds, a 70% reduction from 1990 levels.
0
2,000
4,000
6,000
8,000
10,000
12,000
1990 1995 2000 2005 2010 2015
Poun
ds
Product Use & Disposal
Other (mostly taconite production)
Energy (mostly coal and oil)
Mercury Emission Goal 789 lb
Estimated Annual Mercury Emissions in Minnesota 1990-2015
Sediment core studies from lakes in Minnesota and elsewhere show slight declines in atmospheric deposition relative to a peak in the 1970s and 1980s. There is some evidence that concentrations of mercury in fish have also declined, but not to the point of eliminating concerns about fish consumption. MPCA staff estimates that in order for Minnesota to significantly reduce concerns about mercury in fish, human-caused emission sources in and out of the state would need to be reduced by about 93 percent from 1990 levels, or about 78 percent from 2000 levels. Applying this goal to in-state sources yields a reduction goal of 789 lb per year.
To address the state’s largest emissions sources, the Mercury Reduction Act of 2006 requires three large electric power plants in the state to reduce emissions by 90 percent by 2014. This will result in a decrease of about 1,200 pounds from current levels. This reduction, added to cuts pledged at other coal-fired plants in the state, means that emissions in the state will continue to decline overall despite anticipated increases from new mining and power generation and increases from electric generation at remaining coal plants. Planning for these reductions is currently underway and decreases will begin as early as 2010. By 2015, the MPCA predicts that emissions will have declined about 80 percent from 1990 levels.
References/Web Links
For more information on mercury, see the following web sites: http://www.pca.state.mn.us/air/mercury.html
http://www.epa.gov/mercury/

33
Air Toxics The U.S. EPA refers to chemicals that cause serious health and environmental hazards as hazardous air pollutants or air toxics. EPA defines air toxics as pollutants that cause or may cause cancer or other serious health effects, such as reproductive effects or birth defects, or adverse environmental and ecological effects. One of the clean air goals in the MPCA's strategic plan is to meet all environmental and human health benchmarks for toxic air pollutants. Of the more than 60 gaseous air toxics measured by the MPCA that have health benchmarks, none commonly has concentrations above health benchmarks in Minnesota. The Minnesota Air Toxics Emission Inventory estimates emissions of air toxics. Air toxic emission inventories are generally compiled every three years. The most recent completed inventory for Minnesota is from 2002. The inventory includes three principal source categories: point, area, and mobile sources.
1. Point Sources: Typically large, stationary sources with relatively high emissions, such as electric power plants and refineries.
2. Area Sources: Typically stationary sources, but generally smaller sources of emissions than point sources. Examples include dry cleaners, gasoline service stations and residential wood combustion. Area sources may also include a diffuse stationary source, such as wildfires or agricultural tilling. These sources do not individually produce sufficient emissions to qualify as point sources. For example, a single gasoline station typically will not qualify as a point source, but collectively the emissions from many gas stations may be significant.
3. Mobile Sources: Mobile sources are broken up into two categories; on-road vehicles and non-road sources. On-road vehicles include vehicles operated on highways, streets and roads. Non-road sources are off-road vehicles and portable equipment powered by internal combustion engines. Lawn and garden equipment, construction equipment, aircraft and locomotives are examples of non-road sources.
MPCA staff compiled the emissions estimates for point and area sources in the 2002 inventory. The results for on-road vehicles, aircraft (including ground support equipment), and locomotives were also estimated by the MPCA. The estimates for commercial marine vessels were adopted from the Central Regional Air Planning Association. For all non-road equipment except snowmobiles and pleasure craft, MPCA used estimates from the EPA’s National Mobile Inventory Model prepared by the Lake Michigan Air Directors Consortium. For snowmobiles and pleasure craft, MPCA revised the results with survey data on fuel usage from the Minnesota Department of Natural Resources. Table 3 provides a summary of air toxics emissions from principal source categories taken from the 2002 Minnesota Air Toxics Emission Inventory. The table gives total statewide emissions of each chemical, along with the percent from point, area, on-road, and non-road mobile sources. The inventory includes 168 chemicals: 16 polycyclic aromatic hydrocarbon compounds (PAHs), 138 non-metal compounds, and 13 metal compounds.
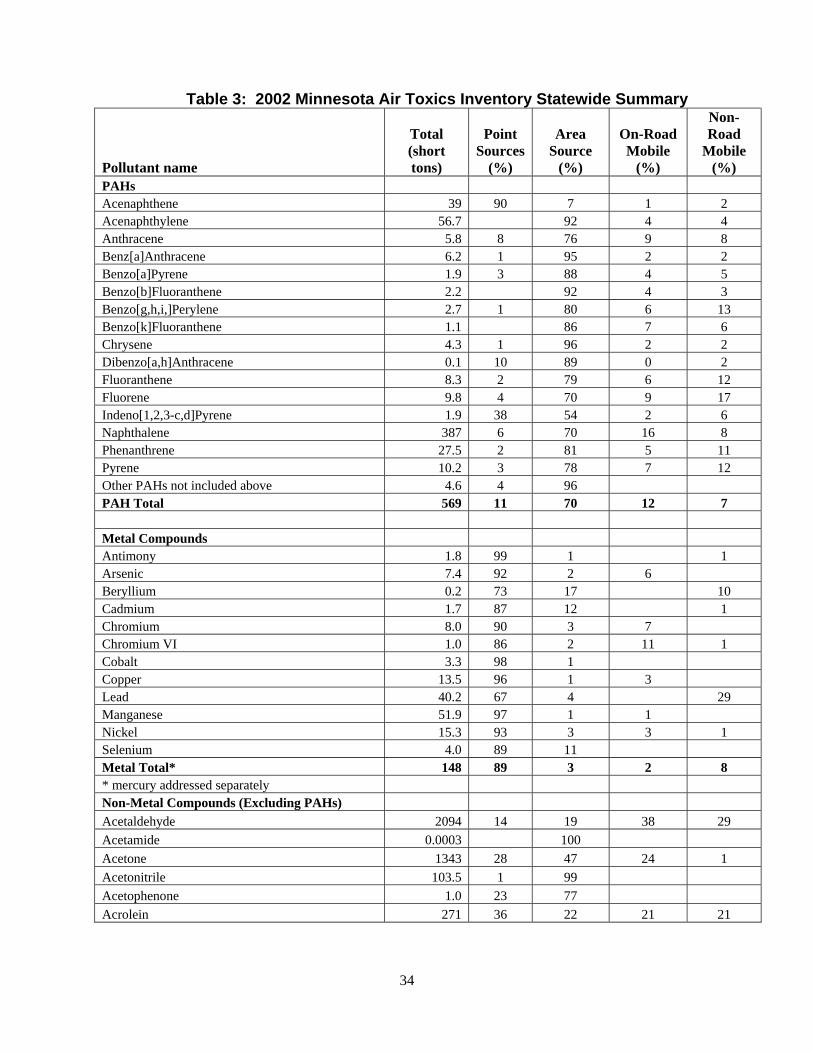
34
Table 3: 2002 Minnesota Air Toxics Inventory Statewide Summary
Pollutant name
Total (short tons)
Point Sources
(%)
Area Source
(%)
On-Road Mobile
(%)
Non-Road
Mobile (%)
PAHs Acenaphthene 39 90 7 1 2 Acenaphthylene 56.7 92 4 4 Anthracene 5.8 8 76 9 8 Benz[a]Anthracene 6.2 1 95 2 2 Benzo[a]Pyrene 1.9 3 88 4 5 Benzo[b]Fluoranthene 2.2 92 4 3 Benzo[g,h,i,]Perylene 2.7 1 80 6 13 Benzo[k]Fluoranthene 1.1 86 7 6 Chrysene 4.3 1 96 2 2 Dibenzo[a,h]Anthracene 0.1 10 89 0 2 Fluoranthene 8.3 2 79 6 12 Fluorene 9.8 4 70 9 17 Indeno[1,2,3-c,d]Pyrene 1.9 38 54 2 6 Naphthalene 387 6 70 16 8 Phenanthrene 27.5 2 81 5 11 Pyrene 10.2 3 78 7 12 Other PAHs not included above 4.6 4 96 PAH Total 569 11 70 12 7 Metal Compounds Antimony 1.8 99 1 1 Arsenic 7.4 92 2 6 Beryllium 0.2 73 17 10 Cadmium 1.7 87 12 1 Chromium 8.0 90 3 7 Chromium VI 1.0 86 2 11 1 Cobalt 3.3 98 1 Copper 13.5 96 1 3 Lead 40.2 67 4 29 Manganese 51.9 97 1 1 Nickel 15.3 93 3 3 1 Selenium 4.0 89 11 Metal Total* 148 89 3 2 8 * mercury addressed separately Non-Metal Compounds (Excluding PAHs) Acetaldehyde 2094 14 19 38 29 Acetamide 0.0003 100 Acetone 1343 28 47 24 1 Acetonitrile 103.5 1 99 Acetophenone 1.0 23 77 Acrolein 271 36 22 21 21
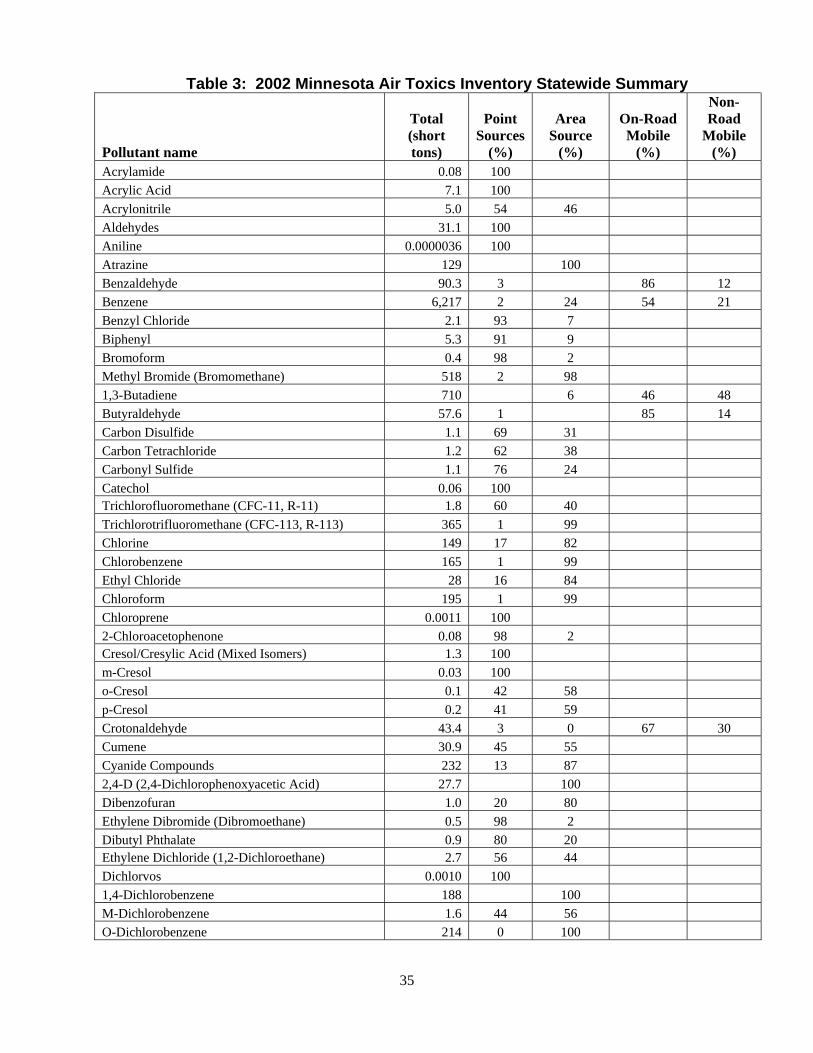
35
Table 3: 2002 Minnesota Air Toxics Inventory Statewide Summary
Pollutant name
Total (short tons)
Point Sources
(%)
Area Source
(%)
On-Road Mobile
(%)
Non-Road
Mobile (%)
Acrylamide 0.08 100 Acrylic Acid 7.1 100 Acrylonitrile 5.0 54 46 Aldehydes 31.1 100 Aniline 0.0000036 100 Atrazine 129 100 Benzaldehyde 90.3 3 86 12 Benzene 6,217 2 24 54 21 Benzyl Chloride 2.1 93 7 Biphenyl 5.3 91 9 Bromoform 0.4 98 2 Methyl Bromide (Bromomethane) 518 2 98 1,3-Butadiene 710 6 46 48 Butyraldehyde 57.6 1 85 14 Carbon Disulfide 1.1 69 31 Carbon Tetrachloride 1.2 62 38 Carbonyl Sulfide 1.1 76 24 Catechol 0.06 100 Trichlorofluoromethane (CFC-11, R-11) 1.8 60 40 Trichlorotrifluoromethane (CFC-113, R-113) 365 1 99 Chlorine 149 17 82 Chlorobenzene 165 1 99 Ethyl Chloride 28 16 84 Chloroform 195 1 99 Chloroprene 0.0011 100 2-Chloroacetophenone 0.08 98 2 Cresol/Cresylic Acid (Mixed Isomers) 1.3 100 m-Cresol 0.03 100 o-Cresol 0.1 42 58 p-Cresol 0.2 41 59 Crotonaldehyde 43.4 3 0 67 30 Cumene 30.9 45 55 Cyanide Compounds 232 13 87 2,4-D (2,4-Dichlorophenoxyacetic Acid) 27.7 100 Dibenzofuran 1.0 20 80 Ethylene Dibromide (Dibromoethane) 0.5 98 2 Dibutyl Phthalate 0.9 80 20 Ethylene Dichloride (1,2-Dichloroethane) 2.7 56 44 Dichlorvos 0.0010 100 1,4-Dichlorobenzene 188 100 M-Dichlorobenzene 1.6 44 56 O-Dichlorobenzene 214 0 100
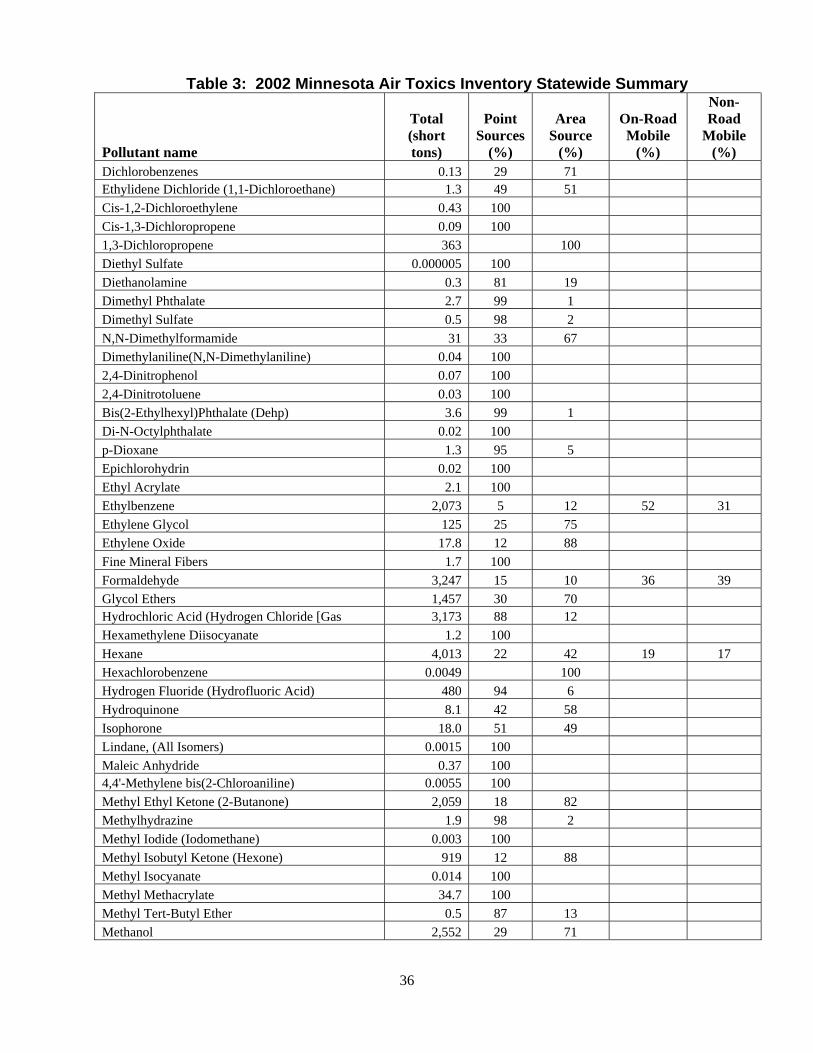
36
Table 3: 2002 Minnesota Air Toxics Inventory Statewide Summary
Pollutant name
Total (short tons)
Point Sources
(%)
Area Source
(%)
On-Road Mobile
(%)
Non-Road
Mobile (%)
Dichlorobenzenes 0.13 29 71 Ethylidene Dichloride (1,1-Dichloroethane) 1.3 49 51 Cis-1,2-Dichloroethylene 0.43 100 Cis-1,3-Dichloropropene 0.09 100 1,3-Dichloropropene 363 100 Diethyl Sulfate 0.000005 100 Diethanolamine 0.3 81 19 Dimethyl Phthalate 2.7 99 1 Dimethyl Sulfate 0.5 98 2 N,N-Dimethylformamide 31 33 67 Dimethylaniline(N,N-Dimethylaniline) 0.04 100 2,4-Dinitrophenol 0.07 100 2,4-Dinitrotoluene 0.03 100 Bis(2-Ethylhexyl)Phthalate (Dehp) 3.6 99 1 Di-N-Octylphthalate 0.02 100 p-Dioxane 1.3 95 5 Epichlorohydrin 0.02 100 Ethyl Acrylate 2.1 100 Ethylbenzene 2,073 5 12 52 31 Ethylene Glycol 125 25 75 Ethylene Oxide 17.8 12 88 Fine Mineral Fibers 1.7 100 Formaldehyde 3,247 15 10 36 39 Glycol Ethers 1,457 30 70 Hydrochloric Acid (Hydrogen Chloride [Gas 3,173 88 12 Hexamethylene Diisocyanate 1.2 100 Hexane 4,013 22 42 19 17 Hexachlorobenzene 0.0049 100 Hydrogen Fluoride (Hydrofluoric Acid) 480 94 6 Hydroquinone 8.1 42 58 Isophorone 18.0 51 49 Lindane, (All Isomers) 0.0015 100 Maleic Anhydride 0.37 100 4,4'-Methylene bis(2-Chloroaniline) 0.0055 100 Methyl Ethyl Ketone (2-Butanone) 2,059 18 82 Methylhydrazine 1.9 98 2 Methyl Iodide (Iodomethane) 0.003 100 Methyl Isobutyl Ketone (Hexone) 919 12 88 Methyl Isocyanate 0.014 100 Methyl Methacrylate 34.7 100 Methyl Tert-Butyl Ether 0.5 87 13 Methanol 2,552 29 71
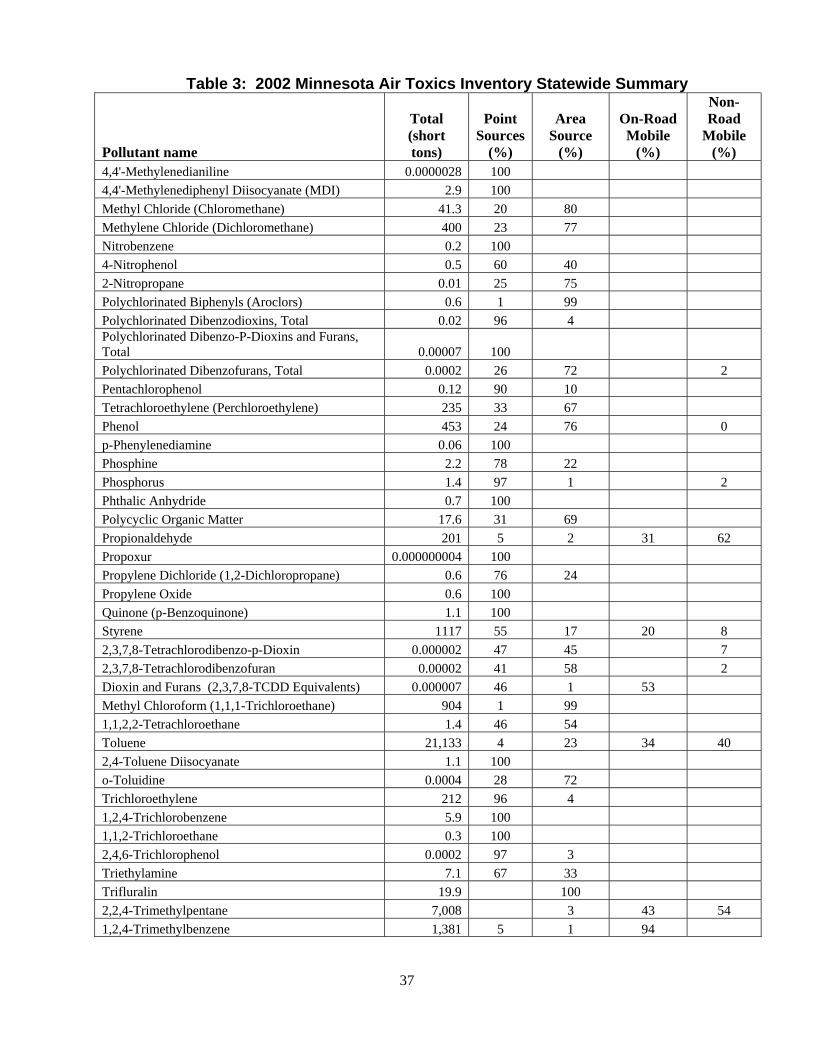
37
Table 3: 2002 Minnesota Air Toxics Inventory Statewide Summary
Pollutant name
Total (short tons)
Point Sources
(%)
Area Source
(%)
On-Road Mobile
(%)
Non-Road
Mobile (%)
4,4'-Methylenedianiline 0.0000028 100 4,4'-Methylenediphenyl Diisocyanate (MDI) 2.9 100 Methyl Chloride (Chloromethane) 41.3 20 80 Methylene Chloride (Dichloromethane) 400 23 77 Nitrobenzene 0.2 100 4-Nitrophenol 0.5 60 40 2-Nitropropane 0.01 25 75 Polychlorinated Biphenyls (Aroclors) 0.6 1 99 Polychlorinated Dibenzodioxins, Total 0.02 96 4 Polychlorinated Dibenzo-P-Dioxins and Furans, Total 0.00007 100 Polychlorinated Dibenzofurans, Total 0.0002 26 72 2 Pentachlorophenol 0.12 90 10 Tetrachloroethylene (Perchloroethylene) 235 33 67 Phenol 453 24 76 0 p-Phenylenediamine 0.06 100 Phosphine 2.2 78 22 Phosphorus 1.4 97 1 2 Phthalic Anhydride 0.7 100 Polycyclic Organic Matter 17.6 31 69 Propionaldehyde 201 5 2 31 62 Propoxur 0.000000004 100 Propylene Dichloride (1,2-Dichloropropane) 0.6 76 24 Propylene Oxide 0.6 100 Quinone (p-Benzoquinone) 1.1 100 Styrene 1117 55 17 20 8 2,3,7,8-Tetrachlorodibenzo-p-Dioxin 0.000002 47 45 7 2,3,7,8-Tetrachlorodibenzofuran 0.00002 41 58 2 Dioxin and Furans (2,3,7,8-TCDD Equivalents) 0.000007 46 1 53 Methyl Chloroform (1,1,1-Trichloroethane) 904 1 99 1,1,2,2-Tetrachloroethane 1.4 46 54 Toluene 21,133 4 23 34 40 2,4-Toluene Diisocyanate 1.1 100 o-Toluidine 0.0004 28 72 Trichloroethylene 212 96 4 1,2,4-Trichlorobenzene 5.9 100 1,1,2-Trichloroethane 0.3 100 2,4,6-Trichlorophenol 0.0002 97 3 Triethylamine 7.1 67 33 Trifluralin 19.9 100 2,2,4-Trimethylpentane 7,008 3 43 54 1,2,4-Trimethylbenzene 1,381 5 1 94
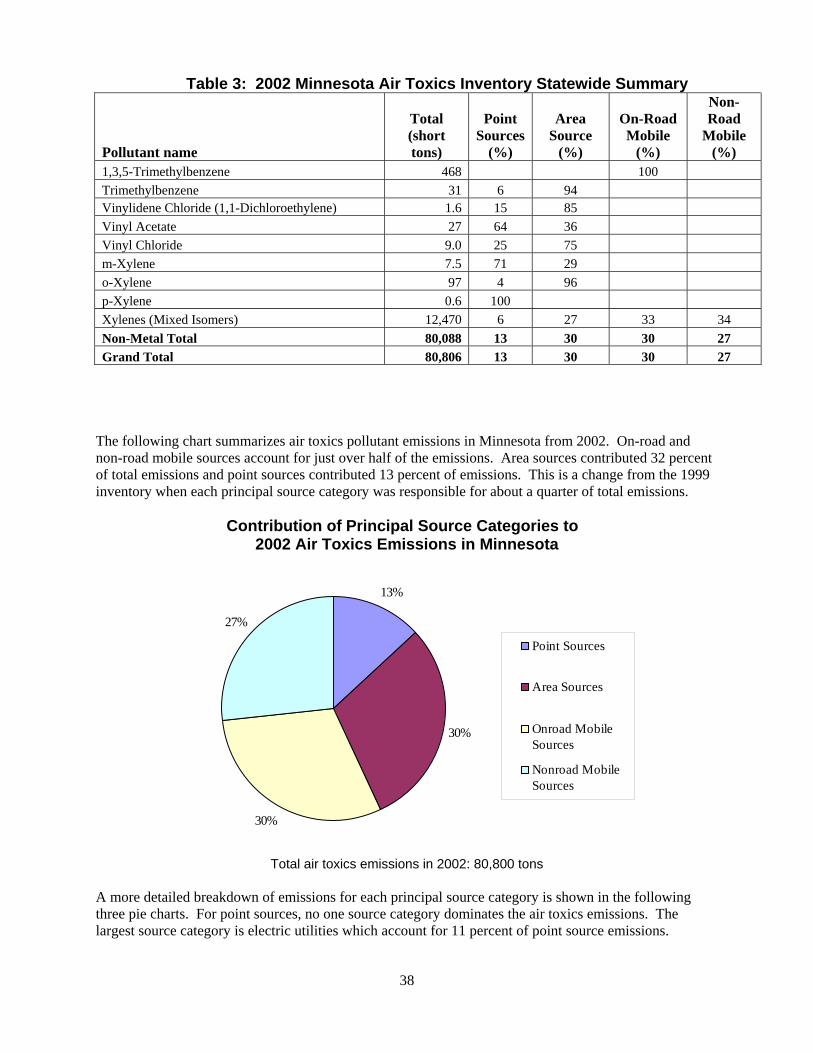
38
Table 3: 2002 Minnesota Air Toxics Inventory Statewide Summary
Pollutant name
Total (short tons)
Point Sources
(%)
Area Source
(%)
On-Road Mobile
(%)
Non-Road
Mobile (%)
1,3,5-Trimethylbenzene 468 100 Trimethylbenzene 31 6 94 Vinylidene Chloride (1,1-Dichloroethylene) 1.6 15 85 Vinyl Acetate 27 64 36 Vinyl Chloride 9.0 25 75 m-Xylene 7.5 71 29 o-Xylene 97 4 96 p-Xylene 0.6 100 Xylenes (Mixed Isomers) 12,470 6 27 33 34 Non-Metal Total 80,088 13 30 30 27 Grand Total 80,806 13 30 30 27
The following chart summarizes air toxics pollutant emissions in Minnesota from 2002. On-road and non-road mobile sources account for just over half of the emissions. Area sources contributed 32 percent of total emissions and point sources contributed 13 percent of emissions. This is a change from the 1999 inventory when each principal source category was responsible for about a quarter of total emissions.
Contribution of Principal Source Categories to 2002 Air Toxics Emissions in Minnesota
13%
30%
30%
27%
Point Sources
Area Sources
Onroad MobileSources
Nonroad MobileSources
Total air toxics emissions in 2002: 80,800 tons
A more detailed breakdown of emissions for each principal source category is shown in the following three pie charts. For point sources, no one source category dominates the air toxics emissions. The largest source category is electric utilities which account for 11 percent of point source emissions.
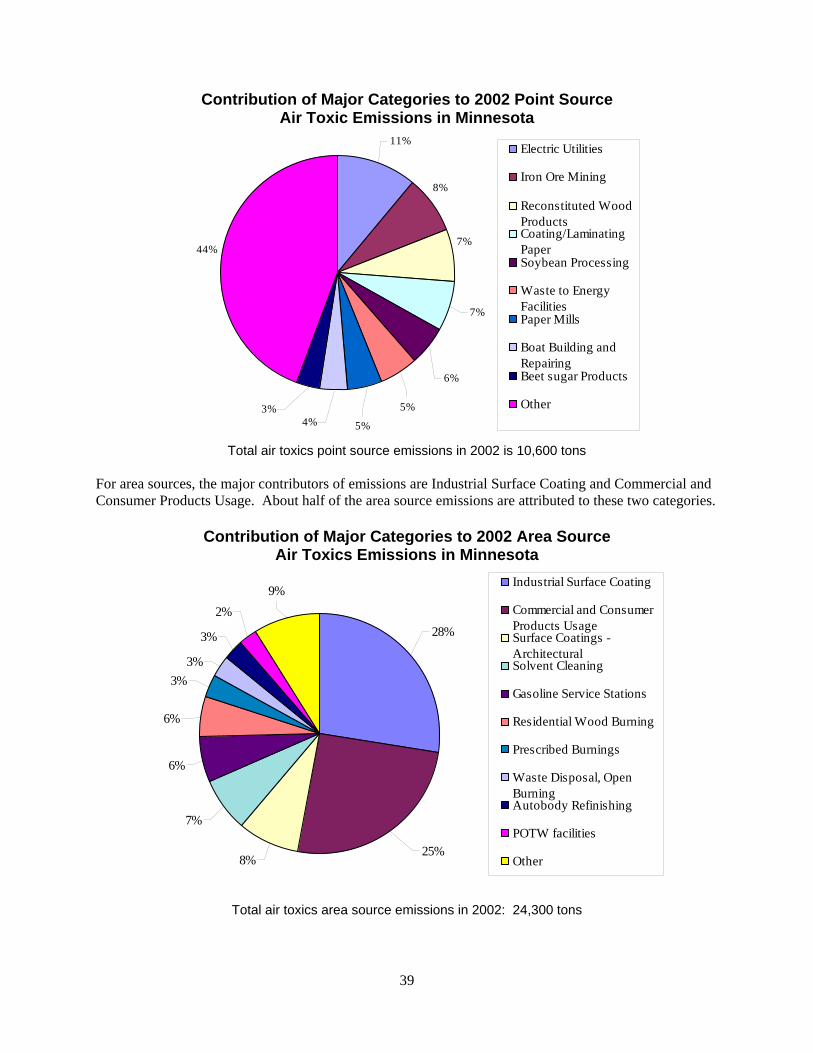
39
Contribution of Major Categories to 2002 Point Source
Air Toxic Emissions in Minnesota
44%
11%
3%4% 5%
5%
6%
7%
7%
8%
Electric Utilities
Iron Ore Mining
Reconstituted WoodProductsCoating/LaminatingPaperSoybean Processing
Waste to EnergyFacilitiesPaper Mills
Boat Building andRepairingBeet sugar Products
Other
Total air toxics point source emissions in 2002 is 10,600 tons
For area sources, the major contributors of emissions are Industrial Surface Coating and Commercial and Consumer Products Usage. About half of the area source emissions are attributed to these two categories.
Contribution of Major Categories to 2002 Area Source
Air Toxics Emissions in Minnesota
3%
3%
2%9%
28%
25%8%
7%
6%
6%
3%
Industrial Surface Coating
Commercial and ConsumerProducts UsageSurface Coatings -ArchitecturalSolvent Cleaning
Gasoline Service Stations
Residential Wood Burning
Prescribed Burnings
Waste Disposal, OpenBurningAutobody Refinishing
POTW facilities
Other
Total air toxics area source emissions in 2002: 24,300 tons
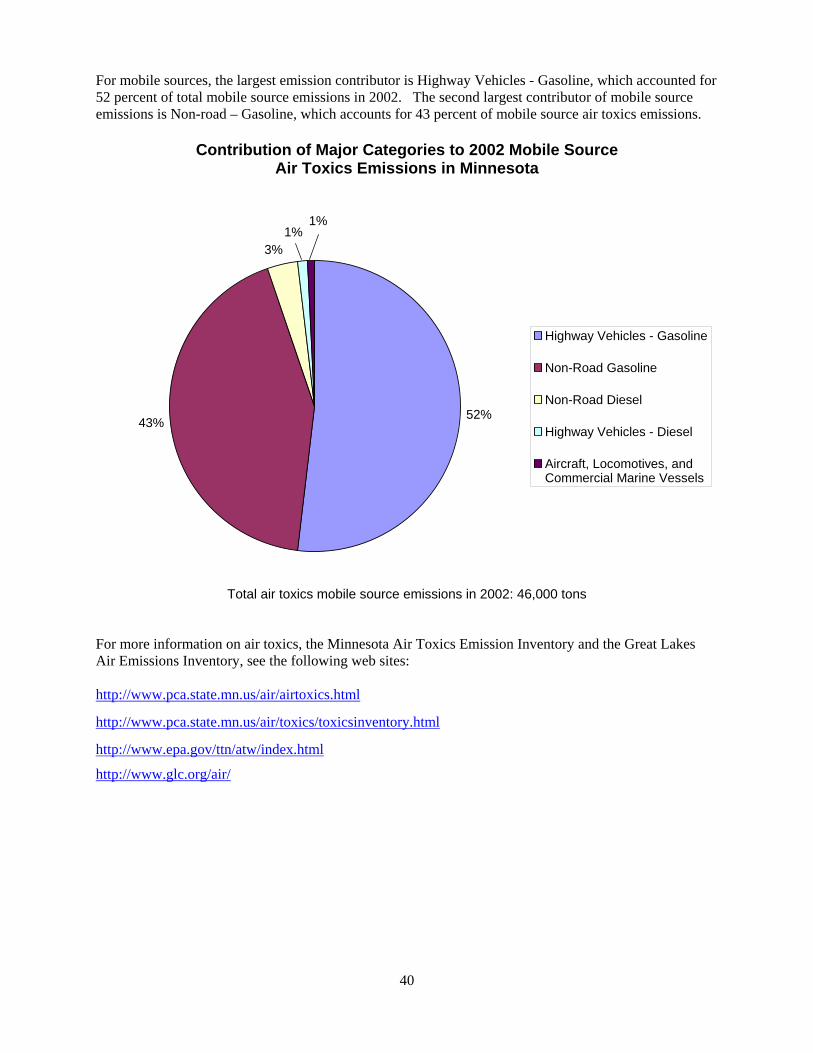
40
For mobile sources, the largest emission contributor is Highway Vehicles - Gasoline, which accounted for 52 percent of total mobile source emissions in 2002. The second largest contributor of mobile source emissions is Non-road – Gasoline, which accounts for 43 percent of mobile source air toxics emissions.
Contribution of Major Categories to 2002 Mobile Source
Air Toxics Emissions in Minnesota
52%43%
3%1%
1%
Highway Vehicles - Gasoline
Non-Road Gasoline
Non-Road Diesel
Highway Vehicles - Diesel
Aircraft, Locomotives, andCommercial Marine Vessels
Total air toxics mobile source emissions in 2002: 46,000 tons
For more information on air toxics, the Minnesota Air Toxics Emission Inventory and the Great Lakes Air Emissions Inventory, see the following web sites: http://www.pca.state.mn.us/air/airtoxics.html
http://www.pca.state.mn.us/air/toxics/toxicsinventory.html
http://www.epa.gov/ttn/atw/index.html
http://www.glc.org/air/
41
Chapter 2: Water Pollutant Discharges Overview
Minnesota’s rivers, streams and lakes provide great natural beauty, and supply the water necessary for recreation, industry, agriculture and aquatic life. The major goal of the MPCA’s water quality program is to protect and improve Minnesota’s rivers, lakes, wetlands and ground water so that they support healthy aquatic communities and designated public uses such as fishing, swimming and drinking water. The key strategies for accomplishing this goal include regulating point source discharges, controlling nonpoint sources of pollution, and assessing water quality to provide information and data to make sound environmental management decisions. Point sources consist mainly of municipal and industrial wastewater discharges. Point sources are most significant during periods of low precipitation and stream flow. Nonpoint sources include runoff from agricultural fields, feedlots, urban areas, and on-site sewage treatment (septic) systems. Nonpoint sources are most significant during periods of high precipitation and stream flow. Minnesota has been successful in controlling end-of-pipe discharges from wastewater treatment plants and industries to our state’s waters. But at the same time, the challenges posed by nonpoint sources of pollution are increasing in proportion with changing land uses and expanding population and development. The federal Clean Water Act requires states to adopt water quality standards to protect the nation’s waters. These standards define how much of a pollutant can be in a surface or ground water supply while still allowing it to meet its designated uses, such as for drinking water, fishing, swimming, irrigation or industrial purposes. For each pollutant that causes a water body to fail to meet state water quality standards, the federal Clean Water Act requires the MPCA to conduct a Total Maximum Daily Load (TMDL) study. A TMDL study identifies both point and nonpoint sources of each pollutant that fails to meet water quality standards. Rivers and streams may have several TMDLs, each one determining the limit for a different pollutant. Many of Minnesota’s water resources cannot currently meet their designated uses because of pollution from a combination of point and nonpoint sources. .
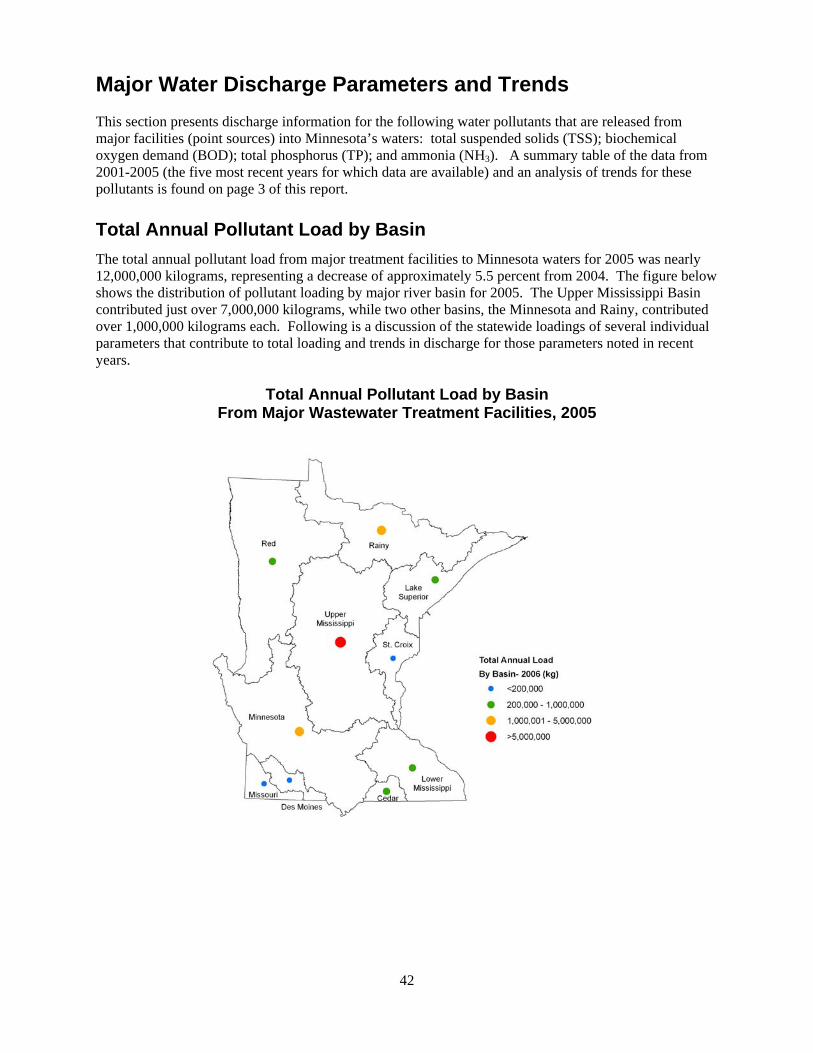
42
Major Water Discharge Parameters and Trends This section presents discharge information for the following water pollutants that are released from major facilities (point sources) into Minnesota’s waters: total suspended solids (TSS); biochemical oxygen demand (BOD); total phosphorus (TP); and ammonia (NH3). A summary table of the data from 2001-2005 (the five most recent years for which data are available) and an analysis of trends for these pollutants is found on page 3 of this report.
Total Annual Pollutant Load by Basin The total annual pollutant load from major treatment facilities to Minnesota waters for 2005 was nearly 12,000,000 kilograms, representing a decrease of approximately 5.5 percent from 2004. The figure below shows the distribution of pollutant loading by major river basin for 2005. The Upper Mississippi Basin contributed just over 7,000,000 kilograms, while two other basins, the Minnesota and Rainy, contributed over 1,000,000 kilograms each. Following is a discussion of the statewide loadings of several individual parameters that contribute to total loading and trends in discharge for those parameters noted in recent years.
Total Annual Pollutant Load by Basin From Major Wastewater Treatment Facilities, 2005
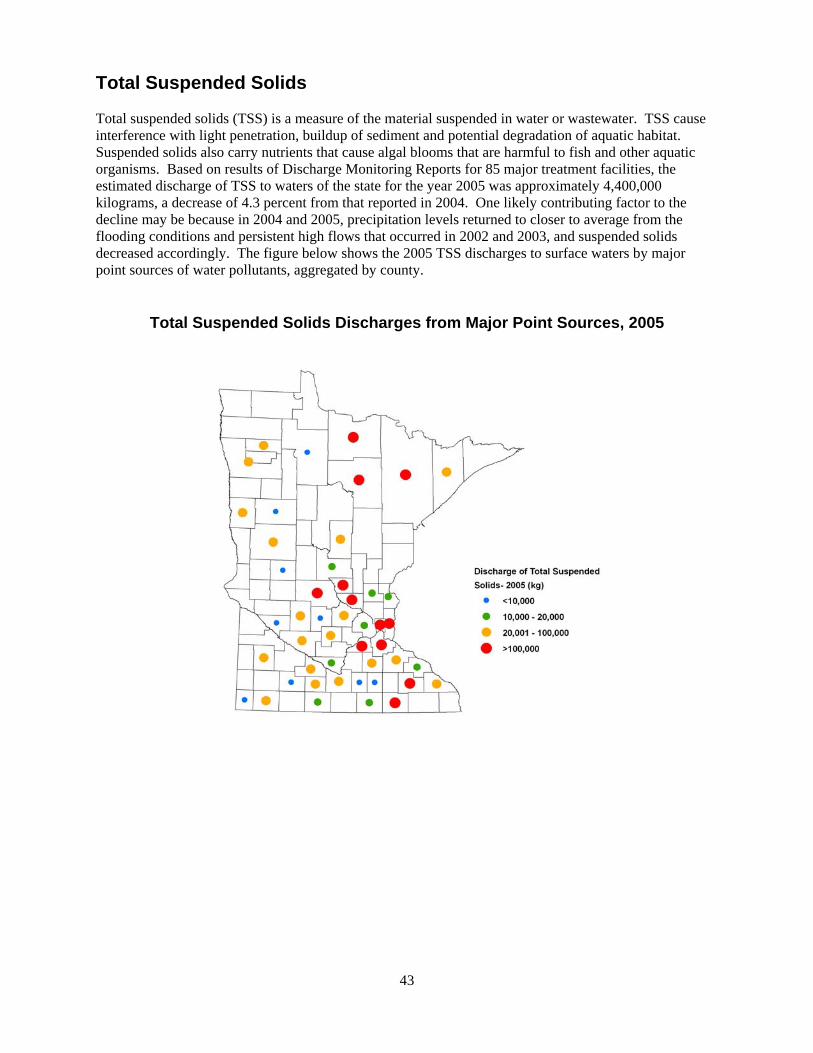
43
Total Suspended Solids Total suspended solids (TSS) is a measure of the material suspended in water or wastewater. TSS cause interference with light penetration, buildup of sediment and potential degradation of aquatic habitat. Suspended solids also carry nutrients that cause algal blooms that are harmful to fish and other aquatic organisms. Based on results of Discharge Monitoring Reports for 85 major treatment facilities, the estimated discharge of TSS to waters of the state for the year 2005 was approximately 4,400,000 kilograms, a decrease of 4.3 percent from that reported in 2004. One likely contributing factor to the decline may be because in 2004 and 2005, precipitation levels returned to closer to average from the flooding conditions and persistent high flows that occurred in 2002 and 2003, and suspended solids decreased accordingly. The figure below shows the 2005 TSS discharges to surface waters by major point sources of water pollutants, aggregated by county.
Total Suspended Solids Discharges from Major Point Sources, 2005

44
Biochemical Oxygen Demand When organic wastes are introduced into water, they require oxygen to break down. High concentrations of organic materials characterize untreated domestic wastes and many industrial wastes. The amount of oxygen required for decomposition of organic wastes by microorganisms is known as biochemical oxygen demand (BOD). Carbonaceous biochemical oxygen demand (CBOD) refers specifically to the reduction of organic carbon to its lowest energy state, carbon dioxide (CO2), by microorganisms. CBOD may be considered a subset of BOD. Both BOD and CBOD are indicators of the strength of waste effluent and effectiveness of treatment. For purposes of this report, BOD data were used whenever available; CBOD data were used only if BOD was not reported. A high demand for oxygen causes reduction in the concentration of dissolved oxygen in the receiving waters. Depletion of oxygen deteriorates water quality and impacts aquatic life, including fish and other organisms. Based on results of Discharge Monitoring Reports for 76 major treatment facilities, the estimated discharge of BOD to waters of the state for 2005 was approximately 2,700,000 kilograms, a 10 percent decrease from 2004. The combined BOD discharge to waters of the state has decreased each year since 2002, when it peaked at approximately 4,200,000 kilograms. The figure below shows the 2005 BOD discharges to surface waters by major point sources of water pollution, aggregated by county.
Biochemical Oxygen Demand Discharges from Major Point Sources, 2005
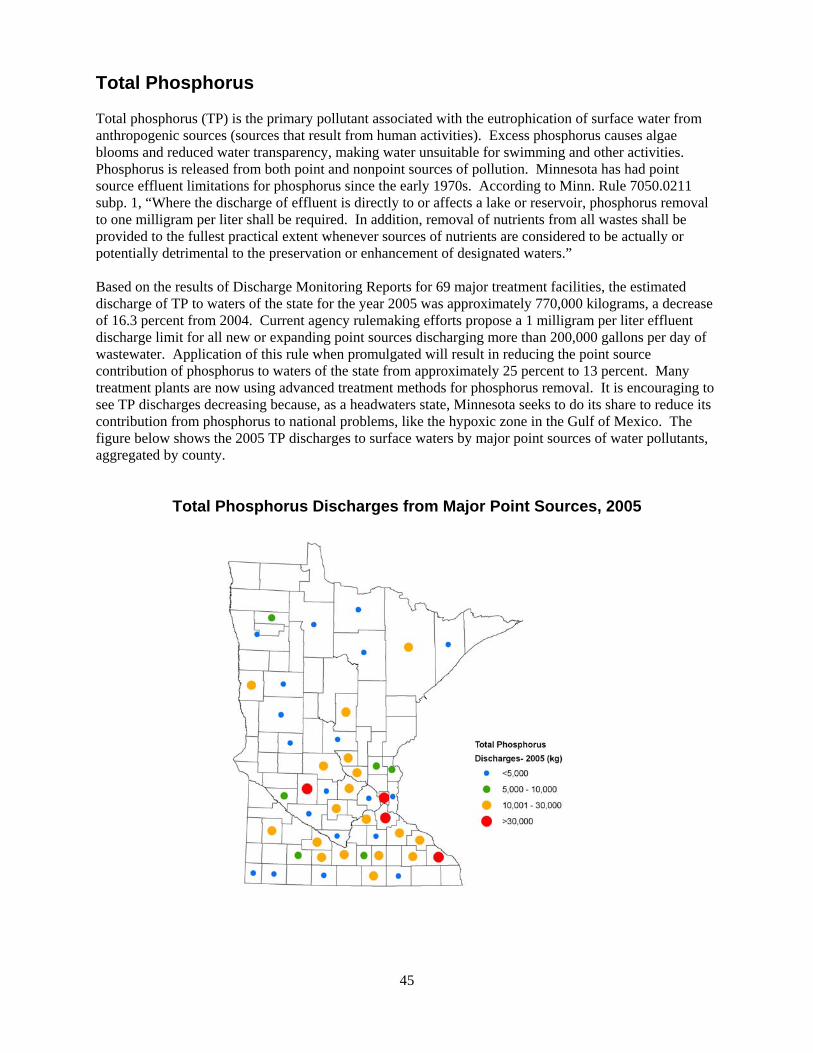
45
Total Phosphorus Total phosphorus (TP) is the primary pollutant associated with the eutrophication of surface water from anthropogenic sources (sources that result from human activities). Excess phosphorus causes algae blooms and reduced water transparency, making water unsuitable for swimming and other activities. Phosphorus is released from both point and nonpoint sources of pollution. Minnesota has had point source effluent limitations for phosphorus since the early 1970s. According to Minn. Rule 7050.0211 subp. 1, “Where the discharge of effluent is directly to or affects a lake or reservoir, phosphorus removal to one milligram per liter shall be required. In addition, removal of nutrients from all wastes shall be provided to the fullest practical extent whenever sources of nutrients are considered to be actually or potentially detrimental to the preservation or enhancement of designated waters.” Based on the results of Discharge Monitoring Reports for 69 major treatment facilities, the estimated discharge of TP to waters of the state for the year 2005 was approximately 770,000 kilograms, a decrease of 16.3 percent from 2004. Current agency rulemaking efforts propose a 1 milligram per liter effluent discharge limit for all new or expanding point sources discharging more than 200,000 gallons per day of wastewater. Application of this rule when promulgated will result in reducing the point source contribution of phosphorus to waters of the state from approximately 25 percent to 13 percent. Many treatment plants are now using advanced treatment methods for phosphorus removal. It is encouraging to see TP discharges decreasing because, as a headwaters state, Minnesota seeks to do its share to reduce its contribution from phosphorus to national problems, like the hypoxic zone in the Gulf of Mexico. The figure below shows the 2005 TP discharges to surface waters by major point sources of water pollutants, aggregated by county.
Total Phosphorus Discharges from Major Point Sources, 2005
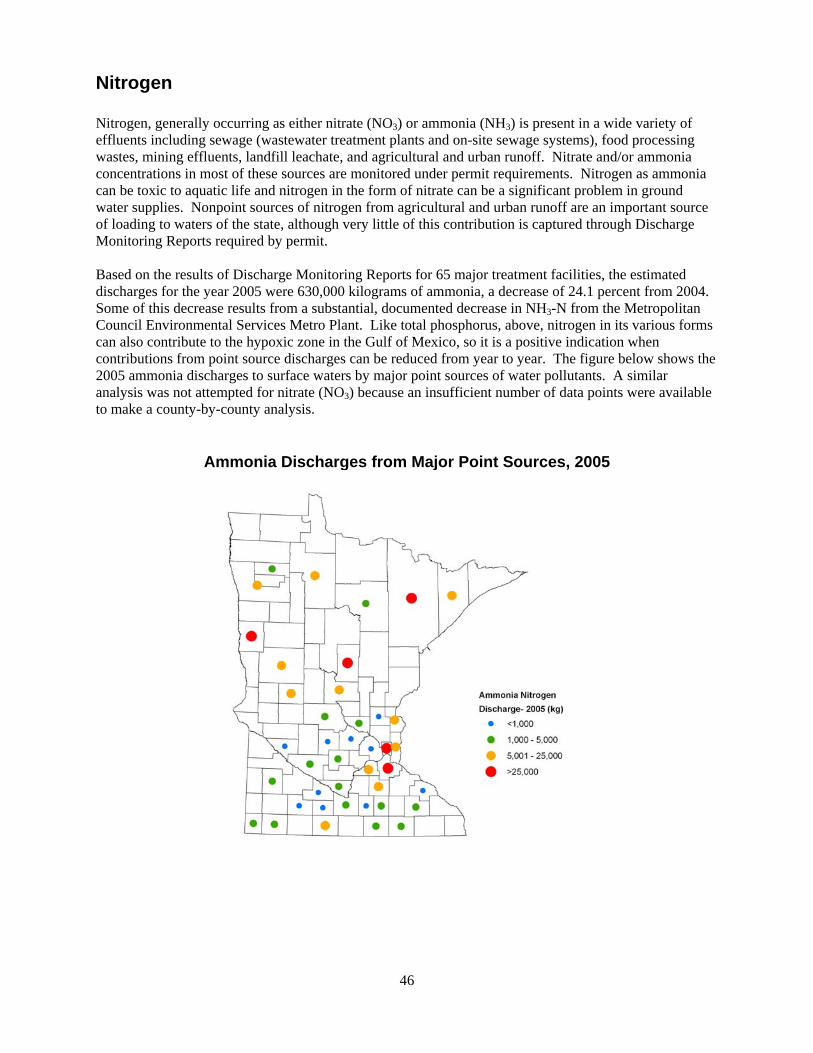
46
Nitrogen Nitrogen, generally occurring as either nitrate (NO3) or ammonia (NH3) is present in a wide variety of effluents including sewage (wastewater treatment plants and on-site sewage systems), food processing wastes, mining effluents, landfill leachate, and agricultural and urban runoff. Nitrate and/or ammonia concentrations in most of these sources are monitored under permit requirements. Nitrogen as ammonia can be toxic to aquatic life and nitrogen in the form of nitrate can be a significant problem in ground water supplies. Nonpoint sources of nitrogen from agricultural and urban runoff are an important source of loading to waters of the state, although very little of this contribution is captured through Discharge Monitoring Reports required by permit. Based on the results of Discharge Monitoring Reports for 65 major treatment facilities, the estimated discharges for the year 2005 were 630,000 kilograms of ammonia, a decrease of 24.1 percent from 2004. Some of this decrease results from a substantial, documented decrease in NH3-N from the Metropolitan Council Environmental Services Metro Plant. Like total phosphorus, above, nitrogen in its various forms can also contribute to the hypoxic zone in the Gulf of Mexico, so it is a positive indication when contributions from point source discharges can be reduced from year to year. The figure below shows the 2005 ammonia discharges to surface waters by major point sources of water pollutants. A similar analysis was not attempted for nitrate (NO3) because an insufficient number of data points were available to make a county-by-county analysis.
Ammonia Discharges from Major Point Sources, 2005
47
Nonpoint Source Pollution
As previously discussed, Minnesota has made significant progress in cleaning up point sources of water pollution as measured by discharges of pollutants in municipal and industrial wastewater. An indicator of this success is shown by the fact that the 85 major treatment facilities discharging more than one million gallons per day of treated effluent have cut their total amount of pollutants discharged to waters of the state by nearly 8,000,000 kilograms since 2001, despite year-to-year variation in levels of individual pollutants due to factors such as climate variability, change in flow conditions, and even fluctuations in the economy. It is the nonpoint sources of pollution from rainfall or snow melt moving over or through the ground carrying natural and human-made pollutants into lakes, rivers, wetlands and ground water that now pose the greater challenge for cleanup. Both point and nonpoint sources of pollution must be controlled to reach the Clean Water Act goal of fishable, swimmable waters in the state. Despite significant improvements in recent years, too much phosphorus and nitrogen continue to reach our waters, carried in soil erosion and runoff from roads, yards, farms and septic systems. Over the past few years, more regulatory controls for sources like feedlots, septic systems and stormwater have been implemented, but these sources of nonpoint pollution can be diffuse and difficult to manage. Much of the work to control nonpoint source pollution thus far has used financial incentives to encourage voluntary adoption of best management practices (BMPs). The Board of Water and Soil Resources (BWSR) has attempted to quantify the amount of nonpoint source pollutants like nitrogen, phosphorus and sediment avoided by use of BMPs. See pages 5-7 of the 2006 “Watershed Achievements” report at: http://www.pca.state.mn.us/publications/wq-cwp8-06.pdf The big news in nonpoint source restoration and impaired waters reduction for 2006 was that the Minnesota Legislature passed a policy bill and initial funding as a part of the Clean Water Legacy Act. The Act provides for $24 million in funding, with over $11 million earmarked for nonpoint source restoration. In addition, over $1.1 million will go toward monitoring to help assess the effectiveness of BMPs and other restorative measures. Many of the stresses from nonpoint sources of pollution that affect Minnesota’s surface and ground water resources are the result of choices that individuals make every day, such as lawn care practices, watercraft operation and waste disposal. The daily decisions that homeowners, developers, farmers and businesses make regarding land use are crucial to protecting water resources from the effects of nonpoint source pollution. Once a water resource declines in quality, recovery is costly and can take many years. Clearly, prevention is the key when it comes to nonpoint source pollution. What happens to Minnesota’s water resources in the next 10 years will help determine the quality of those resources for the next 100 years.

48
Pollutant Trends at Minnesota Milestone Monitoring Sites Measuring the effects of solely nonpoint source pollution can be difficult and expensive. The best long-term data about Minnesota streams comes from measuring six key pollutants at 80 stream locations over the past 40 years as part of the Minnesota Milestone Monitoring Program. These locations are chosen to not be unduly influenced by the effects of point source pollution, although the results certainly reflect the contribution of all discharges upstream of the monitoring point.
Pollutant Trends at Minnesota Milestone Sites
The results of the Milestone Monitoring Program generally agree with trends shown by point source discharges from Discharge Monitoring Reports. Improvements in BOD, fecal coliform bacteria, ammonia and phosphorus are likely indicative of success in dealing with municipal and industrial point sources. The increases in suspended solids and especially nitrate are likely due to increasing nonpoint source contributions. In the case of nitrate, increased nitrogen fertilization coupled with higher than normal precipitation (at least until 2004) and improved efficiency of drain tiling systems have resulted in increased nitrogen loading to rivers and streams. As another example, ground water data collected from several hundred wells across the state in aquifers that are sensitive to nitrate contamination showed that 60% of the wells monitored had nitrate levels above one part per million (ppm), suggesting possible anthropomorphic impacts to the aquifer that the well taps. Of these, 18% contained nitrates above the drinking water standard of 10 ppm. More about nitrates in Minnesota’s ground water is discussed at: http://www.pca.state.mn.us/water/groundwater/pubs/nitrate.pdf
Fecal Coliform Bacteria
pollutiondecreasing
pollutionincreasing
no trend
Biochemical Oxygen Demand Unionized Ammonia
Total Phosphorus Total Suspended Solids Nitrite/Nitrate
pollutiondecreasing
pollutionincreasing
no trend
49
Nonpoint Pollution Case Study: Road Salt in the Shingle Creek Watershed The Shingle Creek watershed is a largely urban watershed located in the northwestern part of the Minneapolis metropolitan region. The watershed was first used as an example of a nonpoint pollution case study in the 2005 Annual Pollution Report. The creek is heavily used for stormwater management. It is approximately 11 miles long and drops approximately 66 feet from its source in northwestern Hennepin County to its mouth at the Mississippi River. The MPCA determined that waters in the Shingle Creek watershed exceed the state chloride standard for aquatic life (Class 2 water). Class 2 waters include a chronic standard of 230 mg/L based on a four-day average and an acute standard of 860 mg/L for a one-hour duration. Section 303(d) of the Clean Water Act (CWA) requires the MPCA to identify waters that do not meet state water quality standards and develop Total Maximum Daily Loads (TMDLs) for those water bodies. A TMDL is the total amount of a pollutant that a water body can assimilate and still meet standards on a daily basis. Through the TMDL, pollutant loads can be distributed among the point and nonpoint sources in the watershed. Pollutant load allocations can then be used to make science-based decisions on land use management in the watershed. In 2004, the Shingle Creek Watershed Management Association and MPCA contracted with Wenck Associates to develop a chloride TMDL for the Shingle Creek watershed. The primary objectives were to: Define the spatial extent, persistence and severity of chloride exceedances in the watershed;
Identify and quantify the sources of chloride in Shingle Creek including point and nonpoint sources;
and Allocate Shingle Creek’s assimilative capacity to both point and nonpoint sources and develop safety
margins protective of state water quality standards. In order to understand chloride dynamics in an urban environment, monitoring of conductivity, chloride and discharge was conducted. In addition to obtaining grab samples biweekly and during runoff events, seven sites in the watershed were continuously monitored for flow and conductivity. An inventory of point and nonpoint sources was also conducted in the watershed. An inventory of salt storage piles and maintenance facilities as well as a compilation of salt application rates by the state (MnDOT), Hennepin County and the major cities in the watershed was done. Other potential sources of chloride in the watershed that were considered include private industrial and residential deicing, landfills, railway and airport deicing, fertilizer application, ground water discharge and natural sources (as a result of soil erosion and precipitation). The consultant used an empirical approach to develop the chloride TMDL for Shingle Creek. The analytical data collected in the watershed was used to identify flow conditions and time of year where the most exceedances occurred. Measured loads were used to empirically develop wasteload allocations needed to meet water quality standards for chloride in Shingle Creek. Using the monitoring data, seasonal load duration curves can be developed and compared. Because chloride is largely a nonpoint source issue in the Shingle Creek watershed, the TMDL cannot be assigned a single number, but rather is a curve that represents an allowable daily load across all flow regimes. To view the complete report from which this summary was abstracted, see: http://www.shinglecreek.org/tmdl.pdf
50
Another conclusion of the report was that 84% of the chloride load to Shingle Creek is related to the storage and application of road salt by public entities, while the remaining 16% was attributed to commercial, residential and ground water sources. According to the most recent goal established by MPCA (Shingle Creek TMDL: Chloride; September 2006), a 71% reduction in total chloride loading will be needed to bring chloride concentrations down to recommended standards for Shingle Creek and avoid future water quality impairments. These reductions will mainly come through the implementation of best management practices (BMPs) by road maintenance authorities and private commercial applicators. These standards are set to be conservative, that is, at the point where the most sensitive fauna in a surface water body will begin to experience deleterious effects under either acute or chronic conditions. In April 2005, the Minnesota Department of Transportation (MnDOT) issued the report, Best Available Technology: A Review of MnDOT Salt Management Practices in the Shingle Creek Watershed. The report describes implementation of MnDOT’s Salt Solutions Program, aimed at improving efficiencies in salt application and management. Actual BMPs implemented or being implemented in the Shingle Creek watershed have included: improving operator training and monitoring to ensure operators are meeting state guidelines;
using an anti-icing maintenance strategy on bridges in the watershed by applying ice control
chemicals just before a storm to reduce total chemical use; road testing alternative liquid deicing chemicals lower in chlorides such as magnesium acetate and
corn salt (a mix of salt brine and a corn by-product); equipping trucks with pre-wetting equipment which can reduce the amount of misapplied product by
up to 30% over trucks that are equipped with only ground-oriented spreaders; recommending that a MnDOT salt storage area in Maple Grove in the northwest part of the watershed
be redesigned to include truck loading in a covered area;
making information in MnDOT’s Road Weather Information System (RWIS) available to other county and city officials in the watershed to allow them to more accurately determine application rates for deicing and anti-icing products, leading to a possible reduction in the amount of chloride used on all roads in the watershed, not just those maintained by MnDOT (see: http://rwis.dot.state.mn.us)
The commercial and private application of deicing chemicals is currently not regulated. The MPCA offers a voluntary Commercial Applicator Certification Program that provides education and training on the proper methods and rates for applying deicing chemicals. As of September 2006, 34 individuals had received certification. The program is described in more detail at: http://www.pca.state.mn.us/publications/parkinglotmanual-june06.pdf

51
Soil Loss Reduction in Minnesota Among the many conservation projects in Minnesota, easements prevent thousands of tons of soil, sediment and other pollutants from leaving fields and becoming airborne of flowing into rivers and lakes. Soil erosion means not only the valuable loss of topsoil, decrease in productivity of the land and higher fertilizer requirements, but also damage to surface water in the form of silt that chokes off rivers and lakes and possible ground water contamination from over applying fertilizer. The Minnesota Board of Water and Soil Resources (BWSR) tracks soil loss and BMPs to reduce pollution from soil loss and sedimentation using the Local Annual Reporting System (1997-2002) and its successor eLINK (2003-present). As of March 2006, soil loss reduction statewide was estimated statewide at 2.87 million tons per year than if no pollution reduction measures had been implemented. Most common pollution reduction BMPs include gully stabilization; sheet and rill erosion control; stream and ditch stabilization; filter strips; and wind erosion control. Even at the minor watershed level, some areas of west-central and southwest Minnesota showed soil loss reductions of as much as 25,000 tons/year.
Not only can sediment cause silting problems, but it can also carry chemicals attached to it into the water. One of these chemicals is phosphorus, a common element of fertilizer, which can create problems in surface water such as algae blooms. The proliferation of algae and other aquatic vegetation takes oxygen from the water, suffocating fish, discouraging wildlife and making lakes and waterways unsuitable for recreational use.

52
BWSR estimates that at least four counties in southern Minnesota saved up to 45,000 pounds of phosphorus per year from reaching surface water from the implementation of conservation practices during the period 1997-2001 (Atlas of Minnesota, 2nd Edition, University of Minnesota Extension Service, 2003). More recent data from BWSR using both LARS and eLINK (March 2006) shows pollution reduction benefits statewide from sediment reduction of 1.31 million tons/year and from phosphorus reduction of 2.14 million pounds/year. For further information on soil loss in Minnesota and its prevention, see this fact sheet: http://www.pca.state.mn.us/programs/indicators/iom-0902.html

53
Emerging Issues of Concern in Minnesota’s Environment There are a number of newly recognized environmental contaminants and other issues that are not fully understood but which have the potential to cause known or suspected adverse ecological and/or human health effects. “Emerging Issues” are new areas of environmental concern that are not currently incorporated into regular environmental protection activities in Minnesota. These stressors enter the environment through consumer products, solid waste disposal, agricultural and urban runoff, residential and industrial wastewater, and long-range atmospheric transport. In some cases, release of these substances to the environment occurred long ago, but may not have been recognized because methods to detect them at low concentrations did not exist. In other cases, synthesis of new chemicals or changes in use and disposal of existing chemicals can create new sources of contamination. At the same time, observations of troubling effects, including feminization of male fish or malformed frogs, raise questions on causes. Public health experts often have an incomplete understanding of the toxicological effects of these contaminants, including the significance of long-term exposure. Even with incomplete knowledge, science and policy must continue to ensure protection of human health and the environment through the process of identifying and preventing problems. Here are a few examples of emerging issues currently being investigated in Minnesota:
Perfluorinated chemicals (PFCs) Pharmaceuticals, household and industrial-use products
Endocrine disrupting compounds
Polybrominated diphenyl ethers (PDBEs)
Perfluorinated chemicals (PFCs) Perfluorinated chemicals (PFOS, PFOA, PFBA and others) were manufactured for many years by 3M and other companies. They are produced synthetically or may appear through degradation of other fluorochemical products. PFOS, used in emulsifier and surfactant applications, is found in fabric, carpet and paper coatings, floor polish, shampoos, fire fighting foam and certain insecticides. PFOA is used as a processing aid to produce fluoropolymers and is found in many personal care products and textiles. 3M phased out its manufacture of PFOS and PFOA in 2002. PFOS and PFOA are widespread and persistent in the environment, but little is known about their toxicity to humans. They have been found in animals all over the globe, and MPCA studies have detected PFOS at elevated levels in fish taken from the Mississippi River near the 3M Cottage Grove plant and downstream. MPCA and Minnesota Department of Health (MDH) testing has found PFOS and PFOA in some municipal and private drinking water wells in Oakdale and Lake Elmo. An apparently less-toxic but more mobile form, PFBA, also has been found in wells in Oakdale, Lake Elmo, Cottage Grove, Newport, St. Paul Park, Hastings, South St. Paul and Woodbury. PFOS and PFOA have not been detected in those areas.

54
MPCA and MDH continue to examine potential sources of exposure to PFCs. At this writing the MPCA and MDH are awaiting additional analyses of fish, landfill leachates and other possible sources of PFCs: wastewater and air emissions. A complete description of all MPCA and MDH activities related to PFCs is available on the following web pages: http://www.pca.state.mn.us/publications/gp5-18.pdf
http://www.pca.state.mn.us/hot/pfc.html;
http://www.health.state.mn.us/divs/eh/hazardous/topics/pfcshealth.html
Pharmaceuticals, Household and Industrial-use Products
In 2002, the United States Geological Survey (USGS) published results of the first nationwide survey of pharmaceuticals, hormones, and household and industrial products in surface waters. The compounds analyzed in the study encompassed a wide variety of compounds including: antibiotics, over-the-counter pharmaceuticals, hormones, detergents, disinfectants, plasticizers, fire retardants, insecticides and musks used in the production of fragrances. The USGS included certain compounds in their survey because they have biological activity, such as pharmaceuticals or chemicals that are suspected endocrine disruptors. These products are widely used in consumer and industrial products and continuously released into the environment through human activities. Sources can include wastewater discharge, manure from confined animal feedlots, landfill leachate, and urban runoff. The MPCA has been collaborating with Kathy Lee and Larry Barber (of the local and national U.S. Geological Survey offices) since 2000 and with Heiko Schoenfuss (St. Cloud State University) since 2004 to further monitor and define health effects associated with this suite of compounds in Minnesota's water resources. The first state reconnaissance study by USGS, MPCA and the MDH showed that industrial and household-use compounds and pharmaceuticals are present in streams, ground water, wastewater and landfill effluents. Steroids, nonprescription drugs and insect repellent were the chemical groups most frequently detected, with detergent degradates and plasticizers measured in the highest concentrations. The complete report may be found at http://water.usgs.gov/pubs/sir/2004/5138/. The MPCA has also worked since 2002 with several partner organizations and the Minnesota Hospital Association to improve environmental compliance and pollution prevention throughout healthcare facilities in Minnesota. Compliance evaluations of healthcare facilities had revealed widespread mismanagement of complex hazardous wastes such as pharmaceuticals, laboratory solvents and reagents, and mercury-containing wastes. As a result of this collaboration hospitals have been changing their waste management methods. Fiscal year 2006 resulted in 28 metro area hospitals properly managing 75 tons of pharmaceuticals and 30 tons of laboratory wastes as hazardous waste. Twelve hazardous waste compliance training events have been presented throughout the state in FY 2006 with over 500 healthcare professionals in attendance. Partner organizations participating in this effort include the Solid Waste Management Coordinating Board, Minnesota Technical Assistance Program, and Metropolitan Council Environmental Services. More information on these efforts can be found at http://www.pca.state.mn.us/industry/healthcare.html
Endocrine-disrupting Compounds (EDCs) Endocrine disruption is a broad term linked to both natural and synthetic compounds that can mimic or alter the endocrine or hormone systems. Originally, studies of endocrine-disrupting chemicals (EDCs) focused on those affecting the estrogenic, androgenic (testosterone), or thyroid systems of humans and wildlife; however, the scope of interest has expanded to include other signaling chemicals in humans and

55
wildlife, such as neurochemicals, to other chemical signals in lower organisms and plants. Because endocrine disruption encompasses numerous sources, exposures, and organisms, it has been critical to approach endocrine disruption in the context of environmental protection through a multidisciplinary and collaborative approach; to this end, MPCA has been supporting Minnesota-based EDC studies and researchers that build on national studies and perspectives. Building on the results of the 2002 USGS pharmaceuticals, household and industrial products survey, Lee, Barber, and Schoenfuss continue to investigate the significance, sources, and occurrence of compounds with endocrine-disrupting activity in Minnesota’s waste streams and waters. This multidisciplinary team of experts has designed a phased approach from laboratory to field studies to answer the difficult questions raised by a diverse suite of compounds that have atypical hormonal activity in aquatic organisms. Lee, Barber, and Schoenfuss began their examination of EDCs with alkylphenols. Alkylphenols, including nonylphenol, are a class of chemicals widely used in household and industrial surfactants (cleaning detergents, airplane deicers, surfactants used with pesticides, etc.). Their wide use has resulted in high concentrations detected in wastewater effluents. Nonylphenol is one of the most studied chemicals for EDC activity and in laboratory studies demonstrates estrogenic activity in numerous species and reproductive effects in fish. MPCA currently has three ongoing projects with Lee, Barber, and Schoenfuss. The results from these studies will include detailed monitoring results from four wastewater treatment plants and receiving water and a longitudinal study on the Mississippi River. MPCA will utilize the results for developing future water quality standards and helping determine management strategies. The Department of Natural Resources is also contributing technical expertise to the projects and receives results. Polybrominated diphenyl ethers (PDBEs) PBDEs (polybrominated diphenyl ethers) are commonly used flame retardants found in plastics, textiles, electrical appliances and equipment, furniture, building materials and automobiles. Toxicity concerns include developmental neurotoxicity, thyroid disruption, altered behavior and learning, and dioxin formation when burned. PBDEs have been detected globally in both developed and remote environments. Monitoring studies have measured PBDEs in sediment, air, wildlife, fish, human blood and human milk. A human-milk monitoring program in Sweden showed that PBDE concentrations in breast milk nearly doubled every five years until Sweden banned PBDEs in 1997, when concentrations in breast milk dropped off rapidly. In contrast, PBDE concentrations in breast milk of North Americans, where PBDEs are still widely used, has been shown to be 10 -100 times higher than in Europe, where manufacture and usage has been phased out.
Dietary intake is assumed the primary route of PBDEs exposure in humans, although recent information suggests that inhalation and ingestion of indoor dust also may be an important exposure pathway. The MPCA has been involved in investigating the impacts of PBDE contamination in Minnesota for several years. A 2001 MPCA study found that PBDEs were present in different environmental settings, including fish and sediments from major river basins in Minnesota. This study also detected PBDEs in waste management processes, including landfill leachate, and wastewater treatment plant sludge. The European Union and several U.S. states have enacted laws banning or phasing out the manufacture and use of PBDEs over the next three years, and five other states are considering similar measures.
56
A scientific background paper Flame Retardants: Polybrominated Diphenyl Ethers (PBDEs) was published by the MPCA in February 2005, and is available at the following link to 2005 Legislative Reports: http://www.pca.state.mn.us/hot/legislature/reports/2005/index.html In 2003, the MPCA conducted a study of PBDEs in Lake Superior sediment, water and fish tissue. Historical concentrations of PBDEs in the sediments were generally found to coincide with their commercial production and use. PBDEs were first detected in sediments dating to the late 1950s to the early 1960s with increased total concentrations and increased rates of deposition of PBDEs to the sediments continuing through present time. Although several forms of PBDE were detected in sediment samples, deca-BDE was found at concentrations several orders of magnitude greater than other congeners. The difference in abundance of the various congeners in sediments may be due to the banned use and manufacture in Europe and voluntarily withdrawal from the U.S. market of penta-BDE and octa-BDE. In addition, deca-BDE constitutes 80% of total PBDE production worldwide (Birnbaum and Staskal, 2004). However, it should also be noted that deca-BDE may be de-brominated in the presence of UV light thereby providing a continuing source of the lower brominated BDEs even though their manufacture and use has been discontinued. Tetra-BDE and penta-BDE were the predominant PBDE congeners detected in the fillet tissue of three different fish species collected from the western arm of Lake Superior. Lake trout fillet tissue contained approximately 1.5 to 2.0 times higher concentrations of total PBDEs compared to lake herring collected at the same location suggesting evidence of bioaccumulation between forage and predator fish.
Emerging Issues: a broader approach
To more effectively identify and evaluate issues that are developing, the MPCA has asked five of its research scientists to monitor new environmental concerns that may be important to Minnesota. The scientists will operate as a team in the Environmental Analysis and Outcomes Division, and will redirect a small percentage (less than 10%) of their time to: monitoring emerging issues;
holding regular meetings to communicate with internal and external partners, including other state,
federal, tribal, university, nonprofit, and business entities;
identifying opportunities to collaborate on relevant research projects; and
providing technical guidance to MPCA staff and managers on emerging, multimedia contaminant and technical issues that have a potential to impact Minnesota.
There are literally thousands of substances and stressors which could be categorized as emerging issues with potential environmental consequences, and it is not possible to pursue all of them at the same time. The emerging issues staff team is therefore looking at ways to sort and screen the numerous issues in a way that identifies those most important for Minnesota. In a broad sense, this approach will consider how widespread the contaminant or issue is, the current national or state regulatory stance on the issue, a characterization of the risk associated with the contaminant or issue, and the pertinence of the topic to Minnesota’s environment. Some examples of more specific questions that would help narrow the field for decision makers could include the following:
57
Is the issue likely to affect a large geographic area, population, or ecosystem?
Is the issue pertinent to Minnesota or the upper Midwest/Great Lakes region?
o If so, does it have particular relevance to Minnesota due to the production, use, or distribution of items comprising the emerging issue?
Can the issue of concern be assessed with the information available to us?
o If not, what information is needed?
Are the physical-chemical properties of the emerging chemical or nanomaterial such that long-range transport, persistence, and/or bioaccumulation will result upon release to the environment?
Could exposure to the emerging chemical, organism, or nanomaterial negatively impact human health
or the environment?
Is the issue within the purview of the MPCA, or is it likely to be another state or federal agency’s area of responsibility?
Is the issue currently regulated, or being evaluated, under a particular program at the Agency?
o If so, are there gaps in current regulations or policies that allow the potentially important issue to “slip between the cracks?”
o Is the MPCA taking action to address these gaps?
Is the U.S. EPA or another federal agency engaged on the topic? o If so, are MPCA staff working collaboratively with them on the emerging issue?
The MPCA hopes that this approach will help Minnesota more effectively anticipate, prevent and respond to the most important current and future emerging issues, in collaboration with citizens, our colleges and universities, businesses, and other government units.
Related Documents