ABN 25 006 592 089 TOLL HOLDINGS LIMITED ANNUAL REPORT 2009 For personal use only

Welcome message from author
This document is posted to help you gain knowledge. Please leave a comment to let me know what you think about it! Share it to your friends and learn new things together.
Transcript

ABN 25 006 592 089
TOLL HOLDINGS LIMITED ANNUAL REPORT 2009ABN 25 006 592 089
TOLL HOLDINGS LIMITED ANNUAL REPORT 2009
TOLL H
OLD
ING
S LIMITED
AN
NU
AL R
EPOR
T 2009
For
per
sona
l use
onl
y

1 Chairman and Managing Director’s Review
8 Globalisation and what it means for Toll
10 Providing Customers with Global Reach
12 Board of Directors
14 Directors’ Report
21 Remuneration Report
46 Corporate Governance Statement
55 Income Statements
56 Statements of Recognised Income and Expenses
57 Balance Sheets
58 Statements of Cash Flows
59 Notes to the Financial Statements
138 Directors’ Declaration
139 Independent Audit Report
141 Shareholder Information
142 Ten Year Summary
Contents
* 2007 and 2008 comparator figures restated to reflect continuing operations post demerger of Asciano, sale of New Zealand rail and ferry operations and demerger of Virgin Blue Australia.
REVENUE* Billion dollars
EBIT* Million dollars
EBITDA* Million dollars
EBIT MARGIN* Percent
TOTAL ORDINARy DIVIDENDs Million dollars
Design by theballgroup.com.au – TOL0150 09/08 Text of this annual report printed on Envi silk (pages 1-12) and Envi 50/50 (pages 13-144) – Carbon Neutral Paper.
Toll Holdings Limited uses Greenhouse Friendly™ ENVI Carbon Neutral Paper ENVI is an Australian Government certified Greenhouse Friendly™ Product.
0
100
200
300
400
500
06 07 08 09
466
0
50
100
150
200
06 07 08 09
173
0
1
2
3
4
5
6
7
8
9
10
06 07 08 09
9.0
0
100
200
300
400
500
600
700
06 07 08 09
625
0
1
2
3
4
5
6
7
06 07 08 09
6.49
For
per
sona
l use
onl
y

Dear fellow investor, In this time of uncertainty, you need to know that your company is well positioned to continue delivering strong results. We’ve been doing it for 23 years now and achieved it again in 2009. Even more importantly, this is a historic moment of great change and presents tremendous opportunities for Toll; ahead we see organic growth opportunities and significant expansion activity as we increasingly drive the globalisation of Toll’s unique business model.
Our confidence is grounded in simple but compelling market realities: global trade never stops — it is arguably the most powerful economic engine there is, in both good times and in bad; we have one of our industry’s most effective, time-tested business models, a unique integrated model unusually combining the best of 3PL and 4PL capabilities, diversified across a wide range of market sectors and geographies; our customers are demanding more sophisticated cross-border and globally-based supply chain solutions; our global scale is growing in an industry sector where scale really counts; and finally, there is the focused execution of more than 30,000 dedicated Toll people around the world.
1TOLL | ANNUAL REPORT 2009
Chairman and Managing Director’s Review
For
per
sona
l use
onl
y

2
If you take just one thing from this year’s annual report it should be this: we entered this
turbulent period strong, and as long as economic conditions materially stay the same, we
expect to exit it stronger. Before we discuss that in more detail however, let’s briefly review
our performance in 2009.
Toll 2009: solid, powerful, dependable cash flow
In 2008-09 Toll earned a profit before non-recurring items and discontinued operations
of $298 million, or 48 cents per share.
Revenues increased 16 percent to $6.5 billion; EBITDA* grew from $569 million to
$625 million, a rise of 10 percent; EBIT* grew from $429 million to $466 million, an increase
of 9 percent, and cash flows from operating activities were again strong, generating
$716 million after interest and tax.
Our balance sheet is in excellent shape, we have high levels of cash and significant
committed undrawn facilities; total assets exceed $5 billion, net debt is a very manageable
$361 million and total equity is $2.6 billion. We have a gearing ratio of only 12.2 percent;
interest cover is very strong at around 21 times, and during the last 12 months we have
successfully refinanced a number of debt facilities, extending maturity dates for $350 million
to late 2011 and further.
This first-rate performance is all the more remarkable because our talented team of
Toll people achieved it during the sharpest, most volatile, painful economic downturn
experienced in more than a quarter of a century. It’s a tribute to the team’s prudent and
disciplined management of our variable costs — fuel, labour, fleet and property — and to
the diversity of our revenue sources, industry sectors and geographies in which we compete.
Add it all up, and it’s clear why we maintain growth margins above industry averages and
weather economic cycles better than most.
We believe the true test of a company — its vision, business model, culture and people — is
not apparent when times are good. It’s when times are not so good. As we have said before
in previous annual reports, achieving such results over one, two or even five years as many
great companies have done, is not really that unique. What’s gratifying here is to achieve
consistent underlying performance over long periods through different economic cycles.
It’s precisely this achievement that is one of Toll’s great strengths.
We’ve stayed faithful to our vision of being the most successful provider of ‘integrated
logistics solutions’ to the Asian region providing customers with global reach — a vision
we’ve been making steady progress towards for more than 23 years, through virtually every
economic cycle. But before we discuss the continuing globalisation of Toll’s business model,
and why we’re excited about the future, let’s review our 2009 divisional report card.
* Pre acquisition accounting amortisation charges and non-recurring items.
2
Chairman and Managing Director’s Review
For
per
sona
l use
onl
y

Australia and New Zealand
Trading results were noticeably stronger than anticipated in the first 6 months and
underpinned the group’s annual result contributing about 80 percent overall. Revenue was
up 5 percent to $4.8 billion. EBIT grew 5 percent from $354 million to $373 million and EBIT
margins were maintained at a steady and consistent 7.6 percent, highlighting an elevated
focus on operating efficiencies and variable cost control.
Organic business again played an important role, growing a healthy and respectable
1.3 percent, an excellent result in these conditions. New contract wins from Coca-Cola,
Bluescope, Westpac, Xstrata and Chevron will add growth and improve performance in the
year ahead. And on the acquisition front, we successfully completed the acquisitions of
Extra Transport and several smaller companies throughout this year.
Highlights for the year included strong revenue growth across almost all of our Australian
businesses: standout performers included the time sensitive business Toll IPEC, Toll Priority,
Toll Express, NQX and QRX, although the later suffered slightly due to the effects of the
floods in North Queensland. Our joint venture with Emirates, Toll Dnata Airport Services,
continues to flourish and with the integration of the Skystar ground handling business now
complete, we are seeing additional revenue flows.
The best performing sectors were food and beverage within Toll Contract Logistics,
substantially increasing volumes and returns. New business was also won by our specialist
warehousing business in2store, as customers increasingly look to outsource more of their
supply chains to reduce costs and increase efficiencies. Automotive was flatter domestically
as this sector’s sales declined but this was more than offset by growing import-export activity
and indeed international activity in China and India bodes well for this business. Toll Tenix was
restructured by way of dismantling the joint venture with Tenix allowing us to focus solely
on distribution services for the Australian Defence Forces and PDL Toll, our specialist defence
logistics operations won business with the United Nations.
The story in New Zealand, however, is a bit more sombre: the economy remains flat, hit
particularly hard by the global economic downturn and although we’re vigilantly focused
on tight control of variable costs and inefficiencies in our work practices, conditions remain
tough for our New Zealand business.
Before we close our commentary on Australia and New Zealand we want to reiterate a couple
of important points made last year concerning these core markets: first, the increasingly
important levels of diversification of our expanding customer base and the spread of industry
sectors in which we operate. Consider our top 20 customers represent less than one-third of
the Group’s Australian and New Zealand total revenue and we compete in a number of key
dynamic market sectors, the majority of which are demonstrating significant resilience in
these more troubled economic conditions. For example, around 80 percent of the Australian
3TOLL | ANNUAL REPORT 2009
For
per
sona
l use
onl
y

retail and Fast Moving Consumer Goods (FMCG) business is non-discretionary and the spend
remains strong and buoyant. The story is pretty much the same for defence and government
spending, resilient and reasonably insulated from the vagaries of the market, and as we write
this, mining and resources continue to power ahead.
Automotive, steel and the manufacturing sectors on the other hand, are more susceptible
to market fluctuations and have indeed slowed. But where we might lose business locally in
these sectors, we’re more often than not picking up internationally as production increasingly
moves to Asia. And in more ways than one: with our significant and ever expanding presence
in the Asian region we are capturing new revenues from this growing two-way trade, as well
as leveraging experience from one geographic area to open up opportunities in another.
Now marry that with one of our other great competitive strengths, our diverse and integrated
operational profile. Customers have greater choice and can trade-off transit time for price,
shifting from road to rail, air express to road express or rail to sea. They experience superior
flexibility and diversity in their supply chains end-to-end while Toll has an increased ability to
capture cross-selling opportunities, driving greater sector revenues and improved EBIT margins
through the Group. Think of these as Toll’s ‘integrated revenues’, and year-on-year we
continue to experience significant increases in this kind of earnings generation. Where many
of our competitors are more point-to-point, Toll’s businesses are intrinsically integrated and
increasingly driving greater revenue streams between Toll businesses as a result. We like this;
it’s a highly sustainable model in both good times and bad.
With anticipated new contract wins, strong continuing organic business and good strategic
acquisitions firmly in our sights, our outlook in Australia and New Zealand for the coming
year is very positive. That’s why we continue to invest strongly in fleet, infrastructure and
technology to drive the kind of value our customers seek.
Toll Asia
The year began with strong momentum but softened slightly in the second half of the year.
A very high level of major contracts was renewed and revenue increased 19.7 percent to
$724 million for the full year while EBIT grew 20.6 percent from $63 to $76 million.
Encouragingly, margins have held at their previous high level, a sure sign that our cost
controls continue to be disciplined and effective.
Toll Asia’s sector performance report card is a bit of a mixed bag: while contract logistics
in Thailand, Malaysia, Vietnam and the Philippines decreased in the second half of the year,
this was more than offset by strong revenue from our North Asian operations in China, Korea
and Taiwan. Our offshore supply and marine logistics operations and our government defence
businesses based out of Singapore remain vibrant and robust.
Noteworthy developments for the year included the completion of the integration of
Sembawang Kimtrans, the start of the Loyang Offshore Supply Base redevelopment work,
the opening of new logistics and distribution centres in China and Vietnam and the upgrading
4
Chairman and Managing Director’s Review
For
per
sona
l use
onl
y

of facilities in India. And to meet growing demand, new infrastructure and operating hubs
are planned for India, Malaysia and China in the coming year.
We also lifted our investment in Cargo Services to 25 percent. With double digit growth in
revenues and earnings, retention of Woolworths consolidation contracts from North Asia into
Australia, selection as Myer’s Supplier of the Year and significant increases in Asian-Europe
business this is an exciting business and one that adds valuable capabilities to Toll’s Asian
based global forwarding expertise. We have also recently acquired a 40 percent stake in the
Indian firm, BIC Logistics, three smaller air express logistics firms in Asia and Perkins Shipping
in Darwin, which provides shipping and freight services between Australia, Singapore and
East Timor and adds revenues of more than $100 million to the Group. We have also signed
an agreement with the Royal Government of Cambodia to operate their railways under a
thirty year concession.
In the current tough environment within Asia, new expansion opportunities through
acquisition, outsourcing and important new contract prospects appear plentiful for the Group,
especially in China, Vietnam, Malaysia, Thailand and Japan.
Toll Global Forwarding
New customer wins, strong organic business growth and market share gains are the highlights
in the first half of the year. Strong revenue of $907 million, an increase of 153.4 percent from
$358 million, year-on-year and EBIT for the same period grew 63.6 percent from $11 million
to $18 million.
Following the successful integration of BALtrans and Gluck last year, Global Forwarding is
now a single dynamic and cohesive force with 65 offices in 26 countries and over 2,500 people
providing a very solid platform for future growth. As we have said many times, our expansion
into Asia and other locations globally is an ‘invest and build’ strategy, and although it’s still
early days for this business, we’re already strongly leveraging core air and ocean freight
operations to design, develop and build real end-to-end supply chain capability for our
customers, something we believe few other Asian based global forwarders of scale can
deliver at present.
Of course, technology, and in particular web-based technology, is one of our differentiating
centrepieces and the lynchpin vital to any development and successful deployment of
customer end-to-end global supply chain solutions. Building on many years of significant and
hard won technological experience gleaned from our Australian and New Zealand operations,
we rolled out phase 1 of our global visibility supply chain management platform in January of
this year, to capture the most valuable opportunities ahead. Expect good things to come from
this, like market share growth and significantly improved information flow.
Whilst Asian based opportunities of scale which capture significant global trade flows are
hard to find, we do see opportunities to add scale in destination markets where quite often
decisions re freight forwarding are made.
5TOLL | ANNUAL REPORT 2009
For
per
sona
l use
onl
y

Looking forward: the meaning of 2010
We have entered the new financial year with good momentum but predicting a full year’s
trading is never easy. This year a number of companies aren’t sounding very optimistic.
At Toll Group however, we have a different view. Here’s why:
1. The Australian economy seems to be coping better with the downturn than most other
countries. With close to 80 per cent of earnings generated in Australia we are seeing
relatively stronger results in this market.
2. One of Toll’s great strengths is the breadth of our service offering. The current environment
is opening up opportunities for significant growth from acquisitions that will improve our
business in the coming year.
3. Global trade never stops; it is the most powerful economic engine on earth. Over the last
30 years it has consistently outpaced world GDP and although, as we write this letter to you,
global trade has receded, it is but a temporary decline and conditions will improve. We say
so because we’re cautiously seeing early signs of some rebound in key sectors and in major
geographies. This is an important point to consider: as Toll’s business increasingly becomes
more global, we’re constantly increasing the number of countries in which we operate
and, of course, the diversity of our revenue streams, all of which helps us weather varying
economic cycles.
4. We’re also competing in one of the world’s largest, most exciting dynamic and fragmented
industries, the $1 trillion plus industry of global logistics. And in these troubled times, it’s
ripe for consolidation and market share gains. Consider the ten largest players in freight
forwarding globally, only control 40 percent of the estimated USD170 billion market.
Our opportunities for market share gains in all segments of this massive industry —
domestic freight, global forwarding, contract logistics, project and resource logistics, to name
just a few — are significant. We also have another great advantage on our side: our history
of successfully integrating over 70 acquisitions to drive scale and service offerings while
maximising value — it’s something we’re very good at, and with our strong balance sheet and
debt profile, expect us to be active in the mergers and acquisition space in the coming year.
5. Customers are increasingly demanding cross border supply chain solutions — they are
entering new countries via joint ventures and manufacturing alliances. And where they
go, we go too, supporting their growth strategies. It has never been easier to trade
internationally. Fifteen years ago cross-border trade was often a challenge but today it is
increasingly common. The globalisation of trade is about the removal of trade barriers,
the establishment of more free trade agreements and the privatisation and improvement
of transport infrastructure. The reform of commercial and legal frameworks across borders,
and the booming demand for logistics as a result is at the heart of the Toll strategy and,
something we talk a little more about on pages 8-11.
6
Chairman and Managing Director’s Review
For
per
sona
l use
onl
y

6. Toll’s unique integrated business model offers technological integration in supply chain
solutions like no other. We operate in different geographies, different industry sectors with
many different customer types. The dynamics vary considerably — from country to country,
industry to industry and customer to customer — and in this kind of economic climate that’s
a big advantage.
We’re a strong cash flow business with a taste and consummate skill for driving strong organic
growth and acquisitions. And we’re agile, owning the right kinds of assets and a mix of asset
intensity to strengthen our position in the higher-value spaces of supply chain management,
increasing our ability to plan, synchronise and monitor operations to optimise outcomes for
our customers. On page 8, you can learn more about how we are fine-tuning our model to
meet the demands of a growing Asia Pacific focused logistics business with global reach.
In a time of uncertainty, we remain certain. In a time when confidence is being tested,
we remain confident. Confident in our vision; confident in our business model; confident in
our strategic direction and confident in our talented Toll team members whose knowledge,
passion and expertise make it happen.
Add it all up, and it makes Toll a very exciting place to be right now. It’s exhilarating to be
part of an energised company that is ready to move ahead while many others in our industry
are not.
To our customers, thank you for your business, to our staff, thank you for your passion and
drive, and to our fellow investors, thank you for your ongoing support. We look forward
to telling you all about our exciting progress this time next year.
Ray Horsburgh AM Chairman
Paul Little Managing Director
7TOLL | ANNUAL REPORT 2009
For
per
sona
l use
onl
y

GLOBALISATION AND WHAT IT MEANS FOR TOLL
Globalisation describes the process whereby individuals, groups, companies and countries become increasingly interconnected and interdependent. In the last 30 years, global trade has been one of the most powerful forces linking individuals, groups, companies and countries.
While increasingly relaxed trade tariffs have made it possible, huge transnational companies have made it happen. Through their drive and investment in production and marketing, transnationals bring the world economies and people
closer together. Of course, advances in technologies and telecommunications — in particular the web — are creating an ever-denser network of connections, both electronic and production-based, between the developed and the developing worlds. All this has had major implications for the nature of international trade, where it is increasingly possible to leap frontiers, linking high-productivity technologies to lower-cost labour. As a result, global production systems and supply chains are becoming more complex, able to produce and assemble components across a wide range of locations,
Information flowMaterial flow
Supplier
Outsourcer
3rd tier supplier
2rd tier supplier OutsourcerStrategic partnerCustomer
Customer
CUSTOMERStrategic partners
Suppliers Warehousing Land transportInternational
transportation sea and air freight
EXPORT activities Ports, stevedoring and
freight forwarding
Consolidation hub and value added
processing
End-to-end management across complex supply chains
8
For
per
sona
l use
onl
y

Above, left and right: The shift of interconnectedness and interdependencies from that of a traditional linear logistics supply chain to that of a modern, complex, integrated global supply chain with thousands of links is simply staggering. Today, Toll’s global supply chains are about accurate, responsive and timely information management, and ‘one view’ visibility across multiple partners, multiple countries and multiple time zones.
spanning borders and countries worldwide. Products are increasingly being reduced to constituent components, sub-components and processes that can be manufactured or assembled anywhere in the world. And trade grows much faster in a world of global sourcing and intra-company production than in a world of trade in finished goods, because components and part-finished items have to cross borders several times before final assembly.
Which is very, very good for Toll.
Information flowMaterial flow
Toll manages orders across an extended enterprise: •Providing“availabletodeliver”information
•Updatingstatusinrealtime•Automatingdistributionsteps
Toll collaborates on planning and forecasting for: •Demandandsupply•Manufacturing•Distribution
Toll works hand-in-hand to serve and support customers: •Coordinatingcustomertouchpoints
•Providinganalytics andserviceinformation
•Aligningmarketing,sales,andservicepromises
Toll manages logistics across the extended enterprise: •Providing“available topromise”information
•Makingthebestofwarehousesandtransportation
End customers
IMPORT activities Ports, stevedoring and
customs clearance
De/consolidation hubs, cross dock and value
added processingLand transport
Primary/secondary distribution
Warehousing/local manufacturing
9TOLL | ANNUAL REPORT 2009
For
per
sona
l use
onl
y

WellingtonChristchurch
Moscow
IstanbulRome
MilanNiceZurich
MadridLisbon
MontrealToronto
BostonNew York
ChicagoSt Louis
MemphisAtlanta
Miami
Lima
Toll sites Agency site
SantiagoSao Paulo
Buenos Aires
Dallas
Los Angeles
San Francisco
Vancouver ParisBrusselsLondon
BasildonLille
Oslo Helsinki
Glasgow
RotterdamCopenhagen
Hamburg
Toulouse
DusseldorfHannover
Amsterdam
FrankfurtMunich
BeirutAnkara
JerusalemAmman
GothenburgManchester
Southampton
Stuttgart
Barcelona
Tel AvivKuwait
Yaoundé
Manama
BanguiN'Djamena
DohaDubai
Muscat
Karachi
New Delhi
Islamabad
DushanbeBaku
Dhaka
MumbaiBangalore
Chennai
Colombo
PerthAdelaide
Melbourne
Hobart
Canberra Sydney
Brisbane
Auckland
JakartaSingapore
Dili LaePort Moresby
Honiara
Kuala LumpurIpohPenang
BangkokBurmaMacau
ShenzhenGuangzhou
Chengdu
Hong Kong
XiamenFuzhou Shanghai/Ningbo
TokyoSeoul
BeijingTianjin
Dalian
Quingdao
Surabaya Darwin
ManilaHo Chi Minh City
Phnom Penh
Taipei/Taichung/Kaohsiung/Hsinchu
Durban
Port ElizabethCape Town
Johannesburg
Cairo
Stockholm
Who we are in 2009
Where we do business in 2009Today, Toll operates from over 700 sites in over 50 countries and continues to enjoy an increasingly broad-based geographic distribution network. Our focus is the Asian region, the fastest growing and most dynamic logistics marketplace there is.
Toll operations (major cities shown only)
Global express & domestic freight
$4.0 billion
Global resources & projects
$0.5 billion
Global contract logistics$1.3 billion
Global forwarding
$1.1 billion
Toll’s new operational structure designed for the next stage of Toll’s business model. You will notice that we shifted from the geographical-based divisional structure that we have
successfully used for many years now to a more solutions-based services model, easier to understand, easier to market, the next step in the globalisation of Toll’s business model.
10
PROVIDING CUSTOMERS WITH GLOBAL REACHF
or p
erso
nal u
se o
nly

Our revenue mix in 2009
Defence and Government
Mining and Resources
Automotive
Retail and FMCG
Other
Industrial
Revenue contribution by
industry45%
8%
20%
5%
6%
15%
Committed to optimising outcomes
Toll’s integrated logistics offering is developed from an array of complex service offerings, utilising all modes of transport, a specialised range of integrated logistics services, an extensive range of freight profiles, and covers all major territories and regions.
Strong market alignment between Australia, New Zealand and Asia
INDUSTRY AUSTRALIA NZ ASIA
Retail and FMCG (45%) Customers include: Coco-Cola Amatil, Foster’s Group, Colgate-Palmolive, Unilever, Wesfarmers, Woolworths, P&G, Johnson & Johnson, Nestle, Nike
Mining and Resources (20%) Customers include: Rio Tinto, Xstrata, Zinifex, Arutmin, Glencore International, Banpu
Industrial (15%) Customers include: BlueScope Steel, OneSteel, Orica, ASSA ABLOY, Linde Gas, Posco
Defence and Government (8%) Customers include: Australian Defence Force, Australian Taxation Office, NT Government, QLD Purchasing, Government Ministries of Singapore, Royal Government of Cambodia
Other (6%) Customers include: Amcor, Fletcher Building Group, Qenos, Viridian Glass, Bayer
Automotive (5%) Customers include: Bridgestone, Ford Motor Co, General Motors, Holden, Mercedes Benz, Toyota Motor Co, Yamaha Motors, SKF, TATA, Volkswagen, BMW
A major strength of the business, particularly in relation to challenging economic environments is the level of diversification across industry segments and also across the customer base. The fact that the company is not heavily reliant on specific discretionary consumer spending is positive in both difficult and strong economic periods. And when you combine the profile of our customers with our variable cost structure relating to sub-contractor fleet, Toll’s business model is sustainable no matter what the economic conditions.
*Excludes Virgin Blue
Managing a complex array of logistics services MODE
• Road • Rail• Sea• Air
SERVICE
• Network transport • Contract logistics• 4PL• Freight-Forwarding
FREIGHT PROFILE
• Satchels • Packages• Pallets• FTLs• Bulk
TERRITORY
• Australia • New Zealand• Japan• China• India• Singapore• Other
11TOLL | ANNUAL REPORT 2009
For
per
sona
l use
onl
y

12
R Horsburgh AMBChem Eng, HON D UNIV, FAICD FIEAust
Independent Non Executive Director
Extensive management experience in the glass and steel industries, mergers and acquisitions, managing businesses overseas especially in the SE Asian countries and building businesses in mainland China.
Director since 2004. Appointed Chairman from 14 September 2007.
Former Managing Director of Smorgon Steel Group Limited from 1998 to June 2007.
Non Executive Director of CSR Limited, National Can Industries Limited and Traffic Technologies Limited since 2006. Age 66.
Special Responsibilities:Chairman of Board of Directors.
Chairman of the Nomination and Corporate Governance Committee.
Member of the Remuneration and Succession Planning Committee and the Audit and Financial Risk Committee.
P A LittleFAICD, FCIT
Managing Director
Extensive experience and management in the logistics industry. Managing
Director since 1986. Age 61.
Special Responsibilities:Member of the Nomination and Corporate Governance Committee.
H BoonBLaws(Hons), BCom(Melb)
Independent Non Executive Director
Extensive experience in global marketing and sales, large scale manufacturing operations, and product development.
Director since 1 November 2006.
Currently Chairman of Tatts Group Limited and Gale Pacific Limited and Non Executive Director of Hastie Group Limited since 2005, PaperlinX Limited since May 2008. To step down as Chairman and retire as director of Gale Pacific Limited effective 17 November 2009. Former Non Executive Director of Funtastic Limited from 2004 to 2007. Former Chief Executive Officer and Managing Director of Ansell Limited. Age 61.
Special Responsibilities:Chairman of the Remuneration and Succession Planning Committee from March 2008.
Member of the Nomination and Corporate Governance Committee.
M SmithFAMI, CPM, FAIM, MAICD
Independent Non Executive Director
Extensive experience in senior roles including marketing with Unilever and Uncle Toby’s. Director since 1 July 2007. Non Executive Director of GUD Holdings Ltd since May 2009. Managing Director of Cadbury Schweppes Australia and New Zealand from 2003 to 2007. Former Managing Director of Confectionery Aust&NZ and prior to that, three years as Director of Marketing for Cadbury Trebor Basset in the UK and senior positions in Cadbury Schweppes North American and Australian operations. Age 54.
Special Responsibilities:Chairman of the Audit and Financial Risk Committee from March 2008.
Member of the Nomination and Corporate Governance Committee.
B CusackBE(Hons),M.Eng.Sci., FTSE, FAusIMM, FAIM, MAICD,
Independent Non Executive Director
Extensive experience in management and resource industries. Director since 1 October 2007.
He joined Rio Tinto Australia (formerly CRA) in 1966 and retired as Managing Director of Rio Tinto Australia in 2001. Non Executive Director of MacMahon Holdings Limited since 2002, Chairman of Oz Minerals Limited and was President of the Minerals Council of Australia from 2001 to 2003 (member since 1996). Age 67.
Special Responsibilities:Member of the Remuneration and Succession Planning and the Nomination and Corporate Governance Committees.
F FordM.Tax (Melb), B.Bus(Acc with Distinction) (RMIT), FCA
Independent Non Executive Director
Extensive experience in financial and risk management. Director since 14 January 2008. Former Managing Director of Deloitte Victoria as a professional advisor for 35 years. A past member of the Deloitte Global Board, Deloitte Global Governance and Deloitte National Management Committees.
Director of Citigroup Pty Limited. Age 63.
Special Responsibilities:Member of the Audit and Financial Risk and the Nomination and Corporate Governance Committees.
Bernard B McInerneyB.Bus(Acc), Grad.Dip.Acc, AICS, CPA, AICD
Company Secretary
Held the position of Company Secretary since April 1994. Extensive experience in mergers and acquisitions and finance and administration within the transport and logistics industry over the past 25 years. Age 51.
N Chatfield, Executive Director and Chief Financial Officer, resigned as Director on 18 September 2008 and retired on 31 March 2009.
* Refer to Meetings of Directors as detailed on page 20.
BOARD OF DIRECTORSF
or p
erso
nal u
se o
nly

FINANCIAL STATEMENTS AND DIRECTORS’ REPORTFor the year ended 30 June 2009
For
per
sona
l use
onl
y

14
DIRECTORS’ REPORTfor the year ended 30 June 2009
The directors present their report together with the financial report of Toll Holdings Limited (“the Company”) and the consolidated financial report of the consolidated entity, being the Company and its controlled entities and its interest in associates and joint ventures (“the Group”), for the year ended 30 June 2009 and the auditors’ report thereon.
DirectorsThe following persons held office as directors of the Company during or since the end of the financial year:
Ray Horsburgh AM (Chairman) Director since 2004
Paul Little (Managing Director) Director since 1986
Neil Chatfield Director since 1998 (resigned as director and KMP 18 Sept 2008, retired 31 Mar 2009)
Harry Boon Director since 2006
Mark Smith Director since 2007
Barry Cusack Director since 2007
Frank Ford Director since 2008
Principal ActivitiesThe principal activities of the Group during the year consisted of:
• Lessthanfullloadexpressandeconomyfreightforwardingservice using all modes of transport;
• Fullloadroadandrailfreightforwardingservice;• Temperaturecontrolledtransportserviceforfullloadandless
than full load clients;• Warehousinganddistributionofbulkdryandrefrigeratedgoods;• Wharfcartage,containerhandlingandstorage;• Contractdistributionservices;• Timesensitiveparcelfreightdistributionservices;• Specialisedinternationalforwardingservices;• Removalsandrelocationbrokerageservice;• Vehicletransportanddistribution;• Bulkliquidtransportation;• Operationofspecialistdefencelogisticsprojects;and• Shippinglinehauloperations.
Consolidated ResultThe consolidated profit from ordinary activities for the year attributable to the members of the Company was:
2009 $M
2008 $M
Netprofit/(loss)attributabletoequityholders of the Company 270.3 (694.7)
Earnings per share
Basic earnings per share 39.95¢ (107.41¢)
Diluted earnings per share 39.92¢ (107.41¢)
Continuing operations
Basic earnings per share 41.15¢ 38.72¢
Diluted earnings per share 41.13¢ 38.70¢
Review of OperationsToll Holdings, one of the Asian region’s leading transport and logistics providers, today reported NPAT before non-recurring items and discontinued operations of $298.1 million, an increase of $37.3 million compared to $260.8 million last year.
Revenue for the year was $6.5 billion, an increase of 16% over the previous period of $5.6 billion.
EBITpreacquisitionaccountingamortisationchargesandnon-recurring items was $466.0 million compared to $428.8 million in the previous year, an increase of 9%.
Thisisanexcellentresultgiventhedifficulttradingconditions,underpinned by a solid performance in the Australian business.
EBIT margins in the Australia/New Zealand business were maintained at 7.6% and Toll Asia margins remained at 10.5% as a result of excellentcostcontrol.TheGlobalForwardingbusinessrecordedalower margin of 2.2% compared to 2.8% in the previous year due to significantly lower volumes.
The company achieved organic growth despite the economic downturn. The underlying revenue growth in Australia was 1.3% and 1.6% in Toll Asia. The lower organic growth rate in Australia reflected increased competition and a general slowdown in economic activity. Acquisitionsduringtheperiodimprovedoverallrevenuegrowth.
During the year, Toll disposed of its investment in Brambles Limited andVirginBlue.
The company generated $463 million in operating cashflow after capitalexpenditure,reflectingtheunderlyingstrengthofthecorebusiness and the continued focus on cash management.
Divisional PerformanceWhilstdivisionalresultsarereportedforTollAustraliaandNewZealand, Toll Global Forwarding and Toll Asia, a new reporting structure commenced from July 2009. All references to divisional EBIT arepre-amortisationchargesarisingfromacquisitionaccounting.
For
per
sona
l use
onl
y

15toLL | ANNUAL REPORT 2009
Toll Australia and New ZealandThe Toll Australian/New Zealand business performed ahead of last year despite a reduction in volumes in the second half of the year. This wasanexcellentresultgiventhetighteningineconomicconditionsand is a reflection of the disciplined management of variable costs and the diversity of revenue across industry segments.
Revenue for Australia and New Zealand was $4.8 billion compared to $4.6billionlastyeardespiteadeclineinexpressvolumesinthelastquarter.
EBIT for Australia and New Zealand was $373 million compared to $355 million last year. EBIT Margins were maintained at 7.6% primarily due to effective management of costs across the entire division.
HighlightsIn addition to the earnings performance there were a number of highlights for Toll Australia and New Zealand during the year. These included:
• AcquisitionofExtraTransportinJuly2008andPerkinsShipping(completed in July 09);
• Thecompletionofasmall,butstrategic,airexpressacquisitioninSingapore and Hong Kong to further enhance the Toll Global air expressofferingofTollPriority;
• SignificantcontractwinsincludingChevron,Komatsu,Shell,BlueScope,WestpacandXstrata;and
• Thecontinuedintegrationofacquisitionsmadeinthepreviousfinancial year including Golden Riverland, Couriers Australia, VictoriaExpress,SkynetandWestrans.
The time sensitive operations of Toll IPEC performed ahead of last year despite some very difficult trading conditions. The impact of volume reductions during the second half were largely offset by strong variable cost control and ongoing integration benefits arising from prioryearacquisitionssuchasCouriersAustraliaandVictoriaExpress.
Toll Priority performed ahead of last year and continued to build its air freight operation and network, both domestically and internationally. The Singapore and Hong Kong operations of Deltec Asia were acquiredintheyearwhichsignificantlyincreasesTollPriority’sreachinto Asia, allowing it to integrate closely with Toll Global Forwarding anditsagentnetworkintheregion.TheacquisitionsofSkyNetAustralia and New Zealand also proceeded to plan.
TollPriorityalsoacquiredITC,adocumentmanagementandimagingbusinesswhichwillcomplementandextenditscurrentproductoffering to both the financial and legal sector.
Toll Dnata Airport Services, the joint venture with Emirates, experienceddifficulttradingconditionsinthecontextoftheglobalaviation downturn. However, a number of contracts were won in the lastquarterofthefinancialyearwhichwillprovidesupportforfutureearnings.
Toll Contract Logistics performed well with increased volumes across the food and beverages sector and improved yields through improved cost control. Key customer contracts were renewed in the year and the business continued to invest in new technology.
Revenue increased in the Toll In2store business as a result of new business,andtheextensionofexistingcontractswithmajorcustomerssuchasUnileverandColesExpress.
TheNQXandTollExpressbusinessesperformedwelldespitedecreasingvolumesinthelastquarter.Marginsweremaintainedwith the business benefiting from cost control, technology and fleet investment.
QRXwasagainaffectedbythefloodsinNorthQueenslandinthesecond half, however margins have been maintained.
Toll Energy achieved significant growth in both revenue and earnings, andwasabletoexpandmarginsthroughoperationalefficienciesandcost management initiatives. Key contract wins included the Barrow IslandsupplybasefortheGorgonLNGproject,whichisexpectedtogenerate $180 million of revenue over three years, the renewal of ConocoPhillips supply base contract in Darwin for nine years, and the provisionofsupplybaseservicesoutofDampierforExxonMobil.
Toll Mining Services also performed better than last year and is benefiting from ongoing capital investment in more efficient equipment.
Toll Automotive was affected by the continued decline in volume from the Australian automotive manufacturers due to a reduction in newvehiclesalesinthedomesticandexportmarketsandincreasedimports. This was partly offset by record storage levels for new cars inthePrixcarbusiness.TollAutomotivecontractwinsincludedtheKomatsu national warehousing and distribution contract and the renewal of the Holden finished vehicles distribution contract for another two years. The outlook for our automotive business continues to remain flat in Australia however we are pursuing opportunities in China and India.
Trading for PDL Toll, our specialist defence logistics project operator remainedstronginthesecondhalfoftheyear.OperationsinTimorLeste and the Solomons remained key activities for this business, however major elements of the Solomon’s contract have not been renewedbeyondDecember2009andtheCommonwealthexpectthe activity levels in Timor Leste to reduce in the first calendar half of 2010. These two factors will negatively impact this project based business going forward. However, this will be partially offset by a significant contract win with the United Nations in Chad, allowing a strategic broadening of the traditional earnings base of this business.
TollTranzlinkhasexperiencedextremelydifficulttradingconditionsinthesecondsixmonthsofthefinancialyear,reflectingthegeneraleconomicclimateinNewZealand.Theseconditionsareexpectedtocontinue in the first half of the 2009/10 financial year.
Toll AsiaTotal revenue for Toll Asia for the year was $724 million compared to $605 million in the prior year.
EBIT for the year (including share of associates) was $76.1 million compared to $63.4 million last year.
For
per
sona
l use
onl
y

16
DIRECTORS’ REPORT ContInued
for the year ended 30 June 2009
Review of Operations (continued)The reported revenue and earnings benefited from the higher currency translation due to the strength of the Singapore dollar in the period.
Toll Asia’s high level of involvement with the fast moving consumer goods market cushioned the impact of the global economic crisis, particularly in the major markets of India, China, Singapore and Vietnam.Howeversignificantvolumereductionswereexperiencedinthe consumer electronics, automotive and industrial sectors.
Highlights• Theacquisitionof40%ofBICLogisticswithanoptiontomoveto
100%ownershipintwoyears.TheacquisitionprovidesTollwithits first multi-modal transport network in India to compliment Toll’sexistingwarehouseoperationsandprovidesfurtherexposuretotheautomotivesectorinIndia.
• Theagreementtopurchasetheremaining49%oftheST-Andajoint venture in China, moving ST-Anda to a wholly owned subsidiary, subject to final government approval. This will provide Toll with the opportunity to better integrate our operations within Chinaandtoofferamoreseamlesssolutiontoourexistingcustomers both within China and in a global setting.
• KeycontractwinsincludingCocaColaChina,NestleSingaporeand Indorama Thailand.
• Theexpansionofourwarehousingfootprint.Newwarehouseswere completed during the year, adding 54,000 m2 capacity in key regions such as Shanghai and Mumbai.
The Government and Defence logistics operations in Singapore performed well and traded in line with plan. Additional contract work was secured in relation to refuelling services.
TollOffshorePetroleumServices(TOPS)tradedaheadofplandueto higher volumes across the wharf and increased maintenance and supportservicesprovidedtoexistingcustomers.Workisprogressingwell on the redevelopment of the Loyang supply base.
The Marine business performed ahead of plan due to increased thermal coal volumes from Indonesia and new sand/aggregates volumes into Singapore.
Contribution from associates was higher due to an improved operationalperformancefromtheFootworkExpressbusinessinJapan.
Toll Global Forwarding (TGF)Revenue for the period was $907 million, an increase of $549 million duetothefullyeareffectoftheBaltransandGluckacquisitions.EBITfor the twelve months to June 2009 was $17.5 million, an increase of $6.6 million over the previous reporting period.
Toll Global Forwarding was affected by the significant downturn in global forwarding volumes. After a solid first half, volumes in the second half were significantly down on 2008.
Highlights• TheGluckbusinesshasbeensuccessfullyintegratedintoTGFand
the Australia business is well placed to take advantage of growth opportunities.
• Developmentofthefirstphaseofthenewtechnologyrolloutisnearing completion and deployment is underway in all regions. This new technology will lift our product and service offerings to globally competitive levels and is a key enabler to deliver end to end solutions to international supply chains.
• Buyoutofminorityinterestsinseveralregions.
The Asian business bore the brunt of the poor global conditions experiencingadownturninAsianexportstoEuropeandNorthAmerica and a reduction in intra-Asian trade.
Europe traded strongly until December, however volumes weakened in the second half, particularly in the key UK and German markets.
North America continued to perform strongly in the second half despite the difficult market condition and delivered improved market share and earnings compared to last year.
South Africa performed strongly until early 2009 but weakened in the lastquarter.
AustraliaandNewZealandexperiencedastrongfirsthalffollowedbya weaker second half. The volume slowdown has not been as high in this market compared to Asia and Europe, and the business delivered improved earnings for the full year. Contracts retained or secured includeRioTinto,CottonOn,Colorado,TheRejectShop.
Strongfocushasbeenplacedonbuildingupexperiencedmanagement resources. During the second half of the year TGF has successfully recruited outstanding industry professionals in Europe, Asia, North America and South Africa to add to the already strong base in place after the Baltrans/Gluck integration.
Toll’s investment in leading Hong Kong based freight consolidator Cargo Services Far East (CSFE) remains a key plank in the TGF strategy. TGF and CSFE are looking at opportunities in Hong Kong andChinaparticularly,tomaximisecurrentcapabilitiesandimproveefficiency.
FinanceThe company has a strong balance sheet with a net debt position of $361 million at 30 June 2009.
During the past twelve months the company has successfully refinancedmaturingfacilitiesincludingtheextensionofitsSingaporebased syndicated debt facility to November 2011, and the rollover of existingAUDmaturingfacilities.
Thecompanycurrentlyhasnetdebttonetdebtplusequitygearingof12%withinterestcoverexceeding21times.Wehavemaintainedhigh levels of cash balances and committed undrawn facilities in order to ensure that value creation growth opportunities can be pursued.
Netinterestcostsareexpectedtobehighernextyearasaresultofincreased investments and likely lower average deposit interest rates in Australia.
Operatingcashflowaftercapitalexpenditureforthetwelvemonthswas $463 million, reflecting the ongoing strength of the underlying operations and sound cashflow management. The sale of the company’sinvestmentinBramblesandVirginBluesharesalsoimproved the cash position.
For
per
sona
l use
onl
y

17toLL | ANNUAL REPORT 2009
Fully diluted earnings per share from continuing operations was 48.0 centspershare,preacquisitionamortisationchargesandinvestmentwritedowns and discontinued operations. This represents a 12.4% increase on a continuing business basis compared to 42.7 cents per share in the previous corresponding period.
Directors have declared a final dividend of 13.5 cents per share, bringing the full year dividend to 25.0 cents per share consistent with the total dividend per share last year.
Discontinued OperationsThe Group’s result for the period includes $8 million of final costs associatedwiththedemergeroftheVirginBluebusiness.
Organisation StructureFor the 2010 financial year the business will be reported around the following operations:
– GlobalExpress&DomesticFreight– Global Forwarding– Global Contract Logistics– GlobalResources&Projects
The new structure provides customer focused services on a global and regionalbasis.Wewillcontinuetoprovidefinancialstothemarketina format that will allow year on year comparisons to occur.
OutlookTradingconditionsintheshorttermareexpectedtoremaingenerallyflat with some improvement evident across Australia and Asia. Toll is however, well positioned to benefit from improvement in economic activity.
Significant investment is being made for future growth in projects such as the Loyang offshore supply base and continued investment in fleet and technology.
Theacquisitionoutlookremainsverypositivewithopportunitiesinmostsectors,particularlyglobalforwarding.Ourstrongbalancesheetposition leaves us well placed to take advantage of opportunities as they arise.
EnvironmentToll is now into its fourth year of an enhanced focus on environmental climate change.
Since2006wehavemettherequirementsofkeygovernmentenvironmental programs that will lead Australia into the Carbon Pollution Reduction Scheme.
In Australia the focus at Toll has been to progressively improve reporting and management processes. At the hub of this approach is our previously reported Toll web based management system, GEMS (Greenhouse Emission Management System). Simply, GEMS converts all energy sources to specific program units measuring the progress and impact of Toll’s generated greenhouse gases.
Ourfocusonimprovingoperationalefficiencyhasidentifiedmanyaspectsthatimpactfuelusethroughoutourfleet.Vehiclespecifications will be further refined to ensure that the best fleet investmentsareimplementedtomaximisefuelsavingsandreturn on investment.
Inaddition,Tollwillcontinueexploringtheuseofalternativefuels and technologies based on research and development results from its own and international trials.
Toll’s ongoing commitment to designing energy efficient depots, warehouses and distribution centres includes trials on improving lighting systems, building design and potential implementation of alternate energy sources such as solar power. In addition, Toll recognisestheneedtomaximisetheuseofrainwaterandseeks to where possible capture multiple facility rain water to supply truck cleaning facilities and toilet flushing systems.
Finally,Tollpreferstoreduceemissionsinplaceofacquiringcarboncreditsthroughtrading.Wewillseekadditionalemissionreductionopportunities to ensure the greatest savings are made to meet our strategic goals and support our customers.
For
per
sona
l use
onl
y

18
DIRECTORS’ REPORT ContInued
for the year ended 30 June 2009
Dividends Dividends paid or declared by the Company to members since the beginning of the previous financial year were:
Cents per
shareTotal ($M)
Franked/ Unfranked
Payment Date
Dividends provided or paid by the Company during the year:
Ordinary Shares
2009
2008 Final Dividend 11.5 74.5 Franked 24/10/2008
2009 Interim Dividend 11.5 79.5 Franked 03/04/2009
2008
2007 Final Dividend 11.0 70.7 Franked 03/10/2007
2007 Special Dividend 5.0 32.1 Franked 03/10/2007
2008 Interim Dividend 13.5 87.1 Franked 04/04/2008
2008 Special (in specie) Dividend (see below) 304.6 Unfranked 22/08/2008
Dividends paid or declared by the Company after year end:
Final Dividend 13.5 93.9 Franked 23/10/2009
Significant Changes in the State of AffairsThere have been no significant changes in the state of affairs of the Group during the financial year.
Financial ReportingTheManagingDirectorandtheChiefFinancialOfficerhavedeclaredinwritingtotheBoardthattheGroup’sfinancialreportsarefoundedonasound system of risk management and internal compliance and control which implements the policies adopted by the Board.
Monthlyactualresultsarereportedagainstbudgetsapprovedbythedirectorsandrevisedforecasts,ifrequired,areprepared.
Environmental RegulationThe operations of the Group in Australia are subject to various environmental regulations under both Commonwealth and State legislation.
Inmakingthisreport,thedirectorsnotethattheGroup’soperationsfrequentlyinvolvetheuseordevelopmentofland,thetransportofgoodsandpeople,thestorage,transportanddisposalofwasteandtheuseoftransportationequipment.Someoftheseactivitiesrequirealicence,consent or approval from Commonwealth or State regulatory bodies. This regulation of the Group’s activities is typically of a general nature, applying to all persons carrying out such activities, and does not in the director’s’ view comprise particular and significant environmental regulation.
BaseduponenquirieswithintheGroup,thedirectorsarenotawareofanybreachesofparticularandsignificantenvironmentalregulationaffecting the Group’s operations.
The directors believe the environmental performance of the Group is sound and that the Group has appropriate systems in place for the management of its ongoing corporate environmental responsibilities.
Events Subsequent to Balance Date
DividendsA final dividend of 13.5 cents per share has been declared by the directors.
Likely Developments and Expected Results of OperationsTheGroupwillcontinuetopursueitspolicyofincreasingtheprofitabilityandmarketshareofitsbusinessesduringthenextfinancialyear.
InformationastolikelydevelopmentsintheoperationsoftheGroupandtheexpectedresultsofthoseoperationsinfuturefinancialyearshasnot been included in this report because, the directors believe on reasonable grounds, that to include such information would be likely to result in unreasonable prejudice to the Group.
For
per
sona
l use
onl
y

19toLL | ANNUAL REPORT 2009
Information on Directors
Director Experience & Qualifications Age Special Responsibilities*
R Horsburgh AM BChem Eng, Hon D Univ, FAICD FIEAust Independent Non ExecutiveDirector
Extensivemanagementexperienceintheglassandsteelindustries,inmergersandacquisitions,managing businesses overseas especially in the SE Asian countries and building businesses in mainland China. Director since 2004. Appointed Chairman from 14 September 2007. Former Managing Director of Smorgon Steel Group Limited from 1998 to June 2007.NonExecutiveDirectorofCSRLimited,NationalCan Industries Limited and Traffic Technologies Limited since 2006.
66
Chairman of Board of Directors Chairman of the Nomination and Corporate Governance Committee and Member of the Remuneration and Succession Planning Committee and Audit and Financial Risk Committee.
P A Little FAICD, FCIT Managing Director
Extensiveexperienceandmanagementinthelogisticsindustry. Managing Director for 23 years. Director since 1986.
61
Member of the Nomination and Corporate Governance Committee.
H Boon BLaws(Hons), BCom(Melb) Independent Non Executive
Extensiveexperienceinglobalmarketingandsales,large scale manufacturing operations, and product development. Director since 1 November 2006. Currently Chairman of Tatts Group Limited and Gale PacificLimitedandNonExecutiveDirectorofHastieGroupLimitedsince2005,PaperlinXLimitedsinceMay2008.FormerNonExecutiveDirectorofFuntasticLimitedfrom2004to2007.FormerChiefExecutiveOfficerandManagingDirectorofAnsellLimited.
61
Chairman of the Remuneration and Succession Planning Committee from March 2008. Member of the Nomination and Corporate Governance Committee.
M Smith FAMI, CPM, FAIM, MAICD Independent Non ExecutiveDirector
Extensiveexperienceinseniorrolesincludingmarketing with Unilever and Uncle Toby’s. Director since1July2007.Non-ExecutiveDirectorofGUDHoldings Ltd since May 2009. Managing Director of Cadbury Schweppes Australia and New Zealand from 2003 to 2007. Former Managing Director of ConfectioneryAust&NZandpriortothat,threeyearsas Director of Marketing for Cadbury Trebor Basset in the UK and senior positions in Cadbury Schweppes’ North American and Australian operations.
54
Chairman of the Audit and Financial Risk Committee from March 2008. Member of the Nomination and Corporate Governance Committee
B Cusack BE(Hons),M.Eng.Sci., FTSE, FAusIMM FAIM, MAICD, Independent Non ExecutiveDirector
Extensiveexperienceinmanagementandresourceindustries.Directorsince1October2007.HejoinedRio Tinto Australia (formerly CRA) in 1966 and retired as Managing Director of Rio Tinto Australia in 2001. NonExecutiveDirectorofMacMahonHoldingsLimitedsince2002,ChairmanofOzMineralsLimitedand was President of the Minerals Council of Australia from 2001 to 2003 (member since 1996).
67
Member of the Remuneration and Succession Planning and the Nomination and Corporate Governance Committees.
F Ford M.Tax(Melb),B.Bus(Accwith Distinction) (RMIT), FCA Independent Non ExecutiveDirector
Extensiveexperienceinfinancialandriskmanagement. Director since 14 January 2008. FormerManagingDirectorofDeloitteVictoriaasaprofessional advisor for 35 years. A past member of the Deloitte Global Board, Deloitte Global Governance and Deloitte National Management Committees. Director of Citigroup Pty Limited.
63
Member of the Audit and Financial Risk and the Nomination and Corporate Governance Committees.
NChatfield,ExecutiveDirectorandChiefFinancialOfficer,resignedasDirector18September2008andretiredon31March2009* Refer to Meetings of Directors as detailed on the following page.F
or p
erso
nal u
se o
nly

20
DIRECTORS’ REPORT ContInued
for the year ended 30 June 2009
Information on Directors (continued)
Company SecretaryMrBernardBMcInerney(AICS,CPA,AICD)hasheldthepositionofcompanysecretarysinceApril1994.MrMcInerneyhasextensiveexperienceinmergersandacquisitionsandfinanceandadministrationwithinthetransportandlogisticsindustryoverthepast25years.Age51.
Directors’ InterestsThe relevant interest of each director in the shares, or options issued by the Company, as notified by the directors to the Australian Stock ExchangeinaccordancewithS205G(1)oftheCorporationsAct2001,at19August2009isasfollows:
Ordinary SharesOptions Over Ordinary
Shares
Paul Little 37,535,935 1,516,000
Ray Horsburgh 26,875 –
Harry Boon 27,088 –
Mark Smith 26,282 –
Barry Cusack 44,802 –
Meetings of DirectorsThe following table sets out the number of meetings of the Company’s directors (including meetings of committees of directors) held during the year ended 30 June 2009 and the number of meetings attended by each director who held office during the financial year.
Directors’ Meetings
Audit and Financial Risk Committee
Meetings
Remuneration and Succession Planning
Committee Meetings
Nomination and Corporate Governance
Committee Meetings
No. of Meetings No. of Meetings No. of Meetings No. of Meetings
Director Attended Held Attended Held Attended Held Attended Held
Paul Little 23 23 3* 3 5* 5 2 2
Neil Chatfield (resigned 18/09/08) 5 5 1 1 – – – –
Ray Horsburgh 23 23 3 3 5 5 2 2
Harry Boon 23 23 – – 5 5 2 2
Mark Smith 23 23 3 3 – – 2 2
Barry Cusack 23 23 – – 5 5 2 2
Frank Ford 23 23 3 3 – – 2 2
* Attended as an invitee.
TheaboveincludesmattersthatweredealtwithbycircularresolutionandratifiedatthenextBoardMeeting.
For
per
sona
l use
onl
y

21toLL | ANNUAL REPORT 2009
Share OptionsDuring or since the end of the financial year, the Company has granted options over unissued ordinary shares as follows:
SeniorExecutiveOptionandRightPlan
As at the 19 August 2009, unissued ordinary shares of the Company under option are:
Grant DateTotal Options
GrantedUnexpired
OptionsNo of
ExecutivesExercise
Price $ Expiry Date
4Oct2006 670,000 180,000 4 10.29 25 Jul 2011
11 Jan 2008 3,831,176 3,505,176 293 10.55 10 Jan 2013
25 Jun 2008 1,282,500 1,192,500 97 6.32 25 Jun 2013
26 Nov 2008 6,179,873 6,179,873 427 5.75 25 Nov 2013
Each option is convertible into one ordinary share once certain performance criteria are met. Performance criteria are tested over 3 periods. FortheOctober2006options,themeasurementdatesare30June2009,30June2010and30June2011.FortheJanuary2008options,themeasurement dates are 30 June 2010, 30 June 2011 and 30 June 2012. For the June 2008 options, the measurement dates are 31 December 2010, 31 December 2011 and 31 December 2012. For the November 2008 options, the measurement dates are 30 June 2011, 30 June 2012 and30June2013.Optionswhichdonotvestintheinitialperiodsareretestedatthetwosubsequentdates.Optionswhichdonotvestinthethird and final performance period will lapse. The proportion of options that vest at the end of a relevant performance period depends on the relevant cumulative compound growth in the Group’s earnings per share pre amortisation and abnormal items for ongoing business operations calculated on a fully diluted basis. All options will vest if the Group’s relevant cumulative compound EPS growth is greater than 15%. If EPS growth is 10%, 50% of the options will vest, between 10% and 15%, a pro-rata straight-line allocation is vested. If EPS growth is below 10%, no options will vest.
NoshareswereissuedduringthefinancialyearontheexerciseofoptionsgrantedundereithertheSeniorExecutiveOptionandRightPlan(2008:nilshares).NoordinaryshareshavebeenissuedsincetheendofthefinancialyearfromtheexerciseofoptionsgrantedunderthePlan(2008: nil shares).
Remuneration Report – audited The 2009 Remuneration Report is prepared in accordance with section 300A of the Corporations Act for the Company and the consolidated entityfortheyearended30June2009.TheinformationprovidedinthisReporthasbeenauditedasrequiredbysection308(3C)oftheCorporations Act. This Report forms part of the Directors’ Report.
1. Remuneration Strategy, FY09 and Looking Forward
Our people are key to our ongoing success. The way we remunerate and focus their performance is critical to delivering shareholder value and achieving our goals of being the most successful provider of ‘integrated logistics solutions’ to the Asian region and providing our customers with global reach.
Thefinancialyearended30June2009(FY09)hasbeenanexcitingyearforTollwithmanydecisionsbeingmadeaboutincreasingthetransparency and clarity of our remuneration framework for stakeholders and our people. This Remuneration Report attempts to clarify the remuneration events that took place during the year, as well as provide commentary on the way forward for our remuneration strategy.
For
per
sona
l use
onl
y

22
DIRECTORS’ REPORT ContInued
for the year ended 30 June 2009
Remuneration Report – audited (continued) During FY09, the Remuneration and Succession Planning Committee (the Committee), who met on 5 occasions during the year, engaged independentremunerationconsultantstoassisttheCommitteeandmanagementtoconductanextensivereviewofToll’sremunerationgovernance, strategy and framework while dealing with the impact of the economic and legislative climate on remuneration policy. This review involved input from the Board, Committee, management as well as independent remuneration advice, and resulted in several key changes that were introduced from 1 July 2009 including:
• IncreasingmanagementandCommitteeoversightofremunerationdecisions.ThisincludedchangestoToll’sannualremunerationprocessesand centralisation of key remuneration processes;
• Changingthebalanceofremunerationtoputmoreremuneration‘atrisk’forExecutivesbasedontheirrolesandmarketrelativities(i.e.theweightingoffixedremuneration,short-termandlong-termincentives);
• Furtheraligningexecutives’withorganisationalobjectivesbyrebalancingfinancialandnon-financialobjectives,groupanddivisionalobjectives and revising associated performance metrics;
• Reviewingpeergroupsforbenchmarkingtoensuretheyareappropriatetotheexecutives’rolewithintheorganisationandtherelevantglobal region; and
• Clearlyarticulatinghoweachelementofremunerationrewardsdifferenttypesofperformance.
However,inrecognitionofcurrenteconomicconditions,managementrecommendedthattherebenofeeorfixedremunerationincreasesfortheBoardofDirectorsandtop150executivesforthefinancialyearcommencing1July2009(FY10).TheBoardhasdeterminedthatfixedremunerationwillremainatthe30June2009levelsforthetop150employeestoconveyamessageofresponsibilitytoshareholders,customers and other stakeholders.
Toll’s remuneration governance process is summarised below.
January to March April to June July to September October to December
Market review of Executive
Remuneration Landscape (A)
Review TER for CEO and
Executives (B)
Assess KPI performance for FY09 and set KPIs for FY10 (C)
Stakeholder dialogue (D)
Remuneration report sign-off
(D)AGM (D)
(A) Market review of Executive Remuneration
Landscape
Purpose: External validation
Purpose: Role and performance
assessment
Purpose: Alignment
and accountability
Purpose: Communication of
remuneration strategy
Provide the Board with information on recent executive remuneration trends and practices so that it can factor this information into its remuneration decisions.
Provide a recommendation on remuneration levels considering:(i) any changes in role/ responsibility, (ii) performance in the role, and (iii) market data.
Review performance against FY09 Key Performance Indicators (KPIs) to determine performance pay outcomes.Set FY10 KPIs that align the strategic plan of the company with the personal strategic imperatives of the individual executive.
Communicate the remuneration strategy to shareholders and outline how it has been applied over the financial year.
(B) Total Employment Remuneration review for
CEO and Executives
(C) FY09 KPIs reviewed, FY10 KPIs
set and approved
(D) AGM – preparation & delivery
For
per
sona
l use
onl
y

23toLL | ANNUAL REPORT 2009
2. Remuneration and Succession Planning Committee
Governance and transparency in remuneration and succession planning is a key focus of the Committee.
The Remuneration and Succession Planning Committee (the Committee) is a committee of the Board. The Committees charter sets out its membership, responsibilities, authority and activities. The terms of reference for the Committee are further described in the Corporate Governance Report and are available online at www.toll.com.au.
The key responsibilities of the Committee are shown below:
Remuneration and Succession Planning Committee focus
Management input (Human Resources, Legal, Finance)
Remuneration governance and frameworkRemuneration framework changes, details, concepts and design require approval from Non-Executive Directors. Governance continues to be a major focus of the Committee.
Remuneration• monitors the Group’s remuneration strategy and framework so that it continues
to drive long-term growth and the success of the Group and its employees;• reviews, determines and makes recommendations to the Board on the Managing
Director’s (Chief Executive Officer’s) remuneration and, where required or requested by the Board, considers the appropriateness of remuneration allowances and incentives for contracted senior management;
• reviews and make recommendations to the Board on Non-Executive Director fees;• reviews and ratifies other Senior Executives’ remuneration, including the
remuneration of all first level reports to Managing Director (Chief Executive Officer);
• oversees compliance with statutory responsibilities relating to remuneration disclosure;
• reviews policies and reporting responsibilities relating to employee share, option, rights and non-equity based plans; and
• reviews senior executive, Director and Non-Executive Director retirement and termination payments (if any).
Succession Planning• Establishes and monitors
executive succession planning.
• Oversees the executive succession planning framework.
Exte
rna
l rem
uner
atio
n co
nsul
tant
s
At 30 June 2009, Committee members were Mr Harry Boon (Chairman), Mr Ray Horsburgh and Mr Barry Cusack, all of whom are independent non-executivedirectors.Whereappropriate,theCommitteealsoinvitesmembersofthemanagementteamtoassistinitsdiscussions(exceptthoseconcerningtheirownremuneration).TheCommitteealsotakesspecialistremunerationadviceduringtheyearfromexternaladvisers as appropriate.
For
per
sona
l use
onl
y
24
DIRECTORS’ REPORT ContInued
for the year ended 30 June 2009
Remuneration Report – audited (continued)
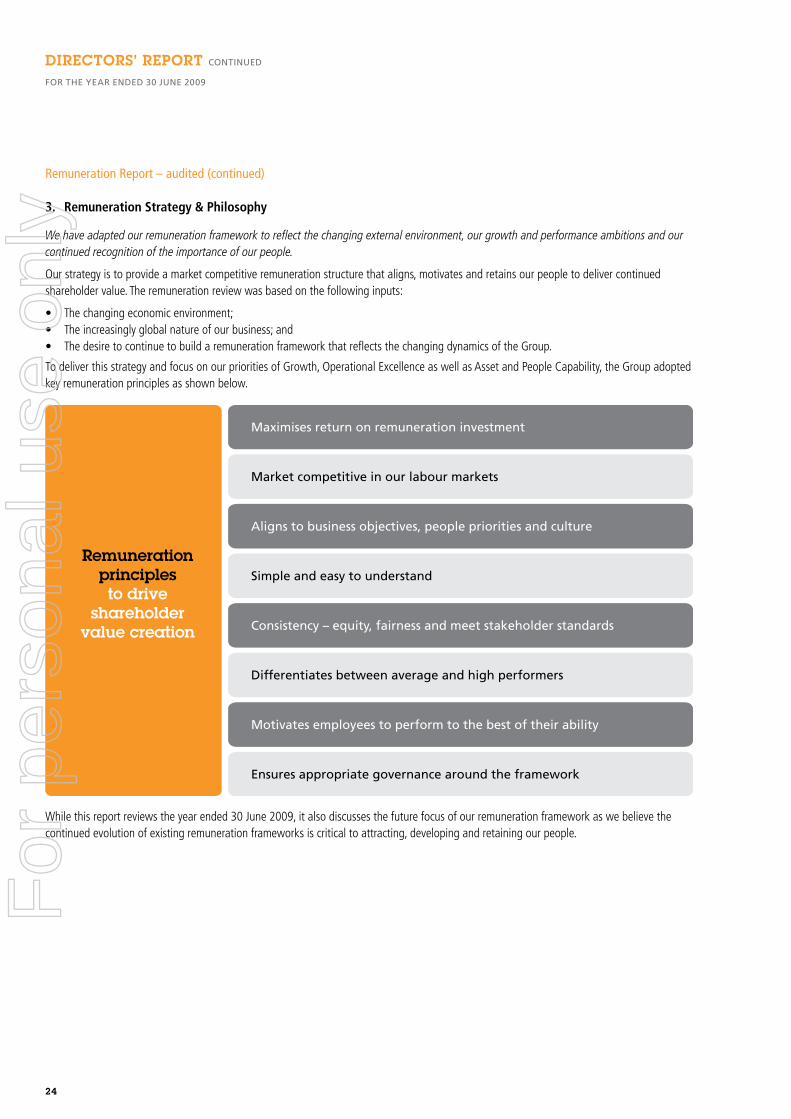
3. Remuneration Strategy & Philosophy
We have adapted our remuneration framework to reflect the changing external environment, our growth and performance ambitions and our continued recognition of the importance of our people.
Ourstrategyistoprovideamarketcompetitiveremunerationstructurethataligns,motivatesandretainsourpeopletodelivercontinuedshareholder value. The remuneration review was based on the following inputs:
• Thechangingeconomicenvironment;• Theincreasinglyglobalnatureofourbusiness;and• ThedesiretocontinuetobuildaremunerationframeworkthatreflectsthechangingdynamicsoftheGroup.
TodeliverthisstrategyandfocusonourprioritiesofGrowth,OperationalExcellenceaswellasAssetandPeopleCapability,theGroupadoptedkey remuneration principles as shown below.
Remunerationprinciples to drive
shareholder value creation
Maximises return on remuneration investment
Market competitive in our labour markets
Aligns to business objectives, people priorities and culture
Simple and easy to understand
Consistency – equity, fairness and meet stakeholder standards
Differentiates between average and high performers
Motivates employees to perform to the best of their ability
Ensures appropriate governance around the framework
Whilethisreportreviewstheyearended30June2009,italsodiscussesthefuturefocusofourremunerationframeworkaswebelievethecontinuedevolutionofexistingremunerationframeworksiscriticaltoattracting,developingandretainingourpeople.
For
per
sona
l use
onl
y

25toLL | ANNUAL REPORT 2009
4. Critical Terminology and Definitions
Key phrases relating to remuneration differ from company to company. For ease of reading, our key definitions are summarised below.
Total Employment Remuneration (TER)
Fixedremuneration
Performance-based,‘at-risk’remuneration
Short-term incentive (STI) Long-term incentive (LTI)
Objective
Reflects the market value of the role and the incumbents’ skills, performanceandexperience.
Incentivises achievement of stretch performance budgets and targets (goals) for the year.
Incentivises long-term shareholder value creation and assists in retentionofkeyexecutivesandtalent.
Performance conditions for element of remuneration
Reviewed annually following externalbenchmarkingandreviewof individual performance.
For the year ended 30 June 2009, the financial incentive was based on Earnings Per Share, debtors days, safety and corporate strategic initiatives, plans and budgets at a group, divisional and business unit / individual level. For the year ending 30 June 2010 awards will be based on net profit aftertax,earningsbeforeinterestandtax,cashflow,safetyandother corporate strategic initiatives at a group, divisional and business unit / individual level (as applicable to each role).
For the year ended 30 June 2009, performance options granted were subject to performance targets based on fully diluted Earnings Per Share pre-amortisation and abnormal items for ongoing business operations (Relevant Earnings Per Share or EPS).
Performance period Ongoing Generally 12 months Generally 3 to 5 years
Othertermsfoundinthisreportinclude:
Term Abbreviation Definition
Key Management Personnel
KMP
A term detailed in the accounting standard AASB 124 Related Party Disclosures, meaning individuals who have authority and responsibility for planning, directing and controlling the activities of Toll (including Non-ExecutiveDirectors).
NamedExecutives
–
AtermdetailedintheCorporationsAct2001.Thisrequiresthe5highestpaidgroupandcompanyexecutivestobedisclosedintheremunerationreport.Executivereferstosecretariesandseniormanagersofthecompany / group who had authority and responsibility for planning, directing and controlling the activities of the Group and/or Company for the year ended 30 June 2009.
For
per
sona
l use
onl
y

26
DIRECTORS’ REPORT ContInued
for the year ended 30 June 2009
Remuneration Report – audited (continued)
5. Key Management Personnel
Listed below are the names and positions of our non-executive directors, executive directors and senior management. All individuals shown are responsible for the stewardship of Toll and its strategic direction.
The following people were Key Management Personnel during the year ended 30 June 2009.
Directors Position Comments
Non-Executive
Ray Horsburgh ChairmanandNon-ExecutiveDirector
Harry Boon NonExecutiveDirector
Mark Smith NonExecutiveDirector
Barry Cusack NonExecutiveDirector
Frank Ford NonExecutiveDirector
Executive
Paul Little Managing Director
Neil Chatfield ExecutiveDirectorandChiefFinancialOfficer Ceased being a KMP of Toll Holdings Ltd on 18 September 2008. Retired on 31 March 2009.
Executives1, 2
John Ludeke ChiefOperatingOfficer
Stephen Stanley Strategy/MergersandAcquisitions,Director
Bernard McInerney Company Secretary
David Jackson TollGlobalResources,CEO
Hugh Cushing TollGlobalForwarding,CEO
WayneHunt TollGlobalLogistics,PresidentandCEO
Mal Grimmond DirectorBusinessSolutionsandChiefInformationOfficerandActingChiefFinancialOfficer
AppointedActingCFO18September2008 until 6 July 20092
1 Executivesaretheindividualswhohadauthorityandresponsibilityforplanning,directingandcontrollingtheactivitiesoftheGroupand/orCompanyfortheyearended30June2009,includingthetop5paidExecutives.
2 MrBrianKrugercommencedwithTollasChiefFinancialOfficeron6July2009andisconsideredaKMPfromthatdategoingforward.
For
per
sona
l use
onl
y

27toLL | ANNUAL REPORT 2009
6. Executive Remuneration Framework
We are changing our remuneration framework by further clarifying our remuneration structures and making them more transparent.
Toll is continuing to emphasise performance-oriented remuneration. The elements of remuneration for the year ended 30 June 2009 and going forward have been articulated to allow the new framework to be understood. Incentivising individuals to improve performance as well as learn and grow is a main focus of the changes detailed below.
Year ended 30 June 2009Changes to remuneration
arrangements (FY10)
Fixe
d
Rem
uner
atio
n
• Paid to each executive and based on executive’s skills, experience and requirement of their role in line with market remuneration data.
• Strengthening the way we reward and incentivise our executives to perform and develop themselves by positioning remuneration in a range around the median. The position is based on individuals results, skills, experience and Toll’s values.
• Paid to each executive based on the market value of the role as well as the contribution and impact of the role to the Company. Performance and value add by the incumbent is also taken into account.
• Strengthening the link with shareholder value creation by referencing a more relevant peer group when determining salaries.
STI
• An ‘at-risk’ component of remuneration. • Calculated in line with performance metrics
linked to measurable gains in the achievement of the Group’s annual objectives.
• Determined based on performance against measures including budgeted EPS growth, EBIT, NPAT, revenue, cashed based return on assets, debtor days outstanding and safety.
• Some executive measures may vary depending on the individual’s business focus and role.
• Strengthening the link between individual metrics and Toll’s annual goals and strategic objectives of growth, operational excellence and asset/people capability. This will drive common metrics related to Toll as well as specific divisional goals and some individual or specific business unit strategic initiatives over an annual period (where applicable).
• Financial and non-financial metrics will be used. Front line executives will have a maximum of 30% non-financial metrics while corporate executives will have a maximum of 50% non-financial metrics.
LTI
• An ‘at-risk’ component of remuneration. • LTI has previously rewarded sustained
long-term performance and creation of shareholder wealth through the issue of senior executive share options.
Cumulative growth in fully diluted earnings per share (pre-amortisation) was the performance measure.
• Commenced establishment of cash settled non equity based LTI in countries where it is not practical to issue senior executives with share plan options.
• Tightening our control of remuneration spend, reducing volatility and making the remuneration element more tangible for executives by moving to a dollar amount for long-term incentives.
• Continuing to reward sustained long-term performance and creation of shareholder wealth through the issue of senior executive share options.
• Moving to annual shareholder approval of LTI for the executive director.
For
per
sona
l use
onl
y

28
DIRECTORS’ REPORT ContInued
for the year ended 30 June 2009
Remuneration Report – audited (continued) Setoutbelowareourtargetremunerationmixes.Thesetargetremunerationmixeshavebeencalibratedtosupportourperformance-basedremunerationstructureandtobetterlinktoGroupstrategicobjectivesandshareholdervaluecreation.Wheresignificantgapsexistbetweenexecutives’existingremunerationmixesandourtargetremunerationmixes,weintendtotransitiontothetargetremunerationmixesovertime.DuetoToll’sfixedremunerationpayfreezeforthetop150executiveshowever,Tollwillnotbeadjustingexecutives’targetremunerationmixesinFY10.
Toll’sremunerationisprimarilybenchmarkedagainstfixedremuneration,withSTIandLTIamountsbeingbasedontargetremunerationmixesandassessedagainstmarketdata.Generally,eachrole’stargetremunerationmixwillallowtheexecutivetoearninexcessofthemarketmedian should they outperform their STI measures and if their performance measures are met in relation to LTI.
Thebelowtablereflectsourdesiredremunerationmixesfortheseniorexecutiveteam.
Desired or target remuneration mix
Managing Director
Fixed remuneration
Business Operational Leaders
Senior Corporate Executives
30% 30% 40%
40% 30% 30%
45% 25% 30%
STI LTI
Aspreviouslynoted,ourtargetordesiredremunerationmix,whichincreasesthelevelofremunerationatrisk,willnotbeimplementedinFY10duetothefixedremunerationpayfreezefortheTop150seniorexecutives.
Thecurrentremunerationmixesofexecutivesareshownbelowbasedon30June2009remunerationtargetlevels.ForthekeyindividualBusinessOperationalLeadersandSeniorCorporateExecutives,theaveragemixisshown.
Actual remuneration mix
Managing Director
Business Operational Leaders
Senior Corporate Executives
35% 35% 30%
48% 30% 22%
52% 26% 22%
Fixed remuneration STI LTI
Fixed remunerationFixed remuneration is positioned within a range around the market median (or midpoint) based on ASX Top 50 and 100 companies data. It represents the remuneration for everyday work behaviours and role requirements and is intended to drive performance, behaviours and values on a daily basis.
Anexecutive’sfixedremunerationincludes:
• cashsalary;• benefitstheexecutivehaselectedtoreceiveinlieuofsalary(inclusiveofanyfringebenefittax)–commonitemswouldincludesalary
sacrificing for superannuation and a motor vehicle; and • superannuation.
FixedremunerationrepresentsexecutiveseverydayworkbehavioursandrecognisestherequirementsoftheirroleandtheirdisplayofToll’svalues.Foritstoptwoexecutivelevels,TollgenerallybenchmarksremunerationagainstotherASX50companies.WherethereareinsufficientreferencesavailableintheASX50however,itmayreferencetheASX100.
Tolltargetsthemedianoftherelevantpeergroupforfixedremuneration.Actualfixedremunerationissetagainstarangearoundthemedian,whichallowsTolltodifferentiateindividualsbasedontheirperformance,relevantexperienceandcapability.Ordinarily,recommendationsconcerningseniorexecutivefixedremunerationlevelsaremadebytheManagingDirectorandaresubsequentlyconsideredbytheRemuneration and Succession Planning Committee, or where appropriate, the Board.
For
per
sona
l use
onl
y

29toLL | ANNUAL REPORT 2009
Short-term incentives (STIs)Toll’s short-term incentive is one of two ‘at-risk’ remuneration components. The incentive rewards performance against pre-determined metrics, which include both financial and non-financial measures and vary by role type (e.g. Managing Director, Business Operation Leaders or Corporate Executives).
Short-termincentives(STIs)maybeawardedtoexecutivesbasedontheirannualperformanceasmeasuredandevaluatedundertheGroup’sperformance management system.
STIs are paid in cash or as salary sacrificed superannuation contributions. The Company is re-evaluating its planned implementation of a share-baseddeferredSTIprogramgiventherecentannouncementsbytheFederalGovernmentthatwillimpactthetaxationofemployeesharedeferral plans.
TheRemunerationandSuccessionPlanningCommittee,executivedirectorsandseniormanagementensureallrelevantSTImeasuresarealignedwiththeorganisation’sstrategicobjectives.TheFY09STIperformancemetricsincludedamixtureofbudgetedEBIT,NPAT,relevantEPSgrowth,cash-based returns on assets, debtor days and safety measures, as well as other non financial measures such as strategic initiatives or specific assetandpeoplecapabilityprojectsthatarerequiredtobeundertaken.
TheBoardapprovesexecutivedirectors’specificperformanceobjectives,whicharesetwithreferencetoBoard-approvedcorporateobjectives,plans and budgets, which the Board considers are appropriate. The Managing Director approves senior managements’ performance objectives in the same way. At the end of the annual performance period, performance evaluations are conducted, proposed incentive payments are reviewed andapprovedbytheRemunerationandSuccessionPlanningCommitteeandBoardforexecutivedirectors.TheCommitteenotestheinformationanddetailsasapprovedbytheManagingDirectorforotherseniorexecutives.
For FY10, financial and non-financial measures will be set to align individual’s contributions and focus to Toll’s group, divisional and individual/business unit strategic priorities.
ForBusinessOperationLeadersthenon-financialcomponentwillbeamaximumof30%oftheshort-termincentivetargetswhileCorporateExecutiveswillhaveamaximumof50%oftheirtargetsasnon-financialmetrics.Thehighernon-financialcomponentforCorporateExecutivesistoensurestrategicinitiativesthatwilldrivegrowth,operationalexcellence(efficiencyandeffectiveness),aswellasassetandpeoplecapability.
Financial metrics will have the following payout scale for FY10:
Performance as a percentage of target
< 90%
90% (threshold)
100% (target)
Exceptional Performance (max) – against financial metric
Reward as a percentage of target
0%
25%
100%
Up to 125%
Straight line reward between 90% to 100% of performance as a percentage of target.
Targetsaresetatastretchlevel.Therefore,achievementof125%ofthetargetwouldrequiresignificantoutperformance.
Non-financialmetricswillbecappedattargetperformance.Anyoutperformanceofnon-financialmetricswillfeedintotalent&successionplanning considerations.
Long-term incentives (LTIs)Toll’s long-term incentive is the second ‘at-risk’ remuneration component. This incentive rewards sustainable long-term performance against pre-determined long-term measures, aligns executive reward with shareholder value creation and acts as a retention mechanism for talent.
Long-term incentives (LTI) are the second variable component of remuneration. The intention of the LTI is to support the business strategy by aligningexecutiveremunerationwiththeCompany’slong-termperformance.
TheLTIisequity-basedandinFY09wasprovidedthroughtheshareholderapprovedSeniorExecutiveOptionandRightsPlanintheformofperformanceoptions.EachperformanceoptionprovidestheholderarighttoacquireafullypaidordinaryshareintheCompanyforaspecifiedexercisepriceifperformancehurdlesareachievedduringperformanceperiodswhicharegenerallythreetofiveyears.Performanceoptionsaregenerallygrantedatnocosttotheexecutive.
Grantsofperformanceoptionsaremadeeveryyeartonominatedexecutives.Inthecaseofexecutivedirectors,anyallocationsofperformanceoptionsaresubjecttoshareholderapproval.Annualgrantsprovideexecutiveswitharollingincentivethatensuresalong-termfocus,providesa three-year focus (due to the three to five year performance and testing periods) and a strong retention effect. The annual process also gives the Board a regular opportunity to set new targets and reconsider the choice of instruments, hurdles, targets and vesting, to ensure the LTI continuestosatisfyshareholderexpectationswhileactingasanappropriateincentiveforexecutives.
For
per
sona
l use
onl
y

30
DIRECTORS’ REPORT ContInued
for the year ended 30 June 2009
Remuneration Report – audited (continued) The key terms and conditions of the FY09 performance option grant are shown below.
Grant date (approved by the Board) 26 November 2008
Instrument Performance options
Exerciseprice $5.75(volumeweightedaveragepriceofordinaryCompanysharestradedontheASXforfivedaysupto and including the grant date)
Initial Performance period 3 years from 1 July 2008, with two retests in years four and five based on the cumulative compound growth from 1 July 2008.
Performance hurdle Overtheperformanceperiod:cumulativecompoundgrowthinfullydilutedearningspershare(preamortisation)(“EPS”)forongoingbusinessoperationsexcludingabnormalitems(“RelevantEPS”).
Reason for hurdle
The Board considered that Relevant EPS was the most appropriate metric to align the objectives of the Company and various stakeholders because there is a strong correlation between profit improvement and shareholder value.
Vestingconditions 50% vesting at 10% compound Relevant EPS growth. 100% vesting at 15% compound Relevant EPS growth with proportional vesting from 10% to 15% compound growth.
Measurement date(s) 30 June 2011, 30 June 2012 and 30 June 2013
Method for assessing performance
Atappropriatepointsintime,theBoardassesses(withassistanceofindependentadviceasrequired)performance against the performance hurdle to determine the percentage of options that will vest. In doing so, the Board considers, amongst other things, the Company’s audited financial results. This method is used to assess whether the performance hurdles are met as it is considered the most relevant and reliable way to do so.
VestingDates 26 November 2011, 26 November 2012 and on the Board’s approval of the June 2013 full year results.
Lapsing and Forfeiture
Performance options will lapse if performance hurdles are not achieved or performance options remain unexercisedattheexpirydate.UnlesstheBoarddeterminesotherwise,whereanexecutiveceasesemployment, all unvested performance options lapse immediately. All performance options will lapse immediately in the case of dismissal for gross misconduct.
Expirydate 25 November 2013 (5 years)
Group PerformanceIn assessing whether the performance hurdle for each grant of options has been met, the Group receives independent data on each hurdle at the end of the vesting period from its financial advisers. Set out below is the Group’s EPS performance over the past 3 years.
2009 2008 2007
Relevant EPS (fully diluted)1 Cents 48.0 42.7 35.5
1 Preamortisationforcontinuingoperationsandexcludingabnormalitems.
Policies on equity remunerationDirectorsandSeniorExecutivesofTollanditssubsidiariesmustnotengageinshort-termtradingofTollsecurities.Asaguide,thepurchaseof securities with a view to resale within a 12 month period and/or the sale of securities with a view to repurchase within a 12 month period would be considered to be transactions of a short-term nature.
Thesaleofsharesimmediatelyaftershareshavebeenacquiredthroughtheconversionofasecurity(e.g.anoptionunderToll’slong-termincentiveplan)willnotberegardedasshort-termtrading.ThepolicyrequiresDirectorsandSeniorExecutivestoseekguidancefromtheCompany Secretary if they are ever in doubt.
Risk limiting products are not permitted on unvested entitlements as set out in Toll’s securities trading policy. Directors and SeniorExecutivesarenotpermittedtoengageintransactionsorarrangementsinrisklimitingproductswhichoperatetolimittheeconomicriskof unvested entitlements to Toll securities (e.g. hedging arrangements in relation to unvested options or performance rights).
ADirectororSeniorExecutivemust not transact in Toll securities or engage in transactions limiting economic risk on vested entitlements without prior written consent from either the Chairman of the Board or Managing Director as applicable for Directors and Senior Management respectively.
IntheeventthatDirectorsandSeniorExecutivesareabletoengageintransactionsorarrangementsinproductswhichoperatetolimittheeconomic risk in Toll securities (that are free to be traded) this must be done within a trading window. They must also ensure that the nominated settlement procedures will not allow the trigger of a Toll security sale by the third party outside a trading window and where possible as a preferencebesettledbyacashexchange.
For
per
sona
l use
onl
y

31toLL | ANNUAL REPORT 2009
DirectorsandseniorexecutivesareadvisedofToll’ssecuritiestradingpolicydetailsandrequiredtradingapprovalprocedurespriortoeachtradingwindow.DirectorsorseniorexecutivesarenotabletotradeTollsecuritieswithoutfirstnotifyingtheCompanySecretaryorBoardChairmanoftheirproposedtradeandhavingreceivedwrittenapprovaltoproceed.Inallinstances,executivesanddirectorsarerequiredtoconfirm that they are not privy to price sensitive information.
7. Performance of Toll
Toll’s focuses on linking remuneration with company performance. Below are some key measures that drive our business and link to shareholder wealth creation.
Some of the measures which reflect the linkage of Company performance with remuneration over the past five years include the following:
Measure FY05 FY06 FY07 FY08 FY09
Financial metrics
EBIT ($m)1 245 300 365 429 466
EBIT margin (%) 6.48 6.76 7.51 7.65 7.18
Shareholder wealth
Share price (at 30 June of each year) ($) 13.06 14.05 14.492 6.02 6.25
Dividend per share (cents per share) 26.5 31.0 27.03 25.0 25.0
Safety – measured as Lost Time Injury Frequency Rate4
Lost Time Injury Frequency Rate (LTIFR)
0
10
20
30
40
50
60
Jun-09Jun-08Jun-07Jun-06Jun-05Jun-04Jun-03Jun-02Jun-01
1 Relates to continuing operations only.2 DoesnotincludetheadditionalequityvaluereceivedaspartoftheAscianodemerger.3 Does not include a special dividend of 5cps or restructure dividend of 17cps.4 Relates to Australian and New Zealand data only.
For
per
sona
l use
onl
y

32
DIRECTORS’ REPORT ContInued
for the year ended 30 June 2009
Remuneration Report – audited (continued)
8. Remuneration Summary – FY09
The table below summarises the remuneration of the executive directors and key management personnel for the year ended 30 June 2009. All amounts are in Australian dollars.
Term of Agreement
Fixed remuneration as at 30 June 2009
STI Target for FY09 (as a $ amount)
Actual STI for performance to 30 June 2009
LTI target value based on assessments at 30 June 2009
Contracted notice periods• Employee•Company
Executive Directors
Paul Little1 Shareholder approval 28May2007–fixedtermtoApril 2010
2,310,000 2,310,000 1,555,000 1,980,000 • 12monthsnotice + 6 months Total Employment Remuneration (TER) payment by employee
• 12monthsnotice+6monthsTER payment by company
Neil Chatfield1,2
Shareholder approval 28 May 2007
855,000
1,231,0002
951,5002
732,750
Mr Chatfield and the company agreed a transition to retirement in September 2008 which saw him placed on alternate duties during the period to his cessation on 31 March 2009.
Executives
John Ludeke1 Shareholder approval 28May2007–fixedterm to April 2010
1,029,000 858,000 707,850 564,000 • 6monthsbyemployee• 18monthsbycompanyTermination payment based on TER
Stephen Stanley1 Shareholder approval 28May2007–fixedterm to April 2010
780,000 520,000 416,000 433,000 • 6monthsbyemployee• 18monthsbycompanyTermination payment based on TER
Bernard McInerney1
Shareholder approval 28May2007–fixedterm to April 2010
635,000 270,000 216,000 270,000 • 6monthsbyemployee• 18monthsbycompanyTermination payment based on TER
David Jackson No formal agreement in place 628,000 265,000 212,000 209,000 None specified. Currently moving towards contracting allkeyexecutives.
Hugh Cushing3 No formal agreement in place 658,000 277,000 221,600 209,000
WayneHunt3 No formal agreement in place 615,000 410,000 225,500 342,000
Mal Grimmond4 No formal agreement in place 467,000 240,0004 198,0004 93,449
1 Contractswereapprovedattheextraordinarygeneralmeetingon28May2007.2 Mr Neil Chatfield ceased being a Director and KMP on 18 September 2008 and ceased employment on 31 March 2009 following his agreed transition to retirement.
The information above reflects his actual remuneration as well as his actual short-term incentive payments for the FY09 financial year to his cessation date. All paymentsmadetoMrChatfieldwereinlinewithcontractualentitlementsasapprovedbyshareholdersintheextraordinarygeneralmeetingon28May2007.MrChatfield received a performance tested pro-rated short-term incentive and a special incentive of $284,000 paid at the end of his transition period. The special incentive paid at the Board’s discretion ensured co-operation, retention, delivery of special projects including refinancing debt facilities in Singapore as well as assistancetotheActingCFO.DuringthistimeTollconductedanexecutivesearch,internallyandexternally,forasuitablesuccessortoMrChatfield.Theremunerationabove reflects his full remuneration for the period to 31 March 2009. Mr Chatfield received no termination payment benefits other than his leave entitlement payouts. Hisexistingunvestedlong-termincentiveswereallowedtocontinuesubjecttoperformancehurdlesandotherpostcessationconditions.
3 MrHughCushingandMrWayneHunthavebeenappointedtooverseasjurisdictionsasexpatriateexecutivesandreceivecertainallowancesinadditiontotheirfixedremuneration, short-term incentives and long-term incentives. The actual remuneration paid as disclosed in the remuneration tables includes the impact of foreign exchangeratesandnon-monetarybenefitspaidinrelationtotheoverseasassignments.
4 AsrecognitiontoMrMalGrimmondforassumingtheActingCFOrole,hewasawarded$100,000paidinMarch2009.Thiswasaone-offrecognitionincentiveandwas in addition to his annual short-term incentive.
For
per
sona
l use
onl
y

33toLL | ANNUAL REPORT 2009
9. Managing Director Remuneration
Key responsibilities of the Managing Director are to drive shareholder value, deliver Toll’s strategy, and engage and drive internal capability. Growth, operational excellence, asset and people capability are essential.
The Managing Director, Paul Little, had a Total Employment Remuneration target of $6.6 million for the financial year ended 30 June 2009. His actual remuneration earned or granted for the financial year was $5.1 million (including LTI accounting value).
Effective1July2008,theManagingDirector’sTERincludedfixedremunerationof$2.31million,ashort-termincentivetargetof$2.31million,andalong-termincentivetargetof$1.98million.ThispackageisstructuredtodriverealperformanceforToll,withsixty-fivepercentofthetargetremunerationpackagebeing‘atrisk’anddependantonvariousperformancemetrics.
Toll’sremunerationstrategyistoincreasetheproportionofperformance-basedpaysothatseventypercentis‘atrisk’andperformancebased.
AspartofToll’ssalaryfreezeforthetop150executivesacrossthegroupglobally,theManagingDirectorwillnotreceiveanincreasetoTotalEmployment Remuneration target for the financial year commencing on 1 July 2009. However, this will not prevent a higher short-term incentive being earned for FY10 should he achieve all his STI performance measures.
Short-term incentiveThe short-term incentive target of $2.31 million was based on the following hurdles for 2009 financial year:
• TherelevantfullydilutedEarningsperShare;• AgreedimprovementintheLost-TimeInjuryFrequencyRate;and• Keystrategicinitiatives.
Onmeasuringtheseperformancehurdlesforthefinancialyearended30June2009,theManagingDirector’sactualshort-termincentivewas$1.6 million mainly due to the relevant fully diluted earnings per share performance.
Long-term incentiveDuringthe2009financialyear,theManagingDirectorwas,inaccordancewithhisExecutiveServicesDeed,entitledtobegranted$1.98millioninoptionsbywayoflong-termincentives,subjecttoperformancehurdles.AstheManagingDirectorisanexecutivedirector,anysuchequityallocation must receive shareholder approval.
AtToll’sAnnualGeneralMeetinginOctober2006,shareholdersapprovedtheallocationofanaggregateof2,000,000optionstotheManagingDirector over a three-year period by way of LTI, subject to performance hurdles.
• Aninitialgrantof484,000wasapprovedbyshareholdersinrelationtothe2007financialyear.• Afurthergrantof739,130wasmadebytheBoardinrelationtothe2008financialyear.• Thebalanceof776,870performanceoptionsweregrantedduringtheyearunderreview(issuedinJune2009).Theallocationvalueof
options issued for the 2009 financial year was $1,025,468 at $1.32 per option, which is well below the Managing Director’s entitlement of $1.98 million.
Paul Little has informed the Board that he will forgo his entitlement to the remaining $954,532 for the 2009 financial year.
In the time between calculating the allocation value (26 November 2008) and issuing the performance options (June 2009), the Board reassessed the vesting criteria for options to ensure there was sufficient stretch in the Relevant EPS hurdle. This process, which was not completed until April 2009, together with the Federal Governments proposed changes to the treatment of employee share schemes meant Toll was unable to finalise the issue of November 2008 performance options until June 2009.
TheBoardhasdeterminedthatitisappropriatetoseekshareholderapprovalonanannualbasisforexecutivedirectorLTIallocationsratherthan every three years, and will therefore seek shareholder approval at the 2009 Annual General Meeting for performance options relating to the Managing Director’s FY10 LTI remuneration of $1.98 million.
10. Service Contracts
Paul Little, John Ludeke, Stephen Stanley and Bernard McInerney are currently the only formally contracted executives. The coming year will see other senior management enter into employment service agreements.
At the time of the Group’s restructure in the first half of the 2007 financial year, concurrent with the demerger of Asciano Limited, the Board considereditofcriticalimportancetosecuretheservicesofcertainseniormanagementpersonnel.Duringthistime,anumberofkeyexecutivesenteredintoExecutiveServiceDeedswithaninitialfixedtermofthreeyears.Intheabsenceofrenegotiation,thetermsoftheoriginaldeedswillcontinuetoregulatetheexecutive’semployment.
For
per
sona
l use
onl
y

34
DIRECTORS’ REPORT ContInued
for the year ended 30 June 2009
Remuneration Report – audited (continued) AspreviouslyreportedthefollowingexecutivesenteredintoExecutiveServiceDeedsinApril2007.
Paul Little Managing Director
NeilChatfield ChiefFinancialOfficer (ceased being a KMP on 18 September 2008 and employment on 31 March 2009)
JohnLudeke ChiefOperatingOfficer
StephenStanley DirectorStrategy/MergersandAcquisition
Bernard McInerney Company Secretary
Inallinstances,theExecutiveServiceDeedsprovideforminimumnoticeperiodsbyboththeexecutiveandtheCompany,withtheCompanymaintainingthediscretionto,ifappropriate,payouttherequirednoticeperiod.
TheManagingDirector’sdeedrequirestheCompanytogivetwelvemonthswrittennoticetoterminatehisservices.TheterminationnoticerequiredfortheothercontractedexecutivesiseighteenmonthsbytheCompanyandsixmonthsbytheexecutive.
ThebasisandcircumstancesforTerminationPaymentsembodiedwithintheExecutiveServiceDeedsenteredintoinApril2007receivedshareholderapprovalatanextraordinarygeneralmeetingheldon28May2007.
During the current reporting period, no additional employment service agreements were entered into with senior management. However, the Boardconsidersitimportantforseniormanagementwhoarenotundercontracttoenterintoexecutiveserviceagreements,thetermsofwhichwillbeinlinewithcurrentstakeholderexpectationsfornoticeperiodsandterminationpayments.
In summary, the terms of service contracts are as follows:
Paul Little
John Ludeke, Stephen Stanley and Bernard McInerney (Neil Chatfield ceased being a KMP on 18 September 2008 and ceased employment follow a transition to retirement on 31 March 2009)
•WherePaulLittleworksouthisfullnoticeperiod(twelvemonths),hewillbepaidafurthersixmonthsbasedonTotalEmploymentRemuneration(TER).IntheeventthattheCompanyrequestsPaulLittle not work out his notice period, he will be paid the balance of therequirednoticeperiod,includingtheadditionalsixmonthsTER.
•WheretheCompanygivesPaulLittlenoticeorheresignsandagrees a planned transition to retirement with the Company, any unvested options or rights will, subject to regulatory compliance, remain alive and remain subject to performance hurdles and exerciserequirements.
• Thepayoutofanyannualorlongserviceleavewillbeinlinewithcontractualrequirements.
• AnySTIcomponentrelatingtothecurrentfinancialyearatthe time of cessation, will where appropriate be based on actual performance during that financial year, and if that is not determinable, it will be based on historical achieved STI performance measured over the preceding three-year period.
• TheaboveterminationpaymentsforMrLittlewillnotapplyinthe event that the Company terminates his services due to an event of summary dismissal which would have the effect of being termination without notice or payment in lieu.
• TheExecutiveServiceDeedalsoincorporatesappropriateconfidentiality and non-compete clauses to protect the interests oftheCompanyandtherequirementfortheCompanytoobtainsalary continuance insurance in the event of illness or involuntary incapacityforperiodsexceedingsixmonths.
TerminationpaymentsandtermsfortheotherexecutivesareasperPaulLittle’sconditions,withthefollowingexceptions:• Relevantnoticeperiodsaresixmonthsbytheemployeeand
eighteen months by the company. • Shouldtheexecutiveworkoutthenoticeperiod,noadditionalterminationpaymentsarerequired.
• Thepayoutofanyannualorlongserviceleavewillbeinlinewithcontractualrequirements.
• Indeterminingtherequirednoticeperiodsforallexecutives(including Mr Little) and termination payments embodied in the ExecutiveServiceDeeds,theBoardhadregardtotheexecutive’sservice period prior to entering into the deeds, their contribution to the Company’s growth, shareholder and governance guidelines, as well as the future objectives of the Company and appropriate externaladvice.Havingconsideredallofthesefactors,andtheneedtosecureexecutiveservicesposttherestructure,theBoardconsideredthetermsoftheExecutiveServiceDeedstobebothreasonable and appropriate in the circumstances at that point in time.
For
per
sona
l use
onl
y

35toLL | ANNUAL REPORT 2009
11. Non-Executive Director Remuneration
In line with the fixed remuneration freeze decision applying to senior management, Non-Executive Directors fees, are to be frozen for the year commencing 1 July 2009. The Board adopted this approach in light of its responsibility to the Company’s people, shareholders, customers and other stakeholders.
Non-executivedirectorremunerationcomprisesdirectorfees(inclusiveofcommitteefees),non-monetarybenefitsandsuperannuation.Anaggregatetotalfeecapfornon-executivedirectorsof$1,500,000wasapprovedbyshareholdersatthe2006TollAGM.
Withinthislimit,theBoardannuallyreviewsthefeespayabletonon-executivedirectors,considering:
• individualBoardresponsibilitiesandobligationsoncommittees;• advicefromprofessionaladvisorsregardingfeespayabletonon-executivedirectorsbycomparableorganisations;• whatisappropriatetoattractandretainhighqualitynon-executivedirectors;and• theCompany’srequirementsandtheresponsibilitiesattachedtothesuccessfuldischargeofdirector’sduties.
AstheBoardhasaprincipaloversightresponsibilityofmanagementandToll’slong-termstrategicdirection,non-executivedirectorremunerationisnotlinkedtotheCompany’sshort-termfinancialperformance.Non-executivedirectorsarenotentitledtoperformance-basedremunerationorparticipationintheCompany’sequityincentiveplans.
TolldoesnotoperatearetirementbenefitsprogramforNon-ExecutiveDirectors.
UndertheNon-ExecutiveDirectorSharePlan,Director’shavepreviouslybeenabletosacrificeaproportionoftheirdirectors’feesintoshares,which,subjecttoToll’ssecuritiestradingpolicy,arepurchasedatamarketpriceonasixmonthlybasiswithnoperformancehurdlesinorder tomaintainindependence.TheshareplaniscurrentlyunderreviewinlightoftheFederalGovernmentchangestothetaxationofemployeeequityprograms.Duringthereportingperiod,non-executivedirectorfees(inclusiveofsuperannuationandbeforeanysalarysacrificeintotheshare plan) were based on the following fee schedule effective 1 July 2008 which, due to the director fee freeze, is also effective commencing 1 July 2009:
BoardAudit and Financial Risk
CommitteeRemuneration and Succession
Planning Committee
Chairman $400,0001 $35,000 $20,000
Members $140,000 $12,500 $12,500
1 The Chairman of the Board does not receive any additional payments for his role as chairman or member of any sub committee.
No additional fees are payable in respect of the Nomination and Governance Committee.
For
per
sona
l use
onl
y

36
DIRECTORS’ REPORT ContInued
for the year ended 30 June 2009
Remuneration Report – audited (continued)
12. Remuneraton Tables
Specific remuneration details and percentage splits for fixed remuneration as a percentage of total remuneration, bonus forfeited during the year and percentages of performance based remuneration are detailed below.
Name Year
Short-Term Employee Benefits Post Employment BenefitsTermination
Benefits
Other Long-Term Employee Benefits
Share-based payment
(Accounting Value of Equity Compensation) Total
Fixed remuneration
(not linked to company
performance)Bonus vested during year
Bonus forfeited during year
Value of options as a % to total remuneration
Performance related
remuneration
Salary & Fees $’000
STI4 $’000
Non Monetary Benefits5
$’000
Superannuation contributions
$’000
Leave entitlement
$’000 $’000
$’000
Value of Options6
$’000 $’000 % % % % %
Directors
Non-Executive
Ray Horsburgh 2009 2008
163 239
– –
187 46
50 70
– –
– –
– –
– –
400 355
100 100
– –
– –
– –
– –
Harry Boon 2009 2008
67 –
– –
73 143
20 25
– –
– –
– –
– –
160 168
100 100
– –
– –
– –
– –
Mark Smith 2009 2008
161 39
– –
– 123
14 13
– –
– –
– –
– –
175 175
100 100
– –
– –
– –
– –
Barry Cusack1 2009 2008
53 51
– –
70 60
30 10
– –
– –
– –
– –
153 121
100 100
– –
– –
– –
– –
Frank Ford1 2009 2008
140 65
– –
– –
13 6
– –
– –
– –
– –
153 71
100 100
– –
– –
– –
– –
John Moule2 2008 67 – – 16 – 274 – – 357 100 – – – –
Executive
Paul Little 2009 2008
2,159 2,079
1,555 1,275
51 21
100 100
– –
– –
– –
1,267 1,870
5,132 5,345
45.0 41.2
67.3 59.0
32.7 41.0
24.7 35.0
55.0 58.8
Neil Chatfield3 2009 2008
812 975
952 585
5 31
38 69
962 –
– –
– –
905 900
3,674 2,560
49.5 42.0
77.3 67.0
22.7 33.0
24.6 35.2
50.5 58.0
Total 2009 3,555 2,507 386 265 962 – – 2,172 9,847 – – – – –
Total 2008 3,515 1,860 424 309 – 274 – 2,770 9,152 – – – – –1 Mr Barry Cusack and Mr Frank Ford joined the Board partway through FY08. As such the 2008 details reflect a pro-rated amount.2 Mr John Moule retired on 14 September 2007. The termination payment made to him in relation to 2008 was a payment of entitlement accrued under a
retirement benefits program which was frozen as at 30 June 2003. No current directors have any accrued entitlement.3 Mr Neil Chatfield ceased being KMP on 18 September 2008 and ceased employment on 31 March 2009 following his agreed transition to retirement. The
information above reflects his actual remuneration as well as his actual short-term incentive payments for the FY09 financial year to his cessation date. All paymentsmadetoMrChatfieldwereinlinewithcontractualentitlementsasapprovedbyshareholdersintheextraordinarygeneralmeetingon28May2007.Mr Chatfield received a performance tested pro-rated short-term incentive and a special incentive of $284,000 paid at the end of his transition period. The special incentive paid at the Board’s discretion ensured co-operation, retention, delivery of special projects including refinancing debt facilities in Singapore as wellasassistancetotheActingCFO.DuringthistimeTollconductedanexecutivesearch,internallyandexternally,forasuitablesuccessortoMrChatfield.Theremuneration above reflects his full remuneration for the period to 31 March 2009. Mr Chatfield received no termination payment benefits other than his leave entitlementpayouts.Hisexistingunvestedlong-termincentiveswereallowedtocontinuesubjecttoperformancehurdlesandotherpostcessationconditions.
4 Short Term Incentives: This reflects the STI amounts earned during FY09. The STI for FY09 was approved by the Board on 26 August 2009 and will be paid in September/October2009.NofurtherFY09STIpaymentswillbemadeinfutureyears.AminimumlevelofperformancemustbeachievedbeforeanySTIisawarded.Therefore,theminimumpotentialvalueoftheSTIwhichwasawardedinrespectofFY09wasnil.ThemaximumpotentialvalueofSTIisshowninthe‘RemunerationSummary–FY09’.
5 Non-monetary Benefits: At the time of writing this report Toll continues to evaluate the potential impacts of the Federal Governments proposed changes to EmployeeSharePlans,includingsalaryanddirectorfeesacrificeplans.Tollcontinuestoholdnon-executivedirectorfeesuntilitisdeterminedifthefundsaretobeusedtoacquiresharesorarerefundedtothenon-executivedirectors.
6 Sharebasedpayments:FY09FairValueofoptionsis$1.63perinstrument.Theallocationvaluewas$1.32perinstrument.Theminimumtotalvalueofthegrant,iftheperformanceconditionsarenotmet,isnil.Themaximumvalueofthegranthasbeenestimatedbasedonthefairvalueperinstrumentatthegrantdate.
For
per
sona
l use
onl
y

37toLL | ANNUAL REPORT 2009
Remuneration Report – audited (continued)
12. Remuneraton Tables
Specific remuneration details and percentage splits for fixed remuneration as a percentage of total remuneration, bonus forfeited during the year and percentages of performance based remuneration are detailed below.
Name Year
Short-Term Employee Benefits Post Employment BenefitsTermination
Benefits
Other Long-Term Employee Benefits
Share-based payment
(Accounting Value of Equity Compensation) Total
Fixed remuneration
(not linked to company
performance)Bonus vested during year
Bonus forfeited during year
Value of options as a % to total remuneration
Performance related
remuneration
Salary & Fees $’000
STI4 $’000
Non Monetary Benefits5
$’000
Superannuation contributions
$’000
Leave entitlement
$’000 $’000
$’000
Value of Options6
$’000 $’000 % % % % %
Directors
Non-Executive
Ray Horsburgh 2009 2008
163 239
– –
187 46
50 70
– –
– –
– –
– –
400 355
100 100
– –
– –
– –
– –
Harry Boon 2009 2008
67 –
– –
73 143
20 25
– –
– –
– –
– –
160 168
100 100
– –
– –
– –
– –
Mark Smith 2009 2008
161 39
– –
– 123
14 13
– –
– –
– –
– –
175 175
100 100
– –
– –
– –
– –
Barry Cusack1 2009 2008
53 51
– –
70 60
30 10
– –
– –
– –
– –
153 121
100 100
– –
– –
– –
– –
Frank Ford1 2009 2008
140 65
– –
– –
13 6
– –
– –
– –
– –
153 71
100 100
– –
– –
– –
– –
John Moule2 2008 67 – – 16 – 274 – – 357 100 – – – –
Executive
Paul Little 2009 2008
2,159 2,079
1,555 1,275
51 21
100 100
– –
– –
– –
1,267 1,870
5,132 5,345
45.0 41.2
67.3 59.0
32.7 41.0
24.7 35.0
55.0 58.8
Neil Chatfield3 2009 2008
812 975
952 585
5 31
38 69
962 –
– –
– –
905 900
3,674 2,560
49.5 42.0
77.3 67.0
22.7 33.0
24.6 35.2
50.5 58.0
Total 2009 3,555 2,507 386 265 962 – – 2,172 9,847 – – – – –
Total 2008 3,515 1,860 424 309 – 274 – 2,770 9,152 – – – – –1 Mr Barry Cusack and Mr Frank Ford joined the Board partway through FY08. As such the 2008 details reflect a pro-rated amount.2 Mr John Moule retired on 14 September 2007. The termination payment made to him in relation to 2008 was a payment of entitlement accrued under a
retirement benefits program which was frozen as at 30 June 2003. No current directors have any accrued entitlement.3 Mr Neil Chatfield ceased being KMP on 18 September 2008 and ceased employment on 31 March 2009 following his agreed transition to retirement. The
information above reflects his actual remuneration as well as his actual short-term incentive payments for the FY09 financial year to his cessation date. All paymentsmadetoMrChatfieldwereinlinewithcontractualentitlementsasapprovedbyshareholdersintheextraordinarygeneralmeetingon28May2007.Mr Chatfield received a performance tested pro-rated short-term incentive and a special incentive of $284,000 paid at the end of his transition period. The special incentive paid at the Board’s discretion ensured co-operation, retention, delivery of special projects including refinancing debt facilities in Singapore as wellasassistancetotheActingCFO.DuringthistimeTollconductedanexecutivesearch,internallyandexternally,forasuitablesuccessortoMrChatfield.Theremuneration above reflects his full remuneration for the period to 31 March 2009. Mr Chatfield received no termination payment benefits other than his leave entitlementpayouts.Hisexistingunvestedlong-termincentiveswereallowedtocontinuesubjecttoperformancehurdlesandotherpostcessationconditions.
4 Short Term Incentives: This reflects the STI amounts earned during FY09. The STI for FY09 was approved by the Board on 26 August 2009 and will be paid in September/October2009.NofurtherFY09STIpaymentswillbemadeinfutureyears.AminimumlevelofperformancemustbeachievedbeforeanySTIisawarded.Therefore,theminimumpotentialvalueoftheSTIwhichwasawardedinrespectofFY09wasnil.ThemaximumpotentialvalueofSTIisshowninthe‘RemunerationSummary–FY09’.
5 Non-monetary Benefits: At the time of writing this report Toll continues to evaluate the potential impacts of the Federal Governments proposed changes to EmployeeSharePlans,includingsalaryanddirectorfeesacrificeplans.Tollcontinuestoholdnon-executivedirectorfeesuntilitisdeterminedifthefundsaretobeusedtoacquiresharesorarerefundedtothenon-executivedirectors.
6 Sharebasedpayments:FY09FairValueofoptionsis$1.63perinstrument.Theallocationvaluewas$1.32perinstrument.Theminimumtotalvalueofthegrant,iftheperformanceconditionsarenotmet,isnil.Themaximumvalueofthegranthasbeenestimatedbasedonthefairvalueperinstrumentatthegrantdate.
For
per
sona
l use
onl
y

38
DIRECTORS’ REPORT ContInued
for the year ended 30 June 2009
Remuneration Report – audited (continued)
12. Remuneraton Tables (continued)
Name Year
Short-Term Employee BenefitsPost
Employment BenefitsTermination
Benefits
Other Long-Term Employee Benefits
Share-based payment
(Accounting Value of Equity Compensation) Total
Fixed remuneration
(not linked to company
performance)Bonus vested during year
Bonus forfeited during year
Value of options as a % to total remuneration
Performance related
remuneration
Salary & Fees $’000
STI4 $’000
Non Monetary Benefits
$’000
Superannuation contributions
$’000 $’000 $’000
Value of Options5
$’000 $’000 % % % % %
Executive
John Ludeke 2009 2008
947 898
708 820
22 22
60 100
– –
– –
696 530
2,433 2,370
42.3 43.0
82.5 100
17.5 –
28.6 22.4
57.7 57.0
Stephen Stanley 2009 2008
680 670
416 500
– –
100 50
– –
– –
535 430
1,731 1,650
45.1 43.6
80.0 100
20.0 –
30.9 26.1
54.9 56.4
Bernard McInerney 2009 2008
476 497
216 260
125 57
35 50
– –
– –
334 260
1,186 1,124
53.6 53.8
80.0 100
20.0 –
28.2 23.1
46.4 46.2
David Jackson 2009 2008
570 631
212 750
50 369
100 –
– –
– –
258 200
1,190 1,950
60.5 51.3
80.0 100
20.0 –
21.7 10.3
39.5 48.7
Hugh Cushing1 2009 2008
726 447
222 250
351 53
– 100
– –
– –
258 200
1,557 1,050
69.2 57.1
80.0 100
20.0 –
16.6 19.1
30.8 42.9
WayneHunt1 2009 2008
743 459
226 351
237 200
– –
– –
– –
422 188
1,628 1,198
60.2 55.0
55.1 100.0
44.9 0.0
25.9 15.7
39.8 45.0
Mal Grimmond2 2009 417 198 – 50 – – 116 781 59.8 82.5 17.5 14.9 40.2
Brett Godfrey3 2008 826 471 6 96 – – 962 2,361 39.3 73 27 40.7 60.7
Total 2009 4,559 2,198 785 345 – – 2,619 10,506
Total 2008 4,428 3,402 707 396 – – 2,770 11,703 1 MrHughCushingandMrWayneHuntareexpatriateemployeeswholeadTollGlobalForwardingandTollGlobalLogisticsbusinessesrespectivelyoutofAsia.
Theyreceivedexpatriateallowancesincludingcostoflivingadjustments,housingandmotorvehicleexpensesthatwerepaidbyTollontheirbehalf.Whereapplicable,averageannualexchangerateshavebeenusedtoconvertanyforeigncurrencyamounts.ThecurrencyfluctuationsmeanthattheamountsdisclosedforMrCushingandMrHuntarehigherthantheremunerationfigureswhicharebenchmarkedagainsttheexternalmarket.
2 MrMalGrimmondwasappointedActingCFOon18September2008andactedinthisroleuntil6July2009.3 MrBrettGodfrey,CEOVirginBlue,ceasedbeingaKMPon30June2008.4 Short Term Incentives: This reflects the STI amounts earned during FY09. The STI for FY09 was approved by the Board on 26 August 2009 and will be paid in
September/October2009.NofurtherFY09STIpaymentswillbemadeinfutureyears.AminimumlevelofperformancemustbeachievedbeforeanySTIisawarded.Therefore,theminimumpotentialvalueoftheSTIwhichwasawardedinrespectofFY09wasnil.ThemaximumpotentialvalueofSTIisshowninthe‘RemunerationSummary–FY09’.
5 Sharebasedpayments:FY09FairValueofoptionsis$1.63perinstrument.Theallocationvaluewas$1.32perinstrument.Theminimumtotalvalueofthegrant,iftheperformanceconditionsarenotmet,isnil.Themaximumvalueofthegranthasbeenestimatedbasedonthefairvalueperinstrumentatthegrantdate.
The Group also paid insurance premiums of $666,906 (2008: $659,697) during the year to insure officers of the Group against personal liabilitieswhichmayariseinthecourseoftheperformanceoftheirduties,aswellasprotectingtheGroupitselftotheextentitindemnifiesits directors and officers for such liabilities. The officers of the Group include the Directors, Company Secretary and managers of the Group.
For
per
sona
l use
onl
y

39toLL | ANNUAL REPORT 2009
Remuneration Report – audited (continued)
12. Remuneraton Tables (continued)
Name Year
Short-Term Employee BenefitsPost
Employment BenefitsTermination
Benefits
Other Long-Term Employee Benefits
Share-based payment
(Accounting Value of Equity Compensation) Total
Fixed remuneration
(not linked to company
performance)Bonus vested during year
Bonus forfeited during year
Value of options as a % to total remuneration
Performance related
remuneration
Salary & Fees $’000
STI4 $’000
Non Monetary Benefits
$’000
Superannuation contributions
$’000 $’000 $’000
Value of Options5
$’000 $’000 % % % % %
Executive
John Ludeke 2009 2008
947 898
708 820
22 22
60 100
– –
– –
696 530
2,433 2,370
42.3 43.0
82.5 100
17.5 –
28.6 22.4
57.7 57.0
Stephen Stanley 2009 2008
680 670
416 500
– –
100 50
– –
– –
535 430
1,731 1,650
45.1 43.6
80.0 100
20.0 –
30.9 26.1
54.9 56.4
Bernard McInerney 2009 2008
476 497
216 260
125 57
35 50
– –
– –
334 260
1,186 1,124
53.6 53.8
80.0 100
20.0 –
28.2 23.1
46.4 46.2
David Jackson 2009 2008
570 631
212 750
50 369
100 –
– –
– –
258 200
1,190 1,950
60.5 51.3
80.0 100
20.0 –
21.7 10.3
39.5 48.7
Hugh Cushing1 2009 2008
726 447
222 250
351 53
– 100
– –
– –
258 200
1,557 1,050
69.2 57.1
80.0 100
20.0 –
16.6 19.1
30.8 42.9
WayneHunt1 2009 2008
743 459
226 351
237 200
– –
– –
– –
422 188
1,628 1,198
60.2 55.0
55.1 100.0
44.9 0.0
25.9 15.7
39.8 45.0
Mal Grimmond2 2009 417 198 – 50 – – 116 781 59.8 82.5 17.5 14.9 40.2
Brett Godfrey3 2008 826 471 6 96 – – 962 2,361 39.3 73 27 40.7 60.7
Total 2009 4,559 2,198 785 345 – – 2,619 10,506
Total 2008 4,428 3,402 707 396 – – 2,770 11,703 1 MrHughCushingandMrWayneHuntareexpatriateemployeeswholeadTollGlobalForwardingandTollGlobalLogisticsbusinessesrespectivelyoutofAsia.
Theyreceivedexpatriateallowancesincludingcostoflivingadjustments,housingandmotorvehicleexpensesthatwerepaidbyTollontheirbehalf.Whereapplicable,averageannualexchangerateshavebeenusedtoconvertanyforeigncurrencyamounts.ThecurrencyfluctuationsmeanthattheamountsdisclosedforMrCushingandMrHuntarehigherthantheremunerationfigureswhicharebenchmarkedagainsttheexternalmarket.
2 MrMalGrimmondwasappointedActingCFOon18September2008andactedinthisroleuntil6July2009.3 MrBrettGodfrey,CEOVirginBlue,ceasedbeingaKMPon30June2008.4 Short Term Incentives: This reflects the STI amounts earned during FY09. The STI for FY09 was approved by the Board on 26 August 2009 and will be paid in
September/October2009.NofurtherFY09STIpaymentswillbemadeinfutureyears.AminimumlevelofperformancemustbeachievedbeforeanySTIisawarded.Therefore,theminimumpotentialvalueoftheSTIwhichwasawardedinrespectofFY09wasnil.ThemaximumpotentialvalueofSTIisshowninthe‘RemunerationSummary–FY09’.
5 Sharebasedpayments:FY09FairValueofoptionsis$1.63perinstrument.Theallocationvaluewas$1.32perinstrument.Theminimumtotalvalueofthegrant,iftheperformanceconditionsarenotmet,isnil.Themaximumvalueofthegranthasbeenestimatedbasedonthefairvalueperinstrumentatthegrantdate.
The Group also paid insurance premiums of $666,906 (2008: $659,697) during the year to insure officers of the Group against personal liabilitieswhichmayariseinthecourseoftheperformanceoftheirduties,aswellasprotectingtheGroupitselftotheextentitindemnifiesits directors and officers for such liabilities. The officers of the Group include the Directors, Company Secretary and managers of the Group.
For
per
sona
l use
onl
y

40
DIRECTORS’ REPORT ContInued
for the year ended 30 June 2009
Remuneration Report – audited (continued)
13. Director and Executive Equity Instruments
Equity holdings drive long term shareholder value. Grants provided to executives are detailed below.
Summary of outstanding option grants
Grant year
Number granted
Allocation calculation date
Allocation Value per instrument ($)
First possible vesting date
Exercise price ($) Expiry
Fair Value per instrument ($)1
Number vested as at 30 June 2009 Comments
2009 5,624,759 26 November 2008
1.32 26 November 2011
5.75 5 years: 25 November 2013
1.63 Nil Issued in late June/early July 2009
2009 555,114 26 November 2008
1.32 26 November 2011
5.75 5 years: 25 November 2013
1.63 Nil Issued in April 2009
2008 1,282,500 25 June 2008 1.57 25 June 2011 6.32 5 years: 25 June 2013
1.57 Nil Issued December 2008
2008 3,831,176 11 January 2008 2.53 10 January 2011
10.55 5 years: 10 January 2013
2.53 Nil Issued in February 2008
2007 670,000 4October2006 3.52 26 July 2009 10.29 5 years: 25 July 2011
3.52 Nil IssuedOctober2006
1 AASB2FairValue
For
per
sona
l use
onl
y

41toLL | ANNUAL REPORT 2009
Movements in options in FY09 (number)
Name
Balance at 1 July 2008
(‘000)
Granted in the year as
remuneration (‘000)
Vested in the year
(‘000)
Exercised/sold in the year
(‘000)
Amount paid on exercise per option
(‘000)
Forfeited/lapsed (‘000)
Balance at 30 June 2009
(‘000)
Executive Directors
Paul Little 739 777 – – – – 1,516
Neil Chatfield 356 555 – – – – 911
Total 1,095 1,332 – – – – 2,427
Executives
John Ludeke 209 427 – – – – 636
Stephen Stanley 170 328 – – – – 498
Hugh Cushing 79 158 – – – – 237
Bernard McInerney 103 205 – – – – 308
David Jackson 79 158 – – – – 237
WayneHunt 120 259 – – – – 379
Mal Grimmond 30 71 – – – – 101
Total 790 1,606 – – – – 2,396
Movements in options in FY09 (value)
Name
Balance at 1 July 2008
($‘000)
Granted in the year as
remuneration (at fair value
of $1.63)1
($‘000)
Vested in the year
($‘000)
Exercised/sold in the year
($‘000)
Amount paid on exercise per option
($‘000)
Forfeited/lapsed
($‘000)
Balance at 30 June 2009
($‘000)
Executive Directors
Paul Little 1,870 1,267 – – – – 3,137
Neil Chatfield 900 905 – – – – 1,805
Total 2,770 2,172 – – – – 4,942
Executives
John Ludeke 530 696 – – – – 1,226
Stephen Stanley 430 535 – – – – 965
Hugh Cushing 200 258 – – – – 458
Bernard McInerney 260 334 – – – – 594
David Jackson 200 258 – – – – 458
WayneHunt 188 422 – – – – 610
Mal Grimmond 76 116 – – – – 192
Total 1,884 2,619 – – – – 4,503
1 AASB2FairValue.Allocationvalue(at26November2008)was$1.32perinstrument.For
per
sona
l use
onl
y

42
DIRECTORS’ REPORTfor the year ended 30 June 2009
Remuneration Report – audited (continued) Details of outstanding options
Name Grant
Number granted
(‘000)
Fair value per
instrument ($)2
Exercise price Vested Exercised Lapsed
Balance at 30 June
(‘000)
Executive Directors
Paul Little FY09 777 1.63 5.75 – – – 777
FY08 739 2.53 10.55 – – – 739
Neil Chatfield1 FY09 555 1.63 5.75 – – – 555
FY08 356 2.53 10.55 – – – 356
Executives
John Ludeke FY09 427 1.63 5.75 – – – 427
FY08 209 2.53 10.55 – – – 209
Stephen Stanley FY09 328 1.63 5.75 – – – 328
FY08 170 2.53 10.55 – – – 170
Hugh Cushing FY09 158 1.63 5.75 – – – 158
FY08 79 2.53 10.55 – – – 79
Bernard McInerney FY09 205 1.63 5.75 – – – 205
FY08 103 2.53 10.55 – – – 103
David Jackson FY09 158 1.63 5.75 – – – 158
FY08 79 2.53 10.55 – – – 79
WayneHunt FY09 259 1.63 5.75 – – – 259
FY08 120 1.57 6.32 – – – 120
Mal Grimmond FY09 71 1.63 5.75 – – – 71
FY08 30 2.53 10.55 – – – 30
1 Mr Neil Chatfield’s performance options following Board approval remain alive on cessation of employment and subject to relevant performance hurdles.2 AASB2FairValue.Allocationvalue(at26November2008)was$1.32perinstrument.
Insurance of officersDuring the financial year, the Group paid premiums of $666,906 (2008: $659,697) to insure officers of the Company and related bodies corporate.
The officers of the Group covered by the insurance policy include the directors, Paul Little, Mark Smith, Neil Chatfield, Ray Horsburgh, HarryBoon,BarryCusack,FrankFordandthesecretary,BernardMcInerney.Otherofficerscoveredbythepolicyaredirectorsorsecretariesof controlled entities who are not also directors or secretaries of the Group, past directors of companies within the Group and managers of the Group.
Theliabilitiesinsured,subjecttospecificexclusions,includecostsandexpensesthatmaybeincurredindefendingcivilorcriminalproceedings that may be brought against the officers in their capacity as officers of the Company or a related body corporate.
Indemnification of officersThe Company has agreed to indemnify the directors of the Company and the secretary, and its controlled entities, against all liabilities to another person (other than the Company or a related body corporate) that may arise from their position as directors or secretary of the Companyanditscontrolledentities,exceptwheretheliabilityarisesoutofconductinvolvingalackofgoodfaith.TheagreementstipulatesthattheCompanywillmeetthefullamountofanysuchliabilities,includingcostsandexpenses.
Rounding off TheCompanyisofthekindreferredtoinASICClassOrder98/100dated10July1998(updatedbyCO05/641effective28July2005andCO06/51effective31January2006)andinaccordancewiththatClassOrder,amountsinthefinancialreport,anddirectors’reporthavebeen rounded off to the nearest decimal of a million dollars, unless otherwise stated.
For
per
sona
l use
onl
y
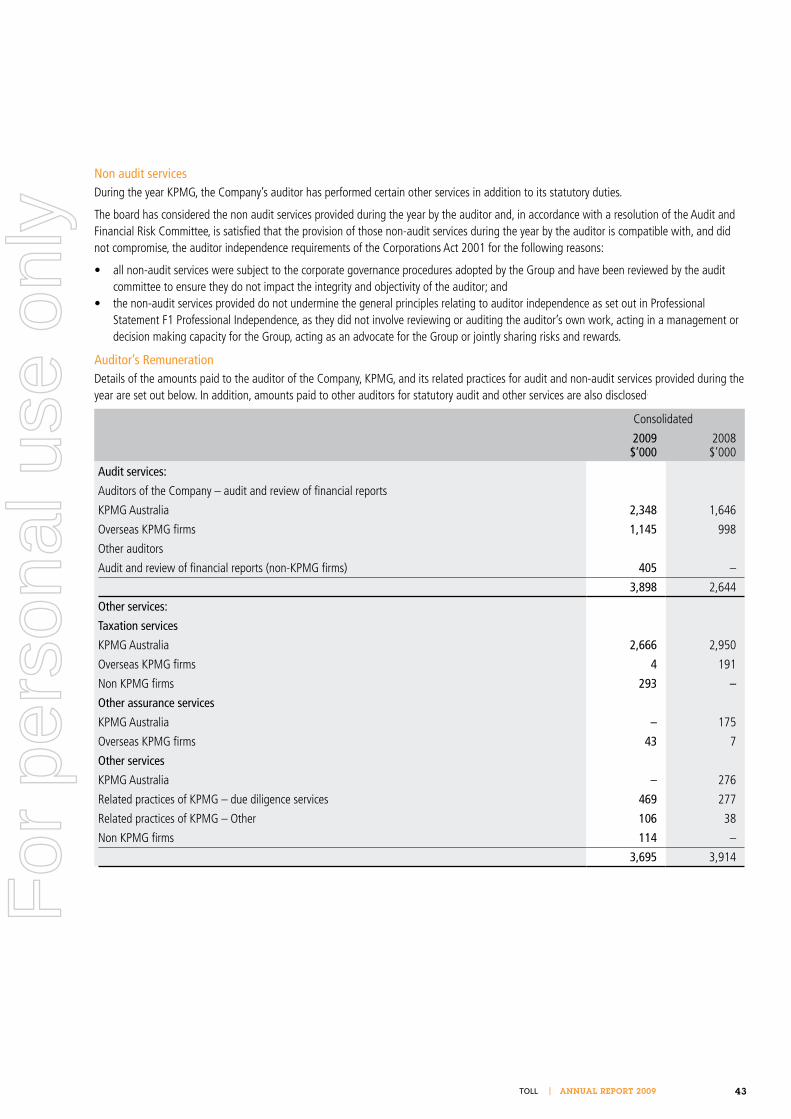
43toLL | ANNUAL REPORT 2009
Non audit servicesDuring the year KPMG, the Company’s auditor has performed certain other services in addition to its statutory duties.
The board has considered the non audit services provided during the year by the auditor and, in accordance with a resolution of the Audit and Financial Risk Committee, is satisfied that the provision of those non-audit services during the year by the auditor is compatible with, and did notcompromise,theauditorindependencerequirementsoftheCorporationsAct2001forthefollowingreasons:
• allnon-auditservicesweresubjecttothecorporategovernanceproceduresadoptedbytheGroupandhavebeenreviewedbytheauditcommittee to ensure they do not impact the integrity and objectivity of the auditor; and
• thenon-auditservicesprovideddonotunderminethegeneralprinciplesrelatingtoauditorindependenceassetoutinProfessionalStatement F1 Professional Independence, as they did not involve reviewing or auditing the auditor’s own work, acting in a management or decision making capacity for the Group, acting as an advocate for the Group or jointly sharing risks and rewards.
Auditor’s RemunerationDetails of the amounts paid to the auditor of the Company, KPMG, and its related practices for audit and non-audit services provided during the year are set out below. In addition, amounts paid to other auditors for statutory audit and other services are also disclosed.
Consolidated
2009 $’000
2008 $’000
Audit services:
Auditors of the Company – audit and review of financial reports
KPMG Australia 2,348 1,646
OverseasKPMGfirms 1,145 998
Otherauditors
Audit and review of financial reports (non-KPMG firms) 405 –
3,898 2,644
Other services:
Taxation services
KPMG Australia 2,666 2,950
OverseasKPMGfirms 4 191
Non KPMG firms 293 –
Other assurance services
KPMG Australia – 175
OverseasKPMGfirms 43 7
Other services
KPMG Australia – 276
Related practices of KPMG – due diligence services 469 277
RelatedpracticesofKPMG–Other 106 38
Non KPMG firms 114 –
3,695 3,914
For
per
sona
l use
onl
y

44
DIRECTORS’ REPORTfor the year ended 30 June 2009
Lead Auditor’s Independence Declaration under Section 307C of the Corporations Act 2001The lead auditors independence declaration is set out on the following page and forms part of the directors’ report for the year ended 30 June 2009..
AuditorKPMG continues in office in accordance with Section 327 of the Corporations Act 2001.
This report is made in accordance with a resolution of the directors.
R Horsburgh P A Little Director Director
Dated at Melbourne this 27th day of August 2009.
Lead Auditor’s Independence Declaration under Section 307C of the Corporations Act 2001To: the directors of Toll Holdings Limited
I declare that, to the best of my knowledge and belief, in relation to the audit for the financial year ended 30 June 2009, there have been:
(i) nocontraventionsoftheauditorindependencerequirementsassetoutintheCorporationsAct2001inrelationtotheaudit;and(ii) no contraventions of any applicable code of professional conduct in relation to the audit.
KPMG
Paul Shannon Partner
Melbourne 27 August 2009F
or p
erso
nal u
se o
nly

45toLL | ANNUAL REPORT 2009
This report outlines the Group’s corporate governance framework. TheASXCorporateGovernanceCouncilhaspreviouslyissuedASXCorporateGovernancePrinciplesandRecommendations.Exceptwhere indicated, the Group’s corporate governance framework isinaccordancewiththerevisedASXCorporateGovernanceCouncil’s Corporate Governance Principles and Recommendations (ASX Guidelines) including the revised Principal 7.
Information on all the charters/terms of reference, and documents and policies referred to in this report are contained on the Group’s website at http://www.tollgroup.com/about_corporategovern.html.
1. Board of Directors
TheBoardischairedbyanindependentNon-ExecutiveDirector.The roles of the Chairman and the Managing Director are separate, and following the resignation from the Board of Mr Neil Chatfield,theManagingDirectoristheonlyExecutiveDirectoronthe Board.
1.1 Board CharterThe Board operates under a formal Charter which details its functions and responsibilities.
In summary:
a) The Board seeks to ensure that it adds value by guiding, assisting and supporting management to achieve the Company’s goals. This includes creating and maintaining a company which in the long term generates sustainable growth and profitability for the benefit of all stakeholders. The Board is committed to abiding by all relevant laws and regulations and to provide employees with a safe and rewarding working environment. It continues to have consideration in its deliberations for the broader community, externalandinternalstakeholdersandtheCompany’sresponsibilities as a corporate citizen of good standing.
b) The Board is responsible for the overall operation and stewardship of the Group and, in particular, is responsible for strategy, risk management, reporting and disclosure, management performance, corporate governance, Board committees and delegation of authority to management. The Board has delegated the day to day management of the Group’s business to management.
c) The Board’s role includes evaluating the performance of the Managing Director, approving criteria for assessing, monitoring and evaluating the performance of senior executives,aswellasundertakinganannualperformancereview of the Board’s own effectiveness.
d) In addition to its regular meetings, the Board’s annual program includes reviews of Company activities and strategies, and Directors participate in visitation of operations aroundtheGroup.Opportunitiesareprovidedbothatandoutside Board meetings for Directors to meet with senior executivesandpersonnel.TheBoardplanstocontinuetheseimportant interactions.
e) Non-ExecutiveDirectorsare,amongstothermatters,advisedof the Board’s Charter in formal letters of appointment to the Board.
1.2 Review of Board and Board Committee PerformanceOnanannualbasis,theChairmandiscussesBoardandCommittee effectiveness with the Board as a whole and with each Director individually, using as a resource, assessments of the competencies of the Board and its Committees contributed to by each Board member at the time. These discussions form the basis for further Board consideration of continuous improvement.
The performance of the Board, Committees and Directors has recently been evaluated with each Director completing a detailed questionnairewhichwassummarised,evaluatedandreportedtothe Board by the Chairman.
1.3 Board Composition Members of the Board bring considerable and wide-ranging competencies to Board considerations. These include skills, experienceandexpertiseininternationalbusiness,globalmanufacturing and sales, product development, major resource industries, railways management, finance and accounting, mergersandacquisitions,generalmanagementplusextensiveexperienceintransportlogisticsmanagementanddevelopment.
The Board’s policy and procedures for the nomination, selection and appointment of Directors can be found on the Group’s website at http://www.tollgroup.com/about_corporategovern.html. The names and further information regarding the skills, experience,qualificationsandrelevantexpertiseoftheDirectorsand secretary are set out in the Directors’ Report.
Details of the Directors, their tenure and attendance at Board and Committee meetings can be found in the Directors’ Report.
The Board’s intention is that it should, at all times, be composed ofamajorityofindependentNon-ExecutiveDirectors,whichincludes the Chairman. The Board met this criterion during the full year under review.
The Board considers that, fundamentally, the independence of Directors is based on their capacity to put the best interests of the Company and its shareholders ahead of all other interests, sothatDirectorsarecapableofexercisingobjectiveindependentjudgement. Capacity to act independently and the skill sets and experienceofindividualDirectorstocomplementtheskillsandexperienceoftheBoardoverallarecriticalcriteriaincandidateselection. The capacity for individual Directors to add value to the Board is very important.
Whenevaluatingcandidates,theBoardhasregardtothepotential for conflicts of interest, whether actual or perceived, and theextentormaterialityoftheseintheongoingassessmentofDirector independence. In this respect, the Board has regard to thedefinitionof“IndependentDirectors”intheASXGuidelines.TheBoarddoesnotbelievethattheexistenceofoneormoreofthe“Relationshipsaffectingindependentstatus”intheASXGuidelines will necessarily result in the relevant Director not being
CORPORATE GOVERNANCE STATEMENTfor the year ended 30 June 2009
For
per
sona
l use
onl
y

46
classified as “independent”, particularly given the Board’s criteria outlined above, and the additional safeguards the Company will seek to implement in order to ensure independence. An overall review of these considerations is conducted by the Board annually, and more often if considered necessary, to determine whether individual Directors are “independent”.
Additional policies, such as Directors not being present during discussions or decision making in matters in which they have or could be seen to potentially have a material conflict of interest, aswellasDirectorsbeingexcludedfromtakingpartintheappointment of third party service providers where the Director has an interest, provide further separation and safeguards for the maintenance of independence.
The Board has previously considered the implementation of a set of pre-determined materiality thresholds in relation to assessing Directorindependence,butdeterminednottoestablishfixedthresholds,believingthat,iftakeninisolationandoutofcontext,these can be misleading and inconclusive. Accordingly, the Board assesses each Director’s independence on an individual basis.
The Board has considered the circumstances of each Director and determinedthatallitsNon-ExecutiveDirectorswereindependentduring the reporting period.
In accordance with the Corporations Act 2001 and the Company’s Constitution, Directors must keep the Board advised, on an ongoing basis, of any interest that could potentially conflict with those of the Company, and any development which may impact the Director’s perceived or actual independence. Procedures are in place for Directors to disclose potential conflicts of interest.
In order to assist Directors in fulfilling their responsibilities, each Director has the right, with the Chairman’s prior approval, to seekindependentprofessionaladviceattheGroup’sexpense.Inaddition,theBoard,andeachcommittee,attheexpenseoftheGroup,mayobtainwhateverprofessionaladviceitrequirestoassist in its work.
1.4 Tenure and RetirementDirectors appointed to casual vacancies during any reporting periodarerequiredtostandforelectionatthenextgeneralmeeting of members.
Directors,excludingtheManagingDirector,arerequiredtoretireand, if available and eligible, are able to stand for re-election at least once every three years.
2. Board Committees
Toassistintheexecutionofitsresponsibilities,theBoardhasestablished a number of Board Committees, comprising the:
a) Nomination and Corporate Governance Committee; b) Audit and Financial Risk Committee; and c) Remuneration and Succession Planning Committee.
These Committees:
a) each have their own written terms of reference, which are reviewed and updated as appropriate;
b) report to the Board on matters attended to by them at the first Board meeting following each Committee meeting;
c) as noted above, are authorised to seek any information theyrequirefromanyofficeroremployeeoftheCompany,and may take such independent professional advice as they consider appropriate;
d) havenoexecutivepowersregardingtheirfindingsandrecommendations; and
e) must have a Chairman and a majority of members as independentNonExecutiveDirectors.
The Board may, at any time, determine to address matters identified within a Committee’s terms of reference at the full Board level.
Details of members and their attendance at committee meetings during the year are set out in the Directors’ Report.
2.1 Nomination and Corporate Governance CommitteeThe Nomination and Corporate Governance Committee is requiredtohavenolessthanthreeDirectors(includingtheManaging Director), the majority of which must be independent Non-ExecutiveDirectors.TheChairmanoftheNominationandCorporate Governance Committee must also be an independent Non-ExecutiveDirector.TheCommitteemeetsasnecessary,andhas met on two occasions during the reporting period.
Membership of the Nomination and Corporate Governance Committee throughout the reporting period comprised the Chairman of the Committee; Ray Horsburgh who was at all times anindependentNon-ExecutiveDirector,allotherindependentNon-ExecutiveDirectorsandtheManagingDirector.
The purpose of the Nomination and Corporate Governance Committee is to assist the Board by:
(a) reviewing the size and composition of the Board and its committees and where necessary making recommendations to the Board;
(b) providing advice to the Board with respect to the necessary and desirable competencies of Directors;
(c) establishing a criteria for membership selection and ensuring the criteria is used in making recommendations to the Board for the appointment and removal of Directors;
(d) in a timely manner, making recommendations to the Board whetherornotDirectors,whosetermofofficeisexpiring,shouldbeproposedforre-electionattheCompany’snextAGM;
(e) developing a policy and procedures for the selection and appointment of Directors;
(f) identifyingindividualswhomaybequalifiedtobecomeDirectors, having regard to such factors as the Committee considers appropriate, including independence, judgement, skill,diversity,experiencewithbusinessandotherorganisations of a comparable size, the interaction of the candidate’sexperiencewiththeexperienceofotherBoard
CORPORATE GOVERNANCE STATEMENT ContInued
for the year ended 30 June 2009
For
per
sona
l use
onl
y
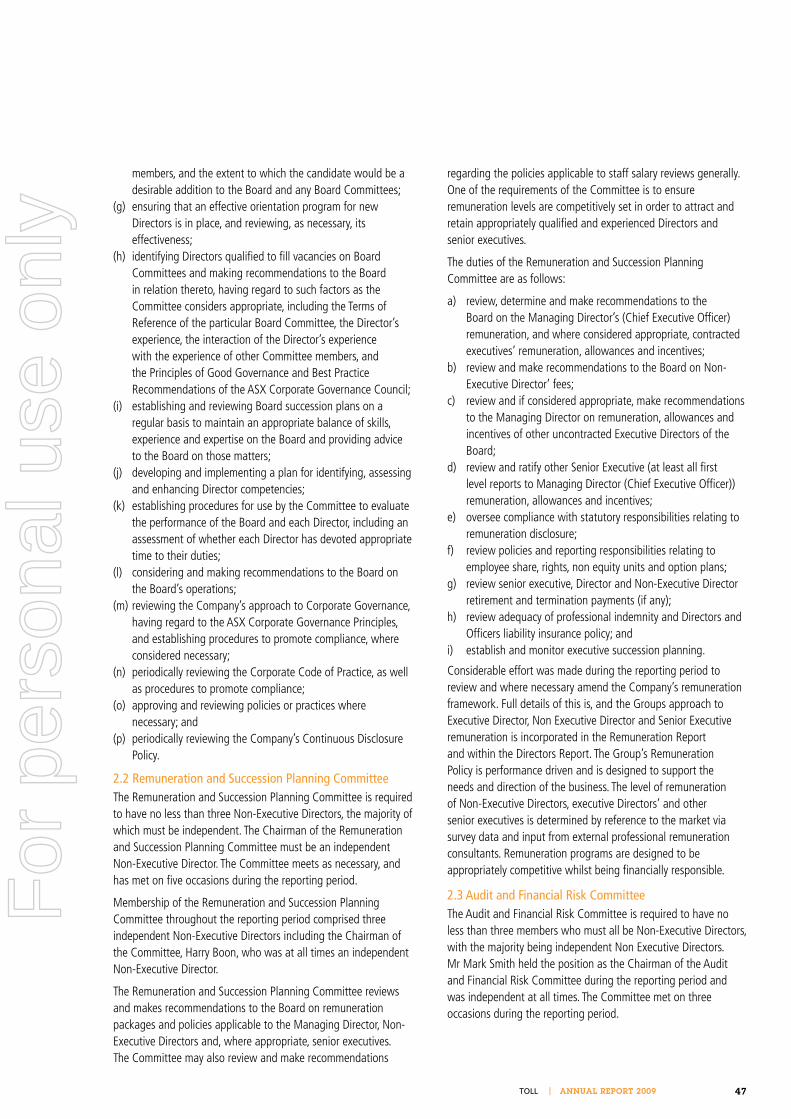
47toLL | ANNUAL REPORT 2009
members,andtheextenttowhichthecandidatewouldbeadesirable addition to the Board and any Board Committees;
(g) ensuring that an effective orientation program for new Directors is in place, and reviewing, as necessary, its effectiveness;
(h) identifyingDirectorsqualifiedtofillvacanciesonBoardCommittees and making recommendations to the Board in relation thereto, having regard to such factors as the Committee considers appropriate, including the Terms of Reference of the particular Board Committee, the Director’s experience,theinteractionoftheDirector’sexperiencewiththeexperienceofotherCommitteemembers,andthe Principles of Good Governance and Best Practice RecommendationsoftheASXCorporateGovernanceCouncil;
(i) establishing and reviewing Board succession plans on a regular basis to maintain an appropriate balance of skills, experienceandexpertiseontheBoardandprovidingadviceto the Board on those matters;
(j) developing and implementing a plan for identifying, assessing and enhancing Director competencies;
(k) establishing procedures for use by the Committee to evaluate the performance of the Board and each Director, including an assessment of whether each Director has devoted appropriate time to their duties;
(l) considering and making recommendations to the Board on the Board’s operations;
(m) reviewing the Company’s approach to Corporate Governance, havingregardtotheASXCorporateGovernancePrinciples,and establishing procedures to promote compliance, where considered necessary;
(n) periodically reviewing the Corporate Code of Practice, as well as procedures to promote compliance;
(o) approving and reviewing policies or practices where necessary; and
(p) periodically reviewing the Company’s Continuous Disclosure Policy.
2.2 Remuneration and Succession Planning CommitteeTheRemunerationandSuccessionPlanningCommitteeisrequiredtohavenolessthanthreeNon-ExecutiveDirectors,themajorityofwhich must be independent. The Chairman of the Remuneration and Succession Planning Committee must be an independent Non-ExecutiveDirector.TheCommitteemeetsasnecessary,andhas met on five occasions during the reporting period.
Membership of the Remuneration and Succession Planning Committee throughout the reporting period comprised three independentNon-ExecutiveDirectorsincludingtheChairmanofthe Committee, Harry Boon, who was at all times an independent Non-ExecutiveDirector.
The Remuneration and Succession Planning Committee reviews and makes recommendations to the Board on remuneration packages and policies applicable to the Managing Director, Non-ExecutiveDirectorsand,whereappropriate,seniorexecutives.The Committee may also review and make recommendations
regarding the policies applicable to staff salary reviews generally. OneoftherequirementsoftheCommitteeistoensureremuneration levels are competitively set in order to attract and retainappropriatelyqualifiedandexperiencedDirectorsandseniorexecutives.
The duties of the Remuneration and Succession Planning Committee are as follows:
a) review, determine and make recommendations to the BoardontheManagingDirector’s(ChiefExecutiveOfficer)remuneration, and where considered appropriate, contracted executives’remuneration,allowancesandincentives;
b) review and make recommendations to the Board on Non-ExecutiveDirector’fees;
c) review and if considered appropriate, make recommendations to the Managing Director on remuneration, allowances and incentivesofotheruncontractedExecutiveDirectorsoftheBoard;
d) reviewandratifyotherSeniorExecutive(atleastallfirstlevelreportstoManagingDirector(ChiefExecutiveOfficer))remuneration, allowances and incentives;
e) oversee compliance with statutory responsibilities relating to remuneration disclosure;
f) review policies and reporting responsibilities relating to employeeshare,rights,nonequityunitsandoptionplans;
g) reviewseniorexecutive,DirectorandNon-ExecutiveDirectorretirement and termination payments (if any);
h) reviewadequacyofprofessionalindemnityandDirectorsandOfficersliabilityinsurancepolicy;and
i) establishandmonitorexecutivesuccessionplanning.
Considerable effort was made during the reporting period to review and where necessary amend the Company’s remuneration framework. Full details of this is, and the Groups approach to ExecutiveDirector,NonExecutiveDirectorandSeniorExecutiveremuneration is incorporated in the Remuneration Report and within the Directors Report. The Group’s Remuneration Policy is performance driven and is designed to support the needs and direction of the business. The level of remuneration ofNon-ExecutiveDirectors,executiveDirectors’andotherseniorexecutivesisdeterminedbyreferencetothemarketviasurveydataandinputfromexternalprofessionalremunerationconsultants. Remuneration programs are designed to be appropriately competitive whilst being financially responsible.
2.3 Audit and Financial Risk CommitteeTheAuditandFinancialRiskCommitteeisrequiredtohavenolessthanthreememberswhomustallbeNon-ExecutiveDirectors,withthemajoritybeingindependentNonExecutiveDirectors. Mr Mark Smith held the position as the Chairman of the Audit and Financial Risk Committee during the reporting period and was independent at all times. The Committee met on three occasions during the reporting period.
For
per
sona
l use
onl
y

48
The Audit and Financial Risk Committee considers any matters relatingtothefinancialaffairsoftheGroupandtheexternalaudit. The Committees’ duties include:
a) monitor compliance with the Corporations Act 2001 and ASXListingRulesandanymattersoutstandingwithauditors,theAustralianTaxationOffice,AustralianSecuritiesandInvestmentsCommission,AustralianSecuritiesExchangeandfinancial institutions;
b) monitor corporate risk assessment and internal controls;c) review and monitor compliance with the Company’s Auditor
Independence Policy;d) liaisewithexternalauditors;e) review the annual audit plan with the auditors;f) review information derived from the audit;g) review half year and full year financial statements;h) review, and where appropriate recommend changes to
accounting policies;i) review effectiveness of internal audit and cross divisional
reviews;j) monitor risks relating to business continuity, disaster recovery,
reputation,currencyexposureandinterestrateexposure;k) review compliance with relevant government regulations;l) assess the performance of financial risk management;m) reviewadequacyofinsurancecoverage;n) recommend to the Board the selection and appointment,
rotation,re-appointmentorreplacementoftheexternalauditors;
o) reviewperformanceandcompensationoftheexternalauditors; and
p) supervise special investigations as directed by the Board.
Meetings are held at least three times a year or as otherwise required,including:
a) atthefinalplanningstageoftheexternalaudit;b) before the issue of the half yearly profit announcement; andc) before the issue of the final profit announcement and
approval of the annual report and accounts.
In carrying out its duties, the Audit and Financial Risk Committee reviews a number of certificates and reports from management on various aspects of the company. This is necessary for the maintenance of a high standard of audit and financial risk management, and is of particular importance when the Committee is considering profit announcements and whether to recommend the annual report and accounts to the Board. Declarations are made by the relevant managers on various aspects of risk and financial management, including:
a) a statement in writing to the Board signed by the Managing DirectorandChiefFinancialOfficercertifyingthattheCompany’s financial reports present a true and fair view, in all material respects, of the Company’s financial condition and operational results and are in accordance with relevant accounting standards. For further detail on this certificate, please see the below section titled “Approach to Risk Management”; and
b) statements on the operation of and compliance with a sound system of risk management and internal compliance and control relating to financial reporting and material business risks, supported by appropriate sign offs from divisional and business unit management.
3. Ethical and Responsible Decision Making
AllDirectors,managersandemployeesareexpectedtoactwith integrity and objectivity, striving at all times to enhance the reputation and performance of the Group. Accordingly, the Group has established policies in order to maintain confidence in the Group’s integrity, encourage compliance with both legal obligationsandstakeholderexpectations,andtoensureallemployees are responsible and accountable to report unethical practices and are protected from recrimination where such reports are made.
The Company has also developed a Toll Disclosure Hotline policy to enable all employees the opportunity to anonymously report unethical or inappropriate behaviour via an independent third party. This Hotline has been implemented within Australia and is to be implemented progressively into all other major jurisdictions in which the Group operates.
The Group’s Code of Practice, which has been in place for several years and is issued to all employees, was supplemented in 2004 withtheCodeofConductforDirectorsandSeniorExecutives.ThisCode was based on a code prepared by the Australian Institute of Company Directors.
Notwithstanding the above policy, employees are encouraged to report unacceptable behaviour to their nominated supervisors.
4. Securities Trading Policy
The Group has in place a detailed securities trading policy.
In summary:
a) allDirectors,executivesandemployeesareprohibitedfrom trading in the Company’s securities, related financial products and derivatives whenever they have price sensitive information which is not generally available; and
b) where paragraph a) above does not apply, trading for Directorsandseniorexecutivesisrestrictedtothesix-weekperiod commencing on the second full trading day following: (i) the release of the half year results; (ii) the release of the full year results;(iii) the release of a disclosure document (e.g. a prospectus)
by the Group;(iv) following the Annual General Meeting; and (v) any other Board sanctioned occasions where price
sensitive information has been released by the Company.
In respect of purchases under the NED Share Plan for Non-ExecutiveDirectors,thesewereonlyabletobemadeduringthesix-weekperiodcommencingonthesecondfulltradingdayfollowing the release of half year and full year results. As a result
CORPORATE GOVERNANCE STATEMENT ContInued
for the year ended 30 June 2009
For
per
sona
l use
onl
y

49toLL | ANNUAL REPORT 2009
of the Federal Governments proposed changes in the treatment of employee share plans, NED Share Plan share purchases have been put on hold until further clarity on the effect on such plans is available.
5. Approach to Risk Management
Good risk management underpins a successful business and is an integral part of the management processes and culture of the Group. The Group embraces the active management of risk by all its employees, supported by clear accountability and performance evaluation,toachievestrategicandbusinessobjectives.Whilsttheacceptance of some risk is necessary to achieving corporate goals, success is derived from the Group’s ability to identify key risks in a timelymannerandimplementappropriatestrategiestomaximisebusiness opportunities, manage uncertainties and minimise potential hazards. By continually evaluating the risk and reward balance, and building risk management into daily activities, the Group’s risk management framework addresses the interests of all stakeholders – including shareholders, customers, suppliers, regulators, employees and members of the public.
The Managing Director is responsible for implementation of the risk management policy and internal compliance and control system. In practice, Divisional Directors are responsible for risk management within their respective divisions. To promote accountability, Divisional Directors delegate day-to-day responsibility for risk management, compliance and control to Business Unit General Managers. This responsibility includes adopting the Group standard approach to designing and implementing a sound system of risk management and internal control that identifies, assesses, monitors, and manages key risks that impact achievement of business objectives. Specialist risk andoccupationalhealthandsafety(OH&S)managerssupportbusiness units in establishing and monitoring risk management processes and awareness within their specialist areas.
The Board, through the Audit and Financial Risk Committee, oversees the establishment, implementation and ongoing review of the Group’s risk management and internal compliance and control system. The internal control system covers strategic, financial, operational and compliance risks. The Audit and Financial Risk Committee also approves the annual program and scopeofBusinessAssuranceandInternalAudit(BA&IA)reviews.The Nomination and Corporate Governance Committee reviews corporate governance practice and relevant Company policies whererequired.
The Board has received and considered the annual certification fromtheManagingDirectorandChiefFinancialOfficerwhichstates that:
a) in their opinion, the Company’s financial records have been properly maintained and the financial reports for the year ended 30 June 2009 present a true and fair view, in all material respects, of the financial position and operational results of the Company and Group and are in accordance
with relevant accounting standards in all material respects and that there are grounds to believe that the Company will be able to pay its debts as and when they become due and payable; and
b) to the best of their knowledge and belief:(i) the statements in (a) above regarding the integrity of
the financial reports are founded on a sound system of risk management and internal compliance and control in relation to financial reporting risks which implements the financial and governance policies adopted by the Board;
(ii) the Group’s risk management and internal compliance and control systems, relating to financial reporting risks for the year ended 30 June 2009, were operating effectively in all material respects, based on the risk management and compliance model adopted by the Group;
(iii) there is a sound system of risk management and internal compliance and control which implements those policies adopted by the Board in relation to other material business risks, and the system is operating effectively in all material respects;
(iv) nothing has come to their attention since 30 June 2009 that would indicate any material change to the statements made in (i), (ii) and (iii) above; and
(v) majority-owned entities and those entities under Toll management control are included for the purposes of this statement.
This certification provides a reasonable level of assurance, however does not imply a guarantee against adverse events or more volatile outcomes arising in the future. The certifications:
a) are supported by a framework of detailed risk management and governance declarations which are signed off by the relevant business unit General Managers, Divisional Directors andselectedCorporate/Groupexecutives;
b) continue to evolve in line with changing business structure, riskandcompliancerequirements;and
c) are thoroughly reviewed and further cross-referenced to the results of other audit and assurance processes (internal andexternal),managementenquiries,businessperformancereporting and specific verification as appropriate.
The certification relating to financial reporting and other material business risks and controls covers the period up to signing the annual financial report.
The Board has also received and is satisfied with the report from management on the Group’s material business risks and the effectiveness of the Company’s management of these risks. Integrated risk management programs aimed at ensuring risks are identified, assessed and appropriately managed, and include regular reports to the Board on the status of business risks. The Audit and Financial Risk Committee also receives reports on financial risks in accordance with its charter, and is further responsible for reviewing the effectiveness of the Group’s risk management and internal control system.
For
per
sona
l use
onl
y

50
As a transport and logistics provider, the Group is focused on managing key business risks that may arise from such matters asOH&S(includingvehicleanddriversafety,andfatiguemanagement), environment and property management, the Fuel TaxCreditsystem,businesscontinuity,managingcustomerserviceandsupplierexpectations,contractualobligations,transportindustry consolidation, financial and capital management, risk financing and insurance, fluctuations in fuel prices and the development and use of information systems and technology. The Group’sapproachtomanagingmanyoftheexistingoperationalandfinancialrisksisoutlinedin‘InternalComplianceandControl’section of this report below.
ThefulltextoftheGroup’scomprehensiveRiskManagementPolicy and Internal Compliance and Control System is set out in the Risk Management Policy Statement in the Corporate Governance section of the Group’s website (www.tollgroup.com – About Toll – Corporate Governance).
5.1 Management of business risks, including the obligations from undertakings provided to the ACCCSome of the more significant emerging business risk areas that must be effectively managed include the Group’s presence and growthintheAsianregion,itsexpansionintoglobalfreightforwardingviatheBALtransacquisition,andsatisfactorycompliance with the ACCC undertakings arising from the demerger of the Asciano group on 15 June 2007. Appropriate resources have been identified and are responsible for monitoring the compliance framework to ensure the Group’s obligations in relation to the ACCC undertakings are satisfied.
As the market is aware, Toll Holdings had given undertakings totheACCContheacquisitionofPatrickCorporation.Theseundertakings were varied to enable the restructure of the Toll Group and the demerger of Asciano Limited (a separate listed entity). The undertakings to the ACCC include obligations designed to ensure that the Toll Group and the Asciano Group are, from the restructure date of 15 June 2007 until 31 March 2011, independent and separate from one another, operate at arm’s length and are not anti-competitive. Toll’s compliance with theseundertakingsisauditedhalfyearlybyanexternalauditfirm.
The undertakings comprise both Director and governance related obligations (such as investment restrictions and Director independence) and corporate obligations (including specific obligations when doing business with Asciano, restrictions on employing Asciano personnel, and specific prohibited business arrangements such as shared services and joint ventures). To ensure Toll is fully compliant with its undertakings, a compliance program has been implemented that addresses both Director and Corporateobligations.A‘TollComplianceManager’and‘AuditManager’ have been appointed to oversee the development and implementation of compliance processes, as well as the ongoing monitoring of adherence to the undertakings. Some specific initiatives undertaken include:
a) ongoing communication and awareness briefings to Toll Directors and Management on the undertakings, their requirementsandcomplianceprocesses;
b) appointmentof‘TollContractManagers’tocoordinateandreview Toll’s business and contract arrangements with specific Asciano entities (such as Pacific National and Patrick Ports);
c) implementation of revised business procedures surrounding drafting and approval of contracts with Asciano, engaging new employees and contractors etc; and
d) internal reporting processes for monitoring compliance.
5.2 Management of Risks to SafetyThe highest priority is placed on the health and safety of all employees, sub-contractors and the general public through a commitmenttoimprovingOH&Sperformance,whichisakeypart of both the overall risk management program and the management of remuneration short term incentives. Specific health and safety risks arise from operating large vehicle fleets and transport assets, manual handling, hazardous goods cartage, conduct of drivers, and ensuring vehicles, operating assets and vesselsaremaintainedinasatisfactorycondition.Anextensivesafety and compliance system which is supported by training is inplaceandissubjecttoregularinternalandexternalauditsandevaluations/Comprehensivevehiclemaintenanceprogramsexistfor company fleets and transport assets. Emergency response strategies have also been implemented across the Group to respond to any unforseen incidents.
Though a continual focus on risk management, the Company has made significant advances in reducing its lost time injury frequencyrateoverthepast8years.Notwithstandingthis,we will continue to strive to maintain this trend and further reduce injuryfrequency.
Lost Time Injury Frequency Rate (LTIFR)
0
10
20
30
40
50
60
Jun-09Jun-08Jun-07Jun-06Jun-05Jun-04Jun-03Jun-02Jun-01
Data for Australia and New Zealand only.
Asanacquisitivecompany,wearewellawareofourresponsibilities to ensure our culture of safety is alive within acquiredbusinessesworldwide.AssuchourGroupRiskmanagement framework evaluates each new business and subsequentlyimplementsappropriatereportingprocedures.
Duringthelastyearunderreview,weintroducedarevisedOH&SPerformance Standard and operating procedures. The Group requirementforthemanagementofOHSriskisthroughthenewlyintroducedGroupwideOHSPerformanceStandardandprocedures. Conformance to these standards and procedures is monitoredthroughinternalandexternalauditandinspections.StringentOH&SauditingisalsoconductedbyNSW,Victoria,
CORPORATE GOVERNANCE STATEMENT ContInued
for the year ended 30 June 2009
For
per
sona
l use
onl
y

51toLL | ANNUAL REPORT 2009
Queensland and South Australia State Governments to enable Toll tomaintainitsWorkersCompensationSelfInsurancelicenses.
The Company also revised and improved its Toll Driver Fatigue ManagementPracticesandtrainingrequirements.
Both of these advancements were achieved following consultation with employees, contractors and other stakeholder representatives.
Unfortunately a strong focus on risk management does not guarantee elimination of serious incidents. During the past year, it is with significant regret that Toll or Toll’s Sub-Contractor vehicles were involved in motor vehicle accidents resulting in 11 fatalities. OurDriverTraining,FatigueManagementandotherDriverManagement Programs have been highly successful in mitigating these risks, however we are unable to manage incidents whereby the actions of others contribute to such instances. All incidents which involve fatalities, injury or near misses are investigated and where appropriate steps are taken to reduce the risk of reoccurrence. Toll also assists its’ drivers, subcontractors and their families with support and counselling through its Chaplaincy Program.
TheCompany’sapproachtoriskmanagement,inparticularOH&Sisattimeacknowledgedexternallythroughnominationforsafetyawards. In the past year, these included:
• TollShippingnominationasafinalistintheSafeWorkAustraliaAwards2008followingimplementationoftheWorkWellLiveWellProgramwhichledtoareductionof45percent in all reportable injuries.
• TollAutoLogistics,Vehicleswasawarded‘AustralianBestPractice Safety Award’ by the Australian Freight Industry and theVictorianWorkSafe‘BestDesignforWorkplaceSafety’Award following development of a vehicle transporter which minimised restricted access when loading and unloading vehicles.
• Tollin2storewasawarded“BestSolutionforPreventingMusculoskeletalDisorders”attheWorkSafeVictoria Awards 2008.
5.3 Risk Management throughout the GroupThrough General Managers, Financial Controllers and business unitriskorOH&Smanagers,GroupRiskManagementassistsdivisions to implement appropriate risk processes and practices. In doing so it promotes the active day-to-day management of risk and ongoing performance improvement. Significant risk matters are also reported on a monthly basis to the Board.
Risk Management throughout the Group is implemented and monitored by Group Risk Management with the assistance of the BusinessAssurance&InternalAudit(BA&IA).
Overall,theGroupRiskManagementfunctionisresponsiblefor:
a) providing technical advice;b) developing risk management policies and procedures; andc) co-ordinating risk reporting to senior management and
theBoardonmatterssuchasOH&S,security,environment,
dangerous goods/hazards, crisis management, business interruption, contracts and insurance.
All material price sensitive changes to the Group’s business risk profile are disclosed to stakeholders in accordance with the Group’s Continuous Disclosure policy.
The Group’s business risk profile is also subject to a formal review as part of the annual strategic and business planning cycle.
TheBA&IAreportstotheAuditandFinancialRiskCommittee,and:
a) independently evaluates the effectiveness and efficiency of selected risk management and internal compliance and control systems;
b) co-ordinatesitsprogramwithotherGroup‘assurance’activitiescoveringOH&S,hazardousgoods,balancesheetintegrity and internal compliance programs;
c) assists in evaluating and monitoring the effectiveness of the Group and Divisional business risk analysis program; and
d) liaises and consults with the Group Risk Management function on selected risk and compliance matters.
5.4 Internal Compliance and Control The strength of the Group’s risk management and internal control frameworkisfoundedonacombinationof‘formal’policies,procedures,reportingandanalysis,aswellas‘informal’controlssuch as management competence, judgement, ethics and values and specific accountability, all of which are actively promoted by senior management.
The Board is responsible for the internal compliance and control framework, whilst recognising that no cost effective internal control system will preclude all errors and irregularities. Selected internal compliance and control mechanisms employed to support the business include:
Business and strategic planning, budgeting and reporting a) A comprehensive business and strategic planning and
budgeting process includes evaluation of strategies, objectives and risks which underpin business strategic plans and an annual budget approved by the Board.
b) Monthly actual performance is reported against budget and revisedforecastsfortheyeararepreparedasrequired.
c) Strategy and business plan performance are monitored by division and business unit, supported by regular senior management forums, and reporting to the Board and Board committees.
Quality and integrity of employees d) TheGroup’squalitymanagementsystem,supportedby
training, development, succession planning and appraisal, requirestheinvolvementandcommitmentofmanagement,employees and subcontractors to ensure continuous improvement and management of risk.
For
per
sona
l use
onl
y

52
e) Currently there are clearly defined accountabilities, performance measures and reinforcement of values and ethics by senior management.
Corporate policies Approved corporate policies address matters such as Code of Practice,TollDisclosureHotline,OH&S,EqualOpportunity,DriverHealth, Compliance, Environment, Drugs and Alcohol, Corporate Governance, Management Performance Review and Development, Continuous Disclosure, Securities Trading Policy, Treasury, Trade Practices and Privacy.
Business systems, procedures and controls Comprehensive financial, business process, project management andITsystemcontrolsandproceduresexistforeachoftheGroup,division and business unit levels.
Investment appraisal a) TheGrouphasdocumentedguidelinesforcapitalexpenditure,
investmentappraisalsandduediligenceforacquisitions.b) These include annual budgets, appraisal against financial
hurdletargets,expenditurereviewproceduresandappropriate levels of authority.
c) Post investment reviews are performed to assess the effectiveness of funds invested in capital assets and business acquisitions.
d) Comprehensive and proven business integration strategies areusedtoderivemaximumvaluefromacquisitions.
Group assurance and monitoring activitiesTheseincludeInternalAudit,specialistauditsofOH&S,environment, and dangerous goods, balance sheet reviews, and Group compliance programs.
6. Communicating with Shareholders
The Group is committed to keeping shareholders fully informed regarding developments and important information affecting the Group. It endeavours to do so using plain language, with transparency and openness.
The Group uses a range of channels to achieve these objectives and continues to seek additional and more effective ways to enhance communications with its shareholders. It aims to provide a level playing field for the provision of information to all shareholders. Information is communicated to shareholders as follows:
a) allmattersrequiringdisclosureorreportingundertheASXListingRulesarecommunicatedtotheASXOnlineAnnouncementsOfficeforimmediatedisseminationtothe market in accordance with the Company’s Continuous Disclosure Policy.
b) the Annual Report is distributed to shareholders who have requesteditinprintedformat.Itisalsoavailableelectronicallyto all shareholders who have registered their email address with the Share Registry, or available via the Group’s website.
c) the Annual General Meeting is the main opportunity for shareholders to hear the Managing Director and Chairman provideupdatesonCompanyperformance,askquestionsoftheBoard,andtoexpressviewsandvoteonthevariousmatters of business on the agenda. Shareholders may also askquestionsoftheCompany’sauditorsatthemeetingregarding the conduct of the audit, preparation and content of the auditor’s report, accounting policies adopted by management and auditor independence. The auditor will also be given reasonable opportunity to answer appropriate writtenquestionsfromshareholders.Shareholdersunabletoattendinpersonmayappointaproxytoattendandvote on their behalf, or they may view the meeting via web cast. In addition, where appropriate, additional meetings of shareholders are held to consider relevant proposals which need to be dealt with outside the time frame of the Annual General Meeting.
d) the Group’s internet website at www.tollgroup.com is regularly updated and provides the following information under the “Shareholder” information section:(i) Information regarding the latest Annual General Meeting,
Proxyvotingresults,NoticeoftheAnnualGeneralMeeting;
(ii) Annual Reports for at least the past 10 years and presentations made to the market regarding annual results;
(iii) Corporate announcements; (iv) Recent significant developments;(v) “TollToday”quarterlynewsletters;(vi) Diary for events of interest to shareholders; and(vii) The live share price of the Company’s ordinary shares
tradingontheASX(withanapproximatedelayof20minutes).
7. Relating to our Stakeholders
Shareholders, employees, customers, suppliers, unions, governments and members of the public may all be affected bytheGroup’scorporatepresencetosomeextent.TheGroupbelieves in openness and transparency within its operations and its relationships with stakeholders. To assist this process, the Group has developed a number of policies which set out what variousgroupsofpeoplemayexpectwhentheyinteractwiththeGroup,andwhereappropriate,whattheGroupexpectsofthem. Detailed summaries of the Group’s policies are available on the company’s website at www.tollgroup.com under the menu selection About Toll – Company Policies, and embrace the following:
a) Code of Practiceb) Compliance c) OccupationalHealthandSafetyd) Environment e) Personal Information Management f) Health Information Management
CORPORATE GOVERNANCE STATEMENT ContInued
for the year ended 30 June 2009
For
per
sona
l use
onl
y

53toLL | ANNUAL REPORT 2009
g) GeneralTermsandConditions–TollWebsiteh) Drugs and Alcohol i) Rehabilitation j) Driver Health k) Dangerous Goods l) Securities Trading
In addition, information on the following matters is accessible under the About Toll – Corporate Governance section of the Group’s website at www.tollgroup.com:
a) Board Charterb) Terms of reference of Board committeesc) Procedure for the selection and appointment of new Directorsd) Securities trading policy e) CodeofconductforDirectorsandseniorexecutivesf) Auditor independence policyg) Continuous disclosure policyh) Communications with shareholdersi) Risk management policy statementj) PerformanceevaluationprocessforBoardandkeyexecutivesk) Codes of conduct with stakeholders
8. Our Community
Throughout the year the Group continued to be the major supporter of the First Step program, responding to the challenges of treating and managing drug addiction and recovery.
The Second Step employment program has also continued to grow and has been launched nation-wide across Australia. The program provides employment opportunities and support for people who are making the transition from incarceration or recovering from drug addiction. This program continues to be highly successful and has helped over 160 people achieve full time employment.
Ourleadingroleinthisinitiativealsoencouragesothercorporatesto be involved in supporting people dealing with what would otherwise be an insurmountable problem.
During 2009 the Group donated over $241,500 in cash to theTollVictorianBushfireAppealandinadditionprovidedsignificant in-kind assistance to support communities struck by thedevastatingbushfiresacrossVictoria,andbythefloodsinthenorthern region of Queensland. Toll’s staff and employees also donatedafurther$241,500totheTollVictorianBushfireAppeal.OvertheyearsTollhasprovidedsignificantsupporttoemergencyreliefandrebuildingeffortsfordisastersexperiencedacrossAustralia and worldwide and will continue to do so.
In addition to the above activities, our employees donate countless hours of volunteer work to local efforts such as country fire authority, or mentoring programs to name a few. WeencourageandsupporttheseeffortsthroughourCommunityPolicy and are proud to assist our employees with their contributions to the organisations and activities they support.
Other Community Programs• TollCharityGolfClassic Established in 2003, the Toll Charity Golf Classic has
successfully raised money for nominated charity’s since its inception. Raising funds against the backdrop of a golf day and the auctioning of donated items, the event has grown largereachyear.TheMake-A-Wishfoundationhasbeenthebeneficiary of the event since its inception, and has to date been in receipt of over $355,000 in funds.
• FoodbankAustralia The Group continued its lead role assisting Foodbank
Australia receive food donations from food and grocery companies, and managed the distribution to over 1,500 accredited welfare agencies around Australia. The program helpstofeedover20,000Australiansdaily.OtherGroupcommunity initiatives include:
• SurfLifeSaving The Group continues to value its association with the Sorrento
Surf Life Saving Club, a relationship which now spans over sixconsecutiveyears.AcrossAustralia,Groupemployeesare involved in supporting the surf movement generally. The Group is grateful for surf life saving clubs around Australia, which help to ensure our beaches are safe for all beach goers.
• TLCforKids The Group is a proud supporter of the TLC for Kids Distraction
BoxProgram.TLCforKidswasestablishedin1998toprovideimmediate distractions and urgent attention to sick children and young people, and provide support to families via a programknownasRAPIDTLC.Over13,500peoplehavedirectly benefited from the services TLC for Kids provides.
• ConvoyforKids The Group is a proud supporter of Convoy for Kids which
assists the welfare of sick or disabled children across the Asian region.
• CancerSupport Across the Asian region, Group businesses continue to
proudly support various Cancer Research groups through various initiatives such as Australia’s Biggest Morning Tea, Shave for a Cure and Swinging for NZ Cancer Society Golf Day.
These are just some of the Group’s community initiatives of which we are proud. Additionally, individual businesses within the Toll Group provide support to local community organisations.
The Group features its involvement with some of the initiatives in ourquarterlymagazineTollTodaywhichcanbeaccessedonourwebsite at www.tollgroup.com under Toll Group Newsletter.
For
per
sona
l use
onl
y

54
9. Greenhouse challenge and energy efficiency opportunities
Toll is well advanced in addressing the challenges which arise as the effects of climate change become more prominent across the world.
Since2006,Tollhasmettherequirementsofthekeygovernmentenvironmental programs and legislation, that will prepare our businesses for carbon trading as part of the Australian Carbon Pollution Reduction Scheme which recognises the global need to reduce greenhouse gases.
In Australia, the focus at Toll for the 2009 financial year was to improve the accuracy of the way in which we report and manage our greenhouse gas (GHG) emissions data. Toll has launched a web based management system, GEMS (Greenhouse Emission Management System for converting all of our GHG emissions andenergyusageintoCO2whichenableustomeasureourcarbon footprint.
Ourfocusonimprovingoperationalefficiencyhasidentifiedmanyaspectsthatimpactfuelusethroughoutourfleet.Vehiclespecifications will continue to be further refined to ensure that the bestfleetinvestmentsareimplementedtomaximisefuelsavingsand return on investment.
Inaddition,Tollwillcontinueexploringtheuseofalternativefuelsandtechnologiesbasedonresearchanddevelopment(R&D)results from its own and international trials. As such the Group’s commitment to the environment includes potential R&Dprojectshavingasignificantimpactonemissionabatementand consideration of agreements and or partnerships with suppliers and customers to improve emission abatement whilst developing a holistic awareness of the transport industry’s environmental impact.
Toll’s ongoing commitment to designing energy efficient depots, warehouses and distribution centres includes trials on improving lighting systems, building design and potential implementation of alternate energy sources such as solar power. In addition, Toll recognisestheneedtomaximisetheuseofrainwaterandseeksto where possible capture multiple facility rain water to supply truck cleaning facilities and toilet flushing systems.
The Group’s primary focus is on reducing operational emissions by improving efficiency in the use of fuel, electricity, waste and waterareasandextendsintooffsettingemissionsprogramswhere greenhouse gas emissions cannot be reasonably reduced, establishing the Group as a more efficient and environmentally friendly operator.
Finally,Tollpreferstoreduceemissionsinplaceofacquiringcarboncreditsthroughtrading.Wewillseekadditionalemissionreduction opportunities to ensure the greatest savings are made to meet our strategic goals and support our customers.
CORPORATE GOVERNANCE STATEMENT ContInued
for the year ended 30 June 2009
For
per
sona
l use
onl
y

55toLL | ANNUAL REPORT 2009
INCOME STATEMENTSfor the year ended 30 June 2009
Consolidated The Company
Note2009
$M2008
$M2009
$M2008
$M
Revenue 5 6,491.5 5,604.5 1.5 1.9
Otherincome 6 22.7 27.0 252.4 566.3
Direct transport and logistics costs (3,354.7) (2,795.9) – –
Repairs and maintenance costs (122.0) (115.4) – –
Employeebenefitsexpense (1,559.0) (1,375.7) (24.5) (25.6)
Fuel, oil and electricity costs (231.0) (250.4) – –
Occupancyandpropertycosts (297.1) (263.8) (5.1) (5.7)
Depreciation and amortisation 7 (192.2) (167.7) (8.7) (8.1)
Otheroperatingcosts (365.8) (276.0) (51.2) (34.4)
Results from operating activities 392.4 386.6 164.4 494.4
Share of profit of associates and joint ventures 35 21.2 5.2 – –
Profit before net financing costs and income tax expense
413.6 391.8 164.4 494.4
Financial income 33.9 35.9 43.1 26.0
Financialexpenses 7 (58.9) (69.0) (9.7) (20.9)
Net financing costs (25.0) (33.1) 33.4 5.1
Profit before income tax expense 388.6 358.7 197.8 499.5
Incometax(expense)/benefit 8 (105.2) (104.4) (5.0) 15.8
Profit from continuing operations 283.4 254.3 192.8 515.3
Discontinued operations
Lossofdiscontinuedoperations(netofincometax) 10 (8.2) (945.1) – (30.3)
Profit/(loss) for the year 275.2 (690.8) 192.8 485.0
Attributable to:
Equityholdersofthecompany 270.3 (694.7) 192.8 485.0
Minority interests 4.9 3.9 – –
Profit/(loss) for the year 275.2 (690.8) 192.8 485.0
Earnings per share:
Basic earnings per share 11 39.95¢ (107.41¢)
Diluted earnings per share 11 39.92¢ (107.41¢)
Continuing operations
Basic earnings per share 11 41.15¢ 38.72¢
Diluted earnings per share 11 41.13¢ 38.70¢
The income statements are to be read in conjunction with the notes to the financial statements set out on pages 59 to 137.
For
per
sona
l use
onl
y

56
Consolidated The Company
Note2009
$M2008
$M2009
$M2008
$M
Foreign currency translation reserve
Foreignexchangetranslationdifferences,netofgain/(loss) on hedges of net investments in foreign subsidiaries 109.2 (100.2) – –
Hedging reserve
Effective portion of changes in fair value of cash flow hedges (24.6) 137.2 – –
Net income recognised directly in equity 84.6 37.0 – –
Profit/(loss) for the year 275.2 (690.8) 192.8 485.0
Total recognised income and expense for the year 359.8 (653.8) 192.8 485.0
Attributable to:
Equityholdersofthecompany 29 352.8 (701.4) 192.8 485.0
Minority interests 29 7.0 47.6 – –
Total recognised income and expense for the year 359.8 (653.8) 192.8 485.0
Theamountsrecogniseddirectlyinequityaredisclosednetoftax.Thestatementsofrecognisedincomeandexpensearetobereadinconjunctionwiththenotesto
the financial statements set out on pages 59 to 137.
STATEMENTS OF RECOGNISED INCOME AND EXPENSESfor the year ended 30 June 2009
For
per
sona
l use
onl
y

57toLL | ANNUAL REPORT 2009
BALANCE SHEETSas at 30 June 2009
Consolidated The Company
Note2009
$M2008
$M2009
$M2008
$M
Current assets
Cashandcashequivalents 13 885.6 354.0 0.2 0.5
Receivables 14 698.3 1,462.2 2,335.4 2,239.5
Inventories 15 43.5 37.1 – –
Assets held for sale 9 – 14.8 – –
Prepayments 50.4 45.8 6.6 4.5
Currenttaxreceivable 2.4 4.4 – –
Otherfinancialassets 16 6.6 56.1 – 11.2
Total current assets 1,686.8 1,974.4 2,342.2 2,255.7
Non current assets
Receivables 14 38.7 22.1 6.2 5.6
Investmentsaccountedforusingtheequitymethod 17 288.2 226.9 – –
Investments 18 1.4 69.6 700.8 700.1
Property,plant&equipment 20 1,397.8 1,197.4 44.6 36.8
Intangible assets 21 1,502.1 1,262.1 23.4 10.3
Deferredtaxassets 8 81.9 73.2 13.6 18.4
Prepayments 12.2 12.8 – –
Otherfinancialassets 16 0.6 1.9 – –
Total non current assets 3,322.9 2,866.0 788.6 771.2
Total assets 5,009.7 4,840.4 3,130.8 3,026.9
Current liabilities
Payables 22 588.7 667.4 21.0 27.5
Interest bearing liabilities 23 403.5 514.8 – 249.6
Currenttaxliabilities 129.0 96.8 94.6 65.1
Provisions 25 237.6 236.2 38.6 45.1
Otherfinancialliabilities 26 19.9 13.5 – 2.0
Total current liabilities 1,378.7 1,528.7 154.2 389.3
Non current liabilities
Interest bearing liabilities 23 843.3 1,106.7 – –
Deferredtaxliabilities 8 32.5 18.2 – –
Provisions 25 112.7 69.2 25.3 25.0
Otherfinancialliabilities 26 42.6 14.5 – –
Total non current liabilities 1,031.1 1,208.6 25.3 25.0
Total liabilities 2,409.8 2,737.3 179.5 414.3
Net assets 2,599.9 2,103.1 2,951.3 2,612.6
Equity
Issued capital 27 2,846.8 2,554.5 2,846.8 2,554.5
Treasury shares 29 (5.7) (7.2) (5.7) (7.2)
Reserves 29 (24.6) (113.3) 8.3 2.2
Retained earnings 29 (256.9) (373.2) 101.9 63.1
Total equity attributable to equity holders of the company 2,559.6 2,060.8 2,951.3 2,612.6
Minority interests 29 40.3 42.3 – –
Total equity 2,599.9 2,103.1 2,951.3 2,612.6
The balance sheets are to be read in conjunction with the notes to the financial statements set out on pages 59 to 137.
For
per
sona
l use
onl
y

58
Consolidated The Company
Note2009
$M2008
$M2009
$M2008
$M
Cash flows from operating activities
Cash receipts in the course of operations 7,289.0 8,962.6 54.5 51.8
Cash payments in the course of operations (6,513.6) (8,074.6) (84.3) (93.0)
Cash generated from operations 775.4 888.0 (29.8) (41.2)
Restructure and integration costs paid (13.6) (49.4) – (38.6)
Deferred compensation payment – (55.9) – (49.2)
Interest received 33.5 78.3 0.1 2.3
Dividends received from associates 8.9 9.9 – –
Dividends received from related parties – – 199.0 517.3
Dividends and distributions received from others 2.6 2.5 – –
Interest paid to holders of reset preference shares (5.7) (15.5) (5.7) (15.5)
Interest and other costs of finance paid (54.9) (126.2) (1.9) (5.4)
Incometaxes(paid)/received (29.8) (22.6) 16.5 6.9
Net cash inflow from operating activities 37 716.4 709.1 178.2 376.6
Cash flows from investing activities
Payment for controlled entities and businesses (net of cash acquired) (48.2) (639.5) (17.1) (154.9)
Paymentforacquisitionofminorityinterest (10.3) (97.1) – –
Paymentforproperty,plantandequipment (341.5) (1,418.7) (46.3) (27.8)
Proceeds on demerger and disposal of entities and businesses (net of cash) 527.6 (619.8) – –
Proceedsfromsaleofproperty,plantandequipment 31.5 52.6 16.7 25.1
Proceeds from sale of associates and other investments 70.6 2.0 23.4 –
Paymentforacquisitionofassociatesandotherinvestments (36.3) (58.7) – –
Loans advanced to other entities (1.7) (4.9) (44.8) (94.0)
Net cash inflow/(outflow) from investing activities 191.7 (2,784.1) (68.1) (251.6)
Cash flows from financing activities
Proceeds from other borrowings 268.8 1,124.7 – –
Repayment of borrowings (554.7) (288.8) – –
Dividends paid to ordinary shareholders (111.5) (129.9) (111.5) (129.9)
Dividends paid to minority interest (3.9) (15.5) – –
Proceeds from share issue 1.1 1.0 1.1 1.0
Net cash inflow/(outflow) from financing activities (400.2) 691.5 (110.4) (128.9)
Net increase/(decrease) in cash held 507.9 (1,383.5) (0.3) (3.9)
Cash at the beginning of the financial year 354.0 1,743.6 0.5 4.4
Effectsofexchangeratefluctuationsonthebalancesofcashheldin foreign currencies 23.7 (6.1) – –
Cash at the end of the financial year 13 885.6 354.0 0.2 0.5
The statements of cash flows are to be read in conjunction with the notes to the financial statements set out on pages 59 to 137.
STATEMENTS OF CASH FLOWSfor the year ended 30 June 2009
For
per
sona
l use
onl
y

59toLL | ANNUAL REPORT 2009
1. Reporting entity
Toll Holdings Limited (the “Company”) is domiciled in Australia. The principal accounting policies which have been adopted in the preparation of this financial report are set out below. These policies have been consistently applied to all the years presented, unless otherwise stated. The financial report includes separate financial statements for the Company as an individual entity and the consolidated entity consisting of the Company and its subsidiaries (together referred to as the “Group”), and the Group’s interest in associates and joint ventures.
2. Basis of preparation
(a) Statement of complianceThe financial report is a general purpose financial report which has been prepared in accordance with Australian Accounting Standards (AASBs) (including Australian Interpretations) adopted by the Australian Accounting Standards Board (AASB) and the Corporations Act 2001. The financial reports of the Group and the Company also comply with International Financial Reporting Standards (IFRSs) and interpretations adopted by the International Accounting Standards Board (IASB).
The financial reports were approved by the Board of Directors on 27 August 2009.
Early adoption of standardsThe Group has elected to early adopt the following accounting standards and amendments:
• AASB2007-6AmendmentstoAustralianAccountingStandards arising from AASB 123 (revised) Borrowing Costs [AASB 1, AASB 101, AASB 107, AASB 111, AASB 116 &AASB138andInterpretations1&12].TherevisionofAASB123necessitatesconsequentialamendmentstothepronouncements listed above. The amendments principally removedreferencestoexpensingborrowingcostsonqualifyingassets,asAASB123wasrevisedtorequiresuchborrowing costs to be capitalised.
• AASB123(revised):BorrowingCosts.AASB123was revisedtorequireborrowingcostsonqualifyingassets to be capitalised.
The Company had used and continued to use the alternative treatment of borrowing costs since AASB 123 was initially adoptedon1July2005.Thealternativetreatmentrequiredthat borrowing costs that are directly attributable to the acquisition,constructionorproductionofaqualifyingassetshallbe capitalised as part of the cost of that asset. The use of the alternative treatment has the effect of adopting the revised AASB 123,andconsequently2007-6.
(b) Basis of measurementThe consolidated financial statements have been prepared on the historicalcostbasisexceptforthefollowing:
• Derivativefinancialinstrumentsaremeasuredatfairvalue.• Availableforsalefinancialassetsaremeasuredatfairvalue.• Assetsclassifiedasheldforsalearemeasuredatthelowerof
carrying value and fair value less costs to sell.• Liabilitiesforcashsettledsharebasedpaymentarrangements
are measured at fair value, based on market conditions.
The methods used to measure the fair values are discussed further in note 3.
(c) Functional and presentation currencyThese consolidated financial statements are presented in Australian dollars, which is the Company’s functional currency and the functional currency of the majority of the Group. The Company isofthekindreferredtoinASICClassOrder98/100dated10July1998andinaccordancewiththatClassOrder,amountsinthefinancial report, and directors’ report have been rounded off to the nearest decimal of a million dollars, unless otherwise stated.
3. Significant accounting policies
The accounting policies set out below have been applied consistently to all periods presented in these consolidated financial statements, and have been applied consistently by Group entities.
(a) Basis of consolidation
(i) SubsidiariesSubsidiariesareentitiescontrolledbytheGroup.Controlexistswhen the Group has the power to govern the financial and operating policies of an entity so as to obtain benefits from its activities. In assessing control, potential voting rights that are currentlyexercisablearetakenintoaccount.
The financial statements of subsidiaries are included in the consolidated financial statements from the date that control commences until the date that control ceases. The accounting policies of subsidiaries have been changed when necessary to align them with the policies adopted by the Group.
Investmentsinsubsidiariesarecarriedattheircostofacquisitionin the Company’s financial statements.
(ii) AssociatesAssociates are those entities in which the Group has significant influence, but not control, over the financial and operating policies.SignificantinfluenceispresumedtoexistwhentheGroupholds between 20 and 50 per cent of the voting power of another entity. The consolidated financial statements includes the Group’s share of the total recognised gains and losses of associates on an equityaccountedbasis,fromthedatethatsignificantinfluencecommencesuntilthedatethatsignificantinfluenceceases.WhentheGroup’sshareoflossesexceedsitsinterestinanassociate,itscarrying amount is reduced to nil and recognition of further losses
NOTES TO THE FINANCIAL STATEMENTSfor the year ended 30 June 2009
For
per
sona
l use
onl
y

60
isdiscontinuedexcepttotheextentthattheGrouphasincurredlegal or constructive obligations or made payments on behalf of an associate.
In the Company’s financial statements, investments in associates arecarriedattheircostofacquisition.
(iii) Joint venturesInterests in joint ventures are accounted for in the consolidated financialstatementsusingtheequitymethodandarecarriedatcostintheCompany’sfinancialstatements.Undertheequitymethod, the share of the profits or losses are recognised in the income statement, and the share of movements in reserves is recognised in reserves in the balance sheet.
(iv) Transactions eliminated on consolidationIntra-groupbalancesandanyunrealisedincomeandexpensesarising from intra-group transactions, are eliminated in preparing the consolidated financial statements.
Unrealised gains arising from transactions with associates and jointlycontrolledentitiesareeliminatedtotheextentoftheGroup’s interest in the entity with adjustments made to the “Investment in associates” and “Share of associates’ net profit” accounts.
Unrealised losses are eliminated in the same way as unrealised gains,butonlytotheextentthatthereisnoevidenceofimpairment. Gains and losses are recognised as the contributed assets are consumed or sold by the associates and jointly controlled entities or, if not consumed or sold by the associate or jointly controlled entity, when the Group’s interest in such entities is disposed of.
(b) Foreign currency
(i) Foreign currency transactionsTransactions in foreign currencies are translated to the respective functionalcurrenciesofGroupentitiesattheforeignexchangerates at the dates of the transactions. Monetary assets and liabilities denominated in foreign currencies at the reporting date aretranslatedtothefunctionalcurrencyattheforeignexchangerate at that date. The foreign currency gain or loss on monetary items is the difference between amortised cost in the functional currency at the beginning of the period, adjusted for effective interest and payments during the period, and the amortised cost inforeigncurrencytranslatedattheexchangerateattheendofthe period. Non-monetary assets and liabilities denominated in foreign currencies that are measured at fair value are retranslated tothefunctionalcurrencyattheexchangerateatthedatethatthe fair value was determined. Foreign currency differences arisingonretranslationarerecognisedinprofitorloss,exceptfordifferencesarisingontheretranslationofavailable-for-saleequityinstruments, a financial liability designated as a hedge of the net investmentinaforeignoperation,orqualifyingcashflowhedges,whicharerecogniseddirectlyinequity.
(ii) Foreign operationsThe assets and liabilities of foreign operations, including goodwill andfairvalueadjustmentsarisingonacquisition,aretranslatedtoAustraliandollarsatforeignexchangeratesatthereportingdate.TheincomeandexpensesofforeignoperationsaretranslatedtoAustraliandollarsatexchangeratesatthedatesofthetransactions. Foreign currency differences are recognised directly inequityintheforeigncurrencytranslationreserve(FCTR)andreleased into the income statement upon disposal of the foreign entity.
Foreignexchangegainsandlossesarisingfromamonetaryitemreceivable from or payable to a foreign operation, the settlement of which is neither planned nor likely in the foreseeable future, are considered to form part of a net investment in a foreign operation andarerecogniseddirectlyinequityintheFCTR.
(iii) Hedge of net investment in foreign operationForeign currency differences arising on the retranslation of a financial liability designated as a hedge of a net investment in a foreignoperationarerecogniseddirectlyinequity,intheFCTR,totheextentthatthehedgeiseffective.Totheextentthatthehedge is ineffective, such differences are recognised in profit or loss.Whenthehedgedpartofanetinvestmentisdisposedof,theassociatedcumulativeamountinequityistransferredtoprofitorloss as an adjustment to the profit or loss on disposal.
(c) Financial instruments
(i) Derivative financial instrumentsThe Group holds derivative financial instruments to hedge its foreigncurrency,interestrateriskandfuelpriceexposures.Embedded derivatives are separated from the host contract and accounted for separately if the economic characteristics and risks of the host contract and the embedded derivative are not closely related, a separate instrument with the same terms as the embedded derivative would meet the definition of a derivative, and the combined instrument is not measured at fair value through profit or loss.
Derivatives are recognised initially at fair value and attributable transaction costs are recognised in profit or loss when incurred. Subsequenttoinitialrecognition,derivativesaremeasuredatfairvalue, and changes therein are accounted for as described below.
Fair value hedgesChanges in the fair value of derivatives that are designated andqualifiedasfairvaluehedgesarerecordedinprofitorloss,together with any changes in the fair value of the hedged asset or liability that are attributable to the hedged risk. The gain or loss relating to the effective portion of interest rate swaps hedging fixedrateborrowingsisrecognisedintheincomestatementasfinanceincomeorfinanceexpensetogetherwiththegainorlossrelating to the ineffective portion and changes in the fair value of thehedgefixedrateborrowingsattributabletointerestraterisk.
If the hedge no longer meets the criteria for hedge accounting, the adjustment to the carrying amount of a hedge item for which
NOTES TO THE FINANCIAL STATEMENTS ContInued
for the year ended 30 June 2009
For
per
sona
l use
onl
y

61toLL | ANNUAL REPORT 2009
the effective interest method is used is amortised to profit or loss over the period to maturity using a recalculated effective interest rate.
Cash flow hedgesChanges in the fair value of the derivative hedging instrument designatedasacashflowhedgearerecogniseddirectlyinequitytotheextentthatthehedgeiseffective.Totheextentthatthehedge is ineffective, changes in fair value are recognised in profit or loss.
If the hedging instrument no longer meets the criteria for hedge accounting,expiresorissold,terminatedorexercised,thenhedge accounting is discontinued prospectively. The cumulative gainorlosspreviouslyrecognisedinequityremainsthereuntiltheforecasttransactionoccurs.Whenthehedgeditemisanon-financialasset,theamountrecognisedinequityistransferredtothe carrying amount of the asset when it is recognised. In other casestheamountrecognisedinequityistransferredtoprofitorloss in the same period that the hedged item affects profit or loss.
Derivatives that do not qualify for hedge accountingCertainderivativeinstrumentsdonotqualifyforhedgeaccounting. Changes in the fair value of any derivative instrument thatdoesnotqualifyforhedgeaccountingarerecognisedimmediately in profit or loss.
(ii) Share capital
Ordinary sharesOrdinarysharesareclassifiedasequity.Incrementalcostsdirectlyattributable to the issue of ordinary shares and share options arerecognisedasadeductionfromequity,netofanytaxeffects.Dividends on ordinary shares are recognised as a liability in the period in which they are declared.
Reset preference sharesReset preference shares are classified as a liability and distributionstoholdersaretreatedasafinancialexpenseintheincome statement.
(iii) Non-derivative financial instrumentsNon-derivative financial instruments comprise, investments in equityanddebtsecurities,tradeandotherreceivables,cashandcashequivalents,loansandborrowings,andtradeandotherpayables.
Non-derivative financial instruments are recognised initially at fair value plus, for instruments not at fair value through profit or loss, anydirectlyattributablecosts.Subsequenttoinitialrecognitionnon-derivative financial instruments are measured as described below.
A financial instrument is recognised if the Group becomes a party to the contractual provisions of the instrument. Financial assets are derecognised if the Group’s contractual rights to the cash flowsfromthefinancialassetsexpireoriftheGrouptransfersthe financial asset to another party without retaining control or substantially all risks and rewards of the asset. Financial liabilities
are derecognised if the Group’s obligations specified in the contractexpireoraredischargedorcancelled.
Cashandcashequivalentscomprisecashbalancesandcalldeposits. Bank overdrafts that are repayable on demand and form an integral part of the Group’s cash management are included as acomponentofcashandcashequivalentsforthepurposeofthestatement of cash flows.
Accountingforfinanceincomeandexpenseisdiscussedinnote3(o)(iv).
Held-to-maturity investmentsIf the Group has the positive intent and ability to hold debt securities to maturity, then they are classified as held-to-maturity. Held-to-maturity investments are measured at amortised cost using the effective interest method, less any impairment losses.
Available-for-sale financial assetsTheGroup’sinvestmentsinequitysecuritiesandcertaindebtsecurities are classified as available-for-sale financial assets. Subsequenttoinitialrecognition,theyaremeasuredatfairvalueand changes therein, other than impairment losses (see note 3(i)(i)),andforeignexchangegainsandlossesonavailable-for-salemonetaryitemsarerecognisedinequityintheavailable-for-salereserve.Whenaninvestmentisderecognised,thecumulativegainorlossinequityistransferredtoprofitorloss.
Financial assets at fair value through profit or lossAn instrument is classified as at fair value through profit or loss if it is held for trading or is designated as such upon initial recognition. Financial instruments are designated at fair value through profit or loss if the Group manages such investments and makes purchase and sale decisions based on their fair value in accordance with the Group’s documented risk management or investment strategy. Upon initial recognition, attributable transaction costs are recognised in profit or loss when incurred. Financial instruments at fair value through profit or loss are measured at fair value, and changes therein are recognised in profit or loss.
OtherOthernon-derivativefinancialinstrumentsaremeasuredatamortised cost using the effective interest method, less any impairment losses.
(d) Fair value estimationThe fair value of financial assets and liabilities must be estimated for recognition and measurement or for disclosure purposes.
The fair value of financial instruments traded in active markets (such as publicly traded derivatives and trading securities) isdeterminedbyreferencetotheirquotedbidpriceatthereporting date. The Group uses a variety of methods and makes assumptionsthatarebasedonmarketconditionsexistingateachreporting date for financial instruments which are not traded inanactivemarket.Quotedmarketpricesordealerquotesforsimilar instruments are used for long term debt instruments held.
For
per
sona
l use
onl
y

62
Othertechniques,suchasestimateddiscountedcash flows, are used to determine the fair value for remaining financial instruments. The fair value of interest rate swaps is calculated as the present value of the estimated future cash flows based on the terms and maturity of each contract and using market rates at the measurementdate.Thefairvalueofforwardexchangecontracts isdeterminedusingforwardexchangemarketratesatthereporting date.
The nominal value less estimated credit adjustments of receivablesandpayablesareassumedtoapproximatetheirfairvalues. The fair value of financial liabilities for disclosure purposes is estimated by discounting the future contractual cash flows at the current market interest rate that is available to the Group for similar instruments.
The fair value of options is measured using the Binomial, Monte Carlo or Black Scholes method taking into account the terms and conditions upon which the options were granted. Service and non-market performance conditions attached to the option are not taken into account in determining fair value.
(e) Property, plant and equipment
Recognition and measurementItemsofproperty,plantandequipmentaremeasuredatcostlessaccumulated depreciation and accumulated impairment losses.
Costincludesexpenditurethatisdirectlyattributabletotheacquisitionoftheasset.Thecostofself-constructedassetincludesthe cost of materials and direct labour, any other costs directly attributable to bringing the asset to a working condition for its intended use, and the costs of dismantling and removing the items and restoring the site on which they are located. Cost also mayincludetransfersfromequityofanygainorlossonqualifyingcash flow hedges of foreign currency purchases of property, plantandequipment.Purchasedsoftwarethatisintegraltothefunctionalityoftherelatedequipmentiscapitalisedaspartofthatequipment.Borrowingcostsrelatedtotheacquisitionorconstructionofqualifyingassetsarecapitalised.
Whenpartsofanitemofproperty,plantandequipmenthavedifferent useful lives, they are accounted for as separate items (majorcomponents)ofproperty,plantandequipment.
Gains and losses on disposal of an item of property, plant andequipmentaredeterminedbycomparingtheproceedsfrom disposal with the carrying amount of property, plant and equipmentandarerecognisednetwithin“otherincome”intheincome statement.
Subsequent costsThe cost of replacing part of an item of property, plant and equipmentisrecognisedinthecarryingamountoftheitemifitisprobable that the future economic benefits embodied within the part will flow to the Group and its cost can be measured reliably. The carrying amount of the replaced part is derecognised. The costsoftheday-to-dayservicingofproperty,plantandequipmentare recognised in profit or loss as incurred.
DepreciationDepreciation is recognised in profit or loss on a straight-line basis over the estimated useful lives of each part of an item of property,plantandequipment.Leasedassetsaredepreciatedover the shorter of the lease term and their useful lives unless it is reasonably certain that the Group will obtain ownership by the end of the lease term. Land is not depreciated.
The estimated useful lives for the current and comparative periods are as follows:
• Buildings 10 – 50 years• Leasehold improvements 2.5 – 40 years•Plantandequipment: Aircraft and aeronautic related assets: 5 – 10 years Base and jetty improvements Shorter of estimated
useful life or lease term
Vessels 10 – 25 years Rolling stock 5 – 30 years Otherplantandequipment 2 – 15 years•Leasedplantandequipment 3 – 12 years
Depreciation methods and useful lives, as well as residual values, are reviewed at each reporting date.
Repairs and maintenance – owned and finance leased assetsRoutine maintenance costs including annual airframe checks are written off to profit or loss as incurred. Major cyclical maintenance on owned aircraft is capitalised to the carrying value of the aircraftasincurredandamortisedovertheperiodtothenextscheduled major maintenance. Any remaining carrying amount of the cost of the previous inspection is derecognised.
(f) Leased assets Leases, the terms of which the Group assumes substantially all the risks and rewards of ownership are classified as finance leases. Upon initial recognition the leased asset is measured at an amountequaltothelowerofitsfairvalueandthepresentvalueoftheminimumleasepayments.Subsequenttoinitialrecognition,the asset is accounted for in accordance with the accounting policy applicable to that asset.
OtherleasesareoperatingleaseswhicharenotrecognisedontheGroup’s balance sheet.
(g) Intangible assets
(i) Goodwill
Business combinationsAll business combinations are accounted for by applying the purchase method. Goodwill represents the difference between the costoftheacquisitionandthefairvalueofthenetidentifiableassetsacquired.
Goodwill is stated at cost less any accumulated impairment losses. Goodwill is allocated to cash-generating units and is tested annually for impairment. In respect of associates, the carrying
NOTES TO THE FINANCIAL STATEMENTS ContInued
for the year ended 30 June 2009
For
per
sona
l use
onl
y

63toLL | ANNUAL REPORT 2009
amount of goodwill is included in the carrying amount of the investment in associate.
Negativegoodwillarisingonanacquisitionisrecogniseddirectlyin profit or loss.
Goodwillarisingontheacquisitionofaminorityinterestinasubsidiaryrepresentstheexcessofthecostoftheadditionalinvestmentoverthecarryingamountofthenetassetsacquiredatthedateofexchange.
(ii) Other intangible assetsOtherintangibleassetsthatareacquiredbyGroup,whichhave finite useful lives, are measured at cost less accumulated amortisation and impairment losses.
(iii) Subsequent expenditureSubsequentexpenditureiscapitalisedonlywhenitincreasesthe future economic benefits embodied in the specific asset to whichitrelates.Allotherexpenditure,includingexpenditureoninternally generated goodwill and brands, is recognised in profit or loss as incurred.
(iv) AmortisationAmortisation is recognised in profit or loss on a straight-line basis over the estimated useful lives of the intangible assets, other than goodwill, from the date that they are available for use.
The estimated useful lives for the current and comparative periods are as follows:
•Software&technology 3 – 5 years
•Customercontracts&relationships 1 – 10 years
•RightofWay 66 years
•Otherintangibles 5 years
(h) InventoriesInventories are measured at the lower of cost and net realisable value. The cost of inventories is based on the first-in-first-out principle, or the weighted average cost formula and includes all costs of purchase, production or conversion costs and other costs incurred in bringing them to their present location and condition. Thecostofinventorymayalsoincludetransfersfromequityofanygainorlossonqualifyingcashflowhedgesofforeigncurrencypurchases of inventory. Net realisable value is the estimated selling price in the ordinary course of business, less the estimated costsofcompletionandsellingexpenses.
(i) Impairment
(i) Financial assetsA financial asset is assessed at each reporting date to determine whether there is any objective evidence that it is impaired. A financial asset is considered to be impaired if objective evidence indicates that one or more events have had a negative effect on the estimated future cash flows of that asset.
An impairment loss in respect of a financial asset measured at amortised cost is calculated as the difference between its carrying amount, and the present value of the estimated future cash flows
discounted at the original effective interest rate. An impairment loss in respect of an available-for-sale financial asset is calculated by reference to its fair value.
Individually significant financial assets are tested for impairment on a individual basis. The remaining financial assets are assessed collectively in groups that share similar credit risk characteristics.
All impairment losses are recognised in profit or loss. Any cumulative loss in respect of an available-for-sale financial asset recognisedpreviouslyinequityistransferredtoprofitorloss.
An impairment loss is reversed if the reversal can be related objectively to an event occurring after the impairment loss was recognised. For financial assets measured at amortised cost and available-for-sale financial assets that are debt securities, the reversal is recognised in profit or loss. For available-for-salefinancialassetsthatareequitysecurities,thereversalisrecogniseddirectlyinequity.
(ii) Non-financial assets The carrying amounts of the Group’s non-financial assets, other than,inventoriesanddeferredtaxassets,arereviewedateachreporting date to determine whether there is any indication ofimpairment.Ifanysuchindicationexiststhentheasset’srecoverable amount is estimated. For goodwill and intangible assets that have indefinite lives or that are not yet available for use, recoverable amount is estimated at each reporting date.
The recoverable amount of an asset or cash-generating unit is the greater of its value in use and its fair value less costs to sell. In assessing value in use, the estimated future cash flows are discountedtotheirpresentvalueusingapre-taxdiscountratethat reflects current market assessments of the time value of money and the risks specific to the asset.
An impairment loss is recognised if the carrying amount of an assetoritscash-generatingunitexceedsitsrecoverableamount.Impairment losses are recognised in profit or loss. Impairment losses recognised in respect of cash-generating units are allocated first to reduce the carrying amount of any goodwill allocated to the units and then to reduce the carrying amount of the other assets in the unit (group of units) on a pro rata basis.
An impairment loss in respect of goodwill is not reversed. In respect of other assets, impairment losses recognised in prior periods are assessed at each reporting date for any indications thatthelosshasdecreasedornolongerexists.Animpairmentloss is reversed if there has been a change in the estimates used to determine the recoverable amount. An impairment loss isreversedonlytotheextentthattheasset’scarryingamountdoesnotexceedthecarryingamountthatwouldhavebeendetermined, net of depreciation or amortisation, if no impairment loss had been recognised.
(j) Non-current assets held for saleNon-current assets (or disposal groups comprising assets and liabilities)thatareexpectedtoberecoveredprimarilythroughsalerather than through continuing use are classified as held for sale.
For
per
sona
l use
onl
y

64
Immediately before classification as held for sale, the assets (or components of a disposal group) are remeasured in accordance with the Group’s accounting policies. Thereafter generally the assets (or disposal group) are measured at the lower of their carrying amount and fair value less cost to sell. Any impairment loss on a disposal group first is allocated to goodwill, and then toremainingassetsandliabilitiesonproratabasis,exceptthatno loss is allocated to inventories, financial assets, deferred taxassets,andemployeebenefitassetswhichcontinuetobemeasured in accordance with the Group’s accounting policies. Impairment losses on initial classification as held for sale and subsequentgainsorlossesonre-measurementarerecognisedinprofitorloss.Gainsarenotrecognisedinexcessofanycumulative impairment loss.
(k) ProvisionsA provision is recognised if, as a result of a past event, the Group has a present legal or constructive obligation that can be estimated reliably, and it is probable that an outflow of economic benefitswillberequiredtosettletheobligation.Provisionsaredeterminedbydiscountingtheexpectedfuturecashflowsatapre-taxratethatreflectscurrentmarketassessmentsofthetimevalue of money and the risks specific to the liability.
(l) Employee benefits
(i) Defined contribution plansA defined contribution plan is a post-employment benefit plan underwhichanentitypaysfixedcontributionsintoaseparateentity and will have no legal or constructive obligation to payfurtheramounts.Obligationsforcontributionstodefinedcontributionplansarerecognisedasapersonnelexpenseinprofitor loss when they are due. Prepaid contributions are recognised asanassettotheextentthatacashrefundorareductioninfuture payments is available.
(ii) Long-term service benefitsThe Group’s net obligation in respect of long-term employee benefits, other than defined benefit plans is the amount of future benefit that employees have earned in return for their service in the current and prior periods plus related on costs; that benefit is discounted to determine its present value, and the fair value of any related assets is deducted. The discount rate is the yield at the reporting date on government bonds that have maturity dates approximatingthetermsoftheGroup’sobligations.
(iii) Share-based payment transactionsThe fair value of options at grant date is recognised as an employeeexpensewithacorrespondingincreaseinequity,overthe period that the employees become unconditionally entitled totheoptions.Theamountrecognisedasanexpenseisadjustedtoreflecttheactualnumberofshareoptionsthatvest,exceptforthose that fail to vest due to market conditions not being met.
(iv) Wages, salaries, annual leave, sick leave and non-monetary benefitsLiabilities for employee benefits for wages, salaries, annual leave andsickleavethatareexpectedtobesettledwithin12monthsof the reporting date represent present obligations resulting from employees’ services provided to reporting date, and are calculated at undiscounted amounts based on remuneration wage and salary ratesthattheGroupexpectstopayasatreportingdateincludingrelated on-costs, such as, workers compensation insurance and payrolltax.Non-accumulatingnon-monetarybenefits,suchasmedical care, housing, cars and free or subsidised goods and services,areexpensedbasedonthenetmarginalcosttotheGroup as the benefits are taken by the employees.
Aliabilityisrecognisedfortheamountexpectedtobepaidundershort-term cash bonus or profit-sharing plans if the Group has a present legal or constructive obligation to pay this amount as a result of past service provided by the employee and the obligation can be estimated reliably.
(v) Termination benefitsTerminationbenefitsarerecognisedasanexpensewhentheGroup is demonstrably committed, without realistic possibility of withdrawal, to a formal detailed plan to either terminate employment before the normal retirement date, or to provide termination benefits as a result of an offer made to encourage voluntary redundancy. Termination benefits for voluntary redundanciesarerecognisedasanexpenseiftheGrouphasmade an offer encouraging voluntary redundancy, it is probable that the offer will be accepted, and the number of acceptances can be estimated reliably.
(vi) Treasury sharesIn1999,theCompanyintroducedanEmployeeShareOwnershipPlan(ESOP).Thisplanallowsnon-recourse,interestfreeloanstobe provided to all employees as the Board may from time to time makeofferstoemployeestoacquiresharesundertheplan.Ifand when an issue is made to employees, it will be treated as an in-substancegrantofoptionsandexpensedintheperiodbecauseof the limited recourse nature of the loans. Since there is no vestingperiod,thereisnorecurringexpenseforthisitem.
Thesharesareacquiredinthenameoftheemployeeandeachemployee authorises and appoints the Secretary of the Company to act on their behalf. Any dividends paid on the shares of the Company are used to repay the loan. If the employee leaves the employment of the Group, the loan balance must be paid in full or the shares will be sold and the proceeds applied to settle the loan balance.
SharesintheCompanyheldunderESOPareclassifiedanddisclosedasTreasurySharesanddeductedfromequity.
NOTES TO THE FINANCIAL STATEMENTS ContInued
for the year ended 30 June 2009
For
per
sona
l use
onl
y

65toLL | ANNUAL REPORT 2009
(m) RevenueRevenue is measured at the fair value of the consideration received or receivable. Amounts disclosed as revenue are net ofreturns,tradeallowances,dutiesandtaxespaid.Revenueisrecognised from major categories as follows:
• Revenuefromservicesprovidedisrecognisedfollowingtheprovision of the service and/or in accordance with agreed contractual terms in the period in which the service is provided;
• Charterhireofvesselsisrecognisedwhentheserviceisprovided;
• Revenuefromsaleofproductsisrecognisedatthetimeofdelivery;
• Revenuefromwarehousingservicesisrecognisedovertheperiod of the contract;
• Otherincomefromthedisposalofproperty,plantandequipmentisrecognisedwhencontrolofthepropertyhaspassed to the buyer;
• Incomefromdividendsanddistributionsarerecognisedwhenthey are declared;
• Rentalrevenueisrecognisedonastraightlinebasisovertheterm of the lease; and
• Internalrechargesarerecognisedastheyareincurredandcharged.
No revenue is recognised if there are significant uncertainties regarding recovery of the consideration due, the costs incurred or to be incurred cannot be measured reliably, there is a risk of return of goods or there is a continuing management involvement with the goods.
(n) Government grantsGrants from the government are recognised at their fair value where there is a reasonable assurance that the grant will be received and that the Group will comply with all attached conditions. These grants are recognised as other income in the income statement.
Government grants relating to costs are deferred and recognised in profit or loss over the period necessary to match them with the costs that they are intended to compensate.
Government grants relating to the purchase of property, plant andequipmentareincludedinnoncurrentliabilitiesasdeferredincome and are credited to profit or loss on straight line basis overtheexpectedlivesoftherelatedassets.
(o) Expenses
(i) Operating lease paymentsPayments made under operating leases are recognised in the profit or loss on a straight-line basis over the term of the lease. Lease incentives received are recognised in profit or loss as an integralpartofthetotalleaseexpenseandspreadovertheleaseterm.
(ii) Finance lease paymentsMinimum lease payments are apportioned between the finance charge and the reduction of the outstanding liability. The finance expenseisallocatedtoeachperiodduringtheleasetermsoasto produce a constant periodic rate of interest on the remaining balance of the liability.
(iii) Borrowing costsBorrowingcostsareexpensedasincurredunlesstheyrelatetoqualifyingassets.Qualifyingassetsareassetswhichtakemorethan 12 months to get ready for their intended use or sale. In these circumstances, borrowing costs are capitalised to the cost oftheassets.Wherefundsareborrowedspecificallyfortheacquisition,constructionorproductionofaqualifyingasset,the amount of borrowing costs capitalised are those incurred in relation to those borrowings, net of any interest earned on those borrowings.Wherefundsareborrowedfortheacquisitionofaqualifyingasset,borrowingcostsarecapitalisedusingaweightedaverage capitalisation rate.
(iv) Finance income and expensesFinance income comprises interest income on funds invested, gains on the disposal of available-for-sale financial assets, changes in the fair value of financial assets at fair value through profit or loss, and gains on hedging instruments that are recognised in profit or loss. Interest income is recognised as it accrues in the income statement, using the effective interest method.
Financeexpensescompriseinterestexpenseonborrowings,unwinding of the discount on provisions, dividends on reset preference shares classified as liabilities, changes in the fair value of financial assets at fair value through profit or loss, impairment losses recognised on financial assets, and losses on hedging instruments that are recognised in the income statement. All interestexpenseonborrowingsisrecognisedintheincomestatement using the effective interest method.
(p) Income taxIncometaxexpensecomprisescurrentanddeferredtax.Incometaxexpenseisrecognisedinprofitorlossexcepttotheextentthatitrelatestoitemsrecogniseddirectlyinequity,inwhichcaseitisrecognisedinequity.
Currenttaxistheexpectedtaxpayableonthetaxableincomefortheyear,usingtaxratesenactedorsubstantivelyenactedatthereportingdate,andanyadjustmenttotaxpayableinrespectofprevious years.
Deferredtaxisrecognisedusingthebalancesheetmethod,providing for temporary differences between the carrying amounts of assets and liabilities for financial reporting purposes andtheamountsusedfortaxationpurposes.Deferredtaxisnot recognised for the following temporary differences: the initial recognition of goodwill, the initial recognition of assets or liabilities in a transaction that is not a business combination andthataffectsneitheraccountingnortaxableprofit,and
For
per
sona
l use
onl
y

66
differences relating to investments in subsidiaries and jointly controlledentitiestotheextentthatitisprobablethattheywillnotreverseintheforeseeablefuture.Deferredtaxismeasuredatthetaxratesthatareexpectedtobeappliedtothetemporarydifferences when they reverse, based on the laws that have been enacted or substantially enacted by the reporting date. Deferred taxassetsandliabilitiesareoffsetifthereisalegallyenforceablerightofoffset,andtheyrelatetoincometaxesleviedbythesametaxauthorityonthesametaxableentity,orondifferenttaxentities,buttheyintendtosettlecurrenttaxliabilitiesandassetsonanetbasisortheirtaxassetsandliabilitieswillberealisedsimultaneously.
Adeferredtaxassetisrecognisedonlytotheextentthatitisprobablethatfuturetaxableprofitswillbeavailableagainstwhichthetemporarydifferencecanbeutilised.Deferredtaxassets are reviewed at each reporting date and are reduced to the extentthatitisnolongerprobablethattherelatedtaxbenefitwill be realised.
Additionalincometaxesthatarisefromthedistributionofdividends are recognised at the same time as the liability to pay the related dividend is recognised.
Tax consolidationThe Company and its wholly-owned Australian resident entities haveformedataxconsolidatedgroupandarethereforetaxedasasingleentityfromthatdate.Theheadentitywithinthetax-consolidated group is Toll Holdings Limited.
Thecurrentanddeferredtaxamountsforthetaxconsolidatedgroup are allocated among the entities in the group using a ‘groupallocationmethod’approach.Deferredtaxassetsanddeferredtaxliabilitiesaremeasuredbyreferencetothecarryingamounts of the assets and liabilities in the Company’s balance sheetandtheirtaxvaluesapplyingundertaxconsolidation.
Anycurrenttaxliabilities(orassets)anddeferredtaxassetsarisingfromunusedtaxlossesofthesubsidiariesareassumedbytheheadentityinthetax-consolidatedgroupandarerecognisedas amounts payable/(receivable) to/(from) other entities in the tax-consolidatedgroupinconjunctionwithanytaxfundingarrangement amounts (refer below). Any difference between theseamountsisrecognisedbytheCompanyasanequitycontribution or distribution.
TheCompanyrecognisesdeferredtaxassetsarisingfromunusedtaxlossesofthetaxconsolidatedgrouptotheextentthatitisprobablethatfuturetaxableprofitsofthetaxconsolidatedgroupwill be available against which the asset can be utilised.
Anysubsequentperiodadjustmentstodeferredtaxassetsarisingfromunusedtaxlossesasaresultofrevisedassessmentsoftheprobability of recoverability is recognised by the head entity only.
Nature of tax funding arrangements and tax sharing agreementsTheheadentity,inconjunctionwithothermembersofthetaxconsolidatedgroup,hasenteredintoataxfundingarrangement
which sets out the funding obligations of members of the taxconsolidatedgroupinrespectoftaxamounts.Eachentityaccounts for its inter-entity assets and liabilities that arise for it under the arrangement. These amounts are treated as arising throughequitycontributionsordistributions,inthesamewayastheheadentity’sassumptionofsubsidiaries’currenttaxamountsandtaxlosses/credits,andthereforealterthenetamountrecognisedastax-consolidationcontributionsbyordistributionstoequityparticipants.However,therewillbenonetcontributionor distribution where the amounts arising for the period under thetaxfundingarrangementequatetotheamountsinitiallyrecognisedbyasubsidiaryforitscurrenttaxesandanytaxlosses/credits assumed by the head entity.
Contributionstofundthecurrenttaxliabilitiesarepayableasperthetaxfundingarrangementandreflectthetimingoftheheadentity’sobligationtomakepaymentsfortaxliabilitiestotherelevanttaxauthorities.
The head entity in conjunction with other members of the tax-consolidatedgroup,hasalsoenteredintoataxsharingagreement.Thetaxsharingagreementprovidesforthedeterminationoftheallocationofincometaxliabilitiesbetweentheentitiesshouldtheheadentitydefaultonitstaxpaymentobligations. No amounts have been recognised in the financial statements in respect of this agreement as payment of any amountsunderthetaxsharingagreementisconsideredremote.
(q) Goods and Services TaxRevenues,expensesandassetsarerecognisednetoftheamountofGoodsandServicesTax(GST),exceptwheretheamountofGSTincurredisnotrecoverablefromtherelevanttaxauthority.Inthese circumstances the GST is recognised as part of the cost of acquisitionoftheassetoraspartofanitemofexpense.
Receivables and payables are stated with the amount of GST included. The net amount of GST recoverable from, or payable to, thetaxauthorityisincludedasacurrentassetorliabilityinthebalance sheet.
Cash flows are included in the statement of cash flows on a gross basis. The GST components of cash flows arising from investing and financing activities, which are recoverable from, or payable to, thetaxauthorityareclassifiedasoperatingcashflows.
(r) Segment reportingA segment is a distinguishable component of the Group that is engaged either in providing related products or services (business segment), or in providing products or services within a particular economic environment (geographical segment), which is subject to risks and returns that are different from those of other segments. Segment information is presented in respect of the Group’s business and geographical segments. The Group’s primary format for segment reporting is based on business segments as determined based on the Group’s management and internal reporting structure.
NOTES TO THE FINANCIAL STATEMENTS ContInued
for the year ended 30 June 2009
For
per
sona
l use
onl
y

67toLL | ANNUAL REPORT 2009
Inter-segment pricing is determined on an arm’s length basis.
Segment results, assets and liabilities include items directly attributable to a segment as well as those that can be allocated on a reasonable basis.
Segmentcapitalexpenditureisthetotalcostincurredduringtheperiodtoacquireproperty,plantandequipment,andintangibleassets other than goodwill.
(s) Earnings per shareThe Group presents basic and diluted earnings per share (EPS) data for its ordinary shares. Basic EPS is calculated by dividing the profit or loss attributable to ordinary shareholders of the Company by the weighted average number of ordinary shares outstanding during the period. Diluted EPS is determined by adjusting the profit or loss attributable to ordinary shareholders and the weighted average number of ordinary shares outstanding for the effects of all dilutive potential ordinary shares, which comprise convertible notes and share options granted to employees.
(t) Discontinued operations A discontinued operation is a component of the Group’s business that represents a separate major line of business or geographical area of operations that has been disposed of or is held for sale, orisasubsidiaryacquiredexclusivelywithaviewtoresale.Classification as a discontinued operation occurs upon disposal or when the operation meets the criteria to be classified as held for sale,ifearlier.Whenanoperationisclassifiedasadiscontinuedoperation, the comparative income statement is restated as if the operation had been discontinued from the start of the comparative period.
(u) Use of estimates and judgements Thepreparationoffinancialstatementsrequiresmanagementto make judgements, estimates and assumptions that affect the application of accounting policies and the reported amounts of assets,liabilities,incomeandexpenses.Actualresultsmaydifferfrom these estimates. Estimates and underlying assumptions are reviewed on an ongoing basis. Revisions to accounting estimates are recognised in the period in which the estimate is revised and in any future periods affected. In particular, information about significant areas of estimation uncertainty and critical judgements in applying accounting policies that have the most significant effect on the amount recognised in the financial statements are described below:
Impairment of goodwill and intangibles with indefinite useful livesThe Group assesses whether goodwill and intangibles with indefinite useful lives are impaired at least annually in accordance with the accounting policy in note 3(i). These calculations involve an estimation of the recoverable amount of the cash-generating units to which the goodwill and intangibles with indefinite useful lives are allocated.
Workers compensation self-insurance provisionsIndependent actuarial valuations are used to estimate the provisionrequiredforworkerscompensationwheretheGroupisself insured.
Financial InstrumentsThe Group enters into financial arrangements to manage exposurestointerestratesandforeigncurrencyrisk.Financialinstruments are recognised as financial assets and financial liabilities of the entity. The fair value of these financial assets and financial liabilities must be estimated for recognition and measurementdisclosurepurposes.Thesecalculationsrequirevaluationtechniquesusingvariousmethodsandassumptions.
Residual ValuesThe estimate of the useful life and depreciable amount of aircraft requirestheuseofassumptionsregardingtheresidualvalueofthe aircraft at the estimated time of disposal. Residual value is estimated based on market estimates of future aircraft values and currentexpectationsoftheaircraftoperations.Asthemarketforaircraft is based on US dollars, residual value estimates are also affectedbyexpectationsoffuturemovementsintheUSdollaragainst the Australian dollar.
Acquisition accountingTheGroup’sfairvaluesoftheassetsandliabilitiesatacquisitionare provisional and subject to review during the period up to twelvemonthsfromacquisitiondate.Theprovisionalfairvaluesare updated to reflect new information that provides better evidenceoffairvaluesatacquisitiondate.
(v) New standards and interpretations not yet adoptedThe following standards, amendments to standards and interpretations have been identified as those which may impact the entity in the period of initial application. They are available for early adoption at 30 June 2009, but have not been applied in preparing this financial report:
• AASB3(revised)Business Combinations. This Standard changestheapplicationofacquisitionaccountingforbusiness combinations and the accounting for non-controlling (minority) interests. Key changes include: the immediateexpensingofalltransactioncosts;measurementofcontingentconsiderationatacquisitiondatewithsubsequentchanges through the income statement; measurement of non-controlling (minority) interests at full fair value or the proportionate share of the fair value of the underlying net assets;guidanceonissuessuchasreacquiredrightsandvendor indemnities; and the inclusion of combinations by contract alone and those involving mutuals. The revised Standard which becomes mandatory for the Group’s 30 June 2010 financial reports, will be applied prospectively and therefore there will be no impact on prior periods in the Group’s 2010 consolidated financial reports.
For
per
sona
l use
onl
y

68
• AASB8Operating Segments introduces the “management approach” to segment reporting. AASB 8, which becomes mandatory for the Group’s 30 June 2010 financial statements, willrequirethedisclosureofsegmentinformationbasedonthe internal reports regularly reviewed by the Group’s Chief OperatingDecisionMakerinordertoassesseachsegment’sperformance and to allocate resources to them. Currently the Group presents segment information in respect of its business and geographical segments (see note 4). The Group does not anticipate any significant changes in implementing this standard.
• AASB101(revised)Presentation of Financial Statements. This Standard introduces a statement of comprehensive income. Otherrevisionsincludeimpactsonthepresentationofitemsinthestatementofchangesinequity,newpresentationrequirementsforrestatementsorreclassificationsofitemsin the financial statements, changes in the presentation requirementsfordividendsandchangestothetitlesofthe financial statements. The revised standard becomes mandatory for the Group’s 30 June 2010 financial reports. Theamendmentsareexpectedtoonlyaffectthepresentationof the Company’s financial report and will not have a direct impact on the measurement and recognition of amounts under the current AASB 101. Retrospective action will be required.
• AASB127(amended) Consolidated and Separate Financial Statements. This Standard changes the accounting for investments in subsidiaries. Key changes include: the re-measurement to fair value of any previous/retained investment when control is obtained/lost, with any resulting gain or loss being recognised in profit or loss; and the treatment of changes in ownership interest by the Group whilemaintainingcontrolastransactionswithequityholdersintheircapacityasequityholders.TheamendmenttotheStandard will become mandatory for the Group’s 30 June 2010 financial reports. The Group has not determined the potential effect of the revised standard on the Group’s financial report.
• AASB2008-1Amendments to Australian Accounting Standard-Share-based Payment: Vesting Conditions and Cancellations clarifies the definition of vesting conditions, introducestheconceptofnon-vestingconditions,requiresnon-vesting conditions to be reflected in grant date fair value and provides accounting treatment for non-vesting conditions and cancellations. AASB 2008-1 becomes mandatory for the Group’s 30 June 2010 financial reports with retrospective application. The Group has not yet determined the potential effect of the amendment on the Group’s financial report.
• AASB2008-5Amendments to Australian Accounting Standards arising from the Annual Improvements Process and 2008-6 Further Amendments to Australian Accounting Standards arising from the Annual Improvements Process affect various AASBs resulting in minor changes for presentation, disclosure and recognition and measurement purposes. The amendments, which become mandatory for the Group’s30June2010financialreports,arenotexpectedtohave any impact on the financial reports.
• AASB2008-7Amendments to Accounting Standards – Cost of an Investment in a Subsidiary, Jointly Controlled Entity or Associate changes the recognition and measurement of dividend receipts as income and addresses the accounting of a newly formed parent entity in the separate financial reports. The amendments become mandatory for the Group’s 30 June 2010 financial reports. The Group has not yet determined the potential effect of the amendments.
• AI16Hedges of a Net Investment in a Foreign Operation clarifies that net investment hedging can only be applied when the net assets of the foreign operation are recognised in the entity’s consolidated financial reports. AI 16 will become mandatory for the Group’s 30 June 2010 financial reportsandisnotexpectedtohaveanyimpactonthefinancial reports..
NOTES TO THE FINANCIAL STATEMENTS ContInued
for the year ended 30 June 2009
For
per
sona
l use
onl
y

69toLL | ANNUAL REPORT 2009
4. Segment Information
The Group comprises the following main business segments, based on the Group’s management reporting system.
Business Segment – 2009
Toll Australia/
NZ $M
Toll Asia $M
Toll Global Forwarding
$MDiscontinued
$MElimination
$MConsolidated
$M
Less Discontinued
Operations $M
Consolidated (Continuing Operations)
$M
Revenue
Operatingsegmentrevenue 4,860.3 723.9 907.3 – – 6,491.5 – 6,491.5
Total Segment Revenue 4,860.3 723.9 907.3 – – 6,491.5 – 6,491.5
Segment result
Segment result 358.8 68.6 17.4 (8.2) – 436.6 8.2 444.8
Share of profit of associates and joint ventures 13.6 7.5 0.1 – – 21.2 – 21.2
Total Segment Result 372.4 76.1 17.5 (8.2) – 457.8 8.2 466.0
Depreciation and amortisation arising fromacquisitionaccounting (5.1) (23.0) (4.7) – – (32.8) – (32.8)
Loss on disposal of investments in listed companies (19.6) – – – – (19.6) – (19.6)
Net financing costs (25.0) – (25.0)
Loss on disposal of discontinued operations – – –
Share of minority interest on discontinued operations – – –
Profit before income tax expense 380.4 8.2 388.6
Incometaxexpense (105.2) – (105.2)
Profit for the year 275.2 8.2 283.4
Depreciation and amortisation 135.3 44.9 12.0 – – 192.2 – 192.2
For
per
sona
l use
onl
y

70
4. Segment Information (continued)
Business Segment – 2008
Toll Australia/
NZ $M
Toll Asia $M
Toll Global Forwarding
$MDiscontinued
$MElimination
$MConsolidated
$M
Less Discontinued
Operations $M
Consolidated (Continuing Operations)
$M
Revenue
Operatingsegmentrevenue 4,641.7 605.2 357.6 2,783.9 – 8,388.4 (2,783.9) 5,604.5
Intersegment revenue – – – 23.3 (23.3) – – –
Total Segment Revenue 4,641.7 605.2 357.6 2,807.2 (23.3) 8,388.4 (2,783.9) 5,604.5
Segment result
Segment result 351.6 61.1 10.9 204.2 – 627.8 (204.2) 423.6
Share of profit of associates and joint ventures 2.9 2.3 – – – 5.2 – 5.2
Total Segment Result 354.5 63.4 10.9 204.2 – 633.0 (204.2) 428.8
Depreciation and amortisation arising fromacquisitionaccounting (7.0) (18.1) (1.5) – – (26.6) – (26.6)
Write-downofinvestment in listed company (10.4) – – – – (10.4) – (10.4)
Net financing costs (61.2) 28.1 (33.1)
Loss on disposal of discontinued operations (1,080.5) 1,080.5 –
Share of minority interest on discontinued operations (36.3) 36.3 –
Profit/(loss) before income tax expense (582.0) 940.7 358.7
Incometaxexpense (108.8) 4.4 (104.4)
Profit /(loss) for the year (690.8) 945.1 254.3
Depreciation and amortisation 125.3 38.6 3.8 172.3 – 340.0 (172.3) 167.7
NOTES TO THE FINANCIAL STATEMENTS ContInued
for the year ended 30 June 2009
For
per
sona
l use
onl
y

71toLL | ANNUAL REPORT 2009
4. Segment Information (continued)
Business Segment – 2009
Toll Australia
/NZ $M
Toll Asia $M
Toll Global Forwarding
$MDiscontinued
$MUnallocated
$MConsolidated
$M
Less: Discontinued
Operations $M
Consolidated (Continuing Operations)
$M
Assets
Segment assets 2,669.1 1,281.8 679.1 – – 4,630.0 – 4,630.0
Investments accounted for using theequitymethod 48.1 239.3 0.8 – – 288.2 – 288.2
Unallocated – – – – 91.5 91.5 – 91.5
Consolidated Total Assets 2,717.2 1,521.1 679.9 – 91.5 5,009.7 – 5,009.7
Liabilities
Segment liabilities 639.1 137.9 161.3 – – 938.3 – 938.3
Unallocated corporate liabilities (principally corporate debt) – – – – 1,471.5 1,471.5 – 1,471.5
Consolidated Total Liabilities 639.1 137.9 161.3 – 1,471.5 2,409.8 – 2,409.8
Acquisitionof Non Current Assets 296.1 72.3 5.4 – – 373.8 – 373.8
Impairment losses on property, plant &equipment 4.1 – – – – 4.1 – 4.1
Impairment losses on receivables 2.4 0.9 3.3 – – 6.6 – 6.6
For
per
sona
l use
onl
y

72
4. Segment Information (continued)
Business Segment – 2008
Toll Australia
/NZ $M
Toll Asia $M
Toll Global Forwarding
$MDiscontinued
$MUnallocated
$MConsolidated
$M
Less: Discontinued
Operations $M
Consolidated (Continuing Operations)
$M
Assets
Segment assets 3,007.3 1,116.6 284.6 – – 4,408.5 – 4,408.5
Investments accounted for usingtheequitymethod 55.8 170.0 1.1 – – 226.9 – 226.9
Unallocated – – – – 205.0 205.0 – 205.0
Consolidated Total Assets 3,063.1 1,286.6 285.7 – 205.0 4,840.4 – 4,840.4
Liabilities
Segment liabilities 837.7 470.0 168.2 – – 1,475.9 – 1,475.9
Unallocated corporate liabilities (principally corporate debt) – – – – 1,261.4 1,261.4 – 1,261.4
Consolidated Total Liabilities 837.7 470.0 168.2 – 1,261.4 2,737.3 – 2,737.3
Acquisitionof Non Current Assets 290.2 45.1 2.8 1,083.0 – 1,421.1 (1,083.0) 338.1
Impairment losses/reversals on receivables (3.5) 0.8 5.6 – – 2.9 – 2.9
Geographical Segments – 2009
Australia/ New Zealand
$MAsia $M
Consolidated $M
Externalrevenuebylocation 5,136.4 1,355.1 6,491.5
Segment assets by location of assets 2,732.1 1,897.9 4,630.0
Acquisitionofnon-currentassets 296.1 77.7 373.8
Geographical Segments – 2008Externalrevenuebylocation 7,556.3 832.1 8,388.4
Segment assets by location of assets 3,475.5 1,364.9 4,840.4
Acquisitionofnon-currentassets 1,374.6 46.5 1,421.1
The Group comprises the following main business segments, based on management reporting systems:
• TollAustralia/NZ–ProviderofintegratedlogisticsservicesinAustraliaandNewZealand• TollAsia–ProviderofintegratedlogisticsservicesandsupplychainmanagementsolutionsinAsia• TollGlobalForwarding–Providerofinternationalfreightforwardingservices
The Group operates in the following geographical segments:
• Australia and New Zealand – comprises operations in all major areas of the transport and logistics sector• Asia–comprisesintegratedlogisticsbusinessesprovidingsupplychainmanagementsolutionsandinternationalfreightforwarding
services in a number of Asian countries.
Inter-segment pricing is determined on an arm’s length basis. Segment results, assets and liabilities include items directly attributable to a segment as well as those that can be allocated on a reasonable basis.
NOTES TO THE FINANCIAL STATEMENTS ContInued
for the year ended 30 June 2009
For
per
sona
l use
onl
y

73toLL | ANNUAL REPORT 2009
5. Revenue
Consolidated The Company
2009
$M2008
$M2009
$M2008
$M
Operating Revenue
Transport and logistics services rendered 6,480.6 5,593.7 0.9 1.1
Other Revenue
Rental revenue 10.9 10.8 0.6 0.8
6,491.5 5,604.5 1.5 1.9
6. Other Income
Consolidated The Company
2009
$M2008
$M2009
$M2008
$M
Dividend Income
– Related parties – – 199.0 517.3
–Otherparties 2.8 2.5 – –
Distribution from trust – – 1.8 2.8
Internal recharges – – 51.6 46.2
Government grants 1.5 1.4 – –
Netforeignexchangegain 8.9 – – –
Net gain on disposal of investments and businesses – 1.7 – –
Netgainondisposalofproperty,plantandequipment 4.8 19.9 – –
Other 4.7 1.5 – –
22.7 27.0 252.4 566.3
For
per
sona
l use
onl
y

74
7. Expenses
Consolidated The Company
2009
$M2008
$M2009
$M2008
$M
Profitbeforeincometaxfromcontinuingoperations includesthefollowingspecificexpenses:
Depreciation
Buildings 9.8 10.1 0.2 0.2
Leasehold improvements 10.5 9.0 0.7 0.5
Plantandequipment 124.6 104.8 6.0 6.8
Leasedplantandequipment 1.0 3.6 – –
145.9 127.5 6.9 7.5
Amortisation
Capitalisedsoftware&technology 13.6 14.2 1.8 0.6
Customercontracts&relationships 28.4 25.5 – –
Otherintangibleassets 4.3 0.5 – –
46.3 40.2 1.8 0.6
Financial expenses
Interest on reset preference shares 5.7 15.5 5.7 15.5
Otherinterestandfinancechargespaid/payable 53.2 53.5 4.0 5.4
58.9 69.0 9.7 20.9
Less: amount capitalised – – – –
58.9 69.0 9.7 20.9
Netforeignexchangelosses – 3.1 – –
Net loss on disposal of investments and businesses 20.1 – – –
Impairment losses
Receivables 6.6 2.9 – –
Property,Plantandequipment 4.1 – – –
Operatingleaseexpense
Property 203.9 124.6 – –
Plantandequipment 71.2 102.7 – –
Definedcontributionsuperannuationexpense 91.5 86.0 9.9 12.0
Shareoptionexpense 6.2 1.9 6.2 1.9
NOTES TO THE FINANCIAL STATEMENTS ContInued
for the year ended 30 June 2009
For
per
sona
l use
onl
y

75TOLL | ANNUAL REPORT 2009
8. Income Tax Expense
Recognised in the income statement
Consolidated The Company
2009
$M2008
$M2009
$M2008
$M
Current tax expense
Current year 98.4 108.5 (9.7) (22.1)
Adjustments for prior years (7.8) (6.6) 9.9 (4.0)
90.6 101.9 0.2 (26.1)
Deferred tax expense
Origination and reversal of temporary differences 14.6 6.9 4.8 2.0
Total income tax expense/(benefit) 105.2 108.8 5.0 (24.1)
Income tax expense/(benefit) from continuing operations 105.2 104.4 5.0 (15.8)
Income tax expense/(benefit) from discontinued operations – 4.4 – (8.3)
Total income tax expense/(benefit) 105.2 108.8 5.0 (24.1)
Numerical reconciliation between tax expense and pre-tax net profit
Profit from continuing operations before income tax expense 388.6 358.7 197.8 499.5
Loss from discontinued operations before income tax expense (8.2) (940.7) – (38.6)
Total profit before tax 380.4 (582.0) 197.8 460.9
Income tax expense/(benefit) using the domestic corporation tax rate of 30% (2008 – 30%) 114.1 (174.6) 59.3 138.3
Increase in tax expense due to:
Non deductible expenditure 27.2 25.8 10.6 4.0
Tax losses not recognised 14.3 2.0 – –
Non-deductible loss upon disposal 2.5 308.1 – –
Decrease in tax expense/(benefit) due to:
Non-assessable inter-company dividend – – (72.6) (155.2)
Other non assessable items (18.5) (21.6) (2.2) (7.2)
Tax exempt income (11.6) (12.2) – –
Utilisation of tax losses not previously recognised – (17.2) – –
Effect of tax rate in foreign jurisdictions (9.7) 6.4 – –
Share of associates net profit (5.3) (1.3) – –
113.0 115.4 (4.9) (20.1)
Under/(over) provision in prior years (7.8) (6.6) 9.9 (4.0)
Income tax expense/(benefit) 105.2 108.8 5.0 (24.1)
Deferred tax recognised directly in equity
Relating to:
– changes in fair value of cash flow hedges (5.0) – – –
– hedge of net investment in foreign subsidiary (35.5) 11.6 – –
(40.5) 11.6 – –
For
per
sona
l use
onl
y

76
NOTEs TO ThE FiNANciAL sTATEmENTs CONTINUED
fOr ThE yEar ENDED 30 JUNE 2009
8. Income Tax Expense (Continued)
Deferred income tax Deferred tax assets and liabilities are attributed to the following:
Consolidated The Company
2009
$M2008
$M2009
$M2008
$M
Deferred tax assets
Receivables – 0.1 – –
Property, plant and equipment 1.8 0.8 0.2 0.2
Payables 24.7 25.5 5.2 10.1
Provisions 70.3 77.4 8.2 10.8
Other financial liabilities 0.6 6.3 – –
Tax losses recognised 2.7 16.9 – –
Set off of tax (see below) (18.2) (53.8) – (2.7)
81.9 73.2 13.6 18.4
Deferred tax liabilities
Receivables 2.6 2.6 – –
Inventories 1.4 1.9 – –
Prepayments 3.7 3.0 – –
Investments – 9.9 – –
Property, plant and equipment 39.6 15.5 – –
Intangible assets 3.1 13.7 – –
Provisions 0.3 1.1 – –
Unrealised foreign exchange – 23.7 – 2.7
Other financial liabilities – 0.6 – –
Set off of tax (see above) (18.2) (53.8) – (2.7)
32.5 18.2 – –
On 1 July 2006 Patrick Corporation Limited and its wholly owned subsidiaries (the ‘Patrick Group’) joined the Toll Holdings Limited Tax Consolidated Group (the ‘Toll Group’). As a result of the acquisition of the Patrick Group, the Toll Group also acquired the Pacific National Tax Consolidated Group (the ‘PN Group’), headed by Pacific National Limited.
In accordance with the tax consolidation rules, on 1 July 2006, both the PN Group and Patrick Group transferred their group losses (revenue and/or capital) to the Toll Group. These losses totalled $174.6 million and represented a combination of capital losses and transferred tax losses (‘loss bundles’).
The continuing legislative compliance requirements in respect to the utilisation of these losses are complex and accordingly no tax benefit with respect to these transferred losses has been recognised. The total amount of unutilised tax losses at 30 June 2009 was $128.0m. There are further unutilised capital and revenue losses within the Toll Group of $70.6m for which no tax benefit has been recognised.
At 30 June 2009, a deferred tax liability of $7.1m for temporary differences of $23.9m, relating to investments in associates, was not recognised because it is probable the temporary differences will not reverse in the foreseeable future and the Group has sufficient influence over the timing of the reversal of the temporary differences. F
or p
erso
nal u
se o
nly

77TOLL | ANNUAL REPORT 2009
9. Assets held for Sale
Consolidated Company
2009
$M2008
$M2009
$M2008
$M
Land and buildings – 14.8 – –
– 14.8 – –
10. Acquisitions and Disposals
(a) Acquisitions
BALtransIn December 2007, the Group launched a full takeover for BALtrans Holdings Limited (‘BALtrans’), a China-based Group operating in freight forwarding and logistics sectors with an international network spanning all major cities in Asia, North America, Europe, Africa and the Middle East.
The Group gained majority ownership in BALtrans on 12 February 2008 and moved to 100% ownership in March 2008.
The acquisition had the following effect on the Group’s assets and liabilities:
Provisional fair values on
acquisition $M
Fair value adjustments
$M
Final balance recognised
$M
Cash and cash equivalents 43.0 – 43.0
Receivables 129.7 – 129.7
Property, plant & equipment 15.5 7.4 22.9
Intangible assets 48.7 (20.9) 27.8
Other assets 15.6 – 15.6
Payables (98.2) – (98.2)
Interest bearing liabilities (36.5) – (36.5)
Provisions (6.3) (45.3) (51.6)
Current tax payable (4.1) – (4.1)
Other liabilities (13.0) (5.8) (18.8)
Net identifiable assets acquired 94.4 (64.6) 29.8
Goodwill on acquisition 258.6 64.6 323.2
Net cash outflow 353.0 – 353.0
The Group has finalised the fair values of assets and liabilities acquired. Movement since the prior period results from clarification of preliminary carrying values.
For
per
sona
l use
onl
y

78
NOTEs TO ThE FiNANciAL sTATEmENTs CONTINUED
fOr ThE yEar ENDED 30 JUNE 2009
10. Acquisitions and Disposals (continued)
(a) Acquisitions (continued)
Sembawang KimtransIn June 2007, the Group launched a full takeover for Sembawang Kimtrans Limited (‘Sembawang Kimtrans’), a Singapore-based Group operating in the marine and mining logistics sectors as well as in warehousing and distribution services. The Group already held approximately 26% of Sembawang Kimtrans before the offer.
The Group gained majority ownership in Sembawang Kimtrans on 2 July 2007 and moved to 100% ownership in October 2007.
The acquisition had the following effect on the Group’s assets and liabilities:
Recognised values on
acquisition $M
Fair value adjustments
$M
Final balance recognised
$M
Cash and cash equivalents 4.7 – 4.7
Receivables 20.6 – 20.6
Investments accounted for using the equity method 0.5 – 0.5
Inventories 0.6 – 0.6
Property, plant & equipment 113.7 1.9 115.6
Intangibles – 5.1 5.1
Other assets 2.7 – 2.7
Payables (21.8) – (21.8)
Interest bearing liabilities (35.7) – (35.7)
Provisions (0.6) – (0.6)
Current tax payable (0.2) – (0.2)
Deferred tax liability – (1.4) (1.4)
Other liabilities (2.6) – (2.6)
Net identifiable assets acquired 81.9 5.6 87.5
Minority interests (0.7) – (0.7)
Existing carrying value of Sembawang Kimtrans (associate) (43.2) – (43.2)
Goodwill on acquisition 149.1 (5.6) 143.5
Net cash outflow 187.1 – 187.1
Toll NZIn September 2007, the Group moved to 100% ownership of Toll NZ Limited after it acquired the remaining 15.8% of shares that it did not own. Toll NZ Limited has subsequently been de-listed from the New Zealand Stock Exchange.
The total cost to acquire the minority interests in Toll NZ Limited was $85.8m and resulted in goodwill of $35.2m recognised on the balance sheet.
For
per
sona
l use
onl
y

79TOLL | ANNUAL REPORT 2009
10. Acquisitions and Disposals (continued)
(b) Discontinued Operations Effective 30 June 2008, the rail and ferry operations in New Zealand were sold to the New Zealand Crown for NZ$690m equity value. Also, effective 30 June 2008, the directors authorised the payment of a special (in specie distribution) dividend of Virgin Blue shares to Toll shareholders. As a result, Virgin Blue became a discontinued operation of the Toll Group on that date.
Profit and loss attributable to discontinued operations were as follows:
Consolidated
2009
$M2008
$M
Results of discontinued operations
Revenue – 2,783.9
Other income – 18.0
Expenses (8.2) (2,625.8)
Results from operating activities (8.2) 176.1
Income tax expense – (53.9)
Results from operating activities, net of income tax (8.2) 122.2
Loss on disposal of discontinued operations and demerger (net of transaction costs)* – (1,080.5)
Share of minority interest on discontinued operations – (36.3)
Income tax benefit associated with disposal – 49.5
Loss for the period (8.2) (945.1)
Basic loss per share (1.21¢) (146.13¢)
Diluted loss per share (1.21¢) (146.13¢)
Cash flows from discontinued operations
Net cash from operating activities – 369.2
Net cash from investing activities 527.6 (1,034.2)
Net cash from financing activities – 533.0
Net cash from/(used in) discontinued operations 527.6 (132.0)
* Includes additional costs associated with demerger of Asciano
For
per
sona
l use
onl
y

80
NOTEs TO ThE FiNANciAL sTATEmENTs CONTINUED
fOr ThE yEar ENDED 30 JUNE 2009
10. Acquisitions and Disposals (continued)
(b) Discontinued Operations (continued)
Consolidated
2009
$M2008
$M
Effect of disposal on the financial position of the Group
Cash – 647.5
Receivables – 179.8
Inventories – 11.3
Prepayments – 91.5
Assets classified as held for sale – –
Investments accounted for using the equity method – 0.8
Investments – –
Property, plant & equipment – 2,789.6
Intangible assets – 1,155.1
Other financial assets – 112.5
Payables – (786.9)
Liabilities classified as held for sale – –
Deferred income – (17.8)
Provisions – (122.3)
Interest bearing liabilities – (1,585.1)
Deferred tax liabilities – (170.1)
Other financial liabilities – (2.6)
Net identifiable assets and liabilities – 2,303.3
Minority interest in assets disposed – (343.9)
– 1,959.4
Consideration received/receivable:
– satisfied in cash – 546.6
Total consideration – 546.6
Loss on demerger of discontinued operations (net of transaction costs) in the Company is $nil million (2008: $30.3 million)
For
per
sona
l use
onl
y

81TOLL | ANNUAL REPORT 2009
11. Earnings Per Share
Basic earnings per share The calculation of basic earnings per share at 30 June 2009 was based on the profit/(loss) attributable to ordinary shareholders of $270.3 million (2008: $(694.7) million) and a weighted average number of ordinary shares outstanding of 676.8 million (2008: 646.8 million), calculated as follows:
Consolidated
2009
$M2008
$M
Profit attributable to ordinary shareholders
Profit from continuing operations 283.4 254.3
Profit from continuing operations – attributable to minority interests (4.9) (3.9)
Profit from continuing operations – attributable to ordinary shareholders 278.5 250.4
Loss from discontinued operations (8.2) (945.1)
Profit/(loss) attributable to ordinary shareholders 270.3 (694.7)
Consolidated
Million shares
Million shares
Weighted average number of ordinary shares
Issued ordinary shares at 1 July 648.1 642.5
Effect of shares issued 28.7 4.3
Weighted average number of ordinary shares at 30 June 676.8 646.8
Diluted earnings per share The calculation of diluted earnings per share at 30 June 2009 was based on the profit/(loss) attributable to ordinary shareholders of $270.3 million (2008: $(679.2) million) and a weighted average number of ordinary shares outstanding after adjustment for the effects of all dilutive potential ordinary shares of 677.2 million (2008: 647.0 million), calculated as follows:
Consolidated
2009
$M2008
$M
Profit attributable to ordinary shareholders (diluted)
Profit/(loss) attributable to ordinary shareholders (basic) 270.3 (694.7)
Interest savings on Reset Preference Shares – 15.5
Profit attributable to ordinary shareholders (diluted) 270.3 (679.2)
Consolidated
Million shares
Million shares
Weighted average number of ordinary shares (diluted)
Weighted average number of ordinary shares (basic) 676.8 646.8
Effect of share options on issue 0.4 0.2
Weighted average number of ordinary shares (diluted) 677.2 647.0
Effect of Reset Preference Shares – 35.4
Weighted average number of ordinary shares (diluted) 677.2 682.4
The Reset Preference shares were converted into ordinary shares on 11 November 2008, refer to Note 24.
For
per
sona
l use
onl
y

82
NOTEs TO ThE FiNANciAL sTATEmENTs CONTINUED
fOr ThE yEar ENDED 30 JUNE 2009
12. Dividends Paid and Declared
Cents per share
Total ($M)
Franked/Unfranked Payment Date
Dividends provided or paid by the Company during the year:
Ordinary Shares
2009
2008 Final Dividend 11.5 74.5 Franked 24/10/2008
2009 Interim Dividend 11.5 79.5 Franked 3/4/2009
154.0
2008
2007 Final Dividend 11.0 70.7 Franked 3/10/2007
2007 Special Dividend 5.0 32.1 Franked 3/10/2007
2008 Interim Dividend 13.5 87.1 Franked 4/04/2008
2008 Special (in specie) Dividend (see below) 304.6 Unfranked 22/08/2008
494.5
Franked dividends declared or paid during the year were franked at the tax rate of 30%.
Subsequent EventsAfter the balance sheet date the directors declared the following dividend. The dividend has not been provided for. The declaration and subsequent payment of the dividend has no income tax consequences:
Final Dividend 13.5 93.9 Franked 23/10/09
The financial effect of this dividend has not been brought to account in the financial statements for the year ended 30 June 2009 and will be recognised in subsequent financial reports.
The Company
2009
$M2008
$M
Dividend franking account
Net Class C (30%) franking credits (2008: 30%) available to shareholders of the parent entity for subsequent financial years 31.5 21.8
The above available amounts are based on the balance of the dividend franking account at year-end adjusted for:
(a) Franking credits that will arise from the payment of the amount of the current tax liability(b) Franking debits that will arise from the payment of dividends recognised as a liability at year-end(c) Franking credits that will arise from the receipt of dividends recognised as receivables at year-end(d) Franking credits that the entity may be prevented from distributing in subsequent years.
The ability to utilise the franking credits is dependent upon there being sufficient available profits to declare dividends. The impact on the dividend franking account of dividends declared after the balance sheet date but not recognised as a liability is to reduce it by $40.2m (2008: $31.9m).
In accordance with the tax consolidation legislation the Company as the head entity in the tax consolidated group has also assumed the benefit of nil franking credits (2008: $9.0m).
Dividends actually paid, satisfied by the issue of shares under the dividend reinvestment plan or satisfied by the reduction in employee loans under the employee share ownership plan during the years ended 30 June 2009 and 30 June 2008 were as follows:
For
per
sona
l use
onl
y

83TOLL | ANNUAL REPORT 2009
12. Dividends Paid and Declared (continued)
The Company
2009
$M2008
$M
Total dividends paid in cash 111.5 129.5
Satisfied by issue of shares in Toll Holdings 42.2 60.0
Satisfied by issue of Virgin Blue shares – 304.6
Satisfied by reduction in employee share plan loans 0.3 0.4
154.0 494.5
13. Cash and Cash Equivalents
Consolidated The Company
2009
$M2008
$M2009
$M2008
$M
Cash at bank and on hand 233.2 60.9 0.2 0.5
Deposits at call 652.4 293.1 – –
885.6 354.0 0.2 0.5
14. Receivables
Consolidated The Company
2009
$M2008
$M2009
$M2008
$M
Current
Trade Receivables 595.4 735.2 2.8 5.3
Allowance for impairment losses (24.4) (23.2) (1.6) (2.8)
571.0 712.0 1.2 2.5
Loans to controlled entities – – 2,334.2 2,236.7
Other receivables 127.3 750.2 – 0.3
698.3 1,462.2 2,335.4 2,239.5
Non CurrentLoans to associates 6.8 6.2 1.3 0.7
Loans to controlled entities – – 4.9 4.9
Other receivables 30.4 11.5 – –
Other loans 1.5 4.4 – –
38.7 22.1 6.2 5.6
737.0 1,484.3 2,341.6 2,245.1
In July 2008, approximately $620 million of current other receivables for the Group were received in settlement of asset sales for the Toll New Zealand rail and ferry operations from the New Zealand Government.F
or p
erso
nal u
se o
nly

84
NOTEs TO ThE FiNANciAL sTATEmENTs CONTINUED
fOr ThE yEar ENDED 30 JUNE 2009
15. Inventories
Consolidated The Company
2009 $M
2008 $M
2009 $M
2008 $M
Stores and materials 21.9 15.0 – –
Finished goods at net realisable value 21.6 22.1 – –
43.5 37.1 – –
16. Other Financial Assets
Consolidated The Company
2009
$M2008
$M2009
$M2008
$M
Current
Derivative financial instruments 6.6 56.1 – 11.2
6.6 56.1 – 11.2
Non Current
Derivative financial instruments 0.6 1.7 – –
Other cash deposits – 0.2 – –
0.6 1.9 – –
7.2 58.0 – 11.2
17. Investments Accounted for using the Equity Method
Consolidated The Company
2009
$M2008
$M2009
$M2008
$M
Non Current
Associates and joint ventures 288.2 226.9 – –
288.2 226.9 – –
For
per
sona
l use
onl
y

85TOLL | ANNUAL REPORT 2009
18. Investments
Consolidated The Company
2009
$M2008
$M2009
$M2008
$M
Non Current
Shares in controlled entities – at cost – – 693.6 676.6
Shares in associate entities – – 7.2 23.5
Listed shares – at market value – 67.8 – –
Unlisted shares – at cost 1.4 1.8 – –
1.4 69.6 700.8 700.1
Unlisted shares in other entities carried at cost are not measured at fair value because their fair value cannot be reliably measured. There is no identifiable active market in which the fair value of these investments can be reliably determined.
19. Investment Property
Consolidated The Company
2009
$M2008
$M2009
$M2008
$M
Fair value of investment property at start of year – 1.6 – –
Disposal of investment property – (1.6) – –
Fair value of investment property at end of year – – – –
The investment property was included in the sale of the Toll New Zealand rail and ferry operations to the New Zealand Crown effective 30 June 2008.
For
per
sona
l use
onl
y

86
NOTEs TO ThE FiNANciAL sTATEmENTs CONTINUED
fOr ThE yEar ENDED 30 JUNE 2009
20. Property, Plant and Equipment
Consolidated
Freehold Land
$MBuildings
$M
Leasehold Improvements
$M
Plant and Equipment
$M
Leased Plant and
Equipment $M
Capital Work in
Progress $M
Total $M
Carrying Amount
Balance at 1 July 2008 280.1 208.9 67.6 590.7 0.4 49.7 1,197.4
Acquisitions through business combinations – – – 8.8 – – 8.8
Other acquisitions 25.4 5.2 12.9 200.3 8.2 92.9 344.9
Transfer from capital work in progress – 5.1 4.9 61.3 – (71.3) –
Disposals (4.8) (7.8) (4.4) (14.5) – – (31.5)
Depreciation – (9.8) (10.5) (124.6) (1.0) – (145.9)
Impairment loss (4.1) – – – – – (4.1)
Effect of movements in foreign exchange 0.9 7.2 2.8 14.9 0.7 1.7 28.2
Balance as at 30 June 2009 297.5 208.8 73.3 736.9 8.3 73.0 1,397.8
Cost 297.5 259.8 210.3 1,411.3 11.4 73.0 2,263.3
Accumulated depreciation – (51.0) (137.0) (674.4) (3.1) – (865.5)
Balance as at 30 June 2009 297.5 208.8 73.3 736.9 8.3 73.0 1,397.8
Carrying Amount
Balance at 1 July 2007 184.2 285.8 61.1 2,196.4 37.9 53.8 2,819.2
Acquisitions through business combinations 70.1 12.9 2.2 143.7 – 21.7 250.6
Other acquisitions 65.6 9.0 11.1 1,151.5 2.2 151.5 1,390.9
Transfer from capital work in progress – 6.1 4.9 41.8 – (52.8) –
Disposals (6.3) (24.7) (2.3) (40.3) (0.2) (5.2) (79.0)
Demerger and disposals of entities and businesses (33.3) (62.5) – (2,547.1) (30.2) (116.5) (2,789.6)
Depreciation – (10.1) (9.0) (276.2) (3.7) – (299.0)
Effect of movements in foreign exchange (0.2) (7.6) (0.4) (79.1) (5.6) (2.8) (95.7)
Balance as at 30 June 2008 280.1 208.9 67.6 590.7 0.4 49.7 1,197.4
Cost 280.1 250.3 175.1 1,173.6 2.8 49.7 1,931.6
Accumulated depreciation – (41.4) (107.5) (582.9) (2.4) – (734.2)
Balance as at 30 June 2008 280.1 208.9 67.6 590.7 0.4 49.7 1,197.4
Refer note 23 for non current assets pledged as security
Impairment loss relates to write-down of property where cash flows from external lease income do not support the carrying value.For
per
sona
l use
onl
y

87TOLL | ANNUAL REPORT 2009
20. Property, Plant and Equipment (continued)
The Company
Freehold Land
$MBuildings
$M
Plant and Equipment
$M
Leasehold Improvements
$M
Capital Work in
Progress $M
Total $M
Carrying Amount
Balance at 1 July 2008 0.5 7.5 19.9 2.0 6.9 36.8
Acquisitions – – 3.0 1.7 21.3 26.0
Transfer to related parties – – (5.3) – (6.0) (11.3)
Depreciation – (0.2) (6.0) (0.7) – (6.9)
Balance as at 30 June 2009 0.5 7.3 11.6 3.0 22.2 44.6
Cost 0.5 8.3 44.5 7.2 22.2 82.7
Accumulated depreciation – (1.0) (32.9) (4.2) – (38.1)
Balance as at 30 June 2009 0.5 7.3 11.6 3.0 22.2 44.6
Carrying Amount
Balance at 1 July 2007 0.5 7.7 32.3 1.0 12.8 54.3
Acquisitions – – 19.4 – 9.1 28.5
Transfer from capital work in progress – – – 2.3 (2.3) –
Transfer to related parties – – – – (12.7) (12.7)
Disposals – – (25.0) (0.8) – (25.8)
Depreciation – (0.2) (6.8) (0.5) – (7.5)
Balance as at 30 June 2008 0.5 7.5 19.9 2.0 6.9 36.8
Cost 0.5 8.3 46.7 5.5 6.9 67.9
Accumulated depreciation – (0.8) (26.8) (3.5) – (31.1)
Balance as at 30 June 2008 0.5 7.5 19.9 2.0 6.9 36.8
For
per
sona
l use
onl
y

88
NOTEs TO ThE FiNANciAL sTATEmENTs CONTINUED
fOr ThE yEar ENDED 30 JUNE 2009
21. Intangible Assets
Consolidated
Goodwill
$M
Capitalised Software & Technology
$M
Right of Way $M
Customer Contracts &
Relationships $M
Other Intangibles
$MTotal
$M
Carrying Amount
Balance at 1 July 2008 1,098.6 50.9 – 103.2 9.4 1,262.1
Adjustments to provisional accounting 54.2 – – 0.7 3.2 58.1
Acquisitions through business combinations 46.8 – – 0.9 – 47.7
Other acquisitions – 28.9 – – – 28.9
Disposals – (0.2) – – – (0.2)
Amortisation – (13.6) – (28.4) (4.3) (46.3)
Effect of movements in foreign exchange 137.6 2.0 – 11.0 1.2 151.8
Balance as at 30 June 2009 1,337.2 68.0 – 87.4 9.5 1,502.1
Cost 1,337.2 125.4 – 183.5 18.2 1,664.3
Accumulated amortisation – (57.4) – (96.1) (8.7) (162.2)
Balance as at 30 June 2009 1,337.2 68.0 – 87.4 9.5 1,502.1
Carrying Amount
Balance at 1 July 2007 1,655.5 39.6 51.3 92.3 11.1 1,849.8
Adjustments to provisional accounting – – – 5.5 (5.1) 0.4
Acquisitions through business combinations 562.8 1.4 – 31.4 3.9 599.5
Other acquisitions – 29.7 – – 0.5 30.2
Disposal of entities and businesses (1,104.6) (5.6) (44.5) – (0.4) (1,155.1)
Amortisation – (14.1) (0.8) (25.5) (0.6) (41.0)
Effect of movements in foreign exchange (15.1) (0.1) (6.0) (0.5) – (21.7)
Balance as at 30 June 2008 1,098.6 50.9 – 103.2 9.4 1,262.1
Cost 1,098.6 95.3 – 169.4 10.6 1,373.9
Accumulated amortisation – (44.4) – (66.2) (1.2) (111.8)
Balance as at 30 June 2008 1,098.6 50.9 – 103.2 9.4 1,262.1
For
per
sona
l use
onl
y

89TOLL | ANNUAL REPORT 2009
21. Intangible Assets (continued)
Company
Capitalised Software & Technology
$MTotal
$M
Carrying Amount
Balance at 1 July 2008 10.3 10.3
Other acquisitions 20.3 20.3
Amortisation (1.8) (1.8)
Transfer to related parties (5.4) (5.4)
Balance at 30 June 2009 23.4 23.4
Cost 26.8 26.8
Accumulated amortisation (3.4) (3.4)
Balance at 30 June 2009 23.4 23.4
Carrying Amount
Balance at 1 July 2007 0.2 0.2
Other acquisitions 5.2 5.2
Amortisation (0.6) (0.6)
Transfer to related parties 5.8 5.8
Disposal (0.3) (0.3)
Balance at 30 June 2008 10.3 10.3
Cost 11.0 11.0
Accumulated amortisation (0.7) (0.7)
Balance at 30 June 2008 10.3 10.3
For
per
sona
l use
onl
y

90
NOTEs TO ThE FiNANciAL sTATEmENTs CONTINUED
fOr ThE yEar ENDED 30 JUNE 2009
21. Intangible Assets (continued)
(a) ImpairmentFor the purpose of impairment testing, goodwill is allocated to the Group’s segments which represents the lowest level within the Group at which goodwill is monitored for internal management purposes. A segment level summary of the goodwill and intangible assets with indefinite useful lives is presented below:
Goodwill
As at 30 June
Intangible assets with indefinite useful lives
As at 30 June
2009
$M2008
$M2009
$M2008
$M
Toll Asia 680.0 600.1 – –
Toll Australia 250.4 207.9 – –
Toll Global Forwarding 406.8 290.6 – –
1,337.2 1,098.6 – –
(b) Impairment Testing Recoverable amount was determined using a value in use calculation. Assumptions for ascertaining the recoverable amount are based on management past experience and future expectations. Cashflow projections are based on five year forecasts. Forecasts use management estimates to determine income, margins, expenses, capital expenditure and cash flows.
The following key assumptions have been used in determining the recoverable amount of our CGUs to which goodwill has been allocated:
Discount Rate (a)
As at 30 June
Terminal value growth rate (b) As at 30 June
2009
% 2009
%
Toll Asia 7.39 2
Toll Australia 12.79 2
Toll Global Forwarding 8.17 2
(a) Discount rate represents the pre tax discount rate applied to the cashflow projections. The discount rate reflects the market determined, risk adjusted, discount rate which was adjusted as required for specific country risks.
(b) Terminal value growth rate represents the growth rate applied to extrapolate cashflows beyond the five year forecast period. These growth rates are based on expectation of the long-term performance in the appropriate markets.
For
per
sona
l use
onl
y

91TOLL | ANNUAL REPORT 2009
22. Payables
Consolidated The Company
2009
$M2008
$M2009
$M2008
$M
Current
Trade creditors 212.4 234.8 5.5 5.1
Other creditors and accruals 376.3 432.6 15.5 22.4
588.7 667.4 21.0 27.5
Deed of Cross GuaranteeThe Company has entered into a Deed of Cross Guarantee with certain subsidiaries as listed in note 34. Under the terms of the Deed, the Company has guaranteed the repayment of all current and future creditors in the event any of the entities party to the Deed are wound up. Details of the consolidated financial position of the Company and subsidiaries party to the Deed are set out in note 36.
23. Interest Bearing Liabilities
Consolidated The Company
2009
$M2008
$M2009
$M2008
$M
Current
Reset preference shares – 249.6 – 249.6
Term and other loans – unsecured 389.4 254.6 – –
Term and other loans – secured 10.5 8.4 – –
Lease liabilities – secured 3.0 2.0 – –
Hire purchase liabilities 0.6 0.2 – –
403.5 514.8 – 249.6
Non Current
Terms and other loans – unsecured 795.3 1,071.2 – –
Term and other loans – secured 11.1 3.7 – –
Lease liabilities – secured 36.0 31.4 – –
Hire purchase liabilities 0.9 0.4 – –
843.3 1,106.7 – –
1,246.8 1,621.5 – 249.6
For
per
sona
l use
onl
y

92
NOTEs TO ThE FiNANciAL sTATEmENTs CONTINUED
fOr ThE yEar ENDED 30 JUNE 2009
23. Interest Bearing Liabilities (continued)
Terms and debt repayment scheduleTerms and conditions of outstanding loans were as follows:
Consolidated
2009 $M
2008 $M
Currency
Weighted average
rateYear of
maturity Face valueCarrying amount Face value
Carrying amount
Secured bank facility ZAR 14.00% 2009 6.2 6.2 8.3 8.3
Secured bank facility SGD 2.56% 2011 4.4 4.4 – –
Secured bank facility SGD 2.70% 2012 1.3 1.3 3.7 3.7
Secured bank facility SGD 1.80% 2014 9.7 9.7 – –
Unsecured bank facility NZD 8.94% 2009-2010 – – 178.2 178.2
Unsecured bank facility SGD 2.87% 2009 16.6 16.6 – –
Unsecured bank facility SGD 1.17% 2010 150.8 150.8 104.1 104.1
Unsecured bank facility RMB 4.62% 2009 3.7 3.7 – –
Unsecured bank facility HKD 1.70% 2009 201.4 201.4 165.8 165.8
Unsecured bank facility AUD 7.86% 2009-2011 – – 173.7 173.7
Unsecured bank facility TWD 3.64% 2009 – – 1.4 1.4
Unsecured bank facility THB 1.70% 2010 12.8 12.8 12.6 12.6
Unsecured bank facility CAD 3.25% 2009 1.7 1.7 2.0 2.0
Unsecured bank facility CNY 6.52% 2009 0.6 0.6 1.1 1.1
Unsecured bank facility USD 2.15% 2009 0.4 0.4 – –
Unsecured bank facility USD 3.34% 2011 0.5 0.5 – –
Unsecured bank facility VND 10.50% 2011 0.7 0.7 – –
Unsecured bank facility USD 3.00% 2009 0.1 0.1 – –
Unsecured syndicated bank facility SGD 1.69% 2011 797.3 794.7 687.0 687.0
Reset preference shares-see note 24 AUD 6.20% 2008 – – 250.0 249.6
Finance lease and HP liabilities Various 6.60% 2009-2016 40.5 40.5 34.0 34.0
Loan from MI Shareholders SGD – 2009 0.6 0.6 – –
Loan from MI Shareholders USD 4.38% 2009 0.1 0.1 – –
Total interest-bearing liabilities 1,249.4 1,246.8 1,621.9 1,621.5
Company
2009 $M
2008 $M
Currency
Weighted average
rateYear of
maturity Face valueCarrying amount Face value
Carrying amount
Reset preference shares AUD 6.20% 2008 – – 250.0 249.6
250.0 249.6
(a) Secured Bank Facilities
Toll Asia and Toll Global Forwarding loansIncluded in interest bearing liabilities are current and non current term loans totalling $21.6 million which have been secured by the assets of the Toll Asia group and Toll Global Forwarding group. At year end, the carrying amounts of assets pledged as security are $50.8 million.
OtherAll other financing is subject to negative pledge arrangements.
For
per
sona
l use
onl
y

93TOLL | ANNUAL REPORT 2009
23. Interest Bearing Liabilities (continued)
(b) Unsecured Bank FacilitiesBank loans, bilateral and syndicated, are denominated in various currencies, principally SGD. These loans are repayable at various times between August 2009 and November 2011.
(c) Reset Preference Shares Refer note 24
(d) Finance Lease LiabilitiesThe finance lease liability is predominantly comprised of a shipping vessel lease. This vessel lease is denominated in New Zealand dollars and matures in 2016. There is a financial asset for the same amount which represents the sub-lease of the shipping vessel which has the same terms and conditions as the head lease.
The Company does not have any finance lease liabilities.
(e) Defaults and breachesDuring the current and prior year there were no defaults or breaches of covenants on any loans.
24. Reset Preference Shares
Consolidated The Company
2009
$M2008
$M2009
$M2008
$M
2,500,000 Reset Preference Shares – 249.6 – 249.6
The Company issued 2.5 million Reset Preference Shares (RPS) with a face value of $100 each on 11 November 2003. Dividends are payable half-yearly on 11 November and 11 May at a dividend rate of 6.2% p.a. Holders of RPS have the same rights as holders of Ordinary Shares to receive audited accounts, reports and notices and to attend meetings of the Company’s members. Holders may not speak or vote at meetings of the Company except in the following circumstances:
• ifatthetimeofthemeeting,aDividendhasbeendeterminedtobepayableandtherelevantDividendPaymentDatehaspassedbutthe Dividend has not been paid in full;
• onaproposal:(i) to reduce the share capital of the Company;(ii) that affects the rights attaching to RPS;(iii) to wind up the Company; or(iv) for the disposal of the whole of the property, business and undertaking of the Company;
• onaresolutiontoapprovethetermsofabuy-backagreement;or• duringthewinding-upoftheCompany,inwhichcase,HoldersshallhavethesamerighttovoteasaholderofOrdinaryShares.
On 11 November 2008 the Company converted the 2.5 million reset preference shares into 40.2 million ordinary shares.
For
per
sona
l use
onl
y

94
NOTEs TO ThE FiNANciAL sTATEmENTs CONTINUED
fOr ThE yEar ENDED 30 JUNE 2009
25. Provisions
Consolidated The Company
2009
$M2008
$M2009
$M2008
$M
Current
Restructure 2.2 4.4 – –
Redundancy 0.1 1.3 – –
Employee benefits 168.5 159.7 19.3 17.3
Workers compensation/Self Insurance 29.3 32.5 13.5 11.2
Other 37.5 38.3 5.8 16.6
237.6 236.2 38.6 45.1
Non Current
Employee benefits 19.4 17.4 1.7 1.4
Workers compensation/Self Insurance 35.2 35.5 23.6 23.6
Other 58.1 16.3 – –
112.7 69.2 25.3 25.0
Employee Benefits
Aggregate employee benefits, including on-costs:
Current 168.5 159.7 19.3 17.3
Non current 19.4 17.4 1.7 1.4
187.9 177.1 21.0 18.7
For
per
sona
l use
onl
y

95TOLL | ANNUAL REPORT 2009
25. Provisions (continued)
(a) Reconciliation of provisions
Restructure
$MRedundancy
$M
Employee Benefits
$M
Worker’s Compensation
$MOther
$MTotal
$M
Consolidated
Balance at beginning of the year 4.4 1.3 177.1 68.0 54.6 305.4
Provisions made during the year – 0.1 112.2 41.4 36.5 190.2
Provisions used during the year (2.2) (1.1) (95.4) (44.7) (38.0) (181.4)
Provisions reversed during the year – (0.2) (7.0) – (9.9) (17.1)
Acquisition of entities and businesses – – 0.9 – 51.6 52.5
Disposal of entities and businesses – – – (0.2) (0.1) (0.3)
Movement from foreign currency fluctuations – – 0.1 – 0.9 1.0
Balance at the end of the year 2.2 0.1 187.9 64.5 95.6 350.3
Current 2.2 0.1 168.5 29.3 37.5 237.6
Non current – – 19.4 35.2 58.1 112.7
2.2 0.1 187.9 64.5 95.6 350.3
The Company
Balance at beginning of the year – – 18.7 34.8 16.6 70.1
Provisions made during the year – – 10.3 9.0 10.5 29.8
Provisions used during the year – – (8.0) (6.7) (21.3) (36.0)
Balance at the end of the year – – 21.0 37.1 5.8 63.9
Current – – 19.3 13.5 5.8 38.6
Non current – – 1.7 23.6 – 25.3
– – 21.0 37.1 5.8 63.9
(i) RestructureA provision for restructuring is recognised when the Group has approved a detailed and formal restructuring plan, and the restructuring either has commenced or has been announced publicly. A provision has been made for the estimated costs of restructuring the Group as a result of the acquisitions made in prior years. The Group expects to incur the liability over the next 12 months.
(ii) RedundancyProvision was made for the costs for employee redundancy due to restructuring of the Group.
(iii) Worker’s compensationThe Group self insures for risks associated with worker’s compensation in certain states of Australia. Outstanding claims are recognised when an incident occurs that may give rise to a claim and are measured at the cost that the Group expects to incur in settling the claims, discounted using a government bond rate with a maturity date approximating the term of the obligation. Such assessments are based upon an independent actuarial assessment.
(iv) OtherThis relates mainly to provision for insurance claims and liabilities assumed on acquisition. The Group expects to incur the majority of the liability within the next 12 months.
For
per
sona
l use
onl
y
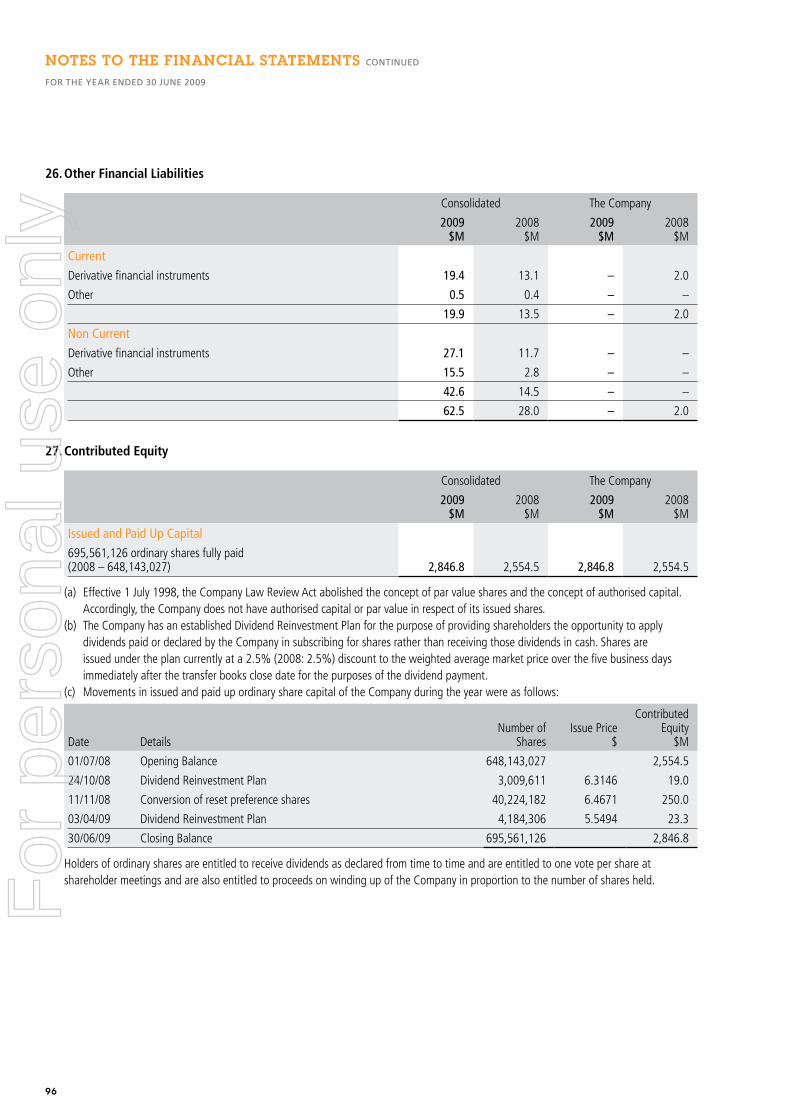
96
NOTEs TO ThE FiNANciAL sTATEmENTs CONTINUED
fOr ThE yEar ENDED 30 JUNE 2009
26. Other Financial Liabilities
Consolidated The Company
2009
$M2008
$M2009
$M2008
$M
Current
Derivative financial instruments 19.4 13.1 – 2.0
Other 0.5 0.4 – –
19.9 13.5 – 2.0
Non Current
Derivative financial instruments 27.1 11.7 – –
Other 15.5 2.8 – –
42.6 14.5 – –
62.5 28.0 – 2.0
27. Contributed Equity
Consolidated The Company
2009
$M2008
$M2009
$M2008
$M
Issued and Paid Up Capital
695,561,126 ordinary shares fully paid (2008 – 648,143,027) 2,846.8 2,554.5 2,846.8 2,554.5
(a) Effective 1 July 1998, the Company Law Review Act abolished the concept of par value shares and the concept of authorised capital. Accordingly, the Company does not have authorised capital or par value in respect of its issued shares.
(b) The Company has an established Dividend Reinvestment Plan for the purpose of providing shareholders the opportunity to apply dividends paid or declared by the Company in subscribing for shares rather than receiving those dividends in cash. Shares are issued under the plan currently at a 2.5% (2008: 2.5%) discount to the weighted average market price over the five business days immediately after the transfer books close date for the purposes of the dividend payment.
(c) Movements in issued and paid up ordinary share capital of the Company during the year were as follows:
Date DetailsNumber of
SharesIssue Price
$
Contributed Equity
$M
01/07/08 Opening Balance 648,143,027 2,554.5
24/10/08 Dividend Reinvestment Plan 3,009,611 6.3146 19.0
11/11/08 Conversion of reset preference shares 40,224,182 6.4671 250.0
03/04/09 Dividend Reinvestment Plan 4,184,306 5.5494 23.3
30/06/09 Closing Balance 695,561,126 2,846.8
Holders of ordinary shares are entitled to receive dividends as declared from time to time and are entitled to one vote per share at shareholder meetings and are also entitled to proceeds on winding up of the Company in proportion to the number of shares held.F
or p
erso
nal u
se o
nly

97TOLL | ANNUAL REPORT 2009
28. Share Based Payments
Senior Executive Option Plan and Executive Share Option SchemeAs at 30 June 2009 unissued ordinary shares of the Company under option are:
Grant Date
Expiry Date
Exercise Price ($)
Balance 01/07/08
‘000
Options Granted
‘000
Options Forfeited
‘000
Options Exercised
‘000
Balance 30/06/09
‘000
Vested Balance
‘000
Proceeds Received
($M)
Shares Issued
‘000
Market Value
Aggregate ($M)
Weighted Avg Share
Price on Exercise
$
04/10/06 25/07/11 10.29 340 – (160) – 180 – – – – –
11/01/08 10/01/13 10.55 3,686 – (181) – 3,505 – – – – –
25/06/08 25/06/13 6.32 1,283 – (90) – 1,193 – – – – –
26/11/08 25/11/13 5.75 – 6,180 – – 6,180 – – – – –
5,309 6,180 (431) – 11,058 – – – – –
The Company has an Executive Share Option Scheme and Senior Executive Option Plan which have been approved by the members at previous Annual General Meetings.
Each option is convertible into one ordinary share once certain performance criteria are met. Performance criteria are tested over three periods. For the October 2006 options the measurement dates are 30 June 2009, 30 June 2010 and 30 June 2011. For the January 2008 options, the measurement dates are 30 June 2010, 30 June 2011 and 30 June 2012. For the June 2008 options, the measurement dates are 31 December 2010, 31 December 2011 and 31 December 2012. For the November 2008 options, the measurement dates are 30 June 2011, 30 June 2012 and 30 June 2013. Options which do not vest in the initial period are retested at the two subsequent dates. Options which do not vest in the third and final performance period will lapse. The proportion of options that vest at the end of a relevant performance period depends on the fully diluted pre-amortisation for continuing operations post restructure, excluding Virgin Blue EPS compound growth performance. All options will vest if the Group’s cumulative compound EPS growth is greater than 15%. If EPS growth is 10%, 50% of the options will vest, between 10% and 15%, a pro-rata straight-line allocation is vested. If EPS growth is below 10%, no options will vest.
Nil ordinary shares were issued during the financial year on the exercise of options granted under the executive share option scheme (2008: nil shares).
For
per
sona
l use
onl
y

98
NOTEs TO ThE FiNANciAL sTATEmENTs CONTINUED
fOr ThE yEar ENDED 30 JUNE 2009
28. Share Based Payments (continued)
Cash settled share based payment arrangements (non-equity units) are only issued in jurisdictions where actual options cannot be issued. At 30 June 2009, the non-equity units are:
Grant Date Expiry DateExercise Price ($)
Balance 01/07/08
‘000
Units Granted
‘000
Units Forfeited
‘000
Units Exercised
‘000
Balance 30/06/09
‘000
Vested Balance
‘000
Proceeds Received
($M)
Market Value
Aggregate ($M)
Weighted Avg Share
Price on Exercise
$
25/06/08 24/06/13 6.32 385 – (43) – 342 – – – –
26/11/08 25/11/13 5.75 – 365 (8) – 357 – – – –
385 365 (51) – 699 – – – –
For the June 2008 non-equity units, the measurement dates are 31 December 2010, 31 December 2011 and 31 December 2012. Non-equity units which do not vest in the initial period are retested at the two subsequent dates. Non-equity units which do not vest in the fourth and final performance period will lapse. The proportion of non-equity units that vest at the end of a relevant performance period depends on the cumulative compound growth of the Group’s EPS pre-amortisation calculated on a fully diluted basis for ongoing operations post restructure, excluding Virgin Blue. All non-equity units will vest if the Group’s cumulative compound EPS growth is greater than 15%. If EPS growth is 10%, 50% of the non-equity units will vest, between 10% and 15%, a pro-rata straight-line allocation is vested. If EPS growth is below 10%, no non-equity units will vest. The redemption of each vested unit will result in the payment of the value of the notional number of Toll shares at the redemption date, less the notional issue price of the unit. The value of a Toll share will be equal to the 5 trading day VWAP of Toll shares up to and including the redemption date.
For the November 2008 non-equity units, the measurement dates are 30 June 2011, 30 June 2012 and 30 June 2013. Non-equity units which do not vest in the initial period are retested at the two subsequent dates. Non-equity units which do not vest in the fourth and final performance period will lapse. The proportion of non-equity units that vest at the end of a relevant performance period depends on the cumulative compound growth in the Group’s EPS, pre-amortisation and abnormal items for ongoing business operations calculated on a fully diluted basis. All non-equity units will vest if the Group’s cumulative compound EPS growth is greater than 15%. If EPS growth is 10%, 50% of the non-equity units will vest, between 10% and 15%, a pro-rata straight-line allocation is vested. If EPS growth is below 10%, no non-equity units will vest. The redemption of each vested unit will result in the payment of the market value of the notional number of Toll shares in respect of each Toll non-equity unit, as at the close of trading on the ASX on the ASX business date before the redemption of the vested non-equity unit less the exercise price, provided the amount is greater than zero. If the amount is zero, the non-equity units will expire without redemption and no cash is payable.
For
per
sona
l use
onl
y

99TOLL | ANNUAL REPORT 2009
29. Capital and Reserves
Reconciliation of movement in capital and reserves
Contributed Equity
$M
Treasury Shares
$M
Retained Earnings
$M
Foreign Currency
Translation Reserve
$M
Share-Based Payment Reserve
$M
Hedging Reserve
$MTotal
$M
Minority Interests
$M
Total Equity
$M
Consolidated
Balance at 1 July 2008 2,554.5 (7.2) (373.2) (128.3) 2.1 12.9 2,060.8 42.3 2,103.1Total recognised income and expense for the year – – 270.3 107.1 – (24.6) 352.8 7.0 359.8Dividend re-investment plan 42.3 0.4 – – – – 42.7 – 42.7Share option expense – – – – 6.2 – 6.2 – 6.2Repayments of treasury shares – 1.1 – – – – 1.1 – 1.1Dividends to shareholders – – (154.0) – – – (154.0) – (154.0)Conversion of Reset Preference Shares 250.0 – – – – – 250.0 – 250.0Interest in dividends paid – – – – – – – (3.9) (3.9)Acquired minority interest – – – – – – – (5.1) (5.1)Balance at 30 June 2009 2,846.8 (5.7) (256.9) (21.2) 8.3 (11.7) 2,559.6 40.3 2,599.9Balance at 1 July 2007 2,492.8 (8.2) 816.0 (23.0) 0.2 (31.6) 3,246.2 375.1 3,621.3
Total recognised income and expense for the year – – (694.7) (98.1) - 91.4 (701.4) 47.6 (653.8)
Dividend re-investment plan 59.9 0.2 – – – – 60.1 – 60.1
Shares issued 1.8 – – – – – 1.8 – 1.8
Share option expense – – – – 1.9 – 1.9 4.9 6.8
Repayments of treasury shares – 0.8 – – – – 0.8 – 0.8
Dividends to shareholders – – (494.5) – – – (494.5) – (494.5)
Interest in dividends paid – – – – – – – (18.1) (18.1)
Disposal of discontinued operations – – – (7.2) – (46.9) (54.1) (315.3) (369.4)
Acquired minority interest – – – – – – – (51.9) (51.9)
Balance at 30 June 2008 2,554.5 (7.2) (373.2) (128.3) 2.1 12.9 2,060.8 42.3 2,103.1
For
per
sona
l use
onl
y

100
NOTEs TO ThE FiNANciAL sTATEmENTs CONTINUED
fOr ThE yEar ENDED 30 JUNE 2009
29. Capital and Reserves (continued)
Reconciliation of movement in capital and reserves (continued)
Contributed Equity
$M
Treasury Shares
$M
Retained Earnings
$M
Available-for-sale Reserve
$M
Share-Based Payment Reserve
$M
Hedging Reserve
$MTotal
$M
Minority Interests
$M
Total Equity
$M
Company
Balance at 1 July 2008 2,554.5 (7.2) 63.1 – 2.1 – 2,612.6 – 2,612.6Total recognised income and expense for the year – – 192.8 – – – 192.8 – 192.8Dividend re-investment plan 42.3 0.4 – – – – 42.7 – 42.7Share option expense – – – – 6.2 – 6.2 – 6.2Shares issued 250.0 – – – – – 250.0 – 250.0Repayments of treasury shares – 1.1 – – – – 1.1 – 1.1Dividends to shareholders – – (154.0) – – – (154.0) – (154.0)Balance at 30 June 2009 2,846.8 (5.7) 101.9 – 8.3 – 2,951.3 – 2,951.3Balance at 1 July 2007 2,492.8 (8.2) 72.6 68.1 0.2 – 2,625.5 – 2,625.5
Total recognised income and expense for the year – – 485.0 – – – 485.0 – 485.0
Dividend re-investment plan 59.9 0.2 – – – – 60.1 – 60.1
Reversal of available-for-sale reserve – – – (68.1) – – (68.1) – (68.1)
Share option expense – – – – 1.9 – 1.9 – 1.9
Shares issued 1.8 – – – – – 1.8 – 1.8
Repayments of treasury shares – 0.8 – – – – 0.8 – 0.8
Dividends to shareholders – – (494.5) – – – (494.5) – (494.5)
Balance at 30 June 2008 2,554.5 (7.2) 63.1 – 2.1 – 2,612.6 – 2,612.6
Foreign Currency Translation Reserve – comprises all foreign currency differences arising from the translation of the financial statements of foreign operations as well as from the translation of liabilities that hedge the Company’s net investment in a foreign subsidiary.
Hedging Reserve – comprises the effective portion of the cumulative net change in the fair value of cash flow hedging instruments related to the hedged transactions that have not yet occurred.
Share Based Payment Reserve – comprises the fair value of executive options amortised.
For
per
sona
l use
onl
y

101TOLL | ANNUAL REPORT 2009
30. Financial Instruments
Financial Risk Management
OverviewThe Company and the Group have exposure to the following risks from their use of financial instruments:
• creditrisk• liquidityrisk• marketrisk.
This note presents information about the Company’s and the Group’s exposure to each of the above risks, their objectives, policies and processes for measuring and managing risk, and the management of capital. Further quantitative disclosures are included throughout this financial report.
The Board of Directors has overall responsibility for the establishment and oversight of the risk management framework. The Board, through the Audit and Financial Risk Committee, oversees the establishment, implementation and ongoing review of the Group’s risk management and internal compliance and control system. The internal control system covers financial risks.
The Audit and Financial Risk Committee considers any matters relating to the financial affairs of the Group that it determines to be necessary. In addition, the Committee examines any other matters referred to it by the Board.
The duties of the Audit and Financial Risk Committee include, amongst others, duties relating specifically to financial risk management including monitoring corporate risk assessment and internal controls; monitoring risks relating to credit, liquidity, currency, interest rate, and other market exposures. The Audit and Financial Risk Committee reports regularly to the Board of Directors on its activities.
The Group enters into derivative instruments for risk management purposes only. Derivative transactions are entered into to hedge the risks relating to underlying physical positions arising from business activities. Group policy is not to enter, issue or hold derivative financial instruments for speculative trading purposes.
Credit riskCredit risk represents the risk of financial loss that would be recognised if counterparties failed to perform as contracted, and arises principally on the Group’s receivables from customers, investment securities, cash held with financial institutions, and derivatives held with various counterparties. For the Company it arises principally from receivables due from subsidiaries.
At reporting date there were no significant concentrations of credit risk.
Trade and other receivablesThe Group and the Company minimise concentrations of credit risk by undertaking transactions with a large number of customers and counterparties. The Group and the Company are not materially exposed to any individual customer, which is consistent with their diverse customer base.
The Company’s and Group’s exposure to credit risk is influenced mainly by the individual characteristics of each customer. The exposure to credit risk is further diversified through the demographics of the Group’s customer base, including the default risk of the industry and country in which customers operate.
The Company and the Group have established an allowance for impairment that represents their estimate of incurred losses in respect of trade and other receivables.
Investments (cash and cash deposits)The Group limits its exposure to credit risk by only investing in liquid securities and only with counterparties that have a credit rating of at least A1 from Standard & Poor’s, however, the current Group Treasury policy allows investments with counterparties rated A2 (short term) or A- (long term). Given these high credit ratings, management does not expect any counterparty to fail to meet its obligations.
Guarantees Group policy is to provide financial guarantees to wholly-owned subsidiaries, where required. In exceptional circumstances the Group may provide financial guarantees to other Group entities.
For
per
sona
l use
onl
y

102
NOTEs TO ThE FiNANciAL sTATEmENTs CONTINUED
fOr ThE yEar ENDED 30 JUNE 2009
30. Financial Instruments (continued)
Financial Risk Management (continued)
Credit risk (continued)
Derivative TransactionsThe Group undertakes derivative transactions in foreign exchange and interest rates with financial institutions that have a credit rating of at least A1 from Standard & Poor’s however, the current Group Treasury policy allows transactions with counterparties rated A2 (short term) or A- (long term). The Group also enters into commodity based derivative transactions with other counterparties with ratings above A2/A-. Given these high credit ratings, management does not expect any counterparty to fail to meet its obligations. Management has established policies which limit the exposure of the Group to any individual counterparty.
Liquidity riskLiquidity risk is the risk that the Group will not be able to meet its financial obligations as they fall due. Prudent liquidity risk management implies maintaining sufficient cash and marketable securities, the availability of funding as required and the ability to close-out market positions if necessary. Due to the dynamic nature of the underlying businesses, Group Treasury aims at maintaining flexibility in funding by keeping adequate liquidity available so as to be able to take advantage of new investment opportunities that may arise. The Group’s policy is to maintain a balance between continuity of funding and flexibility through the use of bank overdrafts, bank loans and the overnight money market across a range of maturities. Although the bank loans have fixed maturity dates from time to time they are reviewed and extended, thus deferring the repayment of principal. The Group aims to spread maturities evenly to avoid excessive refinancing in any period.
Liquidity risk is managed by using the operating cash flows of the underlying business. The Group regularly forecasts future cash flows, in addition to the annual budgeting process, to gauge future funding requirements and ensure sufficient capacity to meet those requirements.
The Group aims to maintain flexibility in funding by keeping committed credit lines available with a variety of counterparties. At 30 June 2009 the Group had unutilised committed debt facilities of $715.3 million (2008: $523.6 million).
Market risk Market risk is the risk that changes in market prices, such as foreign exchange rates, interest rates, fuel prices and equity prices will affect the Group’s income or the value of its holdings of financial instruments. The objective of market risk management is to manage and control market risk exposures within acceptable parameters, while optimising the return.
The Group enters into derivatives, and also incurs financial liabilities, in order to manage market risks. All such transactions are carried out within the guidelines set out in the Group Treasury policy which has been approved by the Audit and Financial Risk Committee. Generally the Group seeks to apply hedge accounting in order to manage volatility in profit or loss.
At 30 June 2009, the Toll Group held various types of derivative financial instruments that were designated as cash flow hedges of future transactions. These were:
• Hedgingofcertainforeigncurrencyrevenuereceiptsandoperationalpaymentsinforeigncurrencywithforeignexchangederivativecontracts (forwards or options);
• Hedgingoffutureinterestpaymentswithinterestratederivativecontracts(swaps);and• Hedgingofcertainfuelsaleswithfuelswaps.
Any gains/losses on contracts entered into to hedge anticipated specific sales and purchase of goods and services, together with the cost of contracts are recognised in the financial statements at the time the underlying transaction occurs.
At 30 June 2009, the Toll Group held various types of derivative financial instruments that were designated as cash flow hedges of future transactions. The following table indicates the periods in which the cash flows associated with derivatives that are cash flow hedges are expected to occur and are expected to impact profit or loss.F
or p
erso
nal u
se o
nly

103TOLL | ANNUAL REPORT 2009
30. Financial Instruments (continued)
Financial Risk Management (continued)
Carrying amount
$M
Expected cash flows
$M
6 months or less
$M
6-12 months
$M1 to 2 years
$M2 to 5 years
$M> 5 years
$M
Consolidated – 2009
Interest rate swaps:
Assets 0.3 0.4 – – (0.4) 0.8 –
Liabilities (16.6) (15.5) (9.4) (5.0) (1.7) 0.6 –
Forward exchange contracts:
Assets 0.9 0.9 0.2 0.4 0.1 0.2 –
Liabilities (0.9) (0.9) (0.9) – – – –
Fuel swaps:
Assets – – – – – – –
Liabilities (0.3) (0.3) – (0.3) – – –
(16.6) (15.4) (10.1) (4.9) (2.0) 1.6 –
Consolidated – 2008
Interest rate swaps:
Assets 10.1 11.3 1.3 1.4 3.7 4.4 0.5
Liabilities (7.1) (6.9) (7.0) (3.0) 1.0 2.1 –
Forward exchange contracts:
Assets 13.6 13.6 13.6 – – – –
Liabilities (13.9) (15.5) (1.2) (9.9) (3.5) (0.9) –
Fuel swaps:
Assets – – – – – – –
Liabilities – – – – – – –
2.7 2.5 6.7 (11.5) 1.2 5.6 0.5
For
per
sona
l use
onl
y

104
NOTEs TO ThE FiNANciAL sTATEmENTs CONTINUED
fOr ThE yEar ENDED 30 JUNE 2009
30. Financial Instruments (continued)
Financial Risk Management (continued)
Currency riskThe Group is exposed to foreign currency risk on sales, purchases and borrowings that are denominated in a currency other than the entity’s respective functional currency of Australian dollars. The currencies giving rise to this risk are primarily Singapore dollar, Hong Kong dollar and United States dollar.
The Group uses forward exchange contracts, foreign exchange swaps or foreign exchange options to hedge its currency risk. When necessary, forward exchange contracts and foreign exchange swaps are rolled over at maturity.
The Group classifies its forward exchange contracts hedging forecast transactions as cash flow hedges. The cash flows are expected to occur at various dates between 1 month and 36 months from the reporting date. For the year ended 30 June 2009, other financial assets and liabilities of the Group include derivative financial instruments used to hedge foreign currency with a net fair value of $nil million (2008: ($0.3) million).
Interest on borrowings is denominated in currencies that match the cash flows generated by the underlying operations of the Group, primarily Australian dollar, Singapore dollar and Hong Kong dollar. These provide economic hedges.
The Group’s New Zealand dollar denominated commercial borrowings were designated as a net investment hedge of the Group’s investment in its New Zealand subsidiaries. The carrying amount of the commercial bills at 30 June 2009 was $nil million (2008: $178.0 million).
The Group’s Singapore dollar denominated commercial borrowings are designated as a net investment hedge of the Group’s investment in its Asian subsidiaries. The carrying amount of the commercial bills used to hedge the Asian investment at 30 June 2009 was $668.0 million (2008: $495.0 million).
The Group’s Hong Kong dollar denominated commercial borrowings are designated as a net investment hedge of the Group’s investment in its Asian subsidiaries. The carrying amount of the commercial bills used to hedge the Asian investment at 30 June 2009 was $201.4 million (2008: $165.8 million). In addition the Group has entered into a floating-for-floating AUD/HKD cross currency interest rate swap which is designated as a net investment hedge of the Group’s investment in its Asian subsidiaries. The fair value of the cross currency interest rate swap as at 30 June 2009 was $(22.8) million (2008: $12.9 million).
For
per
sona
l use
onl
y

105TOLL | ANNUAL REPORT 2009
30. Financial Instruments (continued)
Financial Risk Management (continued)
Interest rate riskThe Group is exposed to interest rate risk related to its commercial borrowings.
The Group enters into interest rate derivatives to manage cash flow and fair value interest rate risks associated with movements in interest rates on borrowings and leases.
The majority of the Group’s term and other loans attract floating interest rates. In addition the Group held a floating-for-floating cross currency interest rate swap and had an operating lease which attracts floating interest rates. The Group adopts a policy of ensuring that between 50 and 100 percent of its exposure to changes in interest rates is on a fixed rate basis. The Group uses floating-to-fixed interest rate swaps to achieve an appropriate mix of fixed and floating rate exposure. The Company had floating interest rate exposure via fixed-to-floating interest rate swaps associated with reset preference shares in 2008 (see below). For the year ended 30 June 2009 the Company does not have any fixed-to-floating interest rate swaps.
In terms of principal outstanding at 30 June 2009, floating-to-fixed interest rate swaps currently in place cover approximately 77% (2008: 83%) of the Group’s term and other loans and the cross currency interest rate swap. The fixed interest rates of all swaps range between 2.00% and 5.78% (2008: 2.00% and 6.36%) and the variable rates between 0.35% and 3.24% (2008: 1.08% and 8.00%). The contracts require settlement of net interest receivable or payable every 90 or 182 days.
The Company and the Group issued reset preference shares which paid a fixed interest rate of 6.20% and were converted into ordinary shares in November 2008. Fixed-to-floating interest rates swaps were used by both the Company and the Group to manage this exposure which was designated as a fair value hedge. The swaps had a notional principal amount of $250 million and matured in November 2008. The contracts required settlement of net interest payable or receivable every 6 months.
Other market price risk
Commodity price riskPrice risk arises on the Group’s exposure to diesel and jet fuel prices through certain customer contracts. In the prior year price risk arose on the Group’s exposure to jet fuel prices through its subsidiary, Virgin Blue, which was deconsolidated on 30 June 2008. Wherever possible, Toll seeks to have fuel surcharge mechanisms in place within customer contracts to mitigate the effects of rising diesel prices on the Group.
During the previous and the current year, the Group’s fuel price management strategy aimed to provide the Group with protection against sudden and significant increases in fuel prices while ensuring that the Group was not competitively disadvantaged in a serious way in the event of a substantial fall in the price of fuel.
Group Treasury is responsible for managing the current fuel price exposure by using swap contracts designated as hedges of price risk on specific volumes of future jet fuel and diesel sales. The Group uses swaps on jet fuel and diesel to hedge the exposure to movements in the price of jet fuel and diesel where it considers there are customer contracts that do not mitigate the effects of rising jet fuel and diesel prices on the Group. Hedging is conducted in accordance with Toll Group Policy. For the year ended 30 June 2009, other financial assets and liabilities of the Group includes derivative financial instruments used to hedge jet fuel and diesel with a fair value of $(0.3) million (2008: $nil million).
The Group does not enter into commodity contracts other than to meet the Group’s expected usage and sale requirements.
Group Treasury was responsible for managing the jet fuel exposure within Virgin Blue by using swap contracts and option contracts. These contracts were designated at Group level as hedges of price risk on specific volumes of future jet fuel consumption. The Group’s risk management policy is to hedge, subject to limits determined by the Board, anticipated jet fuel consumption for subsequent financial periods. Realised gains or losses on these contracts arise due to differences between actual fuel prices on settlement and the forward rates of the derivative contracts.
During the year, the net gain arising from fuel hedging activities for the Group was $nil million (2008: $93.2 million). Last years gain was part of the discontinued operations amount in the Group’s Income Statement.
The Company did not enter into any fuel price derivatives in the current or prior period.
For
per
sona
l use
onl
y

106
NOTEs TO ThE FiNANciAL sTATEmENTs CONTINUED
fOr ThE yEar ENDED 30 JUNE 2009
30. Financial Instruments (continued)
Financial Risk Management (continued)
Capital management The Board’s policy is to maintain a strong capital base so as to maintain investor, creditor and market confidence, to sustain future development of the business, to safeguard the Group’s ability to continue as a going concern and to maintain an optimal capital structure to reduce the cost of capital.
In order to maintain the appropriate capital structure, the Group may adjust the amount of dividends paid to shareholders, utilise a dividend reinvestment plan, return capital to shareholders or issue new equity, in addition to incurring an appropriate mix of long and short term borrowings.
The Group monitors capital on the basis of the gearing ratio. This ratio is calculated as net debt divided by net debt plus shareholders equity. In addition the Group monitors various other credit metrics, principally interest cover ratio (EBIT divided by net financing costs), leverage (net debt divided by EBITDA), the return on capital (EBIT divided by net debt plus shareholders equity) and also the level of dividends to ordinary shareholders.
The interest cover and leverage are also monitored to ensure an adequate buffer against covenant levels under various facilities.
The Group purchases its own shares on the market on behalf of employees who have elected to participate in the Staff Share Acquisition Plan. These employees have elected to salary sacrifice amounts to purchase shares via an employee share plan.
There were no changes in the Group’s approach to capital management during the year.
Neither the Company nor any of its subsidiaries are subject to externally imposed capital requirements.
Credit riskThe carrying amount of the Group’s financial assets represents the maximum credit exposure. The Group’s maximum exposure to credit risk at the reporting date was:
Consolidated Carrying amount
Note2009
$M2008
$M
Other cash deposits 16 – 0.2
Loans and receivables 14 737.0 1,484.3
Cash and cash equivalents 13 885.6 354.0
Interest rate swaps used for hedging:
Assets 16 0.3 36.2
Forward exchange contracts used for hedging:
Assets 16 0.9 11.5
Other forward exchange contracts 16 6.0 10.1
1,629.8 1,896.3
The Company’s maximum exposure to credit risk at the reporting date was:
The Company Carrying amount
Note2009
$M2008
$M
Loans and receivables 14 2,341.6 2,245.1
Cash and cash equivalents 13 0.2 0.5
Interest rate swaps used for hedging:
Assets 16 – 2.0
Other forward exchange contracts 16 – 9.2
2,341.8 2,256.8
For
per
sona
l use
onl
y

107TOLL | ANNUAL REPORT 2009
30. Financial Instruments (continued)
The Group’s maximum exposure to credit risk for loans and receivables at the reporting date by geographic region was:
Consolidated Carrying amount
2009
$M2008
$M
Australia 411.5 573.2
Asia 108.5 83.5
Hong Kong/China 83.5 62.6
New Zealand 51.1 683.8
Other regions 82.4 81.2
737.0 1,484.3
The Company’s maximum exposure to credit risk for loans and receivables at the reporting date by geographic region was:
The Company Carrying amount
2009
$M2008
$M
Australia 1,518.5 1,466.8
Asia 822.6 778.3
Hong Kong/China 0.5 –
2,341.6 2,245.1
The Group has no significant concentration of credit risk with any one customer due to its diverse customer base.
Impairment lossesThe aging of the Group’s trade receivables at the reporting date was:
Consolidated
Gross 2009
$M
Impairment 2009
$M
Gross 2008
$M
Impairment 2008
$M
Not past due 329.3 (3.8) 446.0 (3.3)
Past due 0-30 days 187.2 (1.6) 207.8 (2.5)
Past due 31-120 days 64.3 (4.4) 58.0 (8.6)
Past due 121 days to one year 14.6 (14.6) 23.4 (8.8)
595.4 (24.4) 735.2 (23.2)
Of the Company’s receivables balance $1.6 million are past due and fully provided for (2008: $2.8m).
Trade receivables are carried at amounts due. Receivables that are not past due and not impaired are considered receivable. Payment terms are generally 30 days. A risk assessment process is used for all accounts, with a stop credit process in place for most long overdue accounts.
For
per
sona
l use
onl
y

108
NOTEs TO ThE FiNANciAL sTATEmENTs CONTINUED
fOr ThE yEar ENDED 30 JUNE 2009
30. Financial Instruments (continued)
The movement in the allowance for impairment in respect of trade receivables during the year was as follows:
2009
$M2008
$M
Balance at 1 July 23.2 22.6
Impairment loss recognised 11.3 20.2
Impairment loss reversed (4.7) (17.3)
Impairment loss utilised (5.4) (2.3)
Balance at 30 June 24.4 23.2
The impairment loss at 30 June 2009 relates to collective impairment raised on past due receivables in accordance with Toll Group policy, which reflect historical default rates on similar receivables balances. There were no individually significant impaired receivables from particular customers.
There is no collateral held on the Group’s receivables balances held with customers.
During the year ended 30 June 2009, there were no renegotiations of trade receivables of the Group (2008: nil).
The allowance accounts in respect of trade receivables are used to record impairment losses unless the Group is satisfied that no recovery of the amount owing is possible; at that point the amount is considered irrecoverable and is written off against the financial asset directly.
For
per
sona
l use
onl
y

109TOLL | ANNUAL REPORT 2009
30. Financial Instruments (continued)
Liquidity riskThe following are the contractual maturities of financial liabilities, including estimated interest payments based on conditions existing at reporting date and including the impact of netting agreements for derivatives:
Consolidated
Carrying amount
$M
Contractual cash flows
$M
6 mths or less
$M6-12 mths
$M1-2 years
$M2-5 years
$M
More than 5 years
$M30 June 2009 Non-derivative financial liabilities Secured term and other loans 21.6 22.1 10.6 0.1 8.1 3.3 –Unsecured term and other loans 1,184.7 1,221.7 243.3 162.1 13.6 802.7 –Finance lease liabilities 39.0 53.8 2.4 2.4 5.4 12.8 30.8Hire-purchase liabilities 1.5 1.5 0.3 0.3 0.4 0.5 –Trade and other payables 588.7 588.7 533.1 55.6 – – –Other financial liabilities 16.0 16.0 – 0.5 2.5 13.0 –Derivative financial liabilities Interest rate swaps used for hedging 16.6 15.5 9.4 5.0 1.7 (0.6) –Cross currency interest rate swap used for net investment hedging
Outflow 22.8 229.0 0.9 1.0 227.1 – –Inflow – (208.9) (3.5) (3.5) (201.9) – –
Forward exchange contracts used for hedging 0.9 0.9 0.9 – – – –Other forward exchange contracts 5.9 5.9 4.4 1.5 – – –Fuel swaps used for hedging 0.3 0.3 – 0.3 – – – 1,898.0 1,946.5 801.8 225.3 56.9 831.7 30.830 June 2008 Non-derivative financial liabilities Secured term and other loans 12.0 12.0 – 8.3 – 3.7 –Unsecured term and other loans 1,325.8 1,392.1 357.5 116.9 424.5 493.2 –Reset preference shares 249.6 253.9 253.9 – – – –Finance lease liabilities 33.4 50.4 2.9 2.2 4.7 14.4 26.2Hire-purchase liabilities 0.6 0.6 0.1 0.1 0.2 0.2 –Trade and other payables 667.4 667.4 625.4 42.0 – – –Derivative financial liabilities Interest rate swaps used for hedging
Outflow 9.1 7.0 7.0 – – – –Forward exchange contracts used for hedging:
Outflow 15.7 15.7 1.2 9.9 3.6 1.0 – 2,313.6 2,399.1 1,248.0 179.4 433.0 512.5 26.2F
or p
erso
nal u
se o
nly

110
NOTEs TO ThE FiNANciAL sTATEmENTs CONTINUED
fOr ThE yEar ENDED 30 JUNE 2009
30. Financial Instruments (continued)
The Company
Carrying amount
$M
Contractual cash flows
$M
6 mths or less
$M6-12 mths
$M1-2 years
$M2-5 years
$M
More than 5 years
$M
30 June 2009
Non-derivative financial liabilities
Trade and other payables 21.0 21.0 21.0 – – – –
21.0 21.0 21.0 – – – –
30 June 2008
Non-derivative financial liabilities
Reset preference shares 249.6 253.9 253.9 – – – –
Trade and other payables 27.5 27.5 27.5 – – – –
Derivative financial liabilities
Interest rate swaps used for hedging:
Outflow 2.0 2.0 2.0 – – – –
279.1 283.4 283.4 – – – –
Currency risk
Exposure to currency riskThe Group’s exposure to foreign currency risk at balance date was as follows, based on notional amounts and in Australian dollar equivalents:
Consolidated
USD $M
NZD $M
SGD $M
HKD $M
OTHER $M
30 June 2009
Cash at bank 33.5 39.5 65.5 22.8 60.2
Trade receivables 24.9 19.5 47.3 13.9 109.6
Financial assets at fair value through profit or loss – – – – –
Term and other loans (1.1) – (978.3) (201.4) (25.6)
Trade payables (14.2) (5.6) (32.4) (3.0) (47.2)
Gross balance sheet exposure 43.1 53.4 (897.9) (167.7) 97.0
Forward exchange contracts – – – – –
Net exposure 43.1 53.4 (897.9) (167.7) 97.0
30 June 2008
Cash at bank 19.6 – 1.9 1.0 30.2
Trade receivables 26.8 3.5 3.1 2.1 112.9
Financial assets at fair value through profit or loss 0.2 – – – –
Term and other loans – (178.2) (496.0) (166.0) (26.7)
Trade payables (12.0) (0.3) (0.6) (0.4) (81.9)
Gross balance sheet exposure 34.6 (175.0) (491.6) (163.3) 34.5
Forward exchange contracts – – – – –
Net exposure 34.6 (175.0) (491.6) (163.3) 34.5
The Company has no exposure to foreign currency risk (2008: nil)
For
per
sona
l use
onl
y

111TOLL | ANNUAL REPORT 2009
30. Financial Instruments (continued)
The following significant exchange rates applied during the year:
Average rate Reporting date spot
2009 2008 2009 2008
USD 0.7526 0.8931 0.7958 0.9595
NZD 1.2321 1.1608 1.2457 1.2624
SGD 1.0954 1.2848 1.1601 1.3106
HKD 5.8460 7.4456 6.1681 7.4906
Sensitivity analysisA 10 percent strengthening/weakening of the Australian dollar against the following currencies at 30 June would have increased (decreased) equity and profit or loss by the amounts shown below. This analysis assumes that all other variables, in particular interest rates, remain constant. The analysis is performed on the same basis for 2008.
Effect 10% Strengthening of AUD 10% Weakening of AUD
Equity
$MProfit or loss
$MEquity
$MProfit or loss
$M
30 June 2009
USD 0.6 (4.0) (0.7) 4.9
NZD – (4.9) – 5.9
SGD 88.9 (7.3) (108.7) 8.9
HKD 18.3 (3.1) (22.4) 3.7
OTHER (0.9) (9.3) 1.1 11.4
30 June 2008
USD – (3.3) – 3.3
NZD 16.1 (0.3) (16.1) 0.3
SGD 45.1 (0.7) (45.1) 0.7
HKD 15.1 (0.2) (18.4) 0.3
OTHER 2.7 (6.1) (2.7) 6.1
Interest rate risk
ProfileAt the reporting date the interest rate profile of the Company’s and the Group’s interest-bearing financial instruments was:
Consolidated
Carrying amountThe Company
Carrying amount
2009
$M2008
$M2009
$M2008
$M
Fixed rate instruments
Financial assets 660.1 3.7 – –
Financial liabilities (887.8) (280.6) – (249.7)
(227.7) (276.9) – (249.7)
Variable rate instruments
Financial assets 234.0 372.5 1.5 11.7
Financial liabilities (398.4) (1,337.1) – –
(164.4) (964.6) 1.5 11.7
For
per
sona
l use
onl
y

112
NOTEs TO ThE FiNANciAL sTATEmENTs CONTINUED
fOr ThE yEar ENDED 30 JUNE 2009
30. Financial Instruments (continued)
Fair value sensitivity analysis for fixed rate instrumentsThe Group does not account for any fixed rate financial assets and liabilities at fair value through profit or loss. The Group no longer designates derivatives (interest rate swaps) as hedging instruments under a fair value hedge accounting model at 30 June 2009.
Cash flow sensitivity analysis for variable rate instrumentsA change of 100 basis points in interest rates at the reporting date would have increased (decreased) equity and profit or loss before tax by the amounts shown below. This analysis assumes that all other variables, in particular foreign currency rates, remain constant. The analysis is performed on the same basis for 2008.
Profit or loss Equity
100bp increase
$M
100bp decrease
$M
100bp increase
$M
100bp decrease
$M
30 June 2009
Variable rate instruments (0.7) 1.6 – –
Interest rate swap – – 18.4 (18.4)
Cash flow sensitivity (net) (0.7) 1.6 18.4 (18.4)
30 June 2008
Variable rate instruments (11.4) 11.4 – –
Interest rate swap (0.3) 0.3 – –
Cash flow sensitivity (net) (11.7) 11.7 – –
For
per
sona
l use
onl
y

113TOLL | ANNUAL REPORT 2009
30. Financial Instruments (continued)
Fair valuesThe fair values of financial assets and liabilities, together with the carrying amounts shown in the balance sheet, are as follows:
Consolidated 30 June 2009 30 June 2008
Carrying amount
$MFair value
$M
Carrying amount
$MFair value
$M
Investments 1.4 1.4 69.6 69.6
Listed investments in associates 67.2 59.4 58.3 51.3
Financial assets at fair value through profit or loss – – 0.2 0.2
Loans and receivables 737.0 737.0 1,484.3 1,484.3
Cash and cash equivalents 885.6 885.6 354.0 354.0
Interest rate swaps used for hedging:
Assets 0.3 0.3 23.3 23.3
Liabilities (16.6) (16.6) (13.1) (13.1)
Cross currency interest rate swaps used for hedging:
Assets – – 12.9 12.9
Liabilities (22.8) (22.8) – –
Forward exchange contracts used for hedging:
Assets 0.9 0.9 11.5 11.5
Liabilities (0.9) (0.9) (11.7) (11.7)
Other forward exchange contracts
Assets 6.0 6.0 10.1 10.1
Liabilities (5.9) (5.9) – –
Fuel swaps used for hedging (0.3) (0.3) – –
Secured term and other loans (21.6) (21.6) (12.1) (12.0)
Unsecured term and other loans (1,184.7) (1,184.7) (1,325.8) (1,325.8)
Re-set preference shares – – (249.6) (249.6)
Finance lease liabilities (39.0) (39.0) (33.4) (33.4)
Hire purchase liabilities (1.5) (1.5) (0.6) (0.6)
Other financial liabilities (16.0) (16.0) (3.3) (3.3)
Trade and other payables (588.7) (588.7) (667.4) (667.4)
(199.6) (207.4) (292.8) (299.7)
For
per
sona
l use
onl
y

114
NOTEs TO ThE FiNANciAL sTATEmENTs CONTINUED
fOr ThE yEar ENDED 30 JUNE 2009
30. Financial Instruments (continued)
The Company 30 June 2009 30 June 2008
Carrying amount
$MFair value
$M
Carrying amount
$MFair value
$M
Loans and receivables 2,341.6 2,341.6 2,245.1 2,245.1
Cash and cash equivalents 0.2 0.2 0.5 0.5
Interest rate swaps used for hedging:
Assets – – 2.0 2.0
Liabilities – – (2.0) (2.0)
Other Forward exchange contracts:
Assets – – 9.2 9.2
Re-set preference shares – – (249.6) (249.6)
Trade and other payables (21.0) (21.0) (27.5) (27.5)
2,320.8 2,320.8 1,977.7 1,977.7
The basis for determining fair values is disclosed in note 3.
Fuel price risk
Sensitivity analysisA change of USD 50 per metric tonne (MT) in fuel prices at the reporting date would have increased (decreased) equity and profit or loss before tax by the amounts shown below. This analysis assumes that all other variables, in particular foreign currency rates, remain constant. The analysis is performed on the same basis for 2008.
Profit or loss Equity
50 MT increase
$M
50 MT decrease
$M
50 MT increase
$M
50 MT decrease
$M
30 June 2009Financial liabilities
– Derivative liabilities – – (0.2) (0.2)
There was no sensitivity to fuel price risk of the Group’s financial assets and liabilities at 30 June 2008.
The Company was not exposed to fuel price risk at 30 June 2009 and 30 June 2008.
For
per
sona
l use
onl
y

115TOLL | ANNUAL REPORT 2009
31. Contingencies
Details of contingent liabilities and contingent assets where the probability of future payments/receipts is not considered remote are set out below, as well as details of contingent liabilities and contingent assets, which although considered remote, the directors consider should be disclosed.
From time to time the Group is subject to claims and litigation during the normal course of business. The directors have given consideration to such matters, which are or may be subject to litigation at year-end, and subject to specific provisions raised are of the opinion that no material liability exists.
Contingent liabilitiesThe Company has issued bank guarantees in favour of certain controlled entities in respect of various banking and commercial arrangements. Under the terms of the financial guarantee contracts, the Company or the Group will make payments to reimburse the lenders upon failure of the guaranteed entity to make payments when due.
Terms and face values of the liabilities guaranteed were as follows:
Consolidated The Company
2009
$M2008
$M2009
$M2008
$M
Bank and other guarantees 48.8 4.8 48.8 4.8
For
per
sona
l use
onl
y

116
NOTEs TO ThE FiNANciAL sTATEmENTs CONTINUED
fOr ThE yEar ENDED 30 JUNE 2009
32. Commitments for Expenditure
Consolidated The Company
2009
$M2008
$M2009
$M2008
$M
(a) Capital Expenditure Commitments
Total capital expenditure contracted at balance date but not
provided for in the financial statements, payable:
Not later than one year 56.7 13.1 32.6 12.0
Later than one year but not later than five years – 6.1 – 6.0
Later than five years – – – –
56.7 19.2 32.6 18.0
Comprising:
Other property, plant and equipment 56.7 19.2 32.6 18.0
56.7 19.2 32.6 18.0
(b) Non-Cancellable Operating Lease Commitments
Future non-cancellable operating lease rentals of property, plant and equipment, not provided for in the financial statements, payable:
Not later than one year 213.1 168.9 4.0 3.3
Later than one year but not later than five years 495.0 450.6 4.9 8.7
Later than five years 233.0 162.0 – –
941.1 781.5 8.9 12.0
Comprising:
Property 733.0 581.1 – –
Aircraft and aeronautic-related equipment 37.0 41.5 – –
Other plant and equipment 171.1 158.9 8.9 12.0
941.1 781.5 8.9 12.0
(c) Finance Lease & Hire Purchase Commitments
Finance lease rentals and hire purchase payable are as follows:
Not later than one year 5.9 5.3 – –
Later than one year but not later than five years 22.7 16.1 – –
Later than five years 26.6 30.2 – –
Future lease rentals/repayments 55.2 51.6 – –
Less: Future finance charges (14.7) (17.6) – –
Total finance lease and hire purchase commitments in financial statements 40.5 34.0 – –
Finance lease commitment
Current (note 23) 3.0 2.0 – –
Non current (note 23) 36.0 31.4 – –
Total lease liability 39.0 33.4 – –
Hire purchase liability
Current (note 23) 0.6 0.2 – –
Non current (note 23) 0.9 0.4 – –
Total hire purchase liability 1.5 0.6 – –
40.5 34.0 – –
For
per
sona
l use
onl
y

117TOLL | ANNUAL REPORT 2009
33. Related Parties
Apart from the details disclosed in this note, no director or key management personnel has entered into a material contract with the Company or the Group since the end of the previous financial year and there are no material contracts involving directors’ or key management personnel interests existing at year-end.
DirectorsThe names of each person holding the position of Director of the Company at any time during the financial year are as follows:
Name Position
Paul Little Executive Director Managing Director
Ray Horsburgh Non-executive Director Chairman
Harry Boon Non-executive Director
Mark Smith Non-executive Director
Barry Cusack Non-executive Director
Frank Ford Non-executive Director
Neil Chatfield, Executive Director and Chief Financial Officer, ceased being KMP on 18 Sept 2008 and retired on 31 Mar 2009.
Other key management personnelThe following persons had authority and responsibility for planning, directing and controlling the activities of the Group, directly or indirectly, during the financial year:
Name Position
John Ludeke Chief Operating Officer
Stephen Stanley Strategy/Mergers and Acquisitions, Director
Hugh Cushing Toll Global Forwarding, CEO
David Jackson Toll Global Resources, CEO
Bernard McInerney Company Secretary
Wayne Hunt Toll Global Logistics, President and CEO
Mal Grimmond*Director Business Solutions and Chief Information Officer and Acting Chief Financial Officer
* KMP from 18 September 2008 to 6 July 2009
All of these persons with the exception of those noted above were also key management persons for the years ended 30 June 2008 and 30 June 2009.
Mr Brian Kruger commenced with Toll as Chief Financial Officer on 6 July 2009 and is considered a KMP from that date going forward.
Remuneration, Retirement Benefits and Service Arrangements of KMP
Consolidated The Company
2009 $’000
2008 $’000
2009 $’000
2008 $’000
Primary benefits 13,990 13,970 11,485 10,276
Post-employment benefits 1,572 1,348 1,572 883
Equity compensation 4,791 5,540 4,111 4,190
20,353 20,858 17,168 15,349
The Company has taken advantage of the relief provided by ASIC Class Order 06/05 and has transferred the detailed remuneration disclosures to the directors report. The relevant information can be found in the Remuneration Report.
For
per
sona
l use
onl
y

118
NOTEs TO ThE FiNANciAL sTATEmENTs CONTINUED
fOr ThE yEar ENDED 30 JUNE 2009
33. Related Parties (continued)
Equity instrument disclosures relating to key management personnel
(i) Options provided as remuneration and shares issued on exercise of such optionsDetails of options provided as remuneration and shares issued on the exercise of such options, together with the terms and conditions of the options can be found in the Remuneration Report.
(ii) Option holdingsThe numbers of options over ordinary shares in the Company held during the financial year by each director and other key management personnel of the Group are:
Balance 1 July ‘000
Granted during the
year ‘000
Sold during the
year ‘000
Forfeited during the
year ‘000
Exercised during the
year ‘000
Balance at 30 June
‘000
2009
Directors
Paul Little 739 777 – – – 1,516
Other Key Management Personnel
John Ludeke 209 427 – – – 636
Stephen Stanley 170 328 – – – 498
Hugh Cushing 79 158 – – – 237
Bernard McInerney 103 205 – – – 308
David Jackson 79 158 – – – 237
Wayne Hunt 120 259 – – – 379
Mal Grimmond* 30 71 – – – 101
Retired
Neil Chatfield (resigned as director 18 Sept 2008, retired 31 Mar 2009) 356 555 – – – 911
2008
Directors
Paul Little – 739 – – – 739
Neil Chatfield – 356 – – – 356
Other Key Management Personnel
John Ludeke – 209 – – – 209
Stephen Stanley – 170 – – – 170
Hugh Cushing – 79 – – – 79
Bernard McInerney – 103 – – – 103
David Jackson – 79 – – – 79
Wayne Hunt – 120 – – – 120
Brett Godfrey** – – – – – –
* KMP from 18 September 2008 to 6 July 2009** Ceased to be KMP at 30 June 2008F
or p
erso
nal u
se o
nly
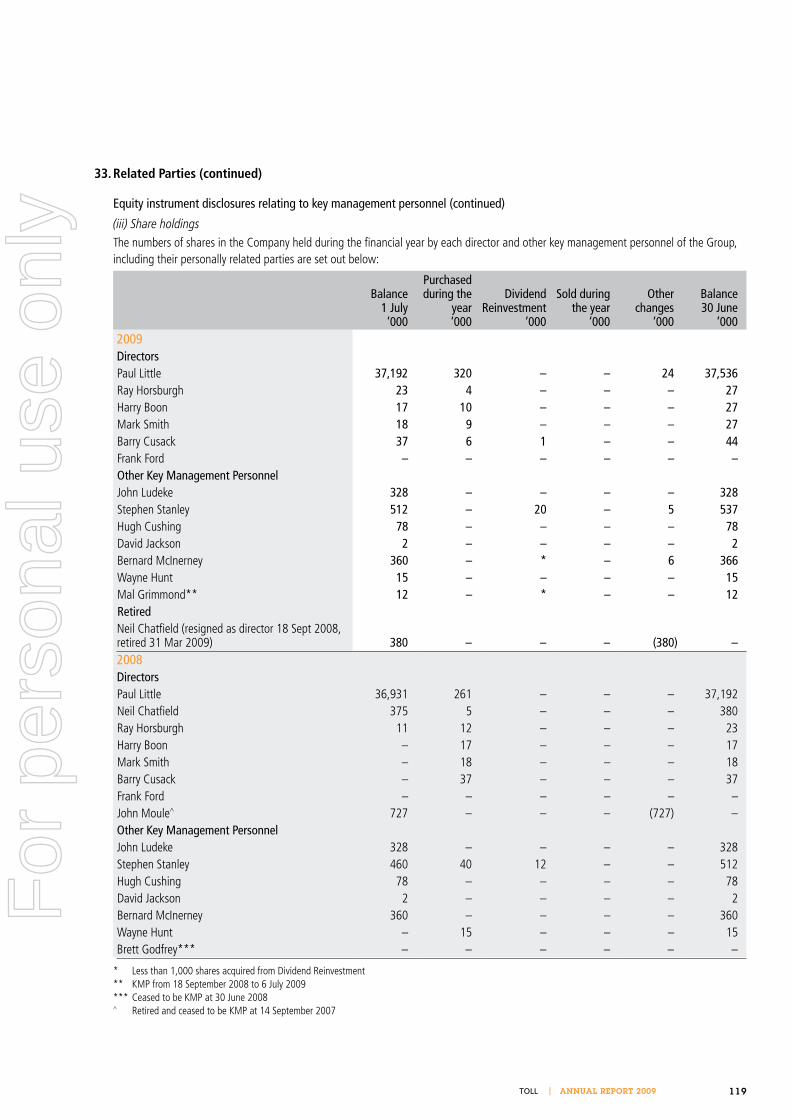
119TOLL | ANNUAL REPORT 2009
33. Related Parties (continued)
Equity instrument disclosures relating to key management personnel (continued)
(iii) Share holdingsThe numbers of shares in the Company held during the financial year by each director and other key management personnel of the Group, including their personally related parties are set out below:
Balance 1 July ‘000
Purchased during the
year ‘000
Dividend Reinvestment
‘000
Sold during the year
‘000
Other changes
‘000
Balance 30 June
‘0002009 Directors Paul Little 37,192 320 – – 24 37,536Ray Horsburgh 23 4 – – – 27Harry Boon 17 10 – – – 27Mark Smith 18 9 – – – 27Barry Cusack 37 6 1 – – 44Frank Ford – – – – – –Other Key Management PersonnelJohn Ludeke 328 – – – – 328Stephen Stanley 512 – 20 – 5 537Hugh Cushing 78 – – – – 78David Jackson 2 – – – – 2Bernard McInerney 360 – * – 6 366Wayne Hunt 15 – – – – 15Mal Grimmond** 12 – * – – 12RetiredNeil Chatfield (resigned as director 18 Sept 2008, retired 31 Mar 2009) 380 – – – (380) –2008 Directors Paul Little 36,931 261 – – – 37,192Neil Chatfield 375 5 – – – 380Ray Horsburgh 11 12 – – – 23Harry Boon – 17 – – – 17Mark Smith – 18 – – – 18Barry Cusack – 37 – – – 37Frank Ford – – – – – –John Moule^ 727 – – – (727) –Other Key Management Personnel John Ludeke 328 – – – – 328Stephen Stanley 460 40 12 – – 512Hugh Cushing 78 – – – – 78David Jackson 2 – – – – 2Bernard McInerney 360 – – – – 360Wayne Hunt – 15 – – – 15Brett Godfrey*** – – – – – –
* Less than 1,000 shares acquired from Dividend Reinvestment** KMP from 18 September 2008 to 6 July 2009*** Ceased to be KMP at 30 June 2008^ Retired and ceased to be KMP at 14 September 2007
For
per
sona
l use
onl
y

120
NOTEs TO ThE FiNANciAL sTATEmENTs CONTINUED
fOr ThE yEar ENDED 30 JUNE 2009
33. Related Parties (continued)
Equity instrument disclosures relating to key management personnel (continued)
(iv) Reset Preference shares*
Balance 30 June
2007
Purchased during the
yearSold during
the year
Balance 30 June
2008
Purchased during the
yearSold during
the yearOther
changes
Balance 30 June
2009
Paul Little 1,500 – – 1,500 – – (1,500) –
Bernard McInerney 360 – – 360 – – (360) –
Neil Chatfield (resigned as director 18 Sept 2008, retired 31 Mar 2009) 1,000 – – 1,000 – – (1,000) –
* All reset preference shares were converted to ordinary shares on 11 November 2008.
No director or other key management personnel other than those identified above held reset preference shares in the Company during the current year or the prior year.
Other Transactions of Directors and Director Related Entities and key management personnel with the Company or its Controlled EntitiesThe Group hired aircraft from Little Aviation Pty Ltd during the year. Paul Little is a director of Little Aviation Pty Ltd. An amount of $348,757.60 (2008: $12,452) was charged to the Group by Little Aviation Pty Ltd during the year. Of this amount, $79,349.60 remained payable at 30 June 2009. Approximately one third of these charges were equivalent to commercial business class airfares. The balance were charged at rates that reflect jet fuel recovery costs only.
Various businesses within the Group entertained customers at Australian V8 supercar events by utilising services of Paul Little Racing Pty Ltd. Paul Little is a director of Paul Little Racing Pty Ltd, which sponsors a V8 supercar team, that carry and promote the Toll brand. An amount of $397,446 (2008: $329,086) was charged to the Group at cost by Paul Little Racing during the year. Of this amount, $10,310 remained payable at 30 June 2009.
Wholly Owned GroupThe wholly owned Group consists of the Company and its wholly owned controlled entities as set out in note 33.
Transactions between the Company and related parties in the wholly owned Group during the years 30 June 2009 and 30 June 2008 consisted of:
(a) loans advanced by the Company; (b) loans repaid to the Company;(c) the payment of interest on the above loans;(d) the payment of dividends to the Company; and(e) the payment of head office overheads to the Company.
The above transactions were made on normal commercial terms and conditions and at market rates, except that there are no fixed terms for the repayment of principal on loans advanced by or to the Company.
For
per
sona
l use
onl
y

121TOLL | ANNUAL REPORT 2009
33. Related Parties (continued)
Wholly Owned Group (continued)Aggregate amounts included in the determination of profit from ordinary activities before income tax expense that resulted from transactions with related parties in the wholly owned Group were as follows:
The Company
2009 $’000
2008 $’000
Interest revenue 43,084 26,003
Dividend revenue 199,000 517,344
Internal recharge 51,545 46,266
Distribution from Trust 1,805 2,820
Outstanding balances with related parties in the wholly owned Group at balance date were as follows:
Current receivables 2,334,211 2,236,896
Non current receivables 4,871 4,872
Ownership Interests in Related PartiesInterests held in related parties are set out in notes 34 and 35.
Transactions with Related PartiesThe Group has entered into contracts in relation to the supply of transport and logistics services with certain related parties. The terms and conditions of those transactions were no more favourable than those available, or which might reasonably be expected to be available, on similar transactions to unrelated entities on an arm’s length basis.
Consolidated The Company
2009 $’000
2008 $’000
2009 $’000
2008 $’000
Purchases of goods and services
– Associates 2,032 – – –
– Other related parties – ‘Virgin’ and ‘Virgin Blue’ brand
name royalty* – 7,100 – –
Revenue from services provided:
– Associates
Revenue for sales, rental and marketing fee 10,412 – – –
– Other related parties – revenue for airline
Services* – 11,700 – –
Outstanding balances with Related Parties
Receivables
– Associates 6,829 6,238 1,305 763
– Other related parties 868 – – –
Payables
– Associates 274 – – –
– Other related parties 104 9,000 – –
* Virgin Blue ceased to be a related party at 30 June 2008.
Outstanding balances at year end are unsecured and settlement occurs in cash.
No guarantees are provided or received for any related party receivables or payables.
No provision for doubtful debts has been recognised in respect of amounts due from related parties.
For
per
sona
l use
onl
y

122
NOTEs TO ThE FiNANciAL sTATEmENTs CONTINUED
fOr ThE yEar ENDED 30 JUNE 2009
34. Particulars in Relation to Controlled Entities
Name of Entity Note Date relief granted (a) Country of Incorporation Ownership Interest
2009
%2008
%
The Company
Toll Holdings Limited
Controlled Entities of Toll Holdings Limited
246 Miller Pty Ltd Australia 100 100
Adderstone Finance Pty Ltd (d) Australia 100 100
Autotrans Express (Aust) Pty Ltd (a) 29 Oct 2001 Australia 100 100
Avellaneda Pty Ltd (d) Australia 100 100
BALtrans (Australia) Pty Ltd Australia 75 75
BALtrans (China) Ltd Hong Kong 100 100
BALtrans (Macau) Ltd Macau 60 60
BALtrans Exhibition & Removal Ltd Hong Kong 60 60
BALtrans Global Logistics Ltd (c) British Virgin Islands – 100
BALtrans International Cargo Ltd Peoples Republic of China 100 100
BALtrans International Moving Ltd Hong Kong 70 70
BALtrans International Special Freight Ltd Peoples Republic of China 60 60
BALtrans Logistics (China) Ltd Peoples Republic of China 100 100
BALtrans Logistics (Shanghai) Ltd Peoples Republic of China 100 100
BALtrans Logistics Ltd Hong Kong 100 100
BALtrans Logistics Sweden AB Sweden 100 100
BALtrans Ltd Xian Peoples Republic of China 60 60
BALtrans Ocean Inc USA 100 100
BALtrans Sweden Holding AB Sweden 100 100
BN Holding AG Switzerland 100 100
Bulkships (Hull 4381 & 4382) Pty Ltd (a) 27 June 2008 Australia 100 100
C J Dean Transport Pty Ltd (a) 5 June 2001 Australia 100 100
Cargo Distributors Pty Ltd (d) Australia 100 100
Cargo Link Pty Ltd (d) Australia 100 100
Cat-Link Ship Investments Pty Ltd Australia 75 75
Cement Goliath Pte Ltd (d) Singapore 100 100
CitiSprint Pty Ltd (c) Australia – 100
Complete Logistics Company Ltd Thailand 100 100
Condor Marine Services (Luxembourg) SA (d) Luxembourg 100 100
Corporate Century Ltd British Virgin Islands 100 100
Courier Australia Group Pty Ltd (a) 27 June 2008 Australia 100 100
Courier Australia Pty Ltd (c) Australia – 100
Courier Holdings Pty Ltd (a) 27 June 2008 Australia 100 100
Cumberlane Holdings Pty Ltd (a),(e) 26 July 2006 Australia 100 100
Dalanda Pty Ltd (d) Australia 100 100
Dangerous Goods Management (Singapore) Pte Ltd Singapore 70 70
For
per
sona
l use
onl
y

123TOLL | ANNUAL REPORT 2009
34. Particulars in relation to Controlled Entities (continued)
Name of Entity NoteDate relief
granted (a) Country of Incorporation Ownership Interest
2009
%2008
%
Dilmun Navigation (Fiji) Ltd (c) Fiji – 100
Dilmun Navigation (PNG) Ltd (d) Papua New Guinea 100 100
Dilmun Navigation (Singapore) Pte Ltd (d) Singapore 100 100
Dilmun Navigation Company Ltd (c) United Kingdom – 100
Doogs Pty Limited (c) Australia – 100
Down South Transport Pty Ltd (c) Australia – 100
Dynamic Container Line Ltd British Virgin Islands 100 100
Dynamic Logistics (Hong Kong) Ltd Hong Kong 100 100
Exhibitstrans Logistics Ltd Hong Kong 60 60
Extra Equipment Rentals Pty Ltd (a) 26 June 2009 Australia 100 –
FMS Facility Management Services Pty Ltd (c) Australia – 100
Fracht Forwarding & Travels (Private) Ltd India 100 100
Freight Solutions International LLC USA 100 100
Fuel Handling Systems Limited United Kingdom 100 100
Gluck Pty Ltd (a) 27 June 2008 Australia 100 100
Greens Distribution Pty Ltd (d) Australia 100 100
Guangdong Supreme International Forwarding Agency Company Ltd Peoples Republic of China 100 100
Guangzhou – Toll Warehousing Services Co. Ltd People’s Republic of China 100 100
Helicorp Pty Ltd Australia 100 100
Helijet Services Pty Ltd Australia 100 100
Higgins Global Logistics (Pty) Ltd South Africa 69 41
Holyman (Luxembourg) SA (d) Luxembourg 100 100
Holyman (NZ) Pty Ltd (a),(e) 26 July 2006 Australia 100 100
Holyman (South East Asia) Pte Ltd (d) Singapore 100 100
Holyman (UK) Ltd (d) United Kingdom 100 100
Holyman (USA) Inc (c) USA – 100
Holyman Catalina Agencies LLC (c) USA – 80
Holyman Ferries Pte Ltd (d) Singapore 100 100
Holyman Operations Pty Ltd Australia 100 100
Holyman Ports Pty Ltd (c) Australia – 100
Holyman Pty Ltd (a),(e) Australia 100 100
Holyman Refrigeration Pty Ltd (d) Australia 100 100
Holyman Shipping Services Pty Ltd (a) 26 July 2006 Australia 100 100
Holyman Superannuation Pty Ltd Australia 100 100
Holyman Transport Pty Ltd (a) 27 June 2008 Australia 100 100
International Corporate Relocations Pty Ltd (c) Australia – 100
Intravest Pty Ltd (a) 27 June 2008 Australia 100 100
Inverlael Pty Ltd (a) 27 June 2008 Australia 100 100
Jack SeatonsTransport Pty Ltd (d) Australia 100 100
Jamison Equity Pty Ltd (a),(e) 26 July 2006 Australia 100 100
For
per
sona
l use
onl
y

124
NOTEs TO ThE FiNANciAL sTATEmENTs CONTINUED
fOr ThE yEar ENDED 30 JUNE 2009
34. Particulars in relation to Controlled Entities
Name of Entity NoteDate relief
granted (a) Country of Incorporation Ownership Interest
2009
%2008
%
JLS (HK) Ltd Hong Kong 100 100
JLS Logistics (Hong Kong) Ltd Hong Kong 100 100
JLS Logistics (Malaysia) Sdn Bhd (d) Malaysia 100 100
JLS Logistics (Singapore) Pte Ltd Singapore 100 100
JLS Logistics (Thailand) Ltd Thailand 100 100
JLS Transport Services (China) Ltd Hong Kong 100 100
JTS Transport Services (Delaware) Ltd USA 100 100
Lang Securities Pty Ltd (a) 27 June 2008 Australia 100 100
Liberty Air Services Pty Ltd (c) Australia – 100
Liberty Cargo Systems Pty Ltd (a),(e) 26 July 2006 Australia 100 100
Liberty Pacific (Qld) Pty Ltd (b),(d) Australia 50 50
Liberty Pacific Pty Ltd Australia 100 100
Logistics 21 Pte Ltd Singapore 100 100
Maremma Pty Ltd (a) 27 June 2008 Australia 100 100
Marigold Logistics Limited Hong Kong 100 100
Mather & Platt (Engineering) Ltd Hong Kong 100 100
Mather & Platt Investments Pty Ltd Australia 100 100
Mega Bara Logistics Pte Ltd (c) Singapore – 60
Movinghome.com.au.Pty Ltd (c) Australia – 100
Mulgara Pty Ltd (a) 27 June 2008 Australia 100 100
Muragawa Logistics Ltd Hong Kong 100 100
National Stevedores Tasmania Pty Ltd (d) Australia 100 100
Offshore Joint Services (Bases) Company of Singapore Pte Ltd Singapore 75 75
Oil Tex (Thailand) Co. Ltd Thailand 60 60
Patrick Bulk Transport Pty Ltd (d) Australia 100 100
Patrick Chartering Pty Ltd Australia 100 100
Patrick International Freight (NZ) Ltd (c) New Zealand – 100
Patrick Logistics (NZ) Ltd (c) New Zealand – 100
Patrick Logistics Superannuation Pty Ltd Australia 100 100
Patrick Packing Services Pty Ltd Australia 100 100
Patrick Shipping Pty Ltd (a),(e) 26 July 2006 Australia 100 100
Patrick Stevedores No.1 Pty Ltd (d) Australia 100 100
Patrick Stevedores No.2 Pty Ltd (d) Australia 100 100
Patrick Stevedores No.3 Pty LtdPDL Toll USA IncPlexis Services Inc
(d)
AustraliaUSAUSA
100100100
100–
100
PRK Corporation Pty Ltd (a) 26 July 2006 Australia 100 100
For
per
sona
l use
onl
y

125TOLL | ANNUAL REPORT 2009
34. Particulars in relation to Controlled Entities (continued)
Name of Entity NoteDate relief
granted (a) Country of Incorporation Ownership Interest
2009
%2008
%
PT Bahana Perintis Indonesia Indonesia 100 100
PT BALtransindo Indonesia 90 90
PT Interglobal Jasa Karya Indonesia Indonesia 100 100
PT Sin Kepri Logistik Indonesia 95 95
PT SK Logistik Indonesia Indonesia 100 100
PT SK Pelarayan Indonesia Indonesia 100 51
PT Toll Global Forwarding Indonesia (formerly PT BALtrans Logistics Indonesia) Indonesia 100 100
PT Toll Indonesia Indonesia 51 51
Quality Solutions International Limited New Zealand 100 –
Quexton Pty Ltd (a) 27 June 2008 Australia 100 100
R&H Nominees Pty Ltd (d) Australia 100 100
R&H Transport Services Pty Ltd (a),(e) 28 April 2004 Australia 100 100
Refrigerated Roadways Pty Ltd (a),(e) 15 June 1998 Australia 100 100
Resarta Pty Ltd (a) 27 June 2008 Australia 100 100
Scarabus Pty Ltd (a) 26 July 2006 Australia 100 100
Seatons Container Freight Station Pty Ltd Australia 100 100
Sembawang Kimtrans Marine Pte Ltd Singapore 100 100
Sembawang Kimtrans Shipping Pte Ltd Singapore 100 100
Serenade Pty Ltd (a) 26 July 2006 Australia 100 100
Shenzhen ST-Anda Logistics Co. Ltd People’s Republic of China 51 51
Singapore Technologies Logistics Pte Ltd Singapore 100 100
SML Investments Pte Ltd (c) Singapore – 100
SOPS (Bangladesh) Private Ltd (d) Bangladesh 100 100
SOPS (Cambodia) Co. Ltd Cambodia 100 100
SOPS Orient Caspian Pte Ltd Bermuda 65 65
ST Airport Services Pte Ltd Singapore 67 67
ST Logistics (UK) Ltd United Kingdom 100 100
ST Logistics (USA) Inc USA 100 100
ST Logistics Pte Ltd Singapore 100 100
ST Medical Services Pte Ltd Singapore 100 100
STARS (TL) Lda Timor Leste 67 67
Stream Solutions (Holdings) Pty Ltd (a) 27 June 2008 Australia 100 100
Stream Solutions Pty Ltd (a) 27 June 2008 Australia 100 100
Supreme Freight Consolidators (Ocean) Ltd Hong Kong 100 100
Supreme Logistics (Hong Kong) Ltd Hong Kong 100 100
For
per
sona
l use
onl
y

126
NOTEs TO ThE FiNANciAL sTATEmENTs CONTINUED
fOr ThE yEar ENDED 30 JUNE 2009
34. Particulars in relation to Controlled Entities (continued)
Name of Entity NoteDate relief
granted (a) Country of Incorporation Ownership Interest
2009
%2008
%
Toll (Asia) Pte Ltd Singapore 100 100
Toll (Cambodia) Co. Limited Cambodia 100 100
Toll (Corporate Services) Pty Ltd Australia 100 100
Toll (Cowra) Pty Ltd (a),(e) 5 June 2001 Australia 100 100
Toll (FGCT) Pty Ltd (c) Australia – 100
Toll (FHL) Pty Ltd (a) 5 June 2001 Australia 100 100
Toll (HK) Ltd Hong Kong 100 100
Toll (India) Logistics Pvt Ltd India 100 100
Toll (New Zealand) Limited New Zealand 100 100
Toll (PRK) Finance Pty Ltd (a) 26 July 2006 Australia 100 100
Toll (PRK) Tasmania Pty Ltd (a) 27 June 2008 Australia 100 100
Toll (Qingdao) Warehousing Services Co. Ltd Peoples Republic of China 100 100
Toll (SCL) Ltd Singapore 100 100
Toll (Singapore) Pte Ltd (f) Singapore – 100
Toll (Taiwan) Ltd Taiwan 100 100
Toll (Thailand) Ltd Thailand 100 100
Toll (TL) Unipessoal Lda Timor Leste 100 100
Toll (USA) Inc USA 100 100
Toll (Vietnam) Limited Vietnam 100 100
Toll Aircraft Maintenance Pty Ltd (a),(e) 26 July 2006 Australia 100 100
Toll Auto Logistics Investments (No.1) Pte Limited (formerly SOPS Investments Pte Ltd) Singapore 100 100
Toll Aviation Components Pty Ltd ( formerly Jetline Engineering Pty Ltd) Australia 100 100
Toll Aviation Engineering Pty Ltd (formerly Jet Care Pty Ltd) (a),(e) 26 July 2006 Australia 100 100
Toll Aviation Pty Ltd (formerly Jetcraft Aviation Pty Ltd) Australia 100 100
Toll Carriers Limited New Zealand 100 100
Toll Energy Logistics Pty Ltd (a) 15 June 1998 Australia 100 100
Toll Equipment (FFM) Pty Ltd (a) 27 June 2008 Australia 100 100
Toll Express (Asia) Pte Ltd Singapore 100 100
Toll Finance (NZ) Limited New Zealand 100 100
Toll Finance Pty Ltd (a) 4 June 2004 Australia 100 100
Toll Fleet Equipment (Malaysia) Sdn Bhd Malaysia 70 70
Toll Funding (Singapore) Pte Ltd Singapore 100 100For
per
sona
l use
onl
y

127TOLL | ANNUAL REPORT 2009
34. Particulars in relation to Controlled Entities (continued)
Name of Entity NoteDate relief
granted (a) Country of Incorporation Ownership Interest
2009
%2008
%
Toll Global Forwarding (Hong Kong) Ltd (formerly BALtrans Logistics (Hong Kong) Ltd) Hong Kong 100 100
Toll Global Forwarding (Shenzhen) Ltd (formerly BALtrans Logistics (Shenzhen) Ltd) Peoples Republic of China 100 100
Toll Global Forwarding (BVI) Ltd (formerly BJ Logistics Holdings Ltd) British Virgin Islands 100 100
Toll Global Forwarding (Canada) Ltd (formerly BALtrans Logistics (Canada) Ltd) Canada 70 70
Toll Global Forwarding (China) Ltd (formerly BALtrans Logistics Company Limited) Peoples Republic of China 100 100
Toll Global Forwarding (France) SAS (formerly BALtrans Logistics (France) SAS) France 100 100
Toll Global Forwarding (Germany) GMBH (formerly BALtrans Logistics (Germany) GMBH) Germany 100 100
Toll Global Forwarding (India) Private Ltd (formerly BALtrans Logistics (India) Private Ltd) India 100 100
Toll Global Forwarding (Lanka) Pvt Ltd (formerly BALtrans Logistics (Lanka) Pvt Ltd) Sri Lanka 84 84
Toll Global Forwarding (Malaysia) Sdn Bhd (formerly BALtrans Logistics (Malaysia) Sdn Bhd) Malaysia 100 100
Toll Global Forwarding (Netherlands) B.V. (formerly BALtrans Logistics (Netherlands) B.V.) Netherlands 100 100
Toll Global Forwarding (SA) (Pty) Ltd (formerly BALtrans Clover Cargo (Proprietary) Limited) South Africa 82 62
Toll Global Forwarding (SA) Investments (Pty) Ltd (formerly BALtrans Clover Cargo Investments (Proprietary) Limited) South Africa 82 62
Toll Global Forwarding (Singapore) Pte Ltd (formerly BALtrans Logistics Pte Ltd) Singapore 100 100
Toll Global Forwarding (Taiwan) Ltd (formerly BALtrans Logistics (Taiwan) Ltd) Taiwan 100 100
Toll Global Forwarding (Thailand) Co. Ltd (formerly BALtrans Logistics (Thailand) Co. Ltd) Thailand 100 100
Toll Global Forwarding (UAE) LLC (formerly BALtrans Logistics (UAE) LLC) Dubai 100 100
Toll Global Forwarding (USA) Inc (formerly BALtrans Logistics Inc) USA 100 100
Toll Global Forwarding Cooperatief U.A. (formerly BALtrans Logistics International Cooperatief U.A.) Netherlands 100 100
Toll Global Forwarding Holdings (SA) (Pty) Ltd (formerly BALtrans Clover Cargo Holdings (Proprietary) Limited) South Africa 82 62
Toll Global Forwarding Holdings (USA) Inc (formerly BALtrans International (USA) Inc) USA 100 100
For
per
sona
l use
onl
y

128
NOTEs TO ThE FiNANciAL sTATEmENTs CONTINUED
fOr ThE yEar ENDED 30 JUNE 2009
34. Particulars in relation to Controlled Entities (continued)
Name of Entity NoteDate relief
granted (a) Country of Incorporation Ownership Interest
2009
%2008
%
Toll Global Forwarding Holdings Limited (formerly Toll (BVI) Limited) British Virgin Islands 100 100
Toll Global Forwarding International (BVI) Ltd (formerly BALtrans International (BVI) Ltd) British Virgin Islands 100 100
Toll Global Forwarding Ltd (formerly BALtrans Holdings Limited) Bermuda 100 100
Toll Global Forwarding Pty Ltd (a) 26 July 2006 Australia 100 100
Toll Global Forwarding Services (Malaysia) Sdn Bhd (formerly BALtrans Forwarding Sdn Bhd) Malaysia 100 100
Toll Global Forwarding (UK) Ltd (formerly BALtrans Logistics UK Ltd) United Kingdom 100 100
Toll Global Forwarding WC (SA) (Pty) Ltd (formerly BALtrans Clover Cargo WC Pty Ltd) South Africa 82 37
Toll Global Forwarding Services Ltd (formerly Supreme Logistics Ltd) Hong Kong 100 100
Toll Group (NZ) Ltd New Zealand 100 100
Toll Holdings (Thailand) Ltd Thailand 100 100
Toll Holdings Property Trust Australia 100 100
Toll Integrated Feeder Pte Ltd (formerly Xpress 21 Pte Ltd) Singapore 100 100
Toll Integrated Logistics (M) Sdn Bhd Malaysia 100 100
Toll International Investments Pty Limited (a) 27 June 2008 Australia 100 100
Toll IPEC Pty Ltd (a) 26 Oct 1999 Australia 100 100
Toll Kukbo Co Ltd South Korea 51 51
Toll Logistics (Asia) Ltd Singapore 100 100
Toll Logistics (NZ) Ltd New Zealand 100 100
Toll Logistics (Shanghai) Co Ltd (formerly SembCorp Logistics (Shanghai) Co Ltd) Peoples Republic of China 100 100
Toll Logistics (Thailand) Ltd Thailand 100 100
Toll Logistics Asia (M) Sdn Bhd Malaysia 100 100
Toll Logistics Australia Pty Ltd (a),(e) 15 June 1998 Australia 100 100
Toll – Macro Asia Philippines Inc Philippines 51 51
Toll Networks (NZ) Ltd New Zealand 100 100
Toll North Pty Ltd (a) 15 June 1998 Australia 100 100
Toll Offshore Petroleum Services Pte Ltd (formerly Singapore Offshore Petroleum Services Pte Ltd) Singapore 100 100
Toll PDI Investments Pty Ltd (formerly ARC Strang Pty Ltd) (a) 27 June 2008 Australia 100 100
Toll Personnel Pty Ltd (a) 26 July 2006 Australia 100 100
Toll Ports NZ Limited (g) New Zealand – 100
Toll Properties Pty Ltd (a) 21 Dec 1994 Australia 100 100
Toll Property Fund Holdings Pty Ltd (a) 27 June 2008 Australia 100 100
Toll Pty Ltd (a) 5 June 2001 Australia 100 100
Toll Rail Investments Pty Ltd (c) Australia – 100
Toll RE Limited Australia 100 100
For
per
sona
l use
onl
y

129TOLL | ANNUAL REPORT 2009
34. Particulars in relation to Controlled Entities (continued)
Name of Entity NoteDate relief
granted (a) Country of Incorporation Ownership Interest
2009
%2008
%
Toll Relocations Pty Ltd (c) Australia – 100
Toll-SGN Vietnam Co. Ltd Vietnam 60 60
Toll Shipping (IOM) Ltd Isle of Man 100 100
Toll Shipping Seagoing Officers Superannuation Pty Ltd (a) 27 June 2008 Australia 100 100
Toll Support Services Pty Ltd (a) 27 June 2008 Australia 100 100
Toll Technologies Investments Pty Ltd (a) 12 June 2001 Australia 100 100
Toll Technologies Pty Ltd (a) 27 June 2008 Australia 100 100
Toll Transport Pty Ltd (a) 11 June 1993 Australia 100 100
Toll Warehouse (Thailand) Limited Thailand 100 100
Toll Zenecon Pte Ltd Singapore 51 51
Twala Global Cargo (Pty) Ltd South Africa 61 23
Union Corporate Services Pty Ltd (a),(e) 26 July 2006 Australia 100 100
United Asia Terminals (Yantian) Ltd Hong Kong 100 40
United Distribution Services (Far East) Ltd Hong Kong 100 100
Victorian Express Pty Ltd (a) 27 June 2008 Australia 100 100
Villawood Unit Trust Australia 100 100
Western Packing Pty Ltd (d) Australia 100 100
Wilgroup Nominees Pty Ltd (c) Australia – 100
Wilgroup Pty Ltd Australia 100 100
Win Profit Corporation Ltd Hong Kong 100 100
Woden Investments Pty Ltd (a) 27 June 2008 Australia 100 100
Zimbery Investment (Lanka) Pvt Ltd Sri Lanka 100 100
Zimbery Ltd Hong Kong 100 100
(a) Entities are parties to a Deed of Cross Guarantee with Toll Holdings Ltd in respect of relief granted from specific accounting and financial reporting requirements in accordance with ASIC class order 98/1418. Refer to note 36.
(b) The consolidated entity owns 50% of Liberty Pacific (Qld) Pty Ltd. The company is controlled because the consolidated entity has the power to govern the decision making in relation to the finance and operating policies. The non-controlling interest in the entity is held by two parties each with a 25% equity interest.
(c) Liquidated during the year.(d) In voluntary liquidation as at 30 June 2009(e) Entities to the Deed of Cross Guarantee referred to in (a) are released from the Deed of Cross Guarantee pursuant to Revocation Deed on the relevant date. Refer
to Note 36.(f) Amalgamated with Toll Logistics (Asia) Limited during the year(g) Amalgamated with Toll (New Zealand) Limited during the year
For
per
sona
l use
onl
y

130
NOTEs TO ThE FiNANciAL sTATEmENTs CONTINUED
fOr ThE yEar ENDED 30 JUNE 2009
35. Investments in Associates and Joint Ventures
In the financial statements of the Company, investments in associates and joint ventures are accounted for at cost and included with investments. The Group accounts for investments in associates and joint ventures using the equity method. The consolidated entity and the Company have the following investments in associates and joint ventures:
Ordinary Share
Ownership Interest Investment Carrying Value
Consolidated The Company
Name Note Principal Activities2009
%2008
%2009
$M2008
$M2009
$M2008
$M
AMI Asia HK Ltd (formerly UAC Asia Ltd) (a) Freight forwarding 50 50 0.1 – – –
BIC Logistics Ventures Limited Freight forwarding 40 – 10.3 – – –
BES Technology Pte Ltd (a) Provision of biomedical equipment and technical services for medical equipment 35 35 0.2 – – –
Bharat STARS Services Pvt Ltd Freight forwarding 34 34 1.2 1.0 – –
Cargo Consortium (Klia) Sdn Bhd (d) In liquidation 34 34 – – – –
Cargo Services Group Freight consolidation business 25 22 62.8 32.9 – –
CWT-SML Logistics LLC (a) Warehouse distribution 30 30 3.6 2.4 – –
DGM Support (Asia) Pte Ltd (a) Provision of specialised training and related activities in dangerous goods management 21 14 0.1 – – –
Footwork Express Co. Ltd Transportation and warehousing services 33 38 80.9 67.9 – –
Freight Management Alliance Limited (c) Freight forwarding – 20 – – – –
Higgins Global Logistics (Pty) Ltd (b) Freight forwarding – 42 – – – –
Hubei Nan Yang (Shenzhen) Air Express Ltd (a) Dormant 50 50 – – – –
Jet Quay Pte Ltd Airport facilitation service 29 29 – – – –
JPM Logistics Inc Dormant 28 28 – – –Lion-Kimtrans Logistics Sdn Bhd Dormant 25 25 0.5 – – –
Macquarie Textile Holdings Pty Ltd Manufacturer of woollen and worsted fabrics 34 34 3.0 2.9 – –
Minto Properties Pty Ltd Property owner 50 50 12.8 13.1 – –
Pacorini Toll Pte Ltd Collateral management and specialised logistics 50 50 4.7 3.4 – –
Prixcar Services Pty Ltd Pre-dealer motor vehicle preparation 50 50 21.2 21.3 – –
PT 1-Logistics BALtrans Indonesia (c) Freight forwarding – 30 – – – –
QLM Pty Ltd Dormant 50 50 – – – –
SeaHighway Pty Ltd Property owner 50 50 – – – –
SembCorp Network Pte Ltd Provision of logistics support and services 50 50 0.2 0.2 – –
SembCorp-Translink Parami Logistics Ltd (a),(d) Freight forwarding 30 30 – – – –
Shenyang-SML International Distripark Ltd (a) Operation of a distripark 49 49 3.9 3.2 – –
Shenzen-Chiwan Petroleum Supply Base Co Ltd (a),(e) Operation of an offshore supply base 17 17 67.2 58.3 – –
Shenzhen Yantian Port Logistics Services Co. Ltd (a) Freight forwarding 30 30 0.6 – – –
SOPS Limited Liability Company (a) Provision of offshore logistics services 32 32 0.2 – – –
ST-KN Pte Ltd (a),(d) Freight forwarding 49 49 – – – –
Tenix Toll Defence Logistics Pty Ltd (c) Logistics provider to Defence Department – 50 – 8.8 – 16.3
Toll Asia Sunway Logistics Pte Ltd Dormant 50 – – – – –
Toll Dnata Airport Services Pty Ltd Airport ground handling services 50 50 6.5 6.0 6.8 6.8
Toll Global Forwarding WC (SA) Pty Ltd (formerly BALtrans Clover Cargo WC ) (b) Freight forwarding – 37 – – – –
Toll Global Logistics Lanka (Pvt) Ltd (formerly Ceylinco Toll Integrated Logistics (Pvt) Ltd (a) Provision of logistics services 50 50 0.2 0.1 – –
Toll Goodman Property Services Pty Ltd Property developer and owner 50 50 1.2 0.9 – –
Toll – Jalco Distribution Pty Ltd Distribution 50 50 0.7 1.3 – –
Toll Mermaid Logistics Broome Pty Ltd Provides supply base and logistics services to oil and gas industry companies 50 50 3.8 1.6 0.4 0.4
Toll Zari Holdings Malaysia Sdn Bhd Investment holding 30 30 – – – –
Twala Global Cargo (Pty) Ltd (b) Freight forwarding – 23 – – – –
UCM Oil-Tex Threading Ltd (a) Oil field equipment machine and repair 29 29 1.1 0.7 – –
Unibulk Pty Ltd (c) Bulk transportation – 50 – – – –
United Asia Terminals (Yantian) Ltd (b) Warehousing, distribution and logistics services – 40 – – – –
Zari Haulage Sdn Bhd Logistics provider 45 45 – – – –
Zuellig Insurance Brokers Pte Ltd (a) General and Life Insurance broking 49 49 1.2 0.9 – –
288.2 226.9 7.2 23.5
Balance date for all associated companies is 30 June unless otherwise disclosed(a) Balance date of entity is 31 December (b) The Group increased its shareholdings in these companies during the year ended 30 June 2009 and are now controlled entities.
For
per
sona
l use
onl
y
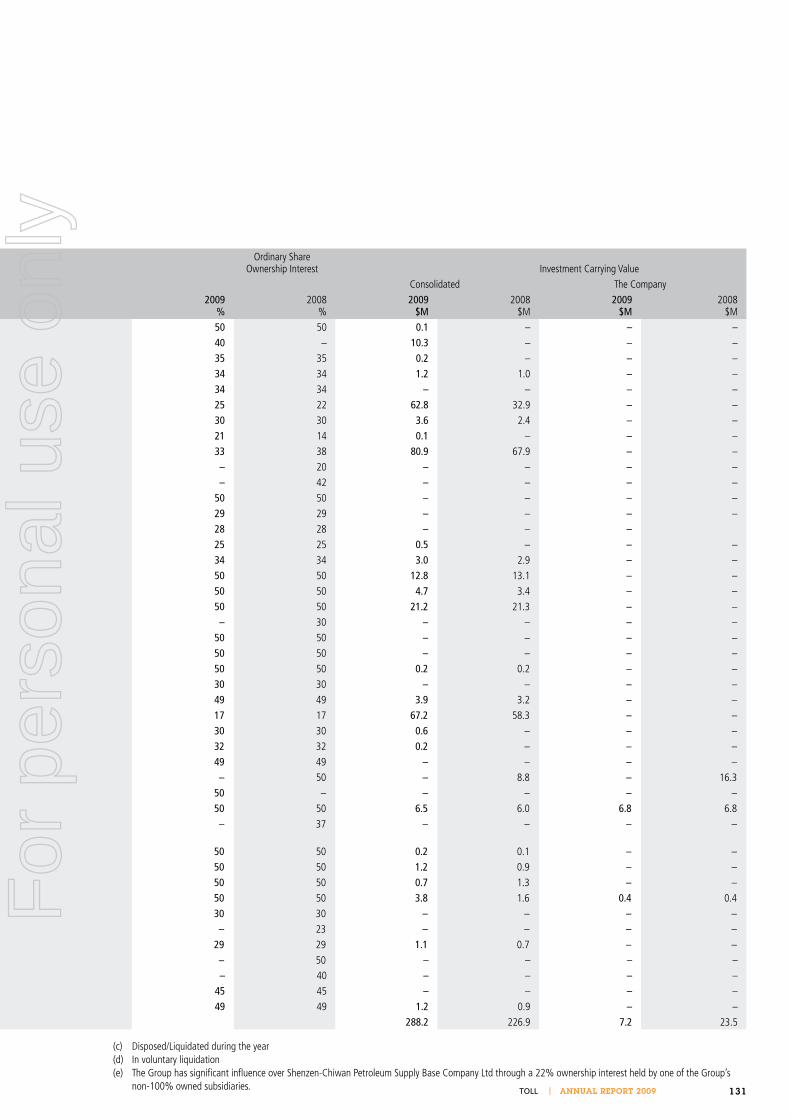
131TOLL | ANNUAL REPORT 2009
35. Investments in Associates and Joint Ventures
In the financial statements of the Company, investments in associates and joint ventures are accounted for at cost and included with investments. The Group accounts for investments in associates and joint ventures using the equity method. The consolidated entity and the Company have the following investments in associates and joint ventures:
Ordinary Share
Ownership Interest Investment Carrying Value
Consolidated The Company
Name Note Principal Activities2009
%2008
%2009
$M2008
$M2009
$M2008
$M
AMI Asia HK Ltd (formerly UAC Asia Ltd) (a) Freight forwarding 50 50 0.1 – – –
BIC Logistics Ventures Limited Freight forwarding 40 – 10.3 – – –
BES Technology Pte Ltd (a) Provision of biomedical equipment and technical services for medical equipment 35 35 0.2 – – –
Bharat STARS Services Pvt Ltd Freight forwarding 34 34 1.2 1.0 – –
Cargo Consortium (Klia) Sdn Bhd (d) In liquidation 34 34 – – – –
Cargo Services Group Freight consolidation business 25 22 62.8 32.9 – –
CWT-SML Logistics LLC (a) Warehouse distribution 30 30 3.6 2.4 – –
DGM Support (Asia) Pte Ltd (a) Provision of specialised training and related activities in dangerous goods management 21 14 0.1 – – –
Footwork Express Co. Ltd Transportation and warehousing services 33 38 80.9 67.9 – –
Freight Management Alliance Limited (c) Freight forwarding – 20 – – – –
Higgins Global Logistics (Pty) Ltd (b) Freight forwarding – 42 – – – –
Hubei Nan Yang (Shenzhen) Air Express Ltd (a) Dormant 50 50 – – – –
Jet Quay Pte Ltd Airport facilitation service 29 29 – – – –
JPM Logistics Inc Dormant 28 28 – – –Lion-Kimtrans Logistics Sdn Bhd Dormant 25 25 0.5 – – –
Macquarie Textile Holdings Pty Ltd Manufacturer of woollen and worsted fabrics 34 34 3.0 2.9 – –
Minto Properties Pty Ltd Property owner 50 50 12.8 13.1 – –
Pacorini Toll Pte Ltd Collateral management and specialised logistics 50 50 4.7 3.4 – –
Prixcar Services Pty Ltd Pre-dealer motor vehicle preparation 50 50 21.2 21.3 – –
PT 1-Logistics BALtrans Indonesia (c) Freight forwarding – 30 – – – –
QLM Pty Ltd Dormant 50 50 – – – –
SeaHighway Pty Ltd Property owner 50 50 – – – –
SembCorp Network Pte Ltd Provision of logistics support and services 50 50 0.2 0.2 – –
SembCorp-Translink Parami Logistics Ltd (a),(d) Freight forwarding 30 30 – – – –
Shenyang-SML International Distripark Ltd (a) Operation of a distripark 49 49 3.9 3.2 – –
Shenzen-Chiwan Petroleum Supply Base Co Ltd (a),(e) Operation of an offshore supply base 17 17 67.2 58.3 – –
Shenzhen Yantian Port Logistics Services Co. Ltd (a) Freight forwarding 30 30 0.6 – – –
SOPS Limited Liability Company (a) Provision of offshore logistics services 32 32 0.2 – – –
ST-KN Pte Ltd (a),(d) Freight forwarding 49 49 – – – –
Tenix Toll Defence Logistics Pty Ltd (c) Logistics provider to Defence Department – 50 – 8.8 – 16.3
Toll Asia Sunway Logistics Pte Ltd Dormant 50 – – – – –
Toll Dnata Airport Services Pty Ltd Airport ground handling services 50 50 6.5 6.0 6.8 6.8
Toll Global Forwarding WC (SA) Pty Ltd (formerly BALtrans Clover Cargo WC ) (b) Freight forwarding – 37 – – – –
Toll Global Logistics Lanka (Pvt) Ltd (formerly Ceylinco Toll Integrated Logistics (Pvt) Ltd (a) Provision of logistics services 50 50 0.2 0.1 – –
Toll Goodman Property Services Pty Ltd Property developer and owner 50 50 1.2 0.9 – –
Toll – Jalco Distribution Pty Ltd Distribution 50 50 0.7 1.3 – –
Toll Mermaid Logistics Broome Pty Ltd Provides supply base and logistics services to oil and gas industry companies 50 50 3.8 1.6 0.4 0.4
Toll Zari Holdings Malaysia Sdn Bhd Investment holding 30 30 – – – –
Twala Global Cargo (Pty) Ltd (b) Freight forwarding – 23 – – – –
UCM Oil-Tex Threading Ltd (a) Oil field equipment machine and repair 29 29 1.1 0.7 – –
Unibulk Pty Ltd (c) Bulk transportation – 50 – – – –
United Asia Terminals (Yantian) Ltd (b) Warehousing, distribution and logistics services – 40 – – – –
Zari Haulage Sdn Bhd Logistics provider 45 45 – – – –
Zuellig Insurance Brokers Pte Ltd (a) General and Life Insurance broking 49 49 1.2 0.9 – –
288.2 226.9 7.2 23.5
Balance date for all associated companies is 30 June unless otherwise disclosed(a) Balance date of entity is 31 December (b) The Group increased its shareholdings in these companies during the year ended 30 June 2009 and are now controlled entities.
(c) Disposed/Liquidated during the year(d) In voluntary liquidation(e) The Group has significant influence over Shenzen-Chiwan Petroleum Supply Base Company Ltd through a 22% ownership interest held by one of the Group’s
non-100% owned subsidiaries.
For
per
sona
l use
onl
y

132
NOTEs TO ThE FiNANciAL sTATEmENTs CONTINUED
fOr ThE yEar ENDED 30 JUNE 2009
35. Investments in Associates and Joint Ventures (continued)
Results of associates and joint ventures
Consolidated
2009
$M2008
$M
Share of associates’ and joint ventures’ net profit accounted for using the equity method:
– from continuing operations 21.2 5.2
– from discontinued operations – –
21.2 5.2
Fair value of listed investments in associates
Shenzen-Chiwan Petroleum Supply Base Co Limited 59.4 51.3
Summarised financial information of equity accounted associates, not adjusted for the percentage ownership held by the Group
Total assets 1,317.5 941.1
Total liabilities 817.5 590.5
Total revenue 2,057.4 1,780.8
Total profit 56.6 17.2
For
per
sona
l use
onl
y

133TOLL | ANNUAL REPORT 2009
36. Deed of Cross Guarantee
Pursuant to an ASIC Class Order 98/1418 dated 13 August, 1998, relief was granted to certain wholly owned subsidiaries (refer note 34) from the Corporations Act 2001 requirements for preparation, audit and lodgement of financial reports and Directors Report.
It is a condition of the Class Order that the Company and each of these controlled entities enter into a Deed of Cross Guarantee. The effect of the Deed is that the Company guarantees to each creditor payment in full of any debt in the event of winding up of any of the controlled entities under certain provisions of the Corporations Act 2001. If a winding up occurs under the provisions of the Act, the Company will be liable in the event that after six months any creditor has not been paid in full. These controlled entities have also given similar guarantees in the event that the Company is wound up.
The controlled entities subject to the Deed are set out in note 34.
A consolidated income statement and consolidated balance sheet as at 30 June 2009 for the Company and the controlled entities which are party to the Deed after eliminating all transactions between parties to the Deed of Cross Guarantee at 30 June 2009 is set out below:
Consolidated
2009
$M2008
$M
Income Statement
Profit/(loss) before income tax 381.1 (181.9)
Income tax expense (89.4) (94.4)
Profit/(loss) for the year 291.7 (276.3)
Retained earnings at the beginning of the financial year (420.5) 350.3
Dividends provided for or paid (154.0) (494.5)
Retained earnings at the end of the financial year (282.8) (420.5)
For
per
sona
l use
onl
y

134
NOTEs TO ThE FiNANciAL sTATEmENTs CONTINUED
fOr ThE yEar ENDED 30 JUNE 2009
36. Deed of Cross Guarantee (continued)
Balance Sheet Consolidated
2009
$M2008
$M
Cash and cash equivalents 658.9 227.1
Receivables 412.5 543.2
Inventories 21.6 13.7
Assets classified as held for sale – –
Prepayments 44.2 39.0
Current tax receivable – –
Other financial assets 0.6 45.4
Total current assets 1,137.8 868.4
Receivables 31.4 6.7
Investments accounted for using the equity method 49.0 43.6
Investments 1,402.9 2,002.0
Property, plant and equipment 1,107.3 965.4
Intangible assets 353.2 258.7
Deferred tax assets 69.5 70.4
Prepayments 3.3 4.2
Other financial assets 0.7 –
Total non current assets 3,017.3 3,351.0
Total Assets 4,155.1 4,219.4
Payables 340.9 497.9
Interest bearing liabilities 203.0 466.8
Current tax liabilities 104.4 71.2
Provisions 219.0 215.6
Other financial liabilities 13.5 11.1
Total current liabilities 880.8 1,262.6
Interest bearing liabilities 677.3 800.8
Deferred tax liabilities 11.0 46.0
Provisions 66.6 64.6
Other financial liabilities 27.2 –
Total non current liabilities 782.1 911.4
Total liabilities 1,662.9 2,174.0
Net Assets 2,492.2 2,045.4
Issued capital 2,846.8 2,554.5
Treasury shares (5.7) (7.2)
Reserves (66.1) (81.4)
Retained earnings (282.8) (420.5)
Total Equity 2,492.2 2,045.4
On 26 July 2006 the Australian Securities & Investments Commission made an Individual Order in relation to the Company under section 340(1) of the Corporations Act 2001. The Individual Order relieves the Company and its wholly owned subsidiaries from the Corporations Act 2001 requirements for preparation, audit and lodgement of financial reports and Directors Reports to the extent that they are eligible to take advantage of the relief under ASIC Class Order 98/1418 as amended in the terms of the Individual Order. Accordingly, references above to ASIC Class Order 98/1418 should now be read as references to the Individual Order and references to the Deed as references to the new Deed of Cross Guarantee dated 26 July 2006.
For
per
sona
l use
onl
y

135TOLL | ANNUAL REPORT 2009
37. Notes to the Statement of Cash Flows
Consolidated The Company
2009
$M2008
$M2009
$M2008
$M
Reconciliation of profit from ordinary activities after income tax to net cash provided by operating activities
Profit for the year after income tax 275.2 (690.8) 192.8 485.0
Share of associates’ net profit (21.2) (8.6) – –
Dividends received from associates 8.9 9.9 – –
(Profit)/loss on sale of property, plant & equipment (4.8) (23.6) – –
Loss on sale of investments and businesses 28.4 1,015.0 4.3 –
Effective interest on debt establishment costs 1.5 2.9 0.2 1.0
Add/(Less) non-cash items:
Depreciation and Amortisation 192.2 349.7 8.7 8.1
Share option expense 6.2 2.1 6.2 2.0
Amortisation of deferred gain (0.3) (21.9) – –
Impairment of receivables 6.6 3.1 – –
Impairment of software – (0.4) – –
Impairment of investments – 19.9 – –
Impairment of property, plant and equipment 4.1 – – –
Revaluation of investment – – – (9.2)
Net cash inflow from operating activities before changes in assets and liabilities 496.8 657.3 212.2 486.9
Changes in assets and liabilities adjusted for effects of purchase and disposal of controlled entities during the financial year:
(Increase)/decrease in receivables 245.4 (195.2) 1.6 2.1
(Increase)/decrease in inventories (6.4) (3.6) – –
(Increase)/decrease in prepayments (4.0) (91.8) (2.2) (2.2)
(Increase)/decrease in other assets (18.7) 14.5 – –
(Increase)/decrease in loans to controlled entities – – (55.0) (100.7)
Increase/(decrease) in payables (74.4) 241.0 (6.5) (20.1)
Increase/(decrease) in provisions (6.7) (11.1) (6.2) (46.0)
Increase/(decrease) in derivative financial liabilities 11.3 (39.2) – –
Increase/(decrease) in other liabilities (1.9) – – –
Increase/(decrease) in current tax liabilities 69.4 77.1 29.5 85.0
Increase/(decrease) in deferred tax liabilities 5.6 60.1 4.8 (28.4)
Net cash inflow from operating activities 716.4 709.1 178.2 376.6
For
per
sona
l use
onl
y

136
NOTEs TO ThE FiNANciAL sTATEmENTs CONTINUED
fOr ThE yEar ENDED 30 JUNE 2009
38. Events Subsequent to Balance Date
The Group has reached agreement for the purchase of 100% of the shares of Perkins Group Holdings Pty Limited, the parent of the Perkins Shipping Group.
DividendsA final dividend of 13.5 cents per share has been declared by the directors which is payable on 23 October 2009.
39. Undertakings to ACCC
Toll provided Undertakings (‘the Undertakings’) to the ACCC on 11 March 2006 in connection with regulatory clearance of the Group’s acquisition of Patrick. Those Undertakings provided for the divestment of 50% of its economic interest in Pacific National, Patrick’s Bass Strait shipping business, Patrick’s Tasmanian freight forwarding business, Toll’s vehicle distribution business and Toll’s interest in PrixCar Services Pty Ltd.
The Undertakings also included obligations for Pacific National to make available a total of up to 3 train sets and associated support services to operators which intended to operate linehaul services on the east west corridor (referred to as the ‘Starters Kit’), as well as the implementation of a ports and rail non-discrimination regime.
In order to facilitate the Group restructure and in recognition that Pacific National and the Group’s port’s businesses would be transferred to Asciano following the Group’s restructure, the ACCC on 18 April 2007 accepted a Variation (‘the Variation’) to the Undertakings.
The Variation provided that once the restructure was implemented, Toll would be relieved of its obligations to divest the Toll vehicle distribution business and Toll’s interest in PrixCar. Asciano would also be relieved of its obligation to divest the 50% interest in Pacific National transferred to it on restructure.
In addition, the Variation provided that Toll’s obligations to make available the Starters Kit rail assets and to implement the port and rail non-discrimination regimes would, following the restructure, be taken over by Asciano under separate undertakings to the ACCC.
For the period prior to the restructure (which occurred on 15 June 2007), Toll continued to have obligations to implement the port and rail non-discrimination regimes. This included the provision of audit reports to the ACCC in respect of compliance with these regimes.
The Variation includes a range of measures designed to ensure that Toll and Asciano are independent and separate of one another, and include a prohibition against cross shareholdings/interests, no sharing of profits/revenues as between the two entities and the separate listing of the entities on ASX.
The Variation also imposes a number of restrictions in respect of relevant directors on Toll and Asciano intended to ensure governance independence. These measures include prohibitions on common directors, no sharing or secondment of managers as between the two entities, no cross shareholdings in the other entity and restrictions on the employment of managers previously employed by the other entity.
The relevant Toll and Asciano directors were also required to divest their interest in Asciano and Toll respectively following the restructure.
The relevant directors of Toll and Asciano were required to give undertakings to the ACCC to resign all positions including their employment, if no longer independent of the other entity. The existing directors of Toll and Asciano have given such undertakings.
This is a summary only of the material terms of the Undertakings and the Variation. The undertakings given by Toll and Asciano as well as the relevant Toll and Asciano directors apply until 31 March 2011.
Full details of the undertakings are available on the ACCC website.
For
per
sona
l use
onl
y

137TOLL | ANNUAL REPORT 2009
40. Auditors’ Remuneration
Consolidated The Company
2009 $’000
2008 $’000
2009 $’000
2008 $’000
Audit services:
Auditors of the Company – audit and review of financial reports
KPMG Australia 2,348 1,646 120 120
Overseas KPMG firms 1,145 998 – –
Other auditors
Audit and review of financial reports (non-KPMG firms) 405 – – –
3,898 2,644 120 120
Other services:
Taxation services
KPMG Australia 2,666 2,950 120 120
Overseas KPMG firms 4 191 – –
Non KPMG firms 293 – – –
Other assurance services
KPMG Australia – 175 – –
Overseas KPMG firms 43 7 – –
Other services:
KPMG Australia – 276 – –
Related practices of KPMG – due diligence services 469 277 – –
Related practices of KPMG – other 106 38 – –
Non KPMG firms 114 – – –
3,695 3,914 120 120
For
per
sona
l use
onl
y

138
1. In the opinion of the directors of the Company:(a) the financial statements and notes set out on pages 55 to 137, including the remuneration disclosures that are contained in the
Remuneration Report on pages 21 to 42 of the Directors Report, are in accordance with the Corporations Act 2001 including:(i) giving a true and fair view of the financial position of the Company and the Group as at 30 June 2009 and of their
performance, as represented by the results of their operations and their cash flows, for the financial year ended on that date; and
(ii) complying with Australian Accounting Standards and the Corporations Regulations 2001; and (b) the remuneration disclosures that are contained in the Remuneration Report in the Directors’ Report comply with Australian
Accounting Standard AASB 124 Related Party Disclosures(c) there are reasonable grounds to believe that the Company will be able to pay its debts as and when they become due and payable,(d) the financial report also complies with International Financial Reporting Standards as disclosed in note 2.
2. There are reasonable grounds to believe that the Company and the controlled entities identified in Note 34 will be able to meet any obligations or liabilities to which they are or may become subject to by virtue of the Deed of Cross Guarantee between the Company and those controlled entities pursuant to ASIC Class Order 98/1418.
3. The directors have been given the declarations required by Section 295A of the Corporations Act 2001 from the chief executive officer and chief financial officer for the financial year ended 30 June 2009.
Signed in accordance with a resolution of the Directors:
R Horsburgh P A Little Director Director
Dated at Melbourne this 27th day of August 2009.
DiREcTORs’ DEcLARATiONfOr ThE yEar ENDED 30 JUNE 2009
For
per
sona
l use
onl
y

TOLL hOLDINGS | ANNUAL REPORT 2009 139
iNDEPENDENT AUDiTOR’s REPORTTO ThE mEmbErS Of TOLL hOLDINGS LImITED
Report on the financial reportWe have audited the accompanying financial report of Toll Holdings Limited (the Company), which comprises the balance sheets as at 30 June 2009, and the income statements, statements of recognised income and expense and cash flow statements for the year ended on that date, a description of significant accounting policies and other explanatory notes 1 to 40 and the directors’ declaration of the Group comprising the Company and the entities it controlled at the year’s end or from time to time during the financial year.
Directors’ responsibility for the financial report The directors of the Company are responsible for the preparation and fair presentation of the financial report in accordance with Australian Accounting Standards (including the Australian Accounting Interpretations) and the Corporations Act 2001. This responsibility includes establishing and maintaining internal control relevant to the preparation and fair presentation of the financial report that is free from material misstatement, whether due to fraud or error; selecting and applying appropriate accounting policies; and making accounting estimates that are reasonable in the circumstances. In note 2, the directors also state, in accordance with Australian Accounting Standard AASB 101 Presentation of Financial Statements, that the financial report of the Group, comprising the financial statements and notes, complies with International Financial Reporting Standards.
Auditor’s responsibilityOur responsibility is to express an opinion on the financial report based on our audit. We conducted our audit in accordance with Australian Auditing Standards. These Auditing Standards require that we comply with relevant ethical requirements relating to audit engagements and plan and perform the audit to obtain reasonable assurance whether the financial report is free from material misstatement.
An audit involves performing procedures to obtain audit evidence about the amounts and disclosures in the financial report. The procedures selected depend on the auditor’s judgement, including the assessment of the risks of material misstatement of the financial report, whether due to fraud or error. In making those risk assessments, the auditor considers internal control relevant to the entity’s preparation and fair presentation of the financial report in order to design audit procedures that are appropriate in the circumstances, but not for the purpose of expressing an opinion on the effectiveness of the entity’s internal control. An audit also includes evaluating the appropriateness of accounting policies used and the reasonableness of accounting estimates made by the directors, as well as evaluating the overall presentation of the financial report.
We performed the procedures to assess whether in all material respects the financial report presents fairly, in accordance with the Corporations Act 2001 and Australian Accounting Standards (including the Australian Accounting Interpretations), a view which is consistent with our understanding of the Company’s and the Group’s financial position and of their performance
We believe that the audit evidence we have obtained is sufficient and appropriate to provide a basis for our audit opinion.
IndependenceIn conducting our audit, we have complied with the independence requirements of the Corporations Act 2001.
Auditor’s opinionIn our opinion:
(a) the financial report of Toll Holdings Limited is in accordance with the Corporations Act 2001, including: (i) giving a true and fair view of the Company’s and the Group’s financial position as at 30 June 2009 and of their performance for the
year ended on that date; and (ii) complying with Australian Accounting Standards (including the Australian Accounting Interpretations) and the Corporations
Regulations 2001.(b) the financial report of the Group also complies with International Financial Reporting Standards as disclosed in note 2.
For
per
sona
l use
onl
y

140
Report on the remuneration reportWe have audited the Remuneration Report included in pages 21 to 42 of the directors’ report for the year ended 30 June 2009. The directors of the company are responsible for the preparation and presentation of the remuneration report in accordance with Section 300A of the Corporations Act 2001. Our responsibility is to express an opinion on the remuneration report, based on our audit conducted in accordance with auditing standards.
Auditor’s opinionIn our opinion, the remuneration report of Toll Holdings Limited for the year ended 30 June 2009, complies with Section 300A of the Corporations Act 2001.
KPMG
Paul Shannon Partner Melbourne 27 August 2009
iNDEPENDENT AUDiTOR’s REPORT CONTINUED
TO ThE mEmbErS Of TOLL hOLDINGS LImITED
For
per
sona
l use
onl
y

TOLL hOLDINGS | ANNUAL REPORT 2009 141
shAREhOLDER iNFORmATiON
Additional information required by the Australian Stock Exchange Listing Rules not elsewhere disclosed in this report. The shareholder information set out below was applicable as at 27 August 2009.
A. Distribution of shareholdersAnalysis of numbers of shareholders by size of share holdings for ordinary securities.
Number Units %
1 – 1,000 45,064 22,718,848 3.27
1,001 – 5,000 48,337 112,053,335 16.11
5,001 – 10,000 7,294 52,235,758 7.51
10,001 – 100,000 3,659 76,279,050 10.97
100,001 – and over 181 432,274,135 62.15
104,535 695,561,126 100
There were 2,952 holders with less than a marketable parcel of ordinary shares.
Each ordinary share is entitled to one vote per share.
B. Twenty largest shareholdersThe names of the twenty largest shareholders are listed below:
NameNumber of Ordinary
Shares HeldPercentage of
Issued Shares %
1 HSBC CUSTODY NOMINEES (AUSTRALIA) LIMITED 86,055,651 12.37
2 NATIONAL NOMINEES LIMITED 72,444,800 10.42
3 J P MORGAN NOMINEES AUSTRALIA LIMITED 66,760,061 9.60
4 PAUL ALEXANDER LITTLE 36,050,579 5.18
5 CITICORP NOMINEES PTY LIMITED 18,362,635 2.64
6 ANZ NOMINEES LIMITED <CASH INCOME A/C> 17,493,942 2.52
7 COGENT NOMINEES PTY LIMITED 13,890,868 2.00
8 PGA (INVESTMENTS) PTY LTD 11,000,000 1.58
9 AUSTRALIAN FOUNDATION INVESTMENT COMPANY LIMITED 8,000,000 1.15
10 QUEENSLAND INVESTMENT CORPORATION 7,772,548 1.12
11 AMP LIFE LIMITED 5,929,909 0.85
12 ANZ NOMINEES LIMITED <SL CASH INCOME A/C> 5,818,926 0.84
13 UBS WEALTH MANAGEMENT AUSTRALIA NOMINEES PTY LTD 5,539,120 0.80
14 UBS NOMINEES PTY LTD 5,127,290 0.74
15 RBC DEXIA INVESTOR SERVICES AUSTRALIA NOMINEES PTY LIMITED <MLCI A/C> 3,406,794 0.49
16 PERPETUAL TRUSTEE COMPANY LIMITED 2,853,250 0.41
17 HSBC CUSTODY NOMINEES (AUSTRALIA) LIMITED-GSCO ECA 2,720,376 0.39
18 ARGO INVESTMENTS LIMITED 2,388,785 0.34
19 QUESTOR FINANCIAL SERVICES LIMITED <TPS RF A/C> 2,270,460 0.33
20 M F CUSTODIANS LTD 1,965,886 0.28
Total 375,851,880 54.04
C. Substantial shareholdersThe following are substantial shareholders of the Company.
NameNumber of Ordinary
Shares HeldPercentage of
Issued Shares %
(a) Paul Alexander Little and related bodies corporate 37,539,935 5.40
For
per
sona
l use
onl
y

142
TEN yEAR sUmmARy
June 2000 June 2001 June 2002 June 2003 June 2004 June 2005 June 2006 June 2007* June 2008* June 2009Operating Results ($M)Group Sales 1,360 1,603 2,038 2,570 3,272 3,778 4,894 4,857 5,605 6,492 Profit before Depreciation, Amortisation and Interest (EBITDA) 72 101 154 202 305 360 545 455 554 585 Depreciation and Amortisation 21 30 53 77 114 126 190 136 168 192 EBIT 51 71 101 125 191 234 355 320 387 392 Share of Associates profit 0 0 9 31 45 49 34 16 5 21 Net Interest 3 5 12 19 23 28 88 305 33 25 Profit before Tax 48 66 98 137 213 255 301 30 359 389 Income Tax Expense 7 16 23 30 39 56 58 (7) 104 105 Operating Profit after Tax 41 49 75 107 174 199 243 37 254 283 Profit from Discontinued Operations (net of income tax) 1,249 (945) (8)Outside Equity Interests 0 0 1 1 5 5 12 7 4 5 Profit Attributable to Members 40 49 74 106 169 194 231 1,279 (695) 270 CPS Dividend/RPS 0 0 0 0 8 16 16 16 16 6 Ordinary Dividends 17 20 27 44 66 88 152 204 162 173 Ordinary Payout Ratio (%) (from continuing operations) 42.50 40.82 36.49 41.51 39.05 45.36 65.80 555.86 63.55 61.19 Overall Dividend Payout Ratio (%) 42.50 40.82 36.49 41.51 43.79 53.61 65.80 555.86 63.55 61.19 Financial Position ($M)Cash 27 47 48 89 102 152 1,208 1,743 354 886 Other Current Assets 190 244 293 351 492 487 1,457 833 1,620 801 Other Non-Current Assets 182 349 727 863 1,454 1,601 5,375 3,188 1,531 1,739 Future Income Tax Benefits 5 13 14 27 24 19 3 2 73 82 Intangible Assets (Goodwill & Other) 0 46 68 107 102 185 6,627 1,850 1,262 1,502 Total Assets 404 699 1,150 1,437 2,174 2,444 14,670 7,616 4,840 5,010 Other Liabilities 200 313 371 455 661 710 2,293 1,738 1,115 1,163 Borrowings 45 188 376 351 419 462 6,358 2,257 1,622 1,247 Total Liabilities 245 501 747 806 1,080 1,172 8,651 3,995 2,736 2,410 Net Assets 159 198 403 631 1,094 1,272 6,019 3,621 2,104 2,600 Outside Equity Interests 0 1 2 3 37 39 341 375 42 40 Reserves and Retained Profits 60 89 136 220 335 424 734 753 (493) (287)Paid Up Capital 99 108 265 408 722 809 4,944 2,493 2,555 2,847 Total Shareholders Equity 159 198 403 631 1,094 1,272 6,019 3,621 2,104 2,600 Per Ordinary Share ($) (from continuing operations)Basic Earnings per ordinary share before abnormal itemsBased on weighted average number of shares issued during the year 0.1674 0.2000 0.2782 0.3581 0.5079 0.5477 0.5939 0.0472 0.3872 0.4115 Based on number of shares issued at the end of the period 0.1653 0.1992 0.2691 0.3430 0.5016 0.5394 0.3446 0.0463 0.3863 0.4004 Diluted Earnings per share 0.166 0.1945 0.2645 0.3463 0.5010 0.5455 0.6330 1.9739 0.3870 0.4113 Dividend Paid or Declared per share 0.07 0.08 0.10 0.14 0.205 0.265 0.310 0.320 0.250 0.250Franking (%) Interim 20 60 100 100 100 100 100 100 100 100
Final 50 70 100 100 100 100 100 100 100 100Net Tangible Asset Backing 0.657 0.618 1.218 1.696 3.090 3.294 (0.974) 2.754 1.350 1.578 Analytical Information (from continuing operations)EBITDA to Sales (%) 5.29 6.30 7.56 7.86 9.32 9.53 11.14 9.38 9.89 9.01 EBIT to Sales (%) 3.75 4.43 4.96 4.86 5.84 6.19 7.25 6.58 6.90 6.04 Group Profit after Tax to Sales (%) 2.94 3.06 3.63 4.12 5.17 5.13 4.72 0.61 4.47 4.29 EBIT to Total Assets (%) 12.62 10.16 8.78 8.70 8.79 9.57 2.42 4.20 7.99 7.83 Return on Shareholders Equity (%) 25.16 24.87 18.45 16.88 15.45 15.25 3.84 0.82 11.90 10.71 Current Assets to Current Liabilities (X) 1.17 1.03 1.00 1.05 1.08 0.79 0.42 1.26 1.57 1.22 EBIT Interest cover (X) 17.00 14.20 8.42 6.58 8.30 8.36 4.03 1.05 11.68 15.70 Effective Tax Rate (%) 14.58 24.24 25.84 28.30 23.21 27.18 21.72 (46.21) 29.53 28.63 GearingNet borrowings to Net borrowings + Equity (%) 10.17 41.59 44.87 29.34 22.47 19.60 46.11 12.43 37.60 12.20 Net borrowings to Equity (%) 11.32 71.21 81.39 41.52 28.98 24.37 85.56 14.19 60.25 13.89 OtherOrdinary SharesWeighted average number of shares on issue during the year 239 245 266 296 317 325 362 631 647 677 Shares on issue at year end 242 246 275 309 321 330 624 643 648 696 Preference SharesCumulative Shares on issue at year end 0 0 0 0 2.5 2.5 2.5 2.5 2.5 0.0Non Cumulative Shares on issue at year end 0 0 0 0 0 0 0 0 0 0 Number of ordinary shareholders at year end 6,992 7,913 9,473 16,877 25,355 35,881 68,148 84,820 93,326 104,535Number of employees at year end Est 5,874 8,984 9,764 12,466 17,375 17,545 28,000 27,000 28,000 30,000
* Adjusted to reflect continuing operations only
For
per
sona
l use
onl
y

143TOLL | ANNUAL REPORT 2009
June 2000 June 2001 June 2002 June 2003 June 2004 June 2005 June 2006 June 2007* June 2008* June 2009Operating Results ($M)Group Sales 1,360 1,603 2,038 2,570 3,272 3,778 4,894 4,857 5,605 6,492 Profit before Depreciation, Amortisation and Interest (EBITDA) 72 101 154 202 305 360 545 455 554 585 Depreciation and Amortisation 21 30 53 77 114 126 190 136 168 192 EBIT 51 71 101 125 191 234 355 320 387 392 Share of Associates profit 0 0 9 31 45 49 34 16 5 21 Net Interest 3 5 12 19 23 28 88 305 33 25 Profit before Tax 48 66 98 137 213 255 301 30 359 389 Income Tax Expense 7 16 23 30 39 56 58 (7) 104 105 Operating Profit after Tax 41 49 75 107 174 199 243 37 254 283 Profit from Discontinued Operations (net of income tax) 1,249 (945) (8)Outside Equity Interests 0 0 1 1 5 5 12 7 4 5 Profit Attributable to Members 40 49 74 106 169 194 231 1,279 (695) 270 CPS Dividend/RPS 0 0 0 0 8 16 16 16 16 6 Ordinary Dividends 17 20 27 44 66 88 152 204 162 173 Ordinary Payout Ratio (%) (from continuing operations) 42.50 40.82 36.49 41.51 39.05 45.36 65.80 555.86 63.55 61.19 Overall Dividend Payout Ratio (%) 42.50 40.82 36.49 41.51 43.79 53.61 65.80 555.86 63.55 61.19 Financial Position ($M)Cash 27 47 48 89 102 152 1,208 1,743 354 886 Other Current Assets 190 244 293 351 492 487 1,457 833 1,620 801 Other Non-Current Assets 182 349 727 863 1,454 1,601 5,375 3,188 1,531 1,739 Future Income Tax Benefits 5 13 14 27 24 19 3 2 73 82 Intangible Assets (Goodwill & Other) 0 46 68 107 102 185 6,627 1,850 1,262 1,502 Total Assets 404 699 1,150 1,437 2,174 2,444 14,670 7,616 4,840 5,010 Other Liabilities 200 313 371 455 661 710 2,293 1,738 1,115 1,163 Borrowings 45 188 376 351 419 462 6,358 2,257 1,622 1,247 Total Liabilities 245 501 747 806 1,080 1,172 8,651 3,995 2,736 2,410 Net Assets 159 198 403 631 1,094 1,272 6,019 3,621 2,104 2,600 Outside Equity Interests 0 1 2 3 37 39 341 375 42 40 Reserves and Retained Profits 60 89 136 220 335 424 734 753 (493) (287)Paid Up Capital 99 108 265 408 722 809 4,944 2,493 2,555 2,847 Total Shareholders Equity 159 198 403 631 1,094 1,272 6,019 3,621 2,104 2,600 Per Ordinary Share ($) (from continuing operations)Basic Earnings per ordinary share before abnormal itemsBased on weighted average number of shares issued during the year 0.1674 0.2000 0.2782 0.3581 0.5079 0.5477 0.5939 0.0472 0.3872 0.4115 Based on number of shares issued at the end of the period 0.1653 0.1992 0.2691 0.3430 0.5016 0.5394 0.3446 0.0463 0.3863 0.4004 Diluted Earnings per share 0.166 0.1945 0.2645 0.3463 0.5010 0.5455 0.6330 1.9739 0.3870 0.4113 Dividend Paid or Declared per share 0.07 0.08 0.10 0.14 0.205 0.265 0.310 0.320 0.250 0.250Franking (%) Interim 20 60 100 100 100 100 100 100 100 100
Final 50 70 100 100 100 100 100 100 100 100Net Tangible Asset Backing 0.657 0.618 1.218 1.696 3.090 3.294 (0.974) 2.754 1.350 1.578 Analytical Information (from continuing operations)EBITDA to Sales (%) 5.29 6.30 7.56 7.86 9.32 9.53 11.14 9.38 9.89 9.01 EBIT to Sales (%) 3.75 4.43 4.96 4.86 5.84 6.19 7.25 6.58 6.90 6.04 Group Profit after Tax to Sales (%) 2.94 3.06 3.63 4.12 5.17 5.13 4.72 0.61 4.47 4.29 EBIT to Total Assets (%) 12.62 10.16 8.78 8.70 8.79 9.57 2.42 4.20 7.99 7.83 Return on Shareholders Equity (%) 25.16 24.87 18.45 16.88 15.45 15.25 3.84 0.82 11.90 10.71 Current Assets to Current Liabilities (X) 1.17 1.03 1.00 1.05 1.08 0.79 0.42 1.26 1.57 1.22 EBIT Interest cover (X) 17.00 14.20 8.42 6.58 8.30 8.36 4.03 1.05 11.68 15.70 Effective Tax Rate (%) 14.58 24.24 25.84 28.30 23.21 27.18 21.72 (46.21) 29.53 28.63 GearingNet borrowings to Net borrowings + Equity (%) 10.17 41.59 44.87 29.34 22.47 19.60 46.11 12.43 37.60 12.20 Net borrowings to Equity (%) 11.32 71.21 81.39 41.52 28.98 24.37 85.56 14.19 60.25 13.89 OtherOrdinary SharesWeighted average number of shares on issue during the year 239 245 266 296 317 325 362 631 647 677 Shares on issue at year end 242 246 275 309 321 330 624 643 648 696 Preference SharesCumulative Shares on issue at year end 0 0 0 0 2.5 2.5 2.5 2.5 2.5 0.0Non Cumulative Shares on issue at year end 0 0 0 0 0 0 0 0 0 0 Number of ordinary shareholders at year end 6,992 7,913 9,473 16,877 25,355 35,881 68,148 84,820 93,326 104,535Number of employees at year end Est 5,874 8,984 9,764 12,466 17,375 17,545 28,000 27,000 28,000 30,000
* Adjusted to reflect continuing operations only
For
per
sona
l use
onl
y

144
cOmPANy DiREcTORy
Directors
Chairman Ray Horsburgh AM
Managing Director Paul Little
Non-Executive Directors Harry Boon Mark Smith Barry Cusack Frank Ford
Secretary Bernard McInerney
Toll Holdings Limited
Principal Registered Office in Australia Level 7, 380 St Kilda Road Melbourne Vic 3004
Telephone: +61 3 9694 2888 Facsimile: +61 3 9694 2880 Website: www.tollgroup.com
Share Register
Computershare Investor Services Yarra Falls 452 Johnston Street Abbotsford Vic 3067
Telephone: – Australia 1300 850 505 – Overseas +61 3 9415 4000 Facsimile: +61 3 9473 2500 Website: www.computershare.com
Stock Exchange Listing Toll Holdings Limited shares are listed on the Australian Stock Exchange The home exchange is in Melbourne
Auditors
KPMG 147 Collins Street Melbourne Vic 3000
Lead Bankers
National Australia Bank 271 Collins Street Melbourne Vic 3000
Lead Solicitors
Minter Ellison Level 23, South Rialto Tower 525 Collins Street Melbourne Vic 3000
For
per
sona
l use
onl
y

1 Chairman and Managing Director’s Review
8 Globalisation and what it means for Toll
10 Providing Customers with Global Reach
12 Board of Directors
14 Directors’ Report
21 Remuneration Report
46 Corporate Governance Statement
55 Income Statements
56 Statements of Recognised Income and Expenses
57 Balance Sheets
58 Statements of Cash Flows
59 Notes to the Financial Statements
138 Directors’ Declaration
139 Independent Audit Report
141 Shareholder Information
142 Ten Year Summary
Contents
* 2007 and 2008 comparator figures restated to reflect continuing operations post demerger of Asciano, sale of New Zealand rail and ferry operations and demerger of Virgin Blue Australia.
REVENUE* Billion dollars
EBIT* Million dollars
EBITDA* Million dollars
EBIT MARGIN* Percent
TOTAL ORDINARy DIVIDENDs Million dollars
Design by theballgroup.com.au – TOL0150 09/08 Text of this annual report printed on Envi silk (pages 1-12) and Envi 50/50 (pages 13-144) – Carbon Neutral Paper.
Toll Holdings Limited uses Greenhouse Friendly™ ENVI Carbon Neutral Paper ENVI is an Australian Government certified Greenhouse Friendly™ Product.
0
100
200
300
400
500
06 07 08 09
466
0
50
100
150
200
06 07 08 09
173
0
1
2
3
4
5
6
7
8
9
10
06 07 08 09
9.0
0
100
200
300
400
500
600
700
06 07 08 09
625
0
1
2
3
4
5
6
7
06 07 08 09
6.49
For
per
sona
l use
onl
y

ABN 25 006 592 089
TOLL HOLDINGS LIMITED ANNUAL REPORT 2009ABN 25 006 592 089
TOLL HOLDINGS LIMITED ANNUAL REPORT 2009
TOLL H
OLD
ING
S LIMITED
AN
NU
AL R
EPOR
T 2009
For
per
sona
l use
onl
y
Related Documents