Sustainability Report 2021 TOGETHER TOWARDS ZERO

Welcome message from author
This document is posted to help you gain knowledge. Please leave a comment to let me know what you think about it! Share it to your friends and learn new things together.
Transcript
Sustainability Report 2021
TOGETHERTOWARDS ZERO

A RIVER, FLOW OF POSITIVE CHANGEThe powerful meaning of flow connects perspectives, inter- dependencies and joint forces of stakeholders, partnering on this journey to protect nature and build a sustainable future.At INNIO, we are determined to share our expertise for innovative, reliable, and environment-friendly energy solutions with a clear vision: to generate energy that will flow towards a sustainable, carbon-neutral future of infinite possibilities.
LEADERSHIPIn this pursuit, we have made solid strides with employees, customers, suppliers, investors, and the society to ride the rapids and strive for the best. We mobilize all positive energy for sustainable management and shared prosperity.
JOIN US ON OUR JOURNEY TOWARDS ZERO EMISSIONS AND PROTECTION OF CLIMATE AND NATURAL RESOURCES.
TOGETHER TOWARDS ZEROAs a part of our sustainability actions, we want to inspire peopleand other businesses to help build a world of inclusion, commongood, and infinite possibilities. To achieve this, we see the need tohave valuable discussions with all people, include more voices,and elevate them.
FOR THIS REASON, we have brought in the voices of ouremployees—asking them to answer three questions:– What does sustainability mean to you?– How does INNIO fulfill your sustainability-related standpoint?– In your opinion, what are the three sustainability-related strengths of INNIO?
Throughout this report you will get to know selected employees and their perspectives, which contribute to our journey and steps ahead of us.
“Any river is really the summation of the whole valley. To think of it as nothing but water is to ignore the greater part.”
Hal Borland, This Hill, This Valley
Location: River Lech, Tyrol, Austria, which is close to the INNIO Group headquarters
ABOUT THIS COVER PAGE

ABOUT THIS COVER PAGE
Hal Boyle
At INNIO, this is how we view sustainability —as an integral part of doing business.
“What makes a river so restful to people is that it doesn’t have any doubt—it is sure to get where it is going, and it doesn’t want to go anywhere else.”
We, at INNIO, are committed more than ever to our goal of building a sustainable world where all beings thrive.
“Know that the water has wisdom, in its motion through the world, as much wisdom as any of us have. Picture yourself as the water. We are liquid; we innately share water’s wisdom.”
Eric Alan, “Meditation Draws Its Power From the Water,” The Oregonian Meditation
ABOUT THIS COVER PAGE ABOUT THIS COVER PAGE
A RIVER, FLOW OF POSITIVE CHANGEThe powerful meaning of flow connects perspectives, inter- dependencies and joint forces of stakeholders, partnering on this journey to protect nature and build a sustainable future.At INNIO, we are determined to share our expertise for innovative, reliable, and environment-friendly energy solutions with a clear vision: to generate energy that will flow towards a sustainable, carbon-neutral future of infinite possibilities.
LEADERSHIPIn this pursuit, we have made solid strides with employees, customers, suppliers, investors, and the society to ride the rapids and strive for the best. We mobilize all positive energy for sustainable management and shared prosperity.
JOIN US ON OUR JOURNEY TOWARDS ZERO EMISSIONS AND PROTECTION OF CLIMATE AND NATURAL RESOURCES.
TOGETHER TOWARDS ZEROAs a part of our sustainability actions, we want to inspire peopleand other businesses to help build a world of inclusion, commongood, and infinite possibilities. To achieve this, we see the need tohave valuable discussions with all people, include more voices,and elevate them.
FOR THIS REASON, we have brought in the voices of ouremployees—asking them to answer three questions:– What does sustainability mean to you?– How does INNIO fulfill your sustainability-related standpoint?– In your opinion, what are the three sustainability-related strengths of INNIO?
Throughout this report you will get to know selected employees and their perspectives, which contribute to our journey and steps ahead of us.

TABLE OF CONTENTS
SCOPE, MATERIAL TOPICS, AND BOUNDARIES
INNIO’s 2021 Sustainability Report is a non-financial disclosure published annually. The first and most recent Sustainability Report 2020 was published in September 2021.
This 2021 disclosure was prepared in accordance with the standards of the Global Reporting Initia-tive (GRI) core option and the Sustainability Ac-counting Standards Board (SASB). It also includes an initial analysis in line with the Task Force on Climate-related Financial Disclosures (TCFD) Recommendations Framework. The report also serves as our Communication on Progress (COP) for the UN Global Compact (UNGC).
Through our non-financial reporting, we describe our management and performance of environ-mental, social, and governance (ESG) issues. Our disclosures focus on the topics that have been deemed most material to our business and stakeholder groups during INNIO’s materiality as-sessment performed in mid-2021. INNIO’s alignment with the United Nations Sustainable Development Goals (UN SDGs) is based on the GRI and the UNGC’s Business Reporting on the UN SDGs.
This report mainly covers data from 2021. Wher-ever possible, it also presents a series of data over three years (2019, 2020, and 2021) to make the in-formation transparent, relevant, and comparable.
This Sustainability Report has been externally assured. KPMG Austria GmbH Wirtschaftsprüfungs-
Welcome to INNIO’s Sustainability Report 2021! This report is presented for the INNIO Group Holding GmbH, headquartered in Jenbach, Austria. It spans INNIO’s Jenbacher and Waukesha brands and operations within the 2021 fiscal year.
ABOUTTHIS REPORT
und Steuerberatungsgesellschaft has performed an independent limited assurance engagement on the combined consolidated non-financial report (“NFI report”) for the financial year 2021. For the assurance report, please see page 130.
The data presented in the report is consolidated at Group level and covers 100% of business oper-ations and 90% of global locations. This boundary applies to all material topics, unless clearly indicat-ed otherwise for a particular material topic in the text of this Sustainability Report.
All of the health, safety, and environmental data, including greenhouse gas (GHG) data for Scope 1, Scope 2, and Scope 3, cover the INNIO Group using the financial control approach.
CONTACTSusanne Reichelt INNIO Media Relations INNIO Group 6200, Jenbach, Austria Phone: +43 664 80833 2382 Email: [email protected]

INTRODUCTION10 CEO Letter
01ABOUT INNIO14 A Global Business 14 Purpose, Vision & Mission 16 Value Chain18 Sustainability Strategy & Goals24 Stakeholder Engagement & Materiality Assessment 30 Governance
02ENERGY TRANSITION IN ACTION36 Why Do We Need the Energy Transition?38 The Needs of the Energy Transition40 The Transition in Action 41 Case Study 01 Powering carbon-negative plants with wood gas 42 Case Study 02 Meeting new demands for a shifting society 46 Case Study 03 Lowering GHG emissions from installed assets
TABLE OF CONTENTS
04APPENDIX114 Appendix 1: Enterprise Risk Management116 Appendix 2: Detailed Materiality Assessment Process117 Appendix 3: GHG Emissions Inventory
05INDEX TABLES, ESG ASSURANCE120 GRI & UN SDG’s126 SASB128 TCFD129 UN GLOBAL COMPACT130 ESG Assurance
03PROGRESS AND PERFORMANCE50 Low Carbon and Circular Products 50 Technology and innovation 55 Collaborating with customers for the long term 56 Analytics and digital solutions 57 Circular economy and value chain60 Resilient Manufacturing and Supply Chain 60 Energy and emissions 65 Resource management 68 Sustainable supply chain72 Responsible Operations and Social Responsibility 72 Employee experience 75 Diversity and inclusion 82 Health & safety 86 Community engagement88 Ethical and Transparent Business 88 Business ethics 90 Anticorruption 90 Data protection 91 Tax transparency 91 Public policy 92 Human rights94 Task Force on Climate-related Financial Disclosures (TCFD): 94 Climate Risks and Opportunities102 Key Performance Indicators

10 11TABLE OF CONTENTSINTRODUCTION CEO LETTER
A MESSAGE FROM OUR PRESIDENT AND CEO
ENERGY TRANSITION IN ACTION
As a leading energy provider, we are guided by a clear purpose—ENERGY SOLUTIONS, EVERYWHERE, EVERY TIME. Over the years we’ve made a significant contribution to the development of new, green technology. Thirty years ago we began to decar-bonize the engine sector with engines running on 100% biogas, and a decade later we installed our first engine running on 100% hydrogen. Today, our product portfolio of engines is capable of opera-ting on carbon-neutral fuels up to hydrogen-rich fuels. With our solutions such as our ‘Ready for H2’ technology and ‘myPlant’ AI digital solutions, we are helping our customers make real progress to reduce their carbon intensity. Together, we’re building our customers’ resilience across many industries so they can move confidently towards a low carbon future.
The energy challenges of the future are com-plex, but we know natural gas will continue to be part of the energy mix for decades to come. With the energy transition happening all around us, even regions and industries that are difficult to decarbonize are urgently reducing emissions and adapting to shifting regulatory requirements. We work together with our customers to ensure they have access to essential power generation to reduce their reliance on the grid and move away from coal and diesel by providing highly effi-cient and more sustainable power supply alter-natives when and wherever they need them.
BUILDING ON OUR COMMITMENTS FOR THE FUTURE
Since joining INNIO, I’ve seen incredible resilience and drive across the organization to become a more sustainable business. We have accelerated our ambition to decarbonize our own products and operations, as well as those of our custom-ers. In 2021, we pledged all Jenbacher engines are ready for up to 20% vol. hydrogen and for future conversion to 100% hydrogen on site. In addition, we pledged that our engines would be manufac-tured with more than 90% recycled, remanufac-turable, or reclaimed material inputs by 2025. We also have committed to lowering our emissions by 50% at our production and office sites by 2030.
This year, I’m pleased to say we’ve pushed our boundaries even further, with the use of green hydrogen to power the operations at our Jen-bach location in Austria. It is an extraordinary milestone for INNIO. We are on our way to revo-lutionizing how we operate and test our engines, while using our knowledge in the development of this green technology to reduce the carbon footprint of our customers around the world.
Dear Stakeholders, My journey as President and CEO of INNIO started only a few months ago, but at INNIO our approach to becoming a more sustainable business began much earlier. We have always been ahead of our time in energy innovation, challenging ourselves to push the boundaries of innovation and make a difference to our business, our customers, and the planet.
INTRODUCTION CEO LETTER
OUR APPROACH TO SUSTAINABILITY AND ESG
As a sponsor of our Sustainability Review Board, along with other INNIO leadership team members, I am incredibly proud of the steps we have taken in 2021. Our robust ESG strategy includes our commit-ment to low carbon and circular products, building a resilient supply chain and ensuring our opera-tions are responsible. We have increased our focus on research and development to further our clean and low carbon fuels innovation to meet product demand, implemented a decarbonization pro-gram in our supply chain, and conducted a carbon footprint assessment for value chain emissions.
Last year we became signatories of the Science Based Targets initiative and the United Nations ‘Race to Zero’ campaign, and INNIO Jenbacher was recognized by EcoVadis with a Gold Medal rating for our contributions towards sustainable growth in 2021, placing us among the top 1% of our industry peers. Thanks to our efforts in 2021, Sustainalytics has ranked INNIO number one out of more than 500 and the lowest risk within the ‘machinery’ industry group.*
Our employees are an important part of this journey. This year, we built INNIO’s Diversity, Equity, & Inclusion (DEI) network across the organization to focus on our people by promoting inclusion and employee well-being with new employee resource groups, volunteering, partnerships, and policies.
TOGETHER TOWARDS ZERO
INNIO’s sustainability journey and our pioneering role in the energy transition have genuinely inspired me. Now more than ever, we are focused on col-laboration and working together towards net zero. Not only are we strengthening our European and international partnerships with industry organiza-tions and experts, but we are working across the sector to improve, innovate and make a difference. I’m proud that INNIO is at the leading edge of the energy transition, where we are continually pushing and exploring the boundaries of what’s possible.
DR OLAF BERLIEN | President and CEO, INNIO
* Rating took place in February 2022

TABLE OF CONTENTS
0114 A Global Business
14 Purpose, Vision & Mission
16 Value Chain
18 Sustainability Strategy & Goals
24 Stakeholder Engagement & Materiality Assessment
30 Governance
ABO
UT
INN
IO

PURPOSE ENERGY SOLUTIONS. EVERYWHERE, EVERY TIME.
VISION MISSION VALUES
Lead transformation to make a decarbonized world come true
– Board of Directors– Sustainability Review Board
– Low carbon & circular products– Resilient supply chain & manufacturing– Responsible operations & social responsibility
GOVERNANCE FOCUS AREAS
UN SDGS
STAKEHOLDER ENGAGEMENT
Enable and accelerate the world’s energy transition
– We act as owners of our business– People and teamwork are our core– We challenge the status quo– Technology drives us– We are passionate about customer success– We make things happen
+ +
A MORE SUSTAINABLE WORLD
14 15TABLE OF CONTENTSABOUT INNIO A GLOBAL BUSINESS
INNIO is a leading energy solution and service provider that em-powers industries and communities to make sustainable energy work today. With our product brands Jenbacher and Waukesha and our digital platform myPlant, INNIO offers innovative solutions for the power generation and compression segments that help industries and communities generate and manage energy sustainably while navigating the fast-changing landscape of traditional and green energy sources. We are individual in scope, but global in scale. With our flexible, scalable, and resilient energy solutions and services, we enable our customers to manage the energy transition along the energy value chain wherever they are in their transition journey.
INNIO is headquartered in Jenbach (Austria), with other primary operations in Waukesha (Wisconsin, U.S.) and Welland (Ontario, Canada). A team of more than 3,500 experts provides life-cycle support to the more than 54,000 delivered engines globally through a service network in more than 80 countries.
INNIO has received recognition by ESG rating agencies for our sustainability efforts. The rating of 11-“Low risk level” from Sustainalytics* ranks the INNIO Group number one in the Machinery industry, and INNIO Jenbacher received the Gold Medal from EcoVadis.
PURPOSE, VISION & MISSIONOur corporate purpose is simple: ENERGY SOLUTIONS. EVERYWHERE, EVERY TIME. Since our products play such a significant role in providing energy solutions to the world, our sustainability vision is to lead transformation by providing truly sustainable and reliable solutions for the growing energy demand of a carbon-free world.
Our sustainability model is based on strong leadership ownership, collaboration, innovation,
and impact. We continuously aim to improve both our own and our customers’ performance and the performance of our supply chain by integrating sustainability in the overall procurement process and circular economy. INNIO’s employees are personally engaged in our day-to-day corporate sustainability efforts, helping create a truly vibrant, diverse, and sustainable company in which they thrive. Furthermore, we work in a harmonized approach with our stakeholders to leverage our company efforts and develop joint solutions to our common challenges.
A GLOBAL BUSINESS
ABOUT INNIO A GLOBAL BUSINESS
STRUCTURED APPROACH TO SUSTAINABILITY
Figure 1
* Rating took place in February 2022
OUR SUPPLIERS
OUR COMPANY
OUR CUSTOMERS& CONSUMERS
Raw materials (incl. ~50% of recycled input materials)
Agriculture & Food Processing
Automotive Manufacturing
Commercial & Industrial Buildings
Data Centers
Fast Power & Resiliency
Greenhouses
IPPs & Utilities
Landfill & Wastewater Treatment
– Metal – Wood– Chemicals– Paper– Sand– Others
– Natural Gas– Biogas– Biomethane– Synthetic Natural Gas– Green Hydrogen
SUPPLY CHAIN & SOURCING
GENERATION
DIGITAL SOLUTIONS
INDUSTRIES
CLIMATE NEUTRALOR NATURAL GAS
CHP
– Flexible Power– Efficient Heat
ReUp Program
– ReUp Engines– ReUp Spare Parts
+
16 17TABLE OF CONTENTSABOUT INNIO ABOUT INNIO
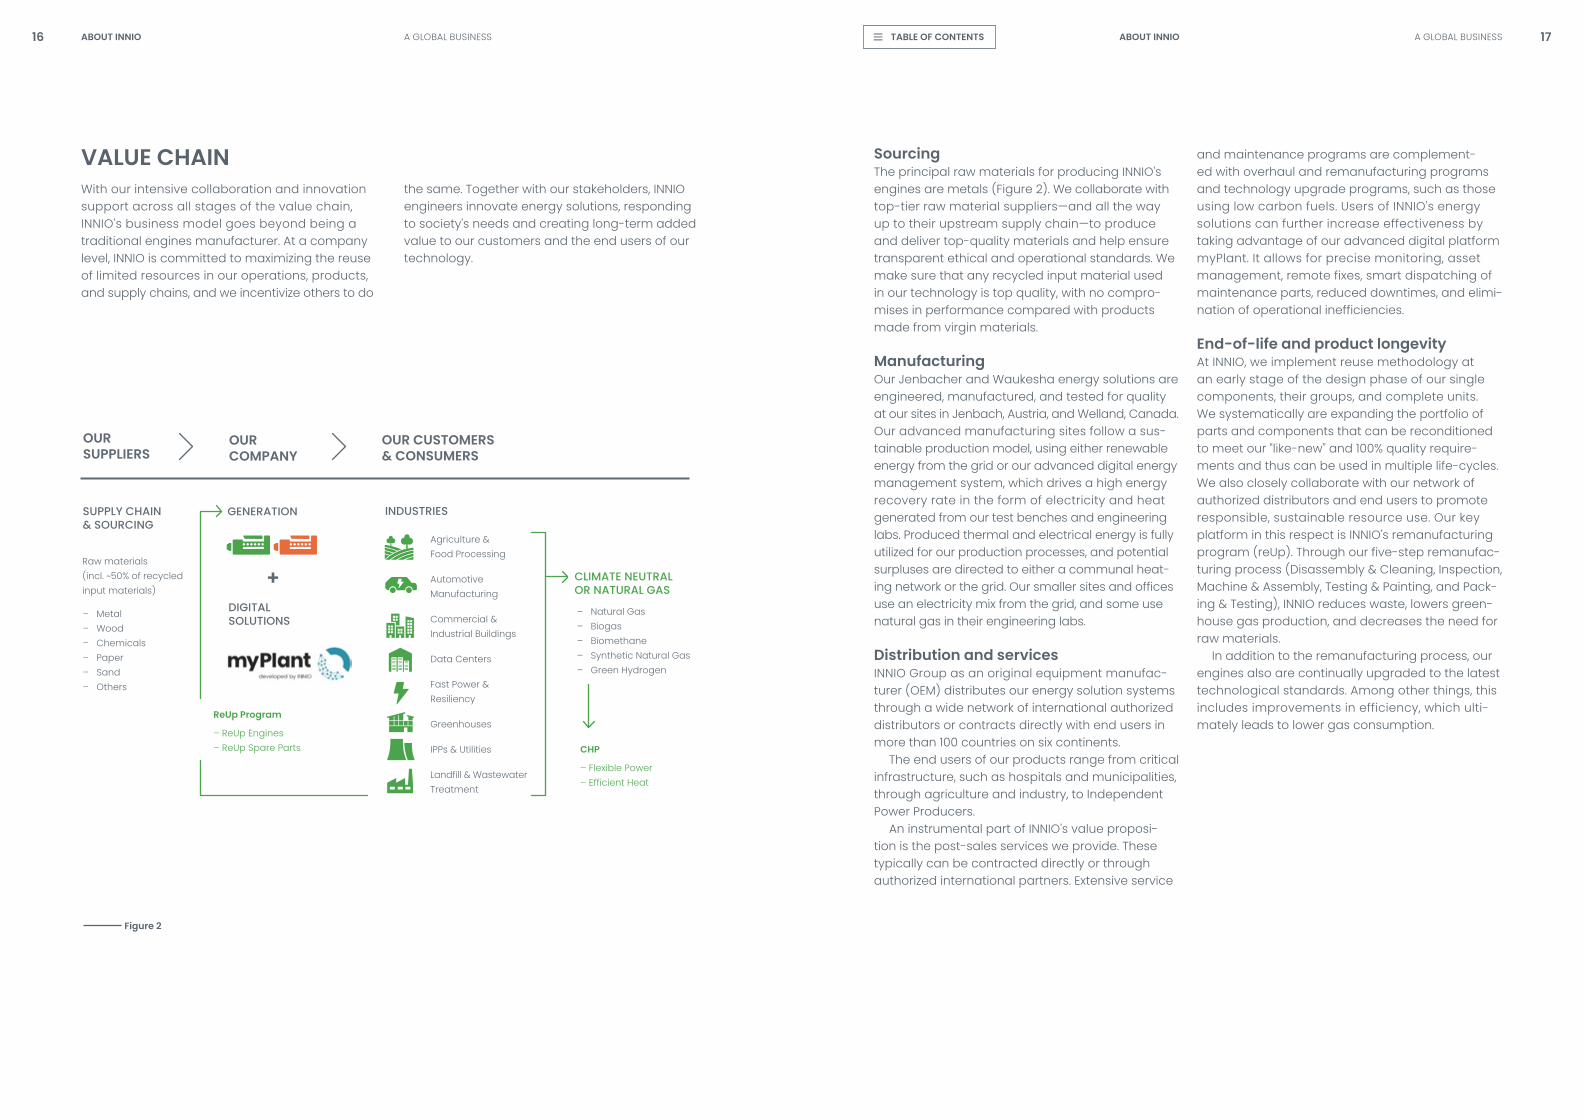
VALUE CHAIN With our intensive collaboration and innovation support across all stages of the value chain, INNIO’s business model goes beyond being a traditional engines manufacturer. At a company level, INNIO is committed to maximizing the reuse of limited resources in our operations, products, and supply chains, and we incentivize others to do
the same. Together with our stakeholders, INNIO engineers innovate energy solutions, responding to society’s needs and creating long-term added value to our customers and the end users of our technology.
Sourcing The principal raw materials for producing INNIO’s engines are metals (Figure 2). We collaborate with top-tier raw material suppliers—and all the way up to their upstream supply chain—to produce and deliver top-quality materials and help ensure transparent ethical and operational standards. We make sure that any recycled input material used in our technology is top quality, with no compro-mises in performance compared with products made from virgin materials.
Manufacturing Our Jenbacher and Waukesha energy solutions are engineered, manufactured, and tested for quality at our sites in Jenbach, Austria, and Welland, Canada. Our advanced manufacturing sites follow a sus-tainable production model, using either renewable energy from the grid or our advanced digital energy management system, which drives a high energy recovery rate in the form of electricity and heat generated from our test benches and engineering labs. Produced thermal and electrical energy is fully utilized for our production processes, and potential surpluses are directed to either a communal heat-ing network or the grid. Our smaller sites and offices use an electricity mix from the grid, and some use natural gas in their engineering labs.
Distribution and servicesINNIO Group as an original equipment manufac-turer (OEM) distributes our energy solution systems through a wide network of international authorized distributors or contracts directly with end users in more than 100 countries on six continents.
The end users of our products range from critical infrastructure, such as hospitals and municipalities, through agriculture and industry, to Independent Power Producers.
An instrumental part of INNIO’s value proposi-tion is the post-sales services we provide. These typically can be contracted directly or through authorized international partners. Extensive service
and maintenance programs are complement-ed with overhaul and remanufacturing programs and technology upgrade programs, such as those using low carbon fuels. Users of INNIO’s energy solutions can further increase effectiveness by taking advantage of our advanced digital platform myPlant. It allows for precise monitoring, asset management, remote fixes, smart dispatching of maintenance parts, reduced downtimes, and elimi-nation of operational inefficiencies.
End-of-life and product longevity At INNIO, we implement reuse methodology at an early stage of the design phase of our single components, their groups, and complete units. We systematically are expanding the portfolio of parts and components that can be reconditioned to meet our “like-new” and 100% quality require-ments and thus can be used in multiple life-cycles. We also closely collaborate with our network of authorized distributors and end users to promote responsible, sustainable resource use. Our key platform in this respect is INNIO’s remanufacturing program (reUp). Through our five-step remanufac-turing process (Disassembly & Cleaning, Inspection, Machine & Assembly, Testing & Painting, and Pack-ing & Testing), INNIO reduces waste, lowers green-house gas production, and decreases the need for raw materials.
In addition to the remanufacturing process, our engines also are continually upgraded to the latest technological standards. Among other things, this includes improvements in efficiency, which ulti-mately leads to lower gas consumption.
Figure 2
A GLOBAL BUSINESS A GLOBAL BUSINESS

ABOUT INNIO SUSTAINABILITY STRATEGY & GOALS18 19TABLE OF CONTENTSABOUT INNIO SUSTAINABILITY STRATEGY & GOALS
Sustainability, with its primary pillars of environmental, social, and governance (ESG), plays a central role at INNIO. We recognize that the growth of global economies and the industrialization that has accompanied this growth are directly impacting the future of our planet. We agree with the goals of the Paris Agreement—to address the threat of climate change and limit the temperature increase by mid-century to no more than 1.5 degree Celsius. We took steps to study risks and opportunities resulting from the climate challenges and formalized our sustainability ambitions, establishing short-, mid-, and long-term ESG goals. These will set the direction for INNIO to realize opportunities and mitigate risks during the transition to a sustainable future.
In 2021 we advanced our ESG planning process and grouped our sustainability priorities and goals into three strategic focus areas that capture our most material impacts and opportunities: “Low Carbon and Circular Products,” “Resilient Supply Chain and Manufacturing,” and “Responsible Operations and Social Responsibility.” All three pillars are under-pinned by good governance and sound, transpar-ent ethical and compliance standards such as our Code of Conduct, Human Rights, Anti-Corruption, and Trade Compliance guidelines, to name just a few. We also took a closer look at the time span we believe is necessary to achieve these goals. Action for a greener future is taking place now, and we identified specific areas where we can contribute
as early as 2022, with others taking place over the next one to seven years. The goal selection and definition process were closely aligned with the material topics that we identified in 2021, recog-nizing the critical role INNIO plays as an enabler of the energy transition and contributor to a low carbon and sustainable future. Together with our stakeholders, INNIO as an engineering and technology manufacturing company develops and provides products that enable our customers to secure reliable, affordable, and decentralized energy while supporting decarbonization of technologies and the environment. In parallel, we are proud of our standards in maintaining lean, efficient, circular, and responsible supply chains
and production activities. All of the above is a joint success of our employees and their commitment to innovation, customer orientation, and the passion to build a sustainable future.
It is our overarching goal to contribute to a greener tomorrow, aligned with the Climate Scenario of 1.5 °C, by improving our own activities across defined sustainability pillars and areas where we can make a positive impact on the envi-ronment and climate, our employees and societies, and help ensure transparency in operations and governance.
Creating INNIO’s Sustainability Review Board (SRB) was a first step in bringing leaders from across the company on a joint agenda of creating INNIO’s sustainability strategy.
SUSTAINABILITY STRATEGY & GOALS
“We can’t change the past, but each and every one of us can shape the future.”
Zita Baumann Product Development Engineer, INNIO Jenbacher
“Our generation aims to act, behave and develop in a
way that grants future generations around the globe the
same or even better quality on earth—for peace, human
rights, safety, independence, and wealth. To me, that is
what sustainability stands for. It is my personal moti-
vation for each day, and I am glad it goes along with the
key values of my company, INNIO Jenbacher. The team
can work in a safe and fair environment, combining the
experience and knowledge of all generations, bringing
highly efficient and reliable engine technology hand in
hand with the development of new paths for the future.
We can’t change the past, but each and every one of
us can shape the future. With diversity, the reUp pro-
gram, and a broad product portfolio for alternative
fuels, INNIO is acting now—for all of us and the next
generations.”

Zero serious injuries for all employees and contractors
Continuous engagement and social support to communities
25% increase of identified diversity groups across functions compared to 2020 baseline
Maintain high employee engagement of >85%
Further develop people leadership diversity
RESPONSIBLE OPERATIONS& SOCIAL RESPONSIBILITY
2022
AN
D
EAC
H Y
EAR
2025
2030
New sold engines available with ‘Ready for H2’ option can run up to 20% vol. hydrogen1
All Type 4 series engines available for 100% H2 operations
Next flagship customer project(s) will be commissioned with 100% hydrogen operation
Sustainable stewardship & technology advocacy–regular workshops with distributors to promote ESG engagement
All new sold Jenbacher engines are ready for hydrogen as standard (20% vol.) and are ready for a future conversion to 100% hydrogen on site
Fleet upgrades are available to transform most already installed engines into a 100% hydrogen engine on site
All Jenbacher products will be available with a 90% reduction in methane emissions compared to today’s regulatory limits (44. BlmschV)
All new products and/or components are made with materials that are in total (>90% weight) reusable, re-manufacturable, reclaimed, or recycled
2022
2025
+
2030
LOW CARBON AND CIRCULAR PRODUCTS
ALL OF INNIO’S GOALS ARE UNDERPINNED BY GOOD GOVERNANCE, BUSINESS ETHICS, AND TRANSPARENCY
Suppliers covering 80% of spend to perform a reputable2 ESG rating— by 2023 direct suppliers, by 2025 indirect suppliers
50% reduction in Scope 1 and Scope 2 GHG emissions (vs. 2020 base) fully implemented
Suppliers covering 80% of direct and indirect spend to commit to net zero by 2050
RESILIENT SUPPLY CHAIN AND MANUFACTURING
2030
2030
2023
20 21TABLE OF CONTENTS
Figure 3
Through the engagement of the SRB with various ESG frameworks such as UNGC, GRI, and SASB, we keep control and oversight on the specific themes and indicators, add meaningful impact, protect values, and identify opportunities for further growth. In addition, we stimulate innovation and promote sustainable business activities across our value chain, including our own activities and those of our employees, the management team, and our suppliers, customers, and other stakeholders collaborating with the company. As of this report, we initiated the inclusion of the Task Force on Climate-related Financial Disclosures (TCFD) into our non-financial disclosures. Our TCFD summary report is located in the third part of this document.
INNIO’s three pillars of sustainable goals, as pre-sented in Figure 3, also are linked with nine out of 17 United Nations Sustainable Development Goals (UN SDGs). The goals, together with the respective UN SDGs, are integrated into our organizational culture and daily operations, as well as our collaborations with external stakeholders.
Specific strategies and corresponding initiatives to achieve INNIO’s ESG goals are discussed in the third part of this report. It also is our aim to actively monitor a subset of specific internal and process- related indicators to continue to adjust actions towards our ESG goals and ambitions.
ABOUT INNIO SUSTAINABILITY STRATEGY & GOALS ABOUT INNIO SUSTAINABILITY STRATEGY & GOALS
INNIO’S SUSTAINABILITY GOALS
1 Defined in accounting protocol as either sold with the capacity to run on 100% hydrogen or that can be upgraded at a reasonable cost 2 based on publicly available studies e.g. The SustainAbility Institute, erm.com

2022
22 23TABLE OF CONTENTS
LEADING THE INDUSTRY THROUGH COLLABORATIVE ACTIONIt is our fundamental mission to play a significant role in creating a resilient, inclusive, near-zero carbon future. For this reason, we commit to robust international coalitions, work with different organi-zations, and participate in programs that promote sustainability and low carbon technology. In 2021, we upheld this ambition by joining the UN Race to Zero and UN Business Ambition for 1.5°C campaigns.
This means that through collaborative action and integrating pioneering approaches to our business activity, we intend to become a net-zero carbon company across our value chain. INNIO also is part of other initiatives, and we collaborate closely with different organizations, promoting sustainability and innovative technology, among others. INNIO has received recognition by ESG rating agencies for our sustainability efforts. The rating of 11-“Low risk level” from Sustainalytics* ranks the INNIO Group number one in the Machinery industry, and INNIO Jenbacher received the Gold Medal from EcoVadis.
ABOUT INNIO SUSTAINABILITY STRATEGY & GOALS ABOUT INNIO SUSTAINABILITY STRATEGY & GOALS
INNIO proudly aligns its strategy and operations with the 10 universal principles related to human rights, labor, environment, and anti-corruption, and takes actions that advance societal goals and the implementation of the SDGs.
The Responsible Minerals Initiative provides companies with tools and resources to make sourcing decisions that improve regulatory compliance and support responsible sourcing of minerals from conflict-affected and high-risk areas.
INNIO is committed to set science-based emissions reduction targets in line with the Paris Agreement 1.5 °C emissions scenario as part of our relentless commitment to reduce carbon emissions.
INNIO is a proud supporter of Race to Zero, a global campaign established by the United Nations Framework Convention on Climate Change (UNFCCC) to bring together global leadership for a healthy, resilient, and zero-carbon future.
“klimaaktiv” is a program established by the Austrian Ministry of Climate, Environment, Energy, Mobility, Innovation, and Technology for energy-efficient companies. As part of this association, we apply “klimaaktiv” expertise to continuously implement sustainability measures while contributing to the development of the program itself.
INNIO Jenbacher is in the top 1% of industry peers.
The INNIO Group is number one of the more than 500 companies in the Machinery industry.*
INITIATIVES & COLLABORATIONS
ESG RATINGS
* Rating took place in February 2022 * Rating took place in February 2022

LENDERS & FINANCIAL
COMMUNITY
CUSTOMERS
SUPPLIERS
DISTRIBUTORS
COMMUNITIES
EMPLOYEES
ASSOCIATIONS
TAX AUTHORITIES
SHAREHOLDERS
AUTHORITIES ®ULATORY BODIES
INNIOGROUP
24 25TABLE OF CONTENTS
STAKEHOLDER ENGAGEMENT & MATERIALITY ASSESSMENT
ABOUT INNIO STAKEHOLDER ENGAGEMENT & MATERIALITY ASSESSMENT ABOUT INNIO STAKEHOLDER ENGAGEMENT & MATERIALITY ASSESSMENT
Stakeholder engagementTransparency, exchange of perspectives, and collaboration on meaningful issues are pre- requisites for cultivating lasting relationships and building trust. Therefore, we consider stakeholder engagement an integral part of our organization’s sustainable strategy setting and growth, helping to define a clear purpose to achieve agreed out-comes. INNIO regularly engages with a wide range of stakeholders and business partners to integrate different perspectives, understand global trends, gain insights to mutual expectations, mitigate risks, and explore opportunities. Engaging with INNIO’s stakeholders enables us to learn from our
partners’ diverse perspectives and strengthen relationships, leading to informed business decisions and tangible positive impact for the environment. INNIO considers as our stakeholders any organization or individual that is either impact-ed by our company’s operations or that, in a variety of ways, has an impact on the company’s strategy and goals achievement.
As illustrated in Figure 4, our stakeholders include suppliers, existing and potential customers, part-ners, investors and lenders, current and potential employees, regulators, other organizations, local communities and the society, and sustain-ability experts and advisors.
“Together we can create a future worth living!”
Antje Suitner Lead Infrastructure Specialist, INNIO Jenbacher
“I take life and the topics that affect life seriously; I take
responsibility. That’s why I’ve been working for many
years to ensure that sustainability reaches the heart of our
society. You think you are too small to make a difference?
Then try to sleep at night when there is a mosquito in the
room or try to eat something in the garden in summer
when there is a wasp around…
As small as they are, they are a piece of the big picture, and
they make their contribution. No one is too small! And
without an intact ecosystem, there can be neither an intact
economy nor prosperity.
INNIO also is a piece of this big picture and makes its con-
tribution. Sustainability is anchored in all INNIO strategies
and is therefore a fixed component of INNIO’s entrepre-
neurial activities. With our INNIOvations and projects,
we do make a difference. INNIO always finds ways to let
others participate and thus bring prosperity to the world.
Together we can create a future worth living!”
INNIO’S KEY STAKEHOLDER GROUPS
Figure 4
Suppliers Employees Customers
Freq
uenc
y &
Typ
es
of E
ngag
emen
t
Regular virtual and face-to-face engagement meetings, webinars, bulletins, and newsletters
Annual employee & ethics training, periodic employee engagement survey, weekly employee-related updates, newsletters and bulletins, and quarterly all-employee updates by the Leadership team
Regular virtual and face-to-face engagement meetings, conferences, trade shows, bulletins, and newsletters
Dis
cuss
ion
Poin
ts
INNIO’s ethics and regulatory compli-ance and Supplier Code of Conduct, raw material quality, commitment to ESG standards, assessment results, circular economy
Employee development, training, diversity and inclusion, compliance, health & safety concerns, and updates on priorities and business developments
Product-related discussions, commercial updates, ethics and compliance trainings, sustain-ability expectation, and product and solution developments
Info
rmat
ion
Flow
to
the
Boar
d
Briefings from Group VP Procurement, Audit Committee supplier risk review
HR Committee & Diversity, Equity and Inclusion (DEI) Committee report directly to the Board, whistleblowing platform (SPEAK UP!)
Monthly written reports from Executive Directors include material customer matters, Strategic Partnernship briefings
Dire
ct B
oard
En
gage
men
t
INNIO’s VP Procurement directly reports to INNIO’s President and Chief Executive Officer who is also the Chairman of the Board.
INNIO’s CHRO directly reports to INNIO’s President and Chief Executive Officer who is also the Chairman of the Board.
During the year, the Chair and the Executive Directors had regular meet-ings with the Group’s key customers. A Digital Distributor Conference was held in 2021 providing business updates to distributors.
Local Communities Government/Industry Associations Providers of Capital
Community meetings, volunteering programs, and local aid initiatives
– Official correspondences and visits as needed – Interviews to provide industry experience and advice – Conferences (e.g., briefings, public hearings, seminars, meetups)
Regular virtual and face-to-face meetings and teleconferences
Progress in environmental protection projects, measures taken in response to social issues and major events such as COVID-19, continuous support to local communities
– Compliance with environmental regulations – Development trends in energy engineering technologies
Updates on macro economical and financial performance from the company’s operations, future growth potential, and measures in response to climate change and energy policy
Operations Committee reports directly to the Chief Executive Officer and Chairman of the Board on a regular basis.
Regular reports as applicable Reports from Investor Relations treasury reports, Investor meetings
INNIO’s VP Operations Jenbach and VP Operations Waukesha together with the CHRO and VP Communications engage directly with local communities. All directly report to INNIO’s CEO and the Board.
The Board relies on dedicated functions at a Group or business unit level and does not have direct contact with reg-ulators unless appropriate. The members of the Board participate in speeches, conferences and discussions with industry associations.
The Board engages directly with our investors through regular digital or in- person meetings discussing all relevant topics. INNIO meets our shareholders at the regular business update meeting, which provides an opportunity for our investors to receive updates and ask questions to the Board.
26 27TABLE OF CONTENTS
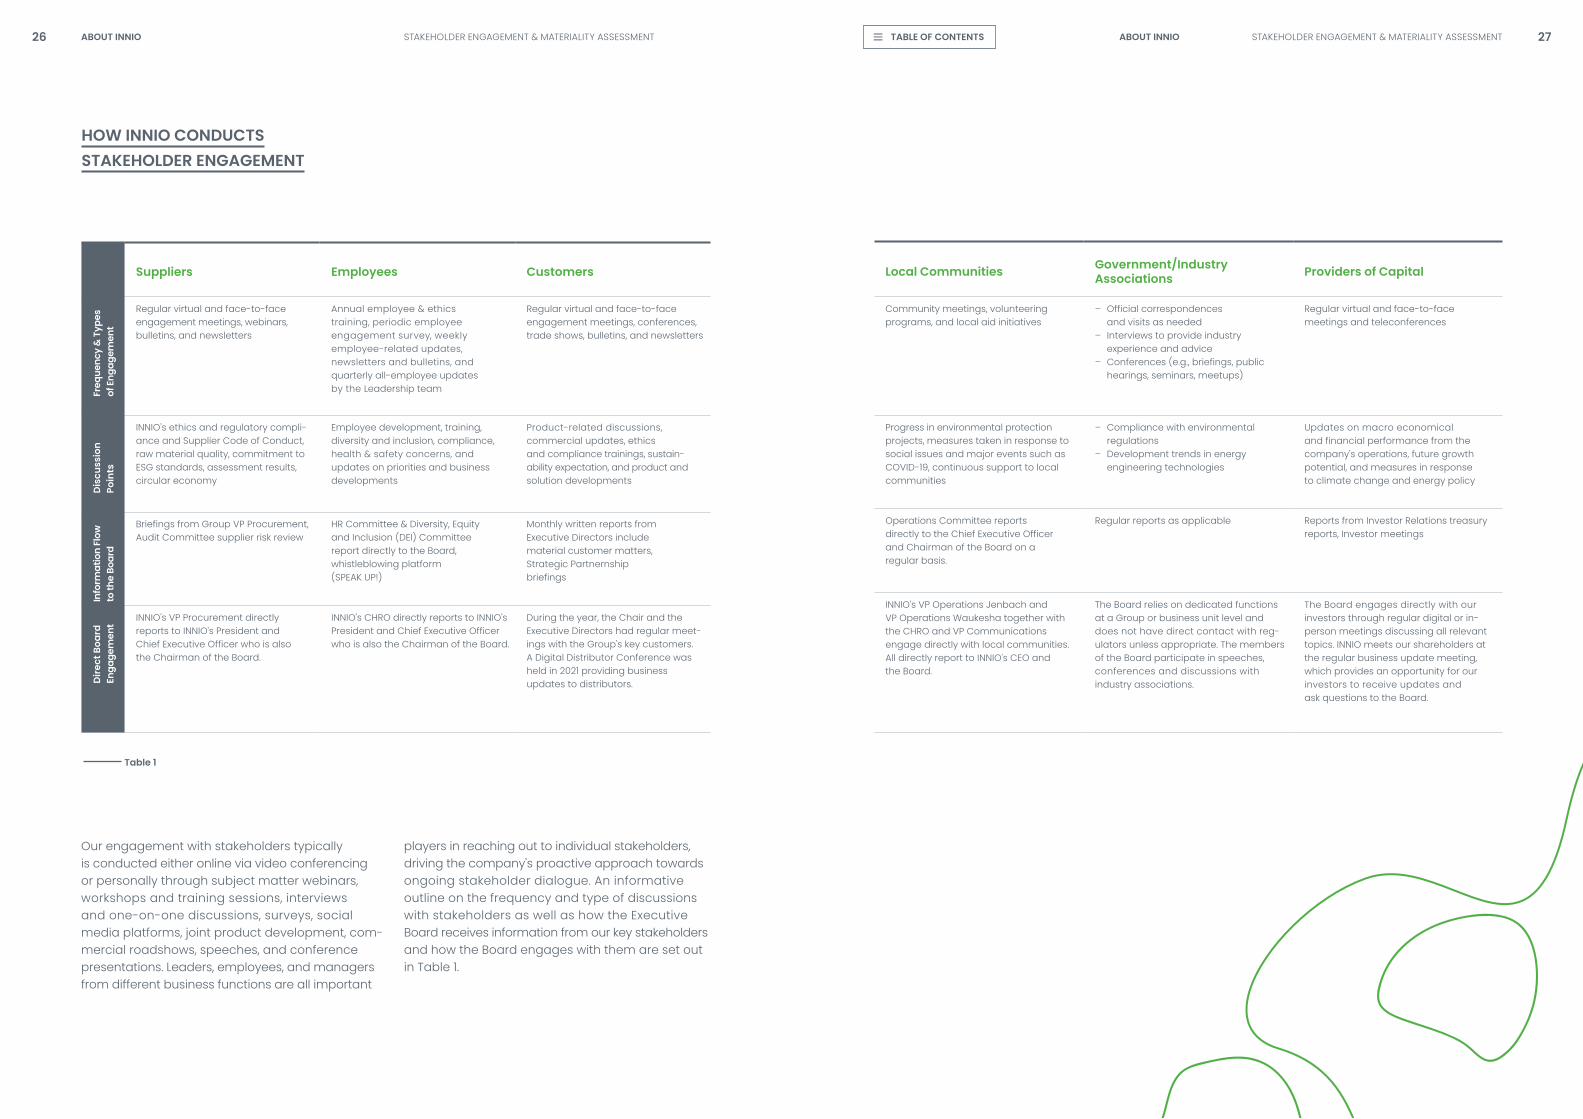
Our engagement with stakeholders typically is conducted either online via video conferencing or personally through subject matter webinars, workshops and training sessions, interviews and one-on-one discussions, surveys, social media platforms, joint product development, com-mercial roadshows, speeches, and conference presentations. Leaders, employees, and managers from different business functions are all important
players in reaching out to individual stakeholders, driving the company’s proactive approach towards ongoing stakeholder dialogue. An informative outline on the frequency and type of discussions with stakeholders as well as how the Executive Board receives information from our key stakeholders and how the Board engages with them are set out in Table 1.
ABOUT INNIO STAKEHOLDER ENGAGEMENT & MATERIALITY ASSESSMENT ABOUT INNIO STAKEHOLDER ENGAGEMENT & MATERIALITY ASSESSMENT
HOW INNIO CONDUCTSSTAKEHOLDER ENGAGEMENT
Table 1

Topic
Proc
ure-
men
t Sta
ge
Prod
uctio
n
Test
ing/
Pa
ckag
ing
Con
sum
er
Use
Prof
itabi
lity
Cus
tom
er
Satis
fact
ion
Empl
oyee
C
ohes
ion
Sust
. Ent
er-
pris
e Ri
sk &
O
ppor
tuni
ties
Technology and innovation
Collaborating with customers for the long term
Analytics & digital solutions
Energy & emissions
Circular economy & value chain
Resource management
Health & safety
Sustainable supply chain
Business ethics
Diversity and inclusion
Employee experience
Community engagement
Key topics raised in 2021
Responses from INNIO
CLIMATE CHANGE AND CO2 SCIENCE- BASED TARGETS
The INNIO Group set a list of sustainability goals and disclosed ESG information and data accord-ing to international reporting standards such as the GRI (Global Reporting Initiative) and SASB (Sustainability Accounting Standards Board) in its last Sustainability report. In 2021, INNIO, together with external consultants, held a Climate Risk & Opportunities workshop to identify an initial set of climate risks and opportunities according to the TCFD (Task Force on Climate-related Financial Disclosures) framework. Furthermore, we expanded our Scope 3 carbon emissions and committed to the Science Based Targets initiative in September 2021.
SUSTAINABLE SUPPLY CHAIN & CONFLICT MINERALS
The conversation around responsible businesses cannot exclude sustainable procurement for accountability, transparency, and socio-environmental reasons. For industries like ours, this includes paying close attention to the procurement of tin, tantalum, tungsten, and gold (3TG), more com-monly referred to as “conflict minerals.” In January 2021, the EU conflict minerals regulation came into effect as a union-wide attempt to regulate supply chains and increase transparency between conflict mineral actors. INNIO surveyed our suppliers to determine the origin of 3TG in our supply chains starting from calendar year 2020. In addition to the survey, INNIO required suppliers of products that contain 3TG to adopt policies and establish systems to procure 3TG from sources that have been verified as conflict free. INNIO also joined the Responsible Minerals Initiative (RMI).
COMPANY’S PRIMARY ENERGY USE THAT COMES FROM RENEWABLE ENERGY SOURCES
Reflecting stakeholders’ expectations for INNIO to be an example in innovation for a green future, in 2020 INNIO set goals to reduce emissions by 50% from our own operations until 2030 at the latest. At our headquarters in Jenbach, Austria, we are upgrading our Energy Center with a photo-voltaic (PV) plant and an intelligent energy storage system, optimized with our microgrid control solutions. In the microgrid, all test benches are integrated and controlled with our future-oriented myPlant energy management for self-supply of electricity and heat as well as with connection for electricity feed-in to the public grid. The new PV system spans almost 2,000 square meters corresponding to a CO2 saving of 180 tons per year beginning in 2022.
COVID-19 RESPONSE
Since its first appearance, the spread of COVID-19 required a great deal of effort from all of us to help our society and the economy best cope with its impact. INNIO has emergency preparedness plans for such issues as natural disasters and cyber-attacks and was thus well prepared for the COVID-19 pandemic. INNIO’s COVID-19 emergency plans were very effective. We moved quickly and implemented a full scope of countermeasures. This allowed us to continue operations without any closures at our main production facilities in Jenbach and Welland. We also reacted proactive-ly to the challenges of global supply chain slowdowns and ensured the availability of materials and parts. Due to responsive management, the pandemic’s impact on INNIO has been very limited. Corporate health care providers provided evidence-based information to all our employees on the spread of the infection and on preventive measures. Our dedicated medical doctors at our sites regularly tested our employees and helped infected people find the best possibilities for treatment. We also organized onsite vaccination campaigns, providing the option to employees, their family members, and relatives to get the vaccine. Furthermore, at INNIO we recognize that the COVID-19 virus is not only harmful to the immune system and body, but also to mental health. Some exam-ples are isolation due to working from home, uncertainty that leads to anxiety, and other mental health problems. For this reason, through our Health We Care (HWC) program, we continued to offer support and virtual sessions on physical training and healthy nutrition, among others.
MATERIALITY TOPICS AS OF 2021
OPERATIONAL IMPACTVALUE CHAIN
Upstream3 INNIO Operations Down- stream4
28 29TABLE OF CONTENTSABOUT INNIO STAKEHOLDER ENGAGEMENT & MATERIALITY ASSESSMENT ABOUT INNIO STAKEHOLDER ENGAGEMENT & MATERIALITY ASSESSMENT
Our materiality assessmentOur most recent materiality assessment was conducted with the participation of INNIO’s C-suite, Executive, and Senior Management teams, includ-ing customer- and supplier-facing functions, engi-neering and product development, procurement, the Sustainability Review Board (SRB), external ESG experts, and industry-independent executives. It was held in the form of a workshop in April 2021 to cover the reporting period of 2020-2021 and 2021-2022. INNIO plans to perform sustainability materiality assessments on a cyclical basis to address emerging challenges and continue build-ing sustainability engagement across stakeholders. This assessment highlighted emerging issues and provided us with a check on our focus areas in our strategy, initiatives, and ESG reporting.
How we use our materiality assessmentFor the current sustainability report, we used our ma-teriality assessment to expand our commitments to human and labor rights as well as the environment, reform our existing sustainability objectives, and set new goals and targets. We manage our material topics through our policies and Code of Conduct, and we set key performance indicators (KPIs) for each of our material topics that help us track our progress. We address many of these topics and communicate our progress towards our sustainability goals to our audiences through various communica-tion channels such as SRB meetings and workshops, employee communication and events, customer and supplier engagement, the press, and media. Our ultimate disclosure is the INNIO annual sustainability progress report. See Appendix “Detailed Materiality Assessment Process” for a detailed description of our materiality assessment process.
ADDRESSING KEY TOPICS AND STAKEHOLDER INTERESTS IN 2021
Table 3
Table 2
3 “Upstream” boundaries are raw materials, equipment, and related services purchased by the INNIO Group4 “Downstream” boundaries are the use of INNIO’s products by customers or end users

Group functions responsible for sustainability focus areas
Human ResourcesEmployee attrac-tion, retention & development; trainings; diversity & inclusion
Legal & ComplianceCompliance with business ethics and anti-corruption policies
Finance & ESGCoordination of overall ESG activities & strategic direction of the Group
OperationsEnvironment, Health & Safety- related topics; carbon and energy efficiency of opera-tions; water & waste management; innovation; relation- ships with local communities
Engineering, R&D, Sales & Product ManagementCarbon efficiency of the product portfolio; innovation
ProcurementSustainable sourcing; supplier compliance with environmental & social-related requirements; human rights due diligence
Audit Committee– Oversight of the financial reporting process, the organization’s budget, the audit process, the company’s system of internal controls, and compliance with laws and regulations
Nomination & Remuneration Committee– Oversight of INNIO’s key affairs in areas of corporate governance– Evaluation of performance & the characteristics of the Board – Recommendations of the compensation and reward policy of the executive officers
Risk Committee– Review and approval of INNIO’s risk appetite– Evaluation of risk exposure and tolerance– Identification, monitoring & management of financial & non-financial risks, including ESG risk– Review and evaluation of the Group’s practices with respect to risk assessment and risk management
Information Security Committee– Oversight of INNIO’s information security efforts– Coordination and oversight of INNIO’s information security strategy
Diversity, Equity & Inclusion (DEI) Committee– Creation & modification of DEI Policy– Oversight, revision, and approval of the diversity, equity and inclusion objectives & activities across the organization – Communication initiatives to stakeholders – Evaluation of the effectiveness of ongoing efforts
Ethics & Compliance Commitee- Oversight of ethical and compliant business conduct- Governance of Compliance Management Systems (CMS)
EXECUTIVE BOARDIts role is to lead INNIO to the creation of strong, sustainable financial performance and long-term shareholder value; to review and approve the Group’s strategic plan; and to supervise the conduct of the Group’s activities within the structure of foresightful and effective internal controls. Members: President & Chief Executive Officer, Chief Financial Officer, Chief Technology Officer, Chief Human Resources Officer, Executive General Counsel & Chief Compliance Officer, VP Global Service, Head of Transformation
Tasks:– Developing and implementing policies, objectives, and guidelines on ESG matters– Formulating action plans to reach ESG-related objectives– Supervising interdepartmental communication and coordination of resource integration– Engaging with industry bodies and other ESG-related initiatives to help bolster industry-wide sustainability best practices– Reporting achievements and work plans to the Executive Board
SUSTAINABILITY REVIEW BOARD (SRB)
Chaired by the VP Sustainability, the SRB meets on a bi-weekly basis and comprises 16 members, two of whom are female, hailing from eight nationalities. Members include business leaders from Finance, Operations, Procurement, Engineering, Digital & R&D, Sales, Product Management, HR, and Communications.
Alignment on a monthly basis with the Executive Board
INNIO’S GOVERNANCE STRUCTURE
Circularity Task ForceResponsible for identifying circular white spaces and building INNIO’s circular growth strategies
30 31TABLE OF CONTENTSABOUT INNIO GOVERNANCE ABOUT INNIO GOVERNANCE
Governance is the way in which we make sure that INNIO is true to our purpose, culture, and strategy. For this reason, we have committed to continuously improve the way we do business. Sustainability governance, including climate change mitigation and adaptation, are integrated into the INNIO Group’s enterprise governance structure. ESG aspects are regularly accounted for in business considerations and decisions and are part of INNIO’s day-to-day operational and management processes.
GOVERNANCE
Sustainability Review Board
In fulfilling our responsibility as a sound corporate citizen, INNIO established the Sustainability Review Board (SRB), the highest level ESG decision-making center after the INNIO Executive Board. The VP of Sustainability chairs the SRB and reports directly to the Executive Board, which reviews, discusses, and approves INNIO’s ESG goals and strategy and cor-responding non-financial disclosures. Functional and department leaders collaborate on ESG topics as part of the SRB. As illustrated in Figure 5, mem-bers of the SRB work to evaluate the Group’s core operational capacity, establish mid- to long-term ESG goals aligning with international standards, gain insight into international trends, and build a top-down operational model across the company. As of today, INNIO’s SRB comprises 16 members, two of whom are female, hailing from eight nationalities.
The SRB meets monthly to work on concrete strate-gic and operational topics around the ESG frame-work. These topics include, but are not limited to:
— Analyzing ESG frameworks and updates such as the United Nations (UN) COP agenda, GRI, SASB, the UN SDGs, TCFD, Non-Financial Reporting Directive (NFRD), Corporate Sustainability Reporting Directive (CSRD), and others
— Collaborating in sustainability networks to exchange best practices and experiences and increase awareness across businesses and society
— Establishing goals such as those surrounding the environmental impact of INNIO’s own activities and those from the life-cycles of our products, development of climate-neutral products, building a diverse and inclusive workforce, a responsible procurement and circular economy, constant engagement with societies, and other initiatives where INNIO can provide material support and maintain transparent governance and business conduct
— Reviewing initiatives and progress towards identified goals, including review of KPIs, challenges to resolve, risk, and opportunities resulting from changing environment
— Assigning initiatives and work groups for specific projects that enable fulfilment of ESG goals and/or improvement of operational sustainable standards
— Developing awareness campaigns and stakeholder engagement activities among the INNIO workforce or with customers and/or suppliers
— Collaborating on ESG disclosures and progress reports
Figure 5

INNIO’S EXECUTIVE BOARD
EHS COMMITTEEOversees the overall EHS management
CORPORATE EHS DEPARTMENT
ALL DEPARTMENTS
INNIO’S IMS SYSTEMISO 14001, ISO 50001, ISO 9001, ISO 45001, CERTIFIED
– Establishes policies, targets, and goals according to international standards & regulations
– Ensures environmental compliance
– Undertakes regular internal and external audits for environmental-related topics
– Supports the implementation of environmental and IMS-related trainings to relevant stakeholders
– Act responsibly and according to INNIO’s environmental guidelines and policies
– Submit ideas or suggestions for improving INNIO’s products and processes
– Communicates proactively INNIO’s Environmental policy and guidelines to relevant stakeholders
– Ensures the continual improvement of the IMS management system
– Holds environmental-related discussions with external stakeholders
– Regularly reports to local authorities
– Participate in mandatory annual environmental-related trainings
EHS GOVERNANCE
32 33TABLE OF CONTENTS
Group FunctionsThe Group’s functions implement the action plans from the SRB and continuously steer the processes relevant to the implementation of ESG initiatives and activities. The leaders of business functions overview the integration of ESG aspects into their business functional goals and operating plans. Every function leader reports directly to the SRB and remains in continuous communication regarding progress on the planned implementation.
Risk CommitteeThe Group’s Risk Committee is responsible for the identification of financial and non-financial risks, including INNIO’s ESG risk, and ensures these risks are properly managed. Additional responsibilities of the Risk Committee as well as from other com-mittees are illustrated in Figure 5.
The Group’s Risk Committee, chaired by Group VP Accounting and consisting of the manage-ment of key functions of the Group, meets at least twice a year. Members of the Risk Commit-tee are executive leaders from different functions of the Group, and the Committee reports directly to the Executive Board. The Committee’s aim is to ensure that risk awareness, quantification, and measures against potential risk exposures are reviewed and communicated in a structured, complete, and well-informed process. Business decisions are informed by the risk assessment and quantification of potential risks. The Commit-tee validates identified key risks (financial and non-financial) concerning the Group’s medium- and long-term objectives and provides feedback to functional risk owners.
The overall responsibility for risk management lies with the Executive Board. It is in charge of risk oversight, ensuring that the senior management has put in place a rigorous process for identifying, prioritizing, managing, and monitoring the risks critically affecting the Group in accordance with the Group’s risk tolerance. The Executive Board is in-formed on a bi-annual basis about the overall risk situation, and it is responsible for setting, commu-nicating, and implementing our risk management culture throughout the Group.
Executive CompensationINNIO’s Nomination & Remuneration (N&R) Com-mittee, which consists of five core members, is responsible for determining the Executive Board’s remuneration, including the structure of the remu-neration system and the actual target achieve-ment. The Executive Board remuneration consists of fixed and variable remuneration elements, such as long-term incentive plans and bonuses. INNIO acknowledges the importance of ESG topics and is assessing their inclusion regarding individual performance and goals in the near future.
Taking into consideration various stakeholders’ feedback during the past year, the N&R Committee analyses to put a stronger emphasis on ESG and, more specifically, climate-related topics. Some of the ESG criteria under discussion for the remuner-ation policy include concrete sustainability projects such as absolute and intensity carbon reduction measures, diversity, and health & safety targets.
INTEGRATED MANAGEMENTSYSTEMINNIO’s dedicated EHS team, which is under the direct leadership of the VPs of Operations, is responsible for monitoring and managing envi-ronmental and health & safety aspects, including energy use, carbon emissions, water use and discharge, the use of raw materials, waste man-agement, biodiversity, and ecosystem protection, as well as EHS trainings and health & safety consid-erations. Environment-related risks also are part of INNIO’s company-wide risk management system, while clearly defined risk policies and responsibilities across the company ensure the control and mitigation of these risks.
INNIO tracks environmental performance in all relevant areas using a suite of indicators that are regularly validated, analyzed, and reported.
INNIO’s Integrated Management System (IMS) is based on best practices and meets the ISO 14001, ISO 50001, ISO 9001, and ISO 45001 standards for a comprehensive and consistent approach in handling environmental aspects. Through the IMS, the EHS team helps ensure compliance with applicable environmental and health & safety laws and regulations, identification of legal and other requirements, and alignment with internationally accepted best practices. INNIO’s target is to always achieve 100% environmental compliance for all
our operational sites. For this reason, INNIO also conducts internal audits at the local level—at least once a year—that help determine possible gaps with respect to the system and internal and exter-nal standards. All INNIO operational sites have been certified to ISO 14001, ISO 50001, ISO 9001, and ISO 45001 standards, representing 100% of factory employees. In addition, the Jenbacher GmbH holds certification according to OHSAS 18001.
ABOUT INNIO GOVERNANCE ABOUT INNIO GOVERNANCE
Figure 6

TABLE OF CONTENTS
02EN
ERG
Y TR
AN
SITI
ON
IN
AC
TIO
N
36 Why Do We Need the Energy Transition?
38 The Needs of the Energy Transition
40 The Transition in Action 41 Case Study 01 Powering carbon-negative plants with wood gas
42 Case Study 02 Meeting new demands for a shifting society 46 Case Study 03 Lowering GHG emissions from installed assets

40 Gt CO2
1.000
900
800
700
600
500
400
300
200
100
0
g/kWh
30
20
10
0
1980 2000 2020 2040 2060 2080 2100
For a >66% chance of staying below 1.5°C
Remaining budget: 420 GtCO2
Mitigation curves after Raupach et al. 2014.
CO2 mitigation curves: 1.5°C
Starting mitigation in 2000 would have required a mitigation rate of about 4%/yr
COAL
0 0
avoided CO2 by replacing a gas boiler
fuel decarbonization
GER Grid Electricity
GAS ENGINE & CHP
Constant emissionsfor nine years will use up the remainingcarbon budget
Starting mitigation in 2019will require monumentalmitigation rates
GAS TURBINE
©@robbie_andrew . Data: GCP . Emissions budget from IPCC SR1.5
36 37TABLE OF CONTENTSENERGY TRANSITION IN ACTION WHY DO WE NEED AN ENERGY TRANSITION? WHY DO WE NEED AN ENERGY TRANSITION?ENERGY TRANSITION IN ACTION
Emissions are at all-time highThe Intergovernmental Panel on Climate Change (IPCC) recommends limiting global warming to 1.5°C. To do that, global CO2 emissions should decline by 45% by 2030 in comparison to 2010 and reach net zero by 2050. Despite many pledges and efforts by governments to tackle climate change, CO2 emissions from the energy industry remained near their all-time peak in 2021, rising 60% since the UN Framework Convention on Climate Change first was signed in 1992.5
Phasing out coal is crucial for the energy transitionTaking into account all electricity and heat gen-erated via fuel combustion, coal plants produced more than 70% of the associated CO2 emissions. Coal-to-gas switching reduces emissions by 50% when producing electricity and by 33% when providing heat. Thus, replacing coal-fueled power generation with cleaner natural gas technology that is ready for hydrogen and low carbon fuels could deliver immediate large-scale emission reductions. INNIO is leading development of such low-emission technologies, enabling decarboniza-tion for our customers worldwide.6
WHY DO WE NEED AN ENERGY TRANSITION?
Source5 www.iea.org/reports/global-energy-review-2021/co2-emissions 6 www.iea.org/articles/greenhouse-gas-emissions-from-energy-data-explorer
Source 7 @robbie_andrew, Data: GCP, Emissions budget from IPCC SR1.5 8 “CO2 emissions from electricity and heat generation by energy source, World” www.iea.org/reports/global-energy-review-2021/co2-emissions
CARBON EMISSIONS W/O CARBON CAPTURE8
Graph 2
CO2 MITIGATION CURVES: 1.5°C7
Graph 1

38 39TABLE OF CONTENTSENERGY TRANSITION IN ACTION THE NEEDS OF THE ENERGY TRANSITION THE NEEDS OF THE ENERGY TRANSITIONENERGY TRANSITION IN ACTION
Closing the ambition gapIn 2021, many developed countries announced new 2030 emission reduction targets broadly aligned with net zero by 2050. Although some progress has been made, there is still what the IEA refers to as the “ambition gap”—what still needs to be done to get to net zero. The ambition gap represents 12 gigatons (Gt) of CO2 emissions that must be addressed by 2030. That would require increased annual investment of USD 1.1 trillion in clean power generation and electricity infrastructure as well as a rapid scaling up of low carbon fuels based on hydrogen or bioenergy.
Future policies target clean power as the most attractive investment optionNumerous climate actions also emerged in 2021 ahead of the 26th UN Climate Change Conference or COP26, now referred to as the Glasgow Climate Pact (GCP). Policymakers around the world acted together to mitigate climate risks and accelerate the adoption of clean energy technologies. The resulting policies should ensure an orderly transi-tion towards an emission-neutral future, while maintaining energy security.
In 2021, the EU’s green policymaking made headlines with its “Fit for 55” package. It aimed to reduce net greenhouse gas emissions by at least 55% by 2030, compared to 1990 levels, and pro-mote hydrogen by creating favorable conditions for hydrogen market development (as specified in the EU Hydrogen Strategy from July 2020). These initiatives align with INNIO Jenbacher’s
strategy to have our entire product portfolio ready for 100% hydrogen by 2025+.
Moreover, the role of natural gas in decarbon-ization was highlighted in the EU Taxonomy for sustainable investment, which classified electricity generation and high-efficiency cogeneration as vital natural gas activities for the energy transition.
Clean hydrogen plays an important role in reaching net zero by 2050For years, hydrogen has played an important role in most energy transition plans. In the last few years, as many countries intensified their decar-bonization efforts, hydrogen became the focal point of national targets and strategies, and its use is expected to increase rapidly in coming years. A pillar of the goal of decarbonization to reach net zero by 2050, hydrogen is a CO2-free gas when burned only with oxygen. In power generation, hydrogen is one of the leading options for storing renewable energy. Hydrogen also can be trans-formed into ammonia, making it easier to trans-port and store. The natural gas industry is looking at hydrogen as a promising solution for greening the gas system and extending the life of existing infrastructure. However, despite tremendous progress, opportunities for hydrogen in power generation are limited by the immature clean hydrogen production and distribution infrastructure.
The need for a flexible and balanced energy supplyAlso an important pillar of decarbonization, re-newables are perhaps the fastest way for power generation to reach the ambitious climate goals of achieving net zero by 2050. The increasing pene- tration of renewables is driving a growing trend towards decentralization. In addition, more variable and flexible balancing of the energy supply capac-ity is required. The share of renewables in global electricity generation should reach 88% in the IEA’s goal of reaching net zero emissions (NZE) by 2050. Compared to the power generation mix today, where just under 30% of electricity generation is powered by renewables, the power system of tomorrow could include renewables, reciprocating engines, batteries, and fuel cells, to name a few,
and demand response would be used to manage distribution and grid stability. The engine power plants of tomorrow will need to cater to higher demand peaks and longer periods of under- and over-supply due to weather variations. Although such dispatchable units run for relatively few hours in the year (between 250 and 1,500 operating hours), they will be necessary to provide a stable and resilient grid supply. Commercially, those hours are by far the most valuable hours to supply electricity. The need for flexible balancing capacity, according to Bloomberg9, should increase from around 300 GW today to 2,800 GW by 2050.
THE NEEDS OF THE ENERGY TRANSITION
Source 9 Bloomberg NEF NEO 2021, gray scenario, page 37 fig. 22
“That is why I love to work for INNIO. We know our menu to eat the elephant.”
Dr Andreas Kunz Chief Technology Officer, INNIO Group
“Sustainability means ‘Kaizen’ to me. This Japanese term,
meaning ‘change for the better’ or ‘continuous impro-
vement,’ involves a step-by-step approach. Such a clear
vision is necessary to ‘eat the elephant.’ Our goal is to attain
global liberty, equality, health, and wealth while safeguar-
ding our environment for all upcoming generations.
At INNIO, we have the vision. And we have an execution
plan for each of us as individuals as well as for our pro-
ducts, technologies, customer solutions, infrastructure,
and supply chains.
That is why I love to work for INNIO. We know our menu
to eat the elephant.”

40 41TABLE OF CONTENTSENERGY TRANSITION IN ACTION CASE STUDIES CASE STUDIESENERGY TRANSITION IN ACTION
THE TRANSITION IN ACTION
As the transition gains pace, our ambition is to build and create long-term value for our customers with both our cutting-edge energy solutions and our commitment to ESG and sustainability. As a leading provider of renewable gas and hydrogen-rich solutions and services, we are uniquely placed at the heart of this changing landscape with highly efficient and reliable energy solutions backed by the latest green and digital technology in the sector.
CASE STUDY 01Powering carbon-negative plants with wood gas
The use of biomass for decentralized production of heat and power is increasingly gaining importance. INNIO and SynCraft, an Austria-based industry leader in wood power plants, have delivered and commissioned projects in six European countries as well as Japan. Not only do these highly innova-tive power plants align with nature, but they have a real climate-positive effect as well.
Renewable resources such as wood can be compared to wind or solar. Always available, wood can, with the right technology, be gasified and transformed into heat and electricity. With INNIO Jenbacher engines and SynCraft power plants, wood is not produced for energy production. Instead, the residues from sustainably managed forests can be transformed into electricity, heat, natural gas substitute, and—in the future—perhaps even hydrogen.
Wood gas power plants achieve total efficiency values of up to 92% and provide an additional highly attractive and sustainable product: Com-pared to typical wood gas projects that produce
ash, SynCraft’s new and innovative system pro-duces biochar. The overall system is capable of re-leasing only part of the CO2 that originally is stored through the forest. Some of it remains as useful green carbon, thus making SynCraft’s system climate-positive.
One of the world’s largest engine-powered wood gas plants can be found in Frauenfeld, Switzerland. Powered by Jenbacher engines, the plant owned by Bioenergie Frauenfeld will have a total electrical output of 4 MW in its final stage. This highly inno-vative and jointly optimized plant will be fed with 25,000 metric tons of sawn wood, windthrown trees, or damaged wood that will be converted to sus-tainable energy for a nearby sugar factory and the town of Frauenfeld.
A similar-sized project, begun recently for the Croatian-based furniture producer TERSA, turns 3,000 tons of waste wood into 3 million kWh of power, 4.5 million kWh of heat, and 400 tons of bio-char, storing up to 1,200 tons of CO2 equivalent per year. The plant’s total efficiency is well above 92%.
INNIO Action
Our solutions immediately unlock Scope 1 and 2 emissions reductions and further reduce the carbon intensity of customers’ products by blending natural gas with cleaner alternatives, such as biogas and green hydrogen, for power & heat generation and gas compression on a global scale.
We recently supported coal-to- gas switching in 5 large German cities—decarbonizing ~ 400 MW of energy.
We offer the highest in class efficiency in our natural gas solutions. Developed over the last 90 years, our portfolio enables customers to capture flare gas and reduce methane, accelerate investment in renewable energy, address regulatory trends, and retire diesel and coal assets.
We bring 90 years of experience in converting alternative fuels into power.
We are ahead of the curve with our ‘Ready for H2’ technology.Additionally, INNIO supports the installation of one of the largest CO2 neutral gas engine fleets globally. More than 9 GW already has been installed to provide clean energy for our customers.
We have an installed fleet of ~ 9,000 units operating with CO2 neutral fuels (~9 GW of energy).
OUR SOLUTIONS UNLOCK EFFICIENCY WITH CLEANER ENERGY FOR ESSENTIAL DECARBONIZATION
~ 400 MW REFERENCE COAL
EXIT PROJECTS
90YEARS
100%HYDROGEN
ENGINE

Long-distance steam line 15 bar
Long-distance steam line 3 bar
Hot water pipe system
Warm water pipe system
Heat and Cooling system of the University of Ulm
Cold water pipe system
70%ANNUAL CO2REDUCTION
COTTBUS MUNICIPAL UTILITIES
planned handover to customer summer 2022
~ 52 MWel
02
01
02
03
04
05
04 PFORZHEIM MUNICIPAL UTILITIES
handover to customer May 2021
~ 52 MWel
01 KIEL COASTAL POWER PLANT
handover to customer November 2019
~ 190 MWel
03 GAMOR SAARBRÜCKEN
planned handover to customer summer 2022
~ 53 MWel
05 FUG DISTRICT HEATING ULM
handover to customer summer 2022
~ 21 MWel
42 43TABLE OF CONTENTSENERGY TRANSITION IN ACTION ENERGY TRANSITION IN ACTION
CASE STUDY 02Meeting new demands for a shifting society
When phasing out coal, five German cities and municipal utilities are already relying on energy solutions with INNIO Jenbacher engines: Cottbus, Pforzheim, Ulm, Saarbrücken and Kiel—with its 190 MW coastal power plant.
Fernwärme Ulm GmbH, also known as FUG, is a 100-year-old municipal utility that provides the German city of Ulm with a reliable supply of district heating. Early on, FUG recognized the growing trend — not to mention the necessity — of moving to less impactful ways of generating heat, and it took appropriate and decisive action to transform its energy production. An important step was to decommission two coal-fired boilers, which were replaced by a biomass-fueled thermal power plant in 2013. Now, the last coal boiler has been exchanged for two INNIO Jenbacher cogeneration plants, which were located in the area previously
used to store stockpiles of coal. The installation of the new plants in 2022 marks the successful com-pletion of FUG’s bid to phase out coal, thus ensuring that the city of Ulm has a secure, efficient, and environmentally responsible district heating supply for the years ahead.
Since the early 1990s, FUG has relentlessly worked to lower emissions, reducing them by around 80%. The integration of two Jenbacher cogeneration plants plays a key role in shifting the traditional utility’s focus and setting it on a course to deliver on a sustainable and dependable heat supply.
Figure 7City of Ulm /CHP plant powered by INNIO, main contributor to Ulm’s energy system Ulm, Germany
CASE STUDIES CASE STUDIES

44 45TABLE OF CONTENTSENERGY TRANSITION IN ACTION ENERGY TRANSITION IN ACTION
Kiel is home to one of the most technologically advanced and flexible combined heat and power (CHP) plants in Europe. Centered on 20 INNIO Jenbacher engines, the plant has been gener-ating electricity and district heating for more than 73,000 Kiel households since the start of the 2019/2020 heating period—while also making a significant contribution to grid stabilization in northern Germany.
The electricity-led operation of the coastal power plant and its simultaneous use of generated heat have helped the plant set new standards in fuel utilization, achieving an overall efficiency of more than 92%. And, pairing the plant’s power- to-heat technology with a 60-meter-high heat
storage facility has enabled the decoupling of the electricity and heat supply, delivering ad-ditional flexibility. Compared with the preceding coal-fired power plant, the new technology has helped reduce CO2 emissions by 70%—the equiv-alent of removing nearly 1 million tons of CO2, or 500,000 cars, from the road annually.
What’s more, INNIO is working with Stadtwerke Kiel to make sure that the coastal power plant can become even more climate-friendly by using greener gases with a higher hydrogen content in the coming years. Because Jenbacher engines can already operate on hydrogen, they are poised to take advantage of these greener energy sources as they become more readily available.
Kiel, Germany
INNIO Action
We are investing tens of millions of dollars in gas engine technolo-gies to make them more efficient, more flexible, and cleaner, providing carbon-reducing enhancements for installed assets that will lead to long term investment security.
We hold 1,400 patents with 500 of our engineers working on those technologies across the globe.
Our reUp program creates value for our clients, with lower operat-ing costs as well as reduced environmental impact through reuse and rework of materials. We are committed to making our products from materials that are either recycled, reclaimed, or reused.
We save over 1,100 metric tons of CO2 through our reUp program annually.
Using the latest AI technology, our myPlant Optimization solution is designed to be predictive, providing real-time intelligence for better reliability, maintenance planning, facility production, and optimization, while actively tracking sustainability goals.
Our energy solutions can be managed and operated with our myPlant platform, evaluating more than 900 billion data points annually.
10,000+ ENGINES DIGITALLY
CONNECTED
1,210PATENTS
1,100 METRIC TONS OF CO2 SAVED
WE INCREASE THE LIFE-CYCLE OF OUR SOLUTIONSAND REDUCE ENVIRONMENTAL IMPACT
“We bring clean energy to the world today and tomorrow. ”
Jason Padilla VP Product Management & Marketing, INNIO Waukesha
“Sustainability is the driver of the energy transition.
As we develop the landscape of resources, we need
cleaner technology, diverse ideas and leadership,
and innovation to supply power reliably, safely,
and responsibly. It is equally important that we
tackle today’s emissions challenges while building
the path to renewable and clean energy sources.
INNIO stands for innovation; we constantly
challenge the status quo to develop solutions that
deliver on our ESG promises. We bring together
problem solvers and technology leaders who want
to be at the cutting edge of the energy transition,
leaning into more than 100 years of engineering
advancements. INNIO is genuinely committed to
sustainable energy. We bring clean energy to the
world today and tomorrow.”
CASE STUDIES CASE STUDIES

2021 2020 2019
85%
11,567 11,122
11,903
86% 86%
CH4 * GWP [MTpy]
CO2 [MTpy]
Waste generated
Waste recycling rate
SCENARIO 1.1’000 TPY OF CO2e
7042GL
7044GSIS4 7044GSIS5
7042GSIS4 7042GSIS5
SCENARIO 2.1’000 TPY OF CO2e
7.3
(-16%)
8.16.8
-1.2
(-15%)-1.2
(-14%)-1.0
Based on normalized 1,480 hp-226 to -252
7.26.11.5
5.8
0.5
6.7
6.7
0.6
7.4
0.1
0.1
6.0
Based on normalized 1,680 hp-266
46 47TABLE OF CONTENTSENERGY TRANSITION IN ACTION ENERGY TRANSITION IN ACTION
CASE STUDY 03Lowering GHG emissions from installed assets
While it is imperative to focus on new technologies that produce energy with a much lower green-house gas (GHG) footprint, it is also critical to manage the CO2e emissions from industrial assets that are currently operating globally, including tens of thousands of INNIO Waukesha engines. By upgrading these gas engines to the latest ver-sions, customers can reduce the CO2e footprint by about 15% (on a normalized power basis) in a short duration. For example, if a customer upgrades an existing VHP 7042GL engine to the VHP 7042GSIS5 engine version, the customer would see the CO2e emissions from the engine drop by 16%10 annually
(as illustrated in Figure 8). On a per engine basis, this is equivalent to taking about 250 gasoline driven cars from the roads11. Buoyed by the success of the initial Series 2 lean burn (LB) to Series 5 rich burn stoichiometric (GSI) upgrade, a key customer in Alberta, Canada, teamed up with INNIO Waukesha to execute similar upgrades of 10 other INNIO Waukesha engines in the fleet in 2020/21. This resulted in a reduction of at least 10,000 tons of CO2e annually from the customer’s coal bed methane (CBM) production operations. The customer was able to leverage a recent Canadian grant program to imple-ment the project, creating a positive impact not just for their organization but also for the communities that are affected by the extraction of these critical natural resources.
Assumptions 10 1,480 hp for 7042GL, 7042GSIS4, 7042GSIS5; 8,760 hrs/yr
Source11 EPA—A typical passenger vehicle emits about 4.6 metric tons of CO2/yr. This assumes the avg. gasoline vehicle on the road today has a fuel economy of about 22.0 mpg and drives around 11,500 miles/yr. Every gallon of gasoline burned creates about 8,887 grams of CO212 Greenhouse Gas Emissions from a Typical Passenger Vehicle | US EPA : A typical passenger vehicle emits about 4.6 metric tons of carbon dioxide per year. This assumes the average gasoline vehicle on the road today has a fuel economy of about 22.0 miles per gallon and drives around 11,500 miles per year. Every gallon of gasoline burned creates about 8,887 grams of CO2
Figure 8
“It is our generation’s duty to initiate the changes necessary to transform our economy …”
Markus Strömich-Jenewein Director Commercial Strategy, INNIO Jenbacher
“Sustainability means to me that, as human beings,
we must adapt our daily life to maintain an eco-
logical balance and preserve our planet for future
generations. It is our generation’s duty to initiate
the changes necessary to transform our economy,
strengthen our society, and allow our environment
to recover.
INNIO has always aimed to meet the highest expec-
tations with regard to its products and manufac-
turing facilities, but since we put sustainability at
the center of our strategy I am thrilled by the even
better ideas and changes we are initiating.
In my opinion, INNIO has made the right decisions.
We are developing sustainable products for our
clients, our employees are empowered to execute
projects that add value to our environmental goals,
and the company is taking a strong position in its
social responsibility.”
TECHNOLOGY UPGRADES FOR REDUCED EMISSIONS12
CASE STUDIES CASE STUDIES

03
49TABLE OF CONTENTS
PRO
GRE
SS A
ND
PE
RFO
RMA
NC
E
50 Low Carbon and Circular Products 50 Technology and innovation 55 Collaborating with customers for the long term 56 Analytics and digital solutions 57 Circular economy and value chain
60 Resilient Manufacturing and Supply Chain 60 Energy and emissions 65 Resource management 68 Sustainable supply chain
72 Responsible Operations and Social Responsibility 72 Employee experience 75 Diversity and inclusion 82 Health & Safety 86 Community engagement
88 Ethical and Transparent Business 88 Business ethics 90 Anticorruption 90 Data protection 91 Tax transparency 91 Public policy 92 Human rights
94 Task Force on Climate-related Financial Disclosures (TCFD): 94 Climate Risks and Opportunities
102 Key Performance Indicators
TABLE OF CONTENTS

END-USE EMISSION REDUCTIONS
Graph 3
50
48
46
44
42
40
38
36
34
32
30
281988 1990 1994 1992 1996 20001998 2002 2004 2006 2008 2010 2012 2014 2016 2018 2020 2022
5
10
15
20
25
30
1988 1990 1992 1994 1996 1998 20002002200420062008 2010 2012 2014 2016 2018 2020
2-Stage Turbocharger
A J
KJ624 H
J624 G
B C E F
50 51TABLE OF CONTENTS
LOW CARBON AND CIRCULAR PRODUCTS
TECHNOLOGY ANDINNOVATIONWhy it matters to us:At INNIO, we understand that reliable green or carbon-free technology is needed to meet society’s growing demand for electricity and heat while, at the same time, achieving the global goal of carbon-neutrality by the middle of the century. Innovation, including the application of novel or transferable technologies, is important in creating efficient and sustainable outcomes. Developing industry-leading technology and innovations will be central to INNIO’s success, the well-being of communities, and the transition towards a decarbonized or near-zero future.
Our aspiration: INNIO is committed to continuing to invest in re-search and development to enable our customers to flexibly move to a resilient, carbon-free future while providing long-term energy solutions, such as distributed and decentralized power and heat.
Key performance indicator: Coverage of H2-ready fleet
Management approach: INNIO’s engineering organization, led by the Chief Technology Officer (a member of the Executive Board), is at the core of our research and devel-opment activities. The engineering team governs product development, new product introduction, testing, validation, and all activities around tech-nology innovation. The team sets internal targets surrounding areas such as product design and characteristics and their energy efficiency aspects that are validated by the Executive Board.
Responsibility within INNIO: Chief Technology Officer, Engineering Department, and Research & Development (R&D) Department
This chapter covers the material topics of technology and innovation, analytics and digital solutions, collaborating with customers for the long term, and the circular economy and value chain. These areas create an innovative value proposition for end users and have a common set of goals: enabling and driving decarbonization, extending the overall long-term value for customers, maximizing life-cycle(s), and increasing circularity—all without harming the environment and while avoiding stranded assets or investments.
Progress and status: Determined to use our position as a global energy provider to play our part in enabling a sustainable, carbon-free future, INNIO increased our focus on R&D in the use of low carbon fuels. In 2021, INNIO introduced our ‘Ready for H2’ product portfolio for our Jenbacher engines, enabling customers to use the fuel of the future in various options today. In 2021, INNIO had approximately 250 MW of pilot engine installations that utilized hydrogen as a fuel, and 29% of INNIO’s order intake was designated to operate on low carbon fuels such as biogas, wood gas, or sewage gas.
Energy efficiency product improvementsEnergy efficiency improvements and avoided energy demand would close almost 20% of the “ambition gap” in IEA’s net zero emissions (NZE) goal by 2030. INNIO Jenbacher’s high-efficiency cogeneration (also known as combined heat and power or CHP) technology has been contributing to decarbonization with its ability to run not only on natural gas but also on low carbon fuels andbioenergy. And INNIO continues to pursue the principle of Efficiency First, which conveys our desire to simultaneously achieve greater efficiency and lower emissions. With that goal, we were able to gain more than 12 percentage points of electrical efficiency over the last 30 years.
PROGRESS AND PERFORMANCE LOW CARBON AND CIRCULAR PRODUCTS LOW CARBON AND CIRCULAR PRODUCTSPROGRESS AND PERFORMANCE

Generator Output @ 50 Hz & NG fuel H2 in pipeline gas
NG/H2 engine
Pure H2 engine
0 1,000 2,000 3,000 4,000 5,000 […] 10,000< 5% (vol)
< 20% (vol*)
optional
0-100%(vol) 100%
Type 9 2025+
Type 6 2025
Type 4
Type 3 2025+
Type 2 2025+
100
60
60
60
25J920 FleXtra
J612, J616, J620, J624
J412, J416, J420
J312, J316, J320
J208
INNIO ‘READY FOR H2’ PORTFOLIO14
Electrical output range (kWel)
Figure 10
13 1,480 hp for 7042GL, 7042GSIS4, 7042GSIS5; 8,760 hrs/yr
13
52 53TABLE OF CONTENTS
End-use emission reductions Electricity generation equipment and a parallel onsite boiler for heat production was a typical setup for decades in many countries. CHP equip-ment generates electricity and captures heat at the same moment, reaching overall efficiency of over 90%. INNIO’s data shows that by using CHP technology, our customers can reduce CO2 emissions and primary energy consumption by more than 30% compared to conventional electricity and heat generation. As the fuel mix decarbonizes, cogeneration reduces emissions cost-effectively by displacing more energy and carbon-intensive technologies.
INNIO Jenbacher equipment is ready for hydrogenINNIO is actively pursuing different ways to use hydrogen in our engines to increase power system flexibility. INNIO Jenbacher has been operating gas engines with high hydrogen content for many years. For example, some Jenbacher engines are operating on steel gases and synthetic gases with high hydrogen content of up to 70% (volume). Newer projects use local hydrogen blending with natural gas up to 70% (volume). Therefore, Jenbacher gas engines are already highly flexible in admixing hydrogen to natural gas. By retrofitting the world’s largest-running natural gas engine fleet, INNIO Jenbacher can make a substantial impact on reducing CO2 emissions.
Once hydrogen is available on a large scale, Jenbacher gas engines used for peaking and CHP applications can be converted from natural gas to hydrogen operation. Like natural gas, hydrogen is ideally suited for CHP applications and can provide heating and cooling while achieving a fuel utilization rate of more than 90% and reducing primary energy demand by more than 30%. In the short term, hydrogen can be blended with natural gas in H2-ready engines. In 2021, INNIO introduced such engines, which were configured to enable operation on natural gas blended with up to 25% hydrogen. INNIO’s strategy is to have our entire product portfolio ready for 100% hydrogen by 2025+. INNIO’s Type 4 product line was already available to operate on 100% hydrogen in 2021.
PROGRESS AND PERFORMANCE LOW CARBON AND CIRCULAR PRODUCTSPROGRESS AND PERFORMANCELOW CARBON AND CIRCULAR PRODUCTS
TECHNOLOGY FOR CARBON-NEUTRAL FUTURE
Figure 914 Subject to required modifications for the certification of the fuel gas components—a modification of the maintenance schedule for such components may be required

54 55TABLE OF CONTENTS
“INNIO looks at all process steps where we can save resources, reduce emissions, and improve social conditions.”
Beate Trojer Director Assembly, INNIO Jenbacher
“For me, sustainability is the process of living within the
limits of available physical, natural, and social resources
in ways that allow the living systems in which humans
are embedded to thrive in perpetuity.
INNIO looks at all process steps where we can save re-
sources, reduce emissions, and improve social conditions.
I’m proud to work for a company that puts so much effort
into employee awareness, new products, and processes
to further sustainability.”
COLLABORATINGWITH CUSTOMERS FOR THE LONG TERM
Why it matters to us: Collaboration unifies and empowers INNIO and our customers to achieve a shared goal, fosters innovation, and creates lasting relationships and opportunities for sustainable, long-term growth. It also makes us all responsible for promoting sustainable energy solutions.
Our aspiration: We want to build a regular sustainability engage-ment platform with our distributors aligned on relevant material topics to advance the growth of our ESG agenda.
Key performance indicator: Hours of engagement (trainings, workshops, seminars) of current distributors
Management approach: INNIO’s Global Sales, Services and Project Man-agement organizations are actively engaging with global customers and distributors. Function leaders engage regularly with the Executive Board to discuss strategy, goals, and progress.
Responsibility within INNIO: VP Global Sales, VP Global Services, VP Project Management, and VP Product Line & Marketing
Progress and status:Eliminating flaring globallyAccording to IEA’s Flaring Emissions Tracking Report (November 2021), 142 bcm of natural gas was flared globally in 2020. This resulted in about 265 Mt of CO2 and nearly 8 Mt of methane (240 Mt CO2-eq). A key contributor to this global problem, routine flaring occurs when there is no off-taker or transport pipeline for natural gas that is produced as a by-product of crude oil production (stranded gas). Key to eliminating routine flaring is monetizing the stranded gas through new business models. Governments globally are working at local, pro-vincial, and federal levels to tackle this problem. INNIO Waukesha is working with both our customers and government bodies to develop solutions that
Carbon-neutral fuels and bioenergyIn the early 1990s, INNIO began to decarbonize by installing gas engines that could generate power from biogas, a 100% carbon-neutral fuel. Today, we have one of the largest installed bases running on biofuels. INNIO engines, generating about 5.5 GW of electricity, are installed around the globe, producing 44 TWh of electricity and providing
SUPPORTING ENERGY VALUE CHAIN
PROGRESS AND PERFORMANCE LOW CARBON AND CIRCULAR PRODUCTS LOW CARBON AND CIRCULAR PRODUCTSPROGRESS AND PERFORMANCE
enough electricity and heat for about 12 million households annually. One of the most common dispatchable and reliable renewable energy sources, biogas can be used for distributed power and heat generation at the point of use. INNIO’s product portfolio is ready for a renewable future that includes low carbon fuels and hydrogen.
Figure 11

56 57TABLE OF CONTENTS
help reduce routine flaring. We are enabling our customers to generate electricity with stranded gas and power either co-located distributed com-puting applications or nearby remote communi-ties. The fuel flexibility of INNIO Waukesha engines makes it the right choice for customers in these distributed power generation applications. So far, INNIO Waukesha has installed more than 100 MW in flare gas-to-power applications globally.
In one such flare gas-to-power case, imple-mented under Saskatchewan’s methane action plan (MEP), INNIO Waukesha engines will use 15 MW of electricity to power 9,000 Saskatchewan homes under a 20-year power purchase agreement between the INNIO Waukesha customer and the local community. This low carbon baseload electricity generation will reduce CO2e emissions by 100,000 metric tons annually.15
ANALYTICS ANDDIGITAL SOLUTIONS
Why it matters to us: We embed sophisticated analytics and digital solutions in our product and service offerings. These tools enable customers’ high accuracy in asset management, reduce downtime, optimize operating costs, and extend the life-cycle of their equipment. We do this by predicting when main-tenance will be required and analyzing data for optimum energy output and highest efficiency to constantly improve sustainability performance.
Responsibility within INNIO: Chief Digital Officer—Digital Department
Progress and status: With extensive collaboration and a focus on our customers’ needs, we moved forward to expand INNIO’s energy solutions platform with a compre- hensive portfolio of digital products. Our myPlant advanced digital solutions offer real-time mon-itoring, preventive, and predictive analytics for engines, optimizing performance and reducing possible unplanned downtime through our service network in more than 100 countries. In 2021 the number of assets connected to myPlant was 9,747, an increase of 10% compared to 2020, when the number of connected assets was 8,887.
We also use the intelligent smart field technician dispatch function to plan both service events and our service technicians’ assignments. With this functionality, planned and unplanned mainte-nance are merged, reducing the number of site visits. In 2021 alone, more than 600 trips to customer sites (circa 30,000 km of travel) or 6,000 kg of CO2 could be avoided for end users served directly by INNIO technicians. In the meantime, nearly all work debriefing of the service technicians is now paperless.
CIRCULAR ECONOMY AND VALUE CHAIN
Why it matters to us: INNIO strives to operate responsibly and drive more sustainable practices across the breadth of our value chain, including areas such as design of new and existing components, procurement, and collaboration with suppliers, and we offer products with a positive circular impact to end users. This means, for example, optimizing resource/material use through an extended lifetime, reclaiming products for reuse, or recycling products and components. Product life-cycle planning that maximizes circularity is critical to effective value chain management and planning.
Our aspiration: Our goal is for >90% new products or components to be made with materials that are either reusable, re-manufacturable, reclaimed, or recycled by 2030.
Key performance indicator: Percentage (%) of recycled input materials used to manufacture our products and services
Management approach: INNIO designs our products so they are reusable and can have multiple life-cycles. Through our Jenbacher and Waukesha reUp programs, and our dedicated remanufacturing specialized team, used engines and parts are returned to like-new condition. This saves resources and reduces en-vironmental impact through material reuse while helping to increase efficiency and energy savings. We set internal goals for our reUp programs, and we aim to continuously find ways to increase cir-cularity. Our goal of having > 90% reused, recycled, or reclaimed materials by 2030 is handled by the Procurement team through extensive collaboration with suppliers and our high-quality data collection process. Finally, the INNIO Sustainability Review Board agreed to create a Circularity Task Force to systemize a framework of activities across critical business functions that would increase visibility, measurement, and accountability to continuously increase our circular activities.
Responsibility within INNIO: VP Services, Chief Technology Officer, VP Product Development, VP Product Line Management, VP Procurement
Progress and status: In 2021, our Jenbacher product line alone upgraded a total of almost 400 engines (in the field as well as in the workshop), which should lead to a reduction of more than 10,000 tons of CO2 annually, based on the average operating hours of past years.
As of 2021, our Jenbacher Remanufacturing pro-gram alone saved about 1,100 tons of CO2 and 1,510 tons of materials. This program gives an engine and all its parts a new, longer life, returning used components to like-new conditions.
Our aspiration: Through our myPlant digital platform, we aim to disperse sustainability solutions to our customers by adding ESG-related key performance indicators (KPIs). These KPIs will be easily accessible to our customers, helping them create their own ESG report and accelerate their sustainability journey.
Key performance indicators: Number of connected assets
Management approach: INNIO’s Digital Product organization, responsible for our myPlant remote applications, constantly works to improve solutions that enhance our customers’ digital experience and sustainable value propo-sition. INNIO’s overall digital strategy supports the Group’s Quality Policy, which describes our com-mitment to deliver affordable and reliable solutions to our customers. Our organization regularly aligns with the Executive Board in terms of strategy, goals, and progress. The digital value proposition is threefold: expanding myPlant’s performance, opti-mization, and maintenance products. The myPlant Performance solution increases engine reliability and performance through real-time monitoring, myPlant Optimization is designed to optimize our customers’ earnings and simplify their operational life, and myPlant Maintenance focuses on opera-tional excellence and service productivity. Through extensive collaboration with our customers, we try to ensure that we provide and adjust our digital solutions according to their needs. Furthermore, with our dedicated INNIO Customer Portal, our customers can immediately communicate with our employees to answer and solve their questions and requirements.
PROGRESS AND PERFORMANCE LOW CARBON AND CIRCULAR PRODUCTS LOW CARBON AND CIRCULAR PRODUCTSPROGRESS AND PERFORMANCE
Source 15 www.saskpower.com/about-us/media-information/news-releases/2021/
Power-Purchase-Agreement-Signed-For-New-Flare-Gas-to-Power-Facility

2021 2022 2025
Percentage of materials(recycled, remanufacturable, reclaimed)
2027 2030
53%56%
~60%
~75%
>90%
2021 2020 2019
Third-party water
Groundwater
Water withdrawn
78%
22%
83%
17%
86%
1,065
1,072
804
14%
58 59TABLE OF CONTENTS
INNIO’S PLAN TO ACHIEVE MORE THAN 90% PERCENTAGE OF RECYCLED, REMANUFACTURABLE, OR RECLAIMED MATERIALS BY 2030
Product safety & qualityAs an original equipment manufacturer, we are determined to always deliver safe, high-quality products. At the same time, we continuously work on exploring ways to reduce our products’ environmental impact throughout their life-cycle.
To earn and maintain the trust of our customers through the provision of top quality and safe equip-ment, INNIO has set the company-wide goal of zero product defects and recalls.
INNIO has comprehensive systems in place to promote quality improvement globally, with top executives taking responsibility for ensuring these promotions are successful. These are regulated by the EU Machinery Directive, harmonized under norm EN 12100 (machinery safety risk assessment), with which INNIO—as original equipment manufac-turer—complies. With respect to U.S. manufactured equipment, INNIO aligns with the National Fire Protection Association (NFPA), the Canadian Stan-dards Association (CSA), the UL standards, and other guidelines. INNIO’s overall product offerings, new product introductions (NPIs), research & devel-opment (R&D), and safety are governed by the Chief Technology Officer, who is also a member of the Executive Board.
“… I believe that INNIO truly in-spires all of us to strive towards a sustainable future of infinite possibilities.”
Panagiota Batziou Sustainability analyst, INNIO Group
“For me, sustainability means that human communities
across the globe can maintain their independence and
have access to the resources that enable them to meet their
needs, people feel valued and are protected from discrim-
ination, universal human and labor rights are attainable
by all, and all of earth’s environmental systems are kept in
balance. That is why I am proud of working for INNIO, a
company that looks beyond products and truly cares about
people and the environment. Through these strengths—lead-
ing technologies that help resolve the climate challenges
humanity faces and an open-style management system that
empowers young employees by listening and responding
to their ideas and strong partnerships—I believe that INNIO
truly inspires all of us to strive towards a sustainable future
of infinite possibilities.”
Graph 4
PROGRESS AND PERFORMANCE LOW CARBON AND CIRCULAR PRODUCTS LOW CARBON AND CIRCULAR PRODUCTSPROGRESS AND PERFORMANCE
The Product Safety Board, which includes INNIO’s Vice Presidents of Quality, Product and Services, meets each week. This body governs all of product safety, from NPI to the Residual Risk Summary.
Policies, instructions, operating procedures, safety instructions, and safe operation handbooks are managed as part of INNIO under a business process modeling tool. The end users of our products and services have digital access to the guidelines and instructions, and they sign con-formity as part of each contract. Conformity for product and service safety is provided by external audits and the issuance of ISO 9001, which covers 100% of INNIO’s production facilities and products.
Customers who buy a Jenbacher Remanufactured product get the same OEM quality and product reliability—all with a smaller environmental impact. At present, 53% of our material inputs are recycled, renewable, or reclaimed.
Remanufacturing and reUp programsOur ambition supported by specific business plans is to provide more local remanufacturing and con-dition-based maintenance in key countries or regions. Simultaneously, we hope to expand the range of remanufactured components as well as our buy back program of used engines to ready them for a new life-cycle. These activities are accom-panied by the extension and standardization of our return and handling processes. We have es-tablished a dedicated network of logistic and remanufacturing centers that perform high-quality OEM remanufacturing activities. In our approach to decarbonize this process, we are establishing reUp workshops in various global locations, closer to end users, to decrease the up and downstream transportation footprint.
Accelerating circularity through recycled materialsTo achieve the goal established in 2020 of “100% material inputs that are recycled, renewable or reclaimed,” we initiated a comprehensive and detailed framework that enables us to find the baseline of the current percentage of recycled materials. We also used this framework to calculate the percentage of recycled materials for 2019 and 2020. This methodology will be used as a bench-mark for our ongoing sustainability data collection. Along with planned methodological improvements, we estimate we will make systematic progress towards our 2030 goal (Graph 4). We also keep direct and close communication with our suppliers through constant email exchanges, dedicated meetings, and sustainability workshops. This helps us sustain the baseline, identify and mitigate challenges on our journey to building a robust path towards the circular economy. We are also adding recycling audit activities into the already estab-lished supply chain screening processes.
We understand that this is an ambitious under-taking, but combining the efforts with our stake-holders and actively investigating impact areas, such as design to recycle, remanufacturing, or re-use, will help us drive meaningful progress.

7,617
10,458
7,759
5,850
0.180.17
0.13
2021 2020 2019
2021 2020 2019
Purchased and ConsumedElectricity (Market-based)
Purchased and ConsumedElectricity (Location-based)Emissions intensity
(tCO2e/tons of materials)
0.82
0.69
35,92334,699
30,727
0.60
Stationary Combustion
Emissions intensity (tCO2e/tons of materials)
60 61TABLE OF CONTENTS
SCOPE 2 EMISSIONS (tCO2e)SCOPE 1 EMISSIONS (tCO2e)
RESILIENT MANUFACTURING AND SUPPLY CHAIN
ENERGY AND EMISSIONS Why it matters to us: INNIO consumes energy—mainly natural gas and renewable sources—in the production and testing of our energy solutions before they are distributed to our customers, as well as in our engineering labs. Effective management of our energy consumption is important to reduce the environmental cost of our operations, mitigate the climate effects of greenhouse gas (GHG) emissions, and increase our financial savings through better energy efficiency.
Our aspiration: Green advanced manufacturing is the cornerstone of sustainable management at INNIO, and we intend to become the global leader in highly energy efficient, near-zero eco-friendly operations. While minimizing our impact, we hope to emphasize that these issues are of significant importance to both INNIO and our stakeholders.
Key performance indicators: Scope 1, 2, and 3 GHG emissions (in tons of CO2e)
Management approach: INNIO’s Executive Board reviews and sets the direc-tion to support the goal of reducing CO2 emissions from our own activities (GHG Scope 1 and 2) by
50%. Our goal is to do this by 2030, but we have a strong desire to accelerate this process and meet the goal by 2028. A number of projects and initia-tives have been identified for different operational locations to actively pursue emissions reductions year by year. Updates on progress will be provided monthly to the Executive Board.
Important areas related to INNIO’s environmental impact are documented by INNIO’s Integrated Management System and the corresponding Environmental Policy. Companywide governance is monitored by the site’s Environmental Manage-ment teams to ensure compliance with standards and regulations. Regular reports on initiatives, goal setting and monitoring of relevant performance KPIs and environmental indicators are regularly appraised by the facility leadership teams and presented quarterly to the Executive Board for discussion and approval.
Responsibility within INNIO: VP Operations—Operations Department (for Scope 1 and 2 emissions), VP Procurement - Sourcing Department (parts of Scope 3 emissions), VP Product Management Jenbacher & Waukesha - Product Management & Marketing Department (parts of Scope 3 emissions)
In this chapter, we will take a deep dive into INNIO’s work on energy and emissions, resource management, and a sustainable supply chain.
Progress and status: Through advanced technologies and manu-facturing, environmental protection and energy efficiency have become main features at our production sites as the company continues our pursuit of ambitious environmental and carbon reduction targets. By expanding innovative, ener-gy-saving measures, installing smart, renewable equipment, and adding components for energy conservation, INNIO’s 2021 total energy consump-tion was approximately 650,000 GJ, coming from two resources—natural gas and hydropower. The energy consumption coming from renewable energy sources—hydro—increased by more than 60% compared with 2020.
The year 2021 was an important milestone in INNIO’s GHG-related efforts. INNIO carried out an extension in our GHG inventory—based on the Greenhouse Gas Protocol—including all relevant components for Scope 1, 2 and 3 emissions. Furthermore, INNIO conducted a life-cycle emissions assessment (LCE), a cradle-to-grave analysis. This technique assessed the environmental impacts
associated with all the stages of a product’s life, from raw material extraction through materials processing, manufacture, distribution, use, and remanufacturing. The LCE exercise helped us further comprehend the environmental impact of our products, identify environmental hotspots in products and materials, and establish a bench-mark against which improvements can be mea-sured in the future.
By taking tangible actions, INNIO has effectively reduced approximately 7,000 metric tons of direct and indirect CO2e emissions (Scope 1 and 2) in comparison to 2020 (Graphs 5 and 6). In 2021, INNIO also committed to the Science Based Targets ini-tiative (SBTi) and joined the Race to Zero initiative, a global campaign established by the UN Frame-work Convention on Climate Change (UNFCCC) to bring together global leadership for a healthy, resilient, and zero-carbon future.
Graph 5
PROGRESS AND PERFORMANCE RESILIENT MANUACTURING AND SUPPLY CHAIN RESILIENT MANUACTURING AND SUPPLY CHAINPROGRESS AND PERFORMANCE
Graph 6

Scope 1 Scope 2 Scope 3
Direct GHG Emissons Indirect GHG Emissons(From Purchased Energy)
Indirect GHG Emissions(Value Chain)
– ISO 50001 energy management and third-party audits 100% of production sites are ISO 50001 certified (energy management system)
– Next generation, sustainable production model for electricity & heat recycling INNIO’s largest manufacturing site in Jenbach follows a sustainable production model where all test benches are integrated and controlled with our future-oriented myPlant energy man- agement for self-supply of electricity and heat as well as with grid connection for electricity feed-in to the public grid.
– Renewable energy programs to reduce carbon emissions Installation of a nearly 2,000-square- meter photovoltaic plant with a total output of 350 KWp, corresponding to CO2 savings of 180 tons per year beginning in 2022.
– Green building production The company that constructed our site in Welland undertook initial LEED assessments and sustainable design strategies, leading to higher energy efficiencies. The construction included low-emitting materials, proper air quality and thermal comfort, and energy-efficient building envelopes, equipment, and light systems.
– Renewable energy purchase Our two biggest sites in Jenbach and Welland use renewable energy from the grid.
– Promoting local procurement Since 2019, the company has been gradually increasing collaboration with local suppliers. Local procurement lowers the distance with our suppliers and contributes to upstream transporta- tion GHG emissions reductions.
– Conducted a life-cycle emissions assessment Through this assessment we aimed to assess the environmental impacts of our products, helping facilitate a strategy for emissions reductions.
– Raw materials Since purchased goods comprise approximately 40% of INNIO’s 2021 total carbon footprint, INNIO con- ducted an extensive assessment of the current percentage (%) of recycled input materials. An increase of this percentage could lead to GHG emissions reductions.
6,230,144
43,228
10,871
4,7603,076 2,956
1,170 2,104280
43,018
13,459
3,519 3,9781,718 1,604
56,168
14,394
4,793 4,544
1,816 2,531
2021
2020
2019
Use of Products
Purchased Goods
Fuel Indirect Upstream Materials Transport
Upstream Leased Asset
Commuting to Work
Waste DownstreamTransport
Business Travel
62 63TABLE OF CONTENTS
Table 4
Graph 7
We will be paying close attention to science-based targets (SBTs) and continue working on projects and initiatives in line with 1.5°C emissions reduction scenarios criteria. We estimate that a continuous share increase of renewable sources combined with responsible use of energy in our operations and offices will further reduce our Scope 1 and 2 emissions and will be a main contributor to cutting Scope 1 and 2 emissions by 50% by no later than 2030.
Reducing emissions across our value chainINNIO aspires to become a leading example of low carbon manufacturing. The company conducts annual carbon footprint assessments and per-forms yearly reviews of the overall effectiveness of carbon reduction in collaboration with third-party consultants.
For many years, INNIO has been continuously fol-lowing industry best practices for GHG reductions. At the Jenbach site, INNIO has established a sus-tainable production model that enables the reuse of electricity and heat being produced by the test benches and engineering processes. At the end of 2018, the site in Welland was constructed in accor-dance with green building best practices for high energy efficiency in the production process.
Additional actions include an extensive assess-ment regarding the percentage of raw materials used as input in our materials by INNIO’s Pro-curement team as well as an increased focus on extending our local procurement practices. This year, INNIO also invested a large amount of capital in renewable energy products by integrating a photovoltaic plant and battery storage system in our headquarters to further reduce our operations’ Scope 1 and 2 GHG emissions.
Indirect emissions (Scope 3) of upstream and downstream value chains mainly involve the use of manufactured products and sourcing of raw materials. As such, INNIO has set goals related to the percentage of materials that are reusable, re-manufacturable, reclaimed, or recycled, and we work closely within the circularity matrix to signifi-cantly decrease the GHG impact of manufactured products and components. In comparison with 2019, the factor of purchased goods has decreased by 30% (Graph 7). Emissions from Scope 3 compo-nents such as upstream and downstream trans-portation and waste remained approximately the same. In 2021 we saw a geographical shift in our supplier base moving closer to INNIO’s operations, which will yield a positive trend on our upstream transportation footprint going forward. See Appen-dix for our GHG Emissions Inventory.
PROGRESS AND PERFORMANCE RESILIENT MANUACTURING AND SUPPLY CHAIN PROGRESS AND PERFORMANCE
16 The graph presents a comparison of INNIO’s Scope 3 emissions between 2019-2021. In 2021, INNIO added the following Scope 3 components in our carbon footprint assessment: Use of products, Upstream Leased Assets, Business Travel
RESILIENT MANUACTURING AND SUPPLY CHAIN
SCOPE 3 EMISSIONS (tCO2e)16INNIO’S GHG REDUCTION PRACTICES

PROGRESS AND PERFORMANCE PROGRESS AND PERFORMANCE64 65TABLE OF CONTENTS
372,839
187,901
151,973
35,928
61,301
18,203
43,098
18,4688,054
1,9028,512
390,619
17,864
-35,644
Total energy consumption
Consumption from non-renewable sources (natural gas)
Consumption from renewable sources (hydro)
Electricity consumption
Electricity sold
WaukeshaJenbach Welland Other locations
2021 ENERGY CONSUMPTION FACILITIES (GJ)18
RESOURCE MANAGEMENT Why it matters to us: INNIO understands the importance of natural capital preservation. Therefore, we aim to maintain leading environmental stewardship practices in our own op-erations and responsibly manage our use of natural capital, including minerals, water, and land.
Our aspirations: Overall, one of INNIO’s environment-related goals is to reduce as much as possible our total water consumption. In comparison to previous years, our water withdrawal—and therefore our water consumption—increased, but we are determined to consume water responsibly and intensify our efforts to control and reduce its use.
As described in our Environmental Policy, INNIO’s waste-related goals include both hazardous and non-hazardous waste. Beginning with the supply chain, INNIO promotes resource reduction in our upstream and downstream activities. In addition, INNIO aims to achieve source optimization and minimization by adjusting raw materials usage parameters at the source and technical solutions for process technology.
We aim to further contribute to the circular economy by continuously increasing the recycling rate of waste as well as the preparation of waste for reuse, INNIO’s goal is to recover more than 80% of non-hazardous waste in our operations by 2030. Finally, even though hazardous waste is only a fraction of INNIO’s waste generation, we are deter-mined to eliminate it by implementing measures such as reducing chemicals at the source.
Key performance indicators: Waste generated (in tons), water withdrawal (in megaliters)
Responsibility within INNIO: VP Operations—Operations department
Management approach: INNIO’s VPs of Operations and their Operations teams are responsible for the sustainable management of our operating procedures. The team sets internal and external environmental goals—some of which are described in INNIO’s Environmental Policy—and defines environmental guidelines, prepares dedicated and mandatory environmental trainings for all employees, im-plements new, sustainability-related projects for INNIO’s operations, and conducts internal and/or external audits to ensure that our procedures are in alignment with international standards and local laws and regulations.
INNIO’s water and waste management is cov-ered by INNIO’s Integrated Management System (IMS) and is ISO 14001 certified. Dedicated experts from INNIO’s EHS team are responsible for monitor-ing and managing water and waste-related activ-ities to help ensure that INNIO is fully compliant with applicable laws, regulations, and standards. Man-agement approach, KPIs and goals are monitored and communicated regularly, at least quarterly, to the members of the Executive Board, who provide feedback.
Together with all other environmental risks, water-related risks are also part of INNIO’s group-wide enterprise risk management process, while a systematic approach is taken into daily operations to measure, monitor and manage water-related activities. High-level water stress assessments are conducted on an annual basis.
Progress and status: According to Graph 9, INNIO’s total water with- drawal in 2021 was around 1,060 megaliters, and most of that was groundwater. In 2021, INNIO generated a total of 11,567 tons of waste with the waste recycling, reuse and recovery rate reaching 85%. Non-hazardous waste constitutes most of the waste generated.
17 1% grey energy 18 The energy consumption is based on the GRI methodology.
Graph 8
In 2021, life-cycle emissions (LCE) were added to the overall GHG disclosure. We stated emissions for one year of all sold products based on statistical and average data of the previous year’s hours of operation. In line with INNIO’s sustainable growth strategy and low carbon and circular product goal, we expect that the average annual LCE of products sold will continuously decrease. This likely will be driven by use of climate-neutral and renewable fuels such as hydrogen. Total emissions during the life-cycle of a product are dependent on the appli-cation and the operational model.
Energy Efficiency in INNIO’s Operations INNIO’s energy management system is part of the Integrated Management System and acts in accordance with ISO 50001. Through annual energy consumption monitoring and a set of internal targets, INNIO aims to identify energy consumption improvement areas. We also aim to continuously increase the energy efficiency of our operations through technical improvements and process optimization.
To be more specific, in our headquarters in Jenbach—which accounts for approximately 58% of our total energy consumption—we use an advanced energy management system that
drives high-energy recovery from the electricity produced during testing to power our operations. The produced thermal and electrical energy is fully utilized for the production process, while any surplus is provided to the communal heating network or the grid. Furthermore, in our two production sites—in Jenbach and in Welland—the electricity17 purchased from the grid is renewable or climate neutral, while other smaller sites and offices use an electricity mix from the grid.
As illustrated in Graph 8, the largest amount of energy consumption comes from INNIO’s head-quarters in Jenbach, where production of our en-gines takes place, and our site in Waukesha, where the main contributor for its energy consumption is the engineering lab.
In 2021, with full support from the Executive Board and management team, INNIO was able to increase our investments related to modernization at our sites. For instance, related to renewable energy programs, a photovoltaic plant and a battery stor-age system were installed. INNIO is committed to expanding the use of renewable energy in our total energy consumption mix through the adoption of additional sustainable activities.
RESILIENT MANUACTURING AND SUPPLY CHAIN RESILIENT MANUACTURING AND SUPPLY CHAIN

PROGRESS AND PERFORMANCE PROGRESS AND PERFORMANCE66 67TABLE OF CONTENTS
INNIO’S ANNUAL WATER WITHDRAWAL (MEGALITERS)
INNIO’S WRI WATER-RELATED RISK ASSESSMENT
WASTE-RELATED INFORMATION (TONS)
19 Both of these figures have been calculated as figures from “waste diverted from disposal.”20 Waste recycling rate = Waste for recycling, reused and for other recovery operations / waste generated
Water ManagementINNIO uses international tools and indexes to conduct high-level water risk assessments on an annual basis. We use this publicly available tool annually to assess water supply, effluent water quality, and regulatory/reputation risks. Results from these water risk assessments are used for assessing climate
Waste management INNIO’s waste management strategies abide by the principle of waste minimization, resource recycling, and reuse maximization. Our activi-ties generate solid and liquid waste, including non-hazardous waste. More than 85% of our waste is non-hazardous, such as municipal waste, paper, and wood waste. Hazardous waste makes up only 7% of INNIO’s waste19. Examples of hazardous waste include emulsion and alkali mixtures, waste oils, and waste from cleaning and specialty detergents.
INNIO withdraws water from two sources, ground-water and third-party water. As regards effluent discharge quality, INNIO adheres to the requirements laid down in local legislation. We systematically monitor and manage appropriately all water discharge. In addition, local regulatory authorities are involved to help ensure that we follow local environmental regulations and obtain all required permits for direct and indirect water discharges. According to Graph 9, INNIO’s total water withdrawal in 2021 was approximately 1,060 megaliters, with no significant variance in comparison with 2020, where the water withdrawal was 1,072 megaliters.
The Procurement team has set clear packaging and process guidelines for our suppliers. After raw materials are used in manufacturing processes, re-cycling or reuse is prioritized to help ensure that they are not immediately disposed of as waste. INNIO uses an internal software platform for documenting and monitoring the different types and weights of waste used as well as assessing their potential haz-ards. Finally, INNIO follows applicable local laws and regulations and regularly collects the waste for out-sourced treatment. INNIO regularly reports about our waste management procedures to local authorities.
Non-hazardous waste ~ 8,600 tons (~87% of total waste)
Hazardous waste ~ 750 tons (< 7% of total waste)
Waste diverted from disposal ~ 9,900 tons (> 85% of total waste)
Waste diverted to disposal ~ 1,200 tons ( > 10% of total waste)
Recycling~ 8,300 tons (representing 84% of waste recycling rate)
Reuse132 tons (representing 1% of waste recycling rate)
Other recovery operations
~ 1,500 tons (representing 15% of waste recycling rate)
2021 2022 2025
Percentage of materials(recycled, remanufacturable, reclaimed)
2027 2030
53%56%
~60%
~75%
>90%
2021 2020 2019
Third-party water
Groundwater
Water withdrawn
78%
22%
83%
17%
86%
1,065
1,072
804
14%
2021 2022 2025
Percentage of materials(recycled, remanufacturable, reclaimed)
2027 2030
53%56%
~60%
~75%
>90%
2021 2020 2019
Third-party water
Groundwater
Water withdrawn
78%
22%
83%
17%
86%
1,065
1,072
804
14%
change-related water stress risk. We will continue to assess the water-related risks for our facilities and develop and implement water management plans. Since 2020, INNIO has adopted the Water Risk Atlas from the World Resources Institute (WRI) to evaluate water-related risks for our facilities. According to the results, 100% of INNIO’s facilities are rated with low risk.
2021 2020 2019
85%
11,567 11,122
11,903
86% 86%
CH4 * GWP [MTpy]
CO2 [MTpy]
Waste generated
Waste recycling rate20
SCENARIO 1.1’000 TPY OF CO2E
7042GL
7044 GSI S4 7044 GSI S5
7042 GSI S4 7042 GSI S5
SCENARIO 2.1’000 TPY OF CO2E
7.3
(-16%)
8.16.8
-1.2
(-15%)-1.2
(-14%)-1.0
Based on normalized 1480hp-226 to -252
7.26.11.5
5.8
0.5
6.7
6.7
0.6
7.4
0.1
0.1
6.0
Based on normalized 1680hp-266
WRI Water Risk Index
QuantityWater stress, depletion, seasonal or interannual variability, drought risk & flood risk
QualityCoastal erosion, untreated water bodies
Regulation & ReputationDrinking water quality & sanitary conditions, ESG Risk Index
INNIO’s Water Risk Assessment
Water Stress Flood Risk Water Quality Risk Regulatory Risk
Water Assessment Results
Low Risk 100% of facilities assessed
Medium Risk-
High Risk-
Table 5
Upstream Onsite wastemanagement
Outsourced waste treatment
– Policies on waste for suppliers– Requirements for documentation of hazardous and non-hazardous substances in products and materials supplied to INNIO– Quality requirements and guidelines to suppliers– Audits
– ISO 14001 certification & renewal every three years– Internal audits (at least annually) – Waste output tracking – Internal waste reduction goals – Waste separation procedure – Intelligent software system for proper treatment of waste
– Monthly waste collection for outsourced waste treatment according to local laws and regulations– Documentation in internal software system– Regular reporting to local authorities
INNIO’S WASTE MANAGEMENT PROCEDURE
Table 6
Graph 9 Graph 10
RESILIENT MANUACTURING AND SUPPLY CHAIN RESILIENT MANUACTURING AND SUPPLY CHAIN

PROGRESS AND PERFORMANCE PROGRESS AND PERFORMANCE68 69TABLE OF CONTENTS
Spill prevention INNIO’s spill management is defined as the prevention and management of spills in opera-tions and other spills resulting from an incident. Our management approach includes identifying hazards, conducting related risk assessments, taking preventive measures, and creating plans to respond to specific business conditions and emergencies as well as cleanup procedures. Our spills management plan, which is under the direct control of INNIO’s EHS team, identifies the people responsible for dealing with spills and sets out clear responsibilities and actions necessary should a spill occur.
Our goal is simple: zero spill incidents. In 2021, and for several consecutive years earlier, INNIO recorded zero spill incidents in our operations (including oil, fuel, and spills from wastes or chem-icals). We are committed to continue to follow best practices in our operations and continue this zero spill incidents track record.
SUSTAINABLE SUPPLY CHAIN
Why it matters to us: INNIO aspires to attain the highest standards in supplier relations, manage risk, and promote best practices throughout the supply chain. We aim to decrease the environmental and social impact of our supply chain by requiring that our suppliers uphold high standards in environment, human rights, and health & safety.
Our aspiration: We foster strong, long-standing relationships with our suppliers through a standardized performance evaluation system.
Key performance indicators: Percentage (%) of new suppliers screened using environmental and social criteria
Responsibility within INNIO: VP Procurement—Sourcing Department
Management approach: INNIO’s sustainable supply chain approach, gov-erned by the VP of Procurement and the dedicated Sustainability Procurement team, includes a dedi-cated ESG and Procurement Policy, a Supplier Code of Conduct, and a Conflict Minerals Policy through which we set clear guidelines and sustainability standards that we require our suppliers to follow. We work with suppliers who actively sign that they follow the 10 Principles of the UN Global Com-pact, and we implement dedicated ESG assess-ments and audits for them. INNIO’s Procurement team sets clear internal and external ESG-related goals as well as a detailed ESG Procurement roadmap to achieve these goals.
Progress and status: In 2021, we conducted a specific compliance campaign addressed to 250 of INNIO’s key vendors by proactively communicating the importance of INNIO’s Code of Conduct, ethical standards, and transparency in business practices. As part of this campaign, we asked our key suppliers to sign a specific acknowledgment letter underlining their commitment to the highest compliance standards.
In 2021, all of these direct material suppliers passed the individual onboarding checks and were successfully added as direct material suppliers to INNIO.
Supplier engagementTo showcase our deep commitment to ESG aspects and to encourage action in the supply chain, in July 2021 the Sourcing team introduced a new, dedicated sustainability section in the top21 direct material suppliers’ performance evaluation. This section includes seven ESG criteria, representing 15 points (out of a total 100). The criteria include, among others: GHG reduction targets, certifications on environmental and energy management systems, the recycled material ratio in products sold to INNIO, and utilization percentage of renewable electricity in operations. For a supplier to be classified in “Class A” in the sustainability section of the scorecard, the sup-plier needs to score between 11 and 15 points. To score the maximum points (15) in the sustainability section, a supplier must set science based GHG reduction targets, use more than 75% of recycled materials, and have energy certifications in place.
INNIO began a partnership with EcoVadis, a glob-al leader in third-party evaluations of business sustainability performance. This collaboration aims to assess the sustainability performance of INNIO’s top direct material suppliers through proactive ratings and evaluations using EcoVadis’ methodology. In less than six months after its introduction in mid-2021, suppliers representing more than 40% of the direct material spending were rated. The team engages regularly with our strategic suppliers to further increase the rating completion percentage. So far, this assessment has enabled us to gain a clearer sustainability standing of our suppliers, which is helpful in identifying key ESG issues and promoting an agile interaction with our suppliers and responsible business practices throughout the supply chain.
Finally, the Sourcing team’s newest program, introduced in September 2021, requires a green building certification or energy class of “D” or better from all new INNIO office space landlords. In this way, we ensure we only use and rent high energy efficiency performance spaces. Currently, the team is working on expanding this process of requiring green building certifications from existing landlords as well, an exercise that will be completed by mid-2022.
ComplianceINNIO’s Procurement Department applies its specialized expertise and due diligence to ensure sourcing of the highest quality materials in our advanced manufacturing process, while simulta-neously retaining strict compliance with applica-ble legal requirements, norms and standards in areas of environmental protection, health & safe-ty, human rights, and overarching transparency in procurement value chain.
The department established a dedicated functional compliance and sustainability team tasked with maintenance and development of operational frameworks, supply chain audits, contribution to the overall company-wide circu-larity process, as well as proactive sustainability and compliance-focused trainings.
INNIO’s environmental and social requirements are publicly available and regularly communicated to all existing and potential suppliers. All new and ex-isting Tier 122 suppliers are required to adhere to the Group’s Code of Conduct and Procurement and Supply Chain CSR Policy, taking actions to improve human and labor rights, health & safety, anti-cor-ruption environmental protection, and business ethics, among others. INNIO requires all suppliers to acknowledge and sign their adherence to the 10 principles of the UN Global Compact. In case of non-compliance or non-resolving of agreed corrective actions, INNIO reserves the right to termi-nate relationships with the supplier in question.
ESG assessments & auditsTo further advance sustainability to our core procurement processes, INNIO’s Procurement team performs advanced ESG checks that range from detailed questionnaires to onsite ESG audits, covering environmental and energy management, health & safety, and overall social-related topics. As described in Table 7, INNIO follows three levels of environmental and social assessments for new suppliers that help to identify potential risks and improvement areas for suppliers before onboarding.
21 Top direct material suppliers represent more than 80% of supplier spending out of approx. 700 direct suppliers globally
22 Tier 1 suppliers include all suppliers who work directly with INNIO
RESILIENT MANUACTURING AND SUPPLY CHAINRESILIENT MANUACTURING AND SUPPLY CHAIN

NEW SUPPLIERS SCREENED WITH SOCIAL CRITERIA
As illustrated in Graphs 11 and 12, in 2021, we assessed 100% of INNIO’s new direct material suppliers, only eight of whom were identified as having potential negative environmental- or social-related impacts. In these cases, INNIO’s Sourcing team performed eight dedicated Level 3 ESG audits, which revealed 14 environmental and 25 socially significant issues. All cases are documented in the team’s dedicated auditing tool. The identified issues covered waste disposal and chemical storage as well as issues related to employee safety and noise. Our assessments did not identify any incidents of non-conformities in living wages, maximum allowed working hours, and child or forced labor. For all identified cases, we required our suppliers to close the identified issues within 30 days from the issue identification date. In case of non-compliance or if non-com-pliance is not addressed in a timely manner, INNIO reserves the right to terminate relationships with our suppliers.
Sourcing conflict-free mineralsAs an official member of the Responsible Minerals Initiative (RMI), INNIO supports sourcing conflict-free raw materials as a practice of humanitarianism and compliance with social transparency and ethics. All INNIO suppliers must adhere to our publicly available Conflict Minerals Policy, which requires our suppliers to source conflict-free raw materials. INNIO also has adopted a series of compliance measures based on industry best practices, includ-ing a conflict minerals program that ensures that we constantly collect smelters and other relevant information from more than 75% of the targeted suppliers (with high RMI relevance).
Furthermore, to help ensure due diligence as per the existing regulations and standards, INNIO follows the RMI process and template. INNIO’s con-flict minerals due diligence assessment, begun in 2020, showed only seven questionable smelters out of more than 700. For the questionable smelters, the respective suppliers were requested to provide evidence on their due diligence actions, which eventually will result in 100% compliant smelters.
Local sourcingINNIO’s production is primarily located in Jenbach, Austria, and Welland, Ontario, Canada. Our pro-curement can be divided into several categories, including equipment, spare parts, raw materials, and other goods. To build a more effective supply
chain, and achieve GHG reductions, INNIO actively seeks to expand our local procurement practices. Local procurement reduces the distance with our suppliers, leading to GHG emissions reductions and lower transportation costs. At the same time, we have been cooperating with suppliers who follow sustainable practices in their production processes and who can provide the required proportion of recycled input materials. For instance, for some of the heaviest parts of the Jenbacher units, INNIO has gradually transitioned from suppliers located in Asia to suppliers located in Europe, a measure that will contribute to a substantial upstream transpor-tation CO2 reduction.
To support the sustainable development of the local supply chain and continue reducing our upstream transportation GHG emissions, we aim to continue identifying new local suppliers and collaborate on limiting the carbon footprint of procurement activities.
Leve
l 1
Level 1 is “standard screening”, which applies to all of our regular (no “spot-buy”) suppliers, no matter how small the purchase. Before working with INNIO, these suppliers (as well as the suppliers in scope of the control levels 2 and 3) are required to review, agree, and sign the Supplier Integrity Commitment Declaration, through which they commit to following the 10 Principles of the UN’s Global Compact.
Leve
l 2
Level 2 entails a mandatory ‘vendor prescreen’ self-assessment that is conducted before INNIO will work with direct and indirect (environmental, logistics, and real estate) suppliers. In the vendor prescreen, Level 2, suppliers are asked to provide EHS, environmental, and energy management information. The vendor prescreen is reviewed by the Compliance team in INNIO’s Procurement department to decide whether to approve or reject the supplier onboarding. In some cases, additional information is required from the supplier beyond that provided in the vendor prescreen process. All vendor prescreen responses are stored in dedicated databases, along with the suppliers’ contact information.
Leve
l 3
Level 3 is an in-depth and onsite audit performed by INNIO’s Supplier Quality Engineer when the supplier’s country Corruption Perception Index is above a baseline level. The dedicated ESG audit is also a regular process for suppliers in specific countries and occurs every three years. It contains 75 questions that cover four sections: EHS (Environment, Health & Safety), Labor, Security, and Intellectual Property. The audit records are stored in INNIO’s audit tools.
NEW SUPPLIER ENVIRONMENTAL- AND SOCIAL-RELATED ASSESSMENT
NEW SUPPLIERS SCREENED WITH ENVIRONMENTAL CRITERIA
100%
173
8 5 9
323
62
100%
40%
2021 2020 2019
Number of work-related injuries in operations
Number of work-related injuries in services
Rate of recordable work-related injuries
Number of suppliers assessed for environmental topics
Number of suppliers identified as having significant actual or potential negative environmental impacts
Percentage (%) of new suppliers that were screenedusing environmental criteria
0.75
1510
26
812
53
1.87
1.12
2021 2020 2019
100%
173
8 6 7
323
62
100%
40%
Number of suppliers assessed for social topics
Number of suppliers identified as having significant actual or potential negative social impacts
Percentage (%) of new suppliers that were screenedusing social criteria
2021 2020 2019
100%
173
8 5 9
323
62
100%
40%
2021 2020 2019
Number of work-related injuries in operations
Number of work-related injuries in services
Rate of recordable work-related injuries
Number of suppliers assessed for environmental topics
Number of suppliers identified as having significant actual or potential negative environmental impacts
Percentage (%) of new suppliers that were screenedusing environmental criteria
0.75
1510
26
812
53
1.87
1.12
2021 2020 2019
100%
173
8 6 7
323
62
100%
40%
Number of suppliers assessed for social topics
Number of suppliers identified as having significant actual or potential negative social impacts
Percentage (%) of new suppliers that were screenedusing social criteria
2021 2020 2019
Graph 12
Table 7
Graph 11
PROGRESS AND PERFORMANCE RESILIENT MANUACTURING AND SUPPLY CHAIN RESILIENT MANUACTURING AND SUPPLY CHAINPROGRESS AND PERFORMANCE70 71TABLE OF CONTENTS

INNIO’S 2021 TRAINING NUMBERSRESPONSIBLE OPERATIONS AND SOCIAL RESPONSIBILITY
EMPLOYEE EXPERIENCEWhy it matters to us: Our employees are the driving force behind our company. We look to attract the best talent and provide fulfilling careers so that our employees stay and develop with us. Training, development, employee engagement, and inclusive workplace are all essential to the employee experience.
Our aspiration: We want to ensure operational excellence through increased focus on our employees. We are de-termined to continue to grow stronger together with them. We focus on strategic talent attraction, retention, and development opportunities through competitive compensation schemes, benefits, and extensive trainings, according to corporate and individual employee needs. Together with our employees, we plan their career paths, and we encourage internal transfers, allowing the right people to gravitate towards the right positions.
Key performance indicator: Total number of training hours provided to employees and average hours of training per year per employee
Responsibility within INNIO: Chief Human Resources Officer—HR Department
Management approach: The HR Department, under the direct leadership of the Chief Human Resources Officer, is responsible for setting internal and external employee-related targets, developing or revising INNIO’s DEI Policy and Labor & Human Rights Policy, as well as engaging with employees from all departments and providing trainings that enable our employees to thrive in their jobs and careers. Through regular and clearly struc-tured employee practices (including hiring, retention, compensation, and promotion practices), we aim to ensure a working environment of inclusion and constantly enhanced employee engagement.
Progress and status: In 2021, INNIO’s global business continued our success and sustainable growth, and we acknowledge that this positive development is driven by our employees, their commitment, and innovative engagement.
In 2021 INNIO’s employees participated in 105,785 hours of training, meaning that each employee re-ceived, on average, 29 hours of training. Furthermore, as illustrated in Figure 12, in 2021, the average number of trainees participating in each of INNIO’s Corporate Lectures (five in total) was approximately 100, and more than 1,160 trainings from our e-training platform were started. Also in 2021, 45 trainees completed INNIO’s “First Wave Leadership Program” and 32 the “Talent Development Journey.” We are determined to continue supporting all of our employees in their development activities in 2022! Since many of them are still working from home, we will be introducing a variety of eTrainings and live online trainings to support them with their remote work.
This chapter covers the material topics of employee experience, diversity and inclusion, health & safety, and community engagement.
needs as well as their own personal and professional development. INNIO promotes our continuous learn-ing and development strategy through goal setting, regular performance feedback, and promotion of internal rotational opportunities. In addition, we en-courage employees to foster their own professional and personal development through our various training pillars.
Our training goal is to always provide the best training options that will allow employees to see ahead and plan a fulfilling career path. In addition, our product-related training goals are to expand our training portfolio, including more products. We would like to update some of the training programs and add new digital features, such as virtual reality training that will enable trainees to interact with simulated, real-world INNIO energy solutions. Finally, responding to the high demand of local training, one of our short-term goals is to expand INNIO’s regional training by creating new Training Centers in some districts of Asia.
INNIO’s learning platform is accessible to INNIO employees, contractors, and external stakeholders such as distributors and customers, and is hosted by INNIO’s Global Training Center team, INNIO digital learning platform, and external subject matter ex-perts on a need basis.
INNIO has two major pillars for training. One is the “INNIO Development Academy,” created to help employees continuously develop their personal and professional skills. Through a variety of development offerings like eTrainings, workshops, and other pro-grams, employees learn from renowned external trainers and coaches or directly from their colleagues in cross-functional teamworking sessions.
The second pillar covers “Technical Product Training” for the Waukesha and Jenbacher product portfolios and is aimed at internal employees as well as distributor and customer operations and mainte-nance personnel. Product training typically is carried out at a global Product Training Center with a strong focus on hands-on activities, in-class exercises, live online training, and eTraining programs. Completion is granted upon passing of an exam and rewarded with a specific certificate.
To broaden employee perspectives on business- relevant topics and market trends, corporate lectures led by INNIO’s leaders and subject matter experts are offered as live events. In 2021, the corporate lectures emphasized sustainability, diversity, energy transition, and product development, to name a few examples.
of training hours provided to employees
105,785
corporate lectures with average of 100 participants
5eTrainings started1,161
new leaders completing the “First Wave Leadership Program”
32
Figure 12
The completion target for the mandatory annual trainings, which include topics such as Legal & Compliance, Health & Safety, and prevention of corruption, is 100%. In 2021, the completion rate of these trainings reached about 95%.
In 2021, more than 77,000 training hours for our Jenbacher and Waukesha products focusing on technical product expertise were accomplished, training approximately 7,200 people, including INNIO’s workforce, distributors, system integrators, and customers.
Learning & developmentLearning and development are vital to our employ-ees and to INNIO. They ensure employee skillsets can grow and evolve to support the employee’s personal path as well as the organization’s long-term strategy and growth. Thus, INNIO promotes lifelong learning in a variety of ways. Employees are encouraged to engage in learning activities that align with the company’s growth and organizational
average training hours per employee
29
talents completing the “Talent Development Journey”
45
PROGRESS AND PERFORMANCE RESPONSIBLE OPERATIONS AND SOCIAL RESPONSIBILITY RESPONSIBLE OPERATIONS AND SOCIAL RESPONSIBILITYPROGRESS AND PERFORMANCE72 73TABLE OF CONTENTS

Given INNIO’s multinational talent group, our large presence in Austria, and increased interest from employees with international backgrounds, INNIO expanded our offering of German language courses. INNIO also helps our full-time employees with the financing of their personal, external language tutors. With this support, INNIO aims to enable communi-cation among our employees, as well as enhance their social and cultural integration and broaden their horizons. In the future, our goal is to expand our support by providing courses with a greater variety of language options.
Employee benefitsINNIO offers employees diverse benefits, including: health insurance, life and disability insurance, various retirement plans including pensions, financial assis-tance for emergencies, paid time off programs, and discounts in designated shops. Some of our facilities, such as our Jenbacher headquarters, are equipped with health centers, where appointed onsite physi-cians provide medical assistance to our employees and a selection of regular or specific vaccinations (e.g., for travelers). Since the end of 2020, at our largest site in Jenbach, we also have provided to our employees and their relatives the option of onsite vaccination for COVID-19. In 2021 more than 800 employees took advantage of our vaccination bus service. Furthermore, INNIO provides our employees
with sufficient support in their personal and work lives. We offer parental leaves in accordance with local laws and regulations as well as other type of leaves, including educational or caring leaves, sabbaticals, and early/partial retirement, through a compre-hensive leave management system.
Our goal is to provide competitive compen-sation and reward schemes for each employee at all levels. For this reason, we regularly review remuneration programs, market salary scales, and economic indices in the locations in which we ope-rate. We also survey markets and rely on industry-leading compensation and benefits benchmarking organizations and market salary scales to ensure alignment.
INNIO’s compensation decisions for every employee are based on the role and responsibility, performance, skillset, and demonstrated proficiency, excluding biases such as gender, age, ethnicity, race or color, sexual orientation, disability status, protected veteran status, or any other characteristic, including regulations of international or local standards and laws. Our annual Performance Management Program helps us promote transparency in our compensation and promotion decisions, improve our employees’ job understanding, promote more effective job performance, and establish future goals for career growth.
PROGRESS AND PERFORMANCE RESPONSIBLE OPERATIONS AND SOCIAL RESPONSIBILITY RESPONSIBLE OPERATIONS AND SOCIAL RESPONSIBILITYPROGRESS AND PERFORMANCE
DIVERSITY AND INCLUSIONWhy it matters to us: Diversity and inclusion in all our people processes is critical to ensuring we create a workplace culture where individuals can flourish and contribute to the shared success of the business. When we refer to diversity, we recognize not only large societal value but also rich creative opportunity in which various cultures, backgrounds, genders, and age groups contribute with their perspectives, values and experiences. Together, these foster new and better thought processes and ideas and often innovative solutions that can help our customers succeed and build long-term value. Diversity & Inclusion is embedded in our core values, which define what we stand for and how we conduct business with our customers, partners, and each other.
Our aspiration: As part of the sustainability goals we introduced in 2020, INNIO’s ambition is to cultivate an inclusive working environment where diversity prospers in support of our strategic ambitions and priorities. For this reason, we continue to incorporate diversity and inclusion into our key people processes, from employee attraction, retention, and development to an overall corporate culture of transparency, trust, and dynamic collaboration. Diversity is critical to achieving a high-performance culture and is a key enabler of innovation. Diversity for INNIO is much more than gender diversity. We aim to treat diversity from different groups’ perspectives and across all levels of the company. In addition, we want to focus on cultural diversity, enabling us to better collaborate with our customers across the globe.
Key performance indicators:New employee hires and employee turnover by age group, gender, and region
Responsibility within INNIO:VP Diversity & Inclusion and Chief Human Resources Officer—Communications Department; HR Department
Management approach: In 2021, INNIO’s CEO together with the Executive Board created the new Leadership position of Vice President Diversity & Inclusion, dedicated to expanding diversity culture and programs. This role collaborates closely with INNIO’s CEO and President as well as the Group’s CHRO. It is responsible for engaging with employees and stakeholders and setting meaningful goals directed to building a workforce that represents the views and values of INNIO and our stakeholders, while ensuring that every employee feels truly valued and included within the global INNIO family. The VP Diversity & Inclusion also chairs the Diversity, Equity & Inclusion (DEI) Committee. This committee is responsible for outlining INNIO’s key diversity and inclusion goals, establishing our DEI Policy, and setting our DEI strategy. The DEI Committee reports directly to the members of the Executive Board who are respon-sible for overseeing INNIO’s ongoing DEI efforts and evaluating their effectiveness. VP Diversity & Inclu-sion is also member of the Sustainability Review Board and collaborates closely within the overall ESG framework. INNIO emphasizes high-quality DEI data collection, and in 2021 we conducted a gender pay gap analysis, which we aim to expand.
Progress and status: Over the last year, we intensified our diversity efforts, and we managed to achieve progress in several areas. At first, we revised our DEI Policy, describing INNIO’s commitment to diversity and inclusion and specifying our areas of focus, ob-jectives, and key activities. The DEI Committee also developed a comprehensive DEI action plan with the priority of further expanding and strengthening our data efforts by conducting an extensive DEI data selection process and analysis across the INNIO Group. We plan to focus our efforts on female and national diverse attraction, retention, and development. For data collection and processing, INNIO acts in alignment with the EU’s GDPR data protection law, which forbids the data collection of sensitive information such as race and ethnicity, complicating our DEI efforts. Some of the activities of the action plan are described below.
“Sustainability is not just a corporate responsibility but also an individual responsibility; …”
Kishore Paluri VP Transformation, INNIO Waukesha
“Sustainability means maintaining the delicate balance of
our ecosystem by preserving our Earth’s biosphere while
fulfilling the needs of our fast-growing human population.
Sustainability is not just a corporate responsibility but also
an individual responsibility; it is not a one-off activity but
a way of life that requires commitment from every indivi-
dual. I am thrilled to be part of INNIO, which emphasizes
sustainability in all of our business decisions. INNIO is
clearly an industry leader when it comes to innovative
products that generate significantly lower gas emissions
while supporting the ever-growing energy demands
of the world.”
74 75TABLE OF CONTENTS

RACE DEMOGRAPHICS FOR NORTH AMERICA
PROGRESS AND PERFORMANCE RESPONSIBLE OPERATIONS AND SOCIAL RESPONSIBILITY RESPONSIBLE OPERATIONS AND SOCIAL RESPONSIBILITYPROGRESS AND PERFORMANCE
According to Table 8, the percentages of INNIO’s total number of employees by gender and region remained the same. In 2021, INNIO’s total number of employees surged by 8% in comparison to 2020
PERCENTAGE OF TOTAL NUMBER OF EMPLOYEES by gender, age group, and region for 2021 and 2020
2021 2020
Gender Male 83% 83%
Female 17% 17%
Age Group < 30 years 19% 20%
30-50 years 60% 60%
> 50 years 21% 20%
Region Europe 82% 82%
Americas 16% 16%
Other 2% 2%
Table 8
CH4 * GWP [MTpy]
CO2 [MTpy]
49.9%
32.9%
8.3%
6.3%1.8%
0.7%0.2% White
Declined
Asian
Latino
Black
2 or more
Native
CH4 * GWP [MTpy]
CO2 [MTpy]
49.9%
32.9%
8.3%
6.3%1.8%
0.7%0.2% White
Declined
Asian
Latino
Black
2 or more
Native
Graph 13 Figure 13
with the additions of the Energas/EPS group of companies in Germany and the ECI Distribution/PowerUp group in Austria.
In 2021, INNIO initiated a voluntary self-identification program in North America, with which employees provided information about their race. About 67% of employees in the U.S. and Canada participated in the program. As illustrated in Graph 13, most participants are White, while the other participants are of Latino, Asian, African American, Indigenous, or more than one origin.
In 2020 and 2021, gender diversity in corporate functions was at 45%, with some functions being above 50%. Although gender diversity within the industrial functions such as operations was below 20%, we focus on nationality diversity profile within these functions to reflect our customer base. Over-all, INNIO employs 76 nationalities.
– Establishment of functional goals– INNIO diversity week incl. leadership engagement roundtable– Establishment of employee roundtable– Group wide study for gender pay equity– Introducing mentoring program– Thoughtful inclusion of under-representatives workgroups of any people initiatives– Girls day
– Publicly communicated our diversity goals – Dedicated managerial position for DEI– Americas wide study for gender pay equality– Established DEI Committee– DEI Policy available to the public– Set a Diversity Action Plan to foster D&I across company– Gender pay gap analysis and public reporting– Followed a DEI data-driven approach– Representation of women across the company at 17% & at 45% in corporate functions
– Adopted a flexible work policy for all employees– Began company-wide consistent approach to diversity as a business imperative
2017
– Eliminated bias from the hiring process through “Bias Blocker”20
19
– Released DEI data to the public– Introduced the “Talent Development Journey” program– Offered unconscious bias training with 82% completion rate
2020
2021
2022
– CEO comitted to D&I– Hosted the Girls Day Program20
18MILESTONES OF INNIO’S DIVERSITY, EQUITY & INCLUSION JOURNEY
~ 23% BLUE COLLAR
~ 67% WHITE COLLAR
10% MANAGEMENT
37COUNTRIES
53LOCATIONS
1%
~ 4,000EMPLOYEES
23 Data limited to Austrian employees
45% GENDER DIVERSITY
IN CORPORATE FUNCTIONS
76 77TABLE OF CONTENTS
76NATIONALITIES EMPLOYEES23

GLOBAL % OF MEN AND WOMENWHO RECEIVED A BONUS IN 2021
INNIO will continue working towards DEI goals and ambitions to improve by 25% across different areas of the company and diversity categories through 2025. We will pursue specific diversity objectives, closely aligned with functions and opportunity to create meaningful impact to the entire organiza-tion, the ecosystem, and our stakeholders. We will focus on distinct employee groups and diversity di-mensions (age, gender, nationality, and minorities) when implementing diversity initiatives. In line with the target of expanding our diversity, we will assign functional goals:
– Corporate staff functions: We aim to drive diversity to get the best talents and increase diversity levels within leadership roles.
– Regional Sales & Services teams: We strive to develop national diversity according to interna- tional business development to match our customers’ cultural diversity.
– Engineering/Research & Development: Here, we want to increase both gender and national diversity to accelerate innovation.
– Operations: In our biggest organization we pay a great deal of attention to national diversity. This gives us both a multi-national resilient work force and a way to attract candidates from various adjacent countries. We want to grow minority groups to increase the diversity of our leadership structure.
A key diversity driver will be to thoughtfully include under-represented workgroups in any people- related initiatives such as:
– Recruiting – People development (training,
coaching, mentoring) – Assignment planning – Inclusion/integration activities – Support programs related to remote work
Progress will be measured on a subset of internal effectiveness indicators for each of the above peo-ple drivers. Regular updates will be provided to the Sustainability Review Board and to the Executive Board on a quarterly basis.
PROGRESS AND PERFORMANCE RESPONSIBLE OPERATIONS AND SOCIAL RESPONSIBILITY RESPONSIBLE OPERATIONS AND SOCIAL RESPONSIBILITYPROGRESS AND PERFORMANCE
InclusionWe are accelerating efforts to ensure that each and every employee can experience INNIO as an inclusive workplace. The responsibility to prioritize inclusion involves all of us. To support this effort, we strongly encourage all employees to complete “Unconscious Bias” training on an annual basis.
At the end of 2021, we also introduced monthly group roundtables, which we believe is an effective and efficient method for improving employee engagement and inclusion. These small, cross- functional group conversations provide direct exposure to and interaction with key influential senior leaders and facilitate an open discussion.
Finally, we encourage our employees and associates to SPEAK UP! anytime they are aware of potential violations or possible business risks or critical issues. Our SPEAK UP! platform provides multiple channels, some of which are fully anon-ymous, to report risks and concerns without fear of retaliation. When incidents of discrimination are reported, our Compliance team works to assess the nature of the claim and strives to always take appropriate action in response, whenever merited. For 2021, INNIO has not faced any discrimination or harassment cases.
Pay Gap AnalysisWe believe that to intensify our diversity and in-clusion efforts and be able to achieve our internal and external goals, conducting a pay gap analysis by gender or race is key. For this reason, we con-ducted a thorough pay gap assessment, and we voluntarily report on our results.
In 2021, our annual compensation review was ex-tended to include a pay equity analysis. For the first time, the analysis was performed with all employees in the U.S. and Canada, across gender and race categories. The analysis was conducted for salaries, without taking into consideration bonuses, since they are equal for all eligible employees.
Although the analysis did not reveal any signif-icant gender pay gaps, it enabled us to adjust the compensation for a few individuals to close gaps identified within a competitive range. The data is presented in Table 9 for unadjusted24 gender pay gap figures. This means that these figures present the average differences in pay without adjusting for various factors such as type of occupation, ed-ucation, and experience that influence the pay gap.
Overall, the pay gap ranges between 4% and 11% for Levels 2 through 6. The main driver for the pay gap is the high tenure of highly experienced male employees at the top of each hierarchy level. A more significant gap of 34% is identified in the “Other” classification. This group includes hourly, office administrative roles and highly tenured, man-ufacturing, and engineering lab technician roles. Since the result was such, we conducted a deeper compensation review for every sub-group of this category. The review did not reveal any gender pay gaps.
Overall, we know that closing the gender pay gap requires time and continuous diligence and data analysis. We are determined to continue this process and expand it for the entire organization. We aim to report on our results periodically and close the gender pay gap as appropriate. Making progress requires commitments from many different angles. INNIO’s DEI Committee aims to accelerate improvement and regularly reports to the Executive Board about this topic.
GENDER BASE PAY GAP25
per management level for 2021 of employees located in the U.S. & Canada
Level 1 –
Level 2 11.6%
Level 3 6.68%
Level 4 7.57%
Level 5 6.5%
Level 6 4.59%
GLOBAL PROPORTION OF MEN AND WOMEN PER ORGANIZATION LEVEL
Men Women
Level 1 100% 0%
Level 2 89% 11%
Level 3 89% 11%
Level 4 83% 17%
Level 5 66% 34%
Level 6 59% 41%
25 The difference between the base pay rate for all men and the base pay rate for all women per organizational level.
24 Unadjusted US benchmark is 0.80
Table 9
Table 10
Figure 14
45%OF MEN
41%OF WOMEN
INNIO operates in the machinery engineering sector with a focus on Science, Technology, Engi-neering and Math (STEM), and our industry generally does not demonstrate high gender diversity. We continue to invest in partnerships with universities that can help bring more individuals from a diverse candidate pool to INNIO. We support women in technical training at the early pre-professional stage, providing intense education and industry- ready skills. Women made up 8% of the people in INNIO’s technical skills-related apprenticeship programs in 2021. This was highly influenced by the gap of cancelled promotional events during the COVID-19 pandemic.
Finally, as part of our overall sustainability strat-egy, INNIO aims to achieve greater diversity at the management level. We support increasing the pro-portion of women in senior management positions through a range of initiatives, such as mentoring, succession planning, or specific trainings, as well as initiatives to increase work-life flexibility. Diversity in managerial roles was at 12% in 2021.
78 79TABLE OF CONTENTS

TOTAL EMPLOYEE TURNOVER RATE
NEW HIRES
RecruitmentTo ensure our recruitment practices reflect our commitment to promoting equal opportunities for everyone, we pay close attention at every step of our hiring process. The first step we follow is to re-duce bias in our job descriptions. For every new job opening, we make sure we check the description for biased language. We use gender neutral pronouns, we avoid gender-charged words, and we keep the number of job requirements concise because that could bias a candidate against applying.
by gender, age group, and region for 2021 and 2020
2021 2020
Gender Male 79% 74%
Female 21% 26%
Age Group < 30 years 37% 27%
30-50 years 50% 63%
> 50 years 13% 10%
Region Europe 64% 67%
Americas 35% 30%
Other 1% 3%
Table 11
PROGRESS AND PERFORMANCE RESPONSIBLE OPERATIONS AND SOCIAL RESPONSIBILITY RESPONSIBLE OPERATIONS AND SOCIAL RESPONSIBILITYPROGRESS AND PERFORMANCE
To ensure talent mobility and long-term growth, we believe that a natural employee turnover rate should not exceed 5%-10%, not considering external factors such as economical shifts, international business factors, or unforeseen regional or global events that impact the business environment. One of our long-term ambitions, then, is to keep the annual employee turnover rate under 10%. Accord-ing to Table 12, the Group’s total employee turnover
rate in 2021 was at 10%, which is in line with what we believe to be a healthy turnover rate. In 2020, the rate was at 16%, driven by several factors such as efforts to optimize and scale the business post M&A separation from a large industrial conglom-erate—including business needs calibration, shifts in geographical business segmentation, presence and streamlining of corporate oversight—together with market conditions such as COVID-19.
by gender, age group, and region for 2021 and 2020
2021 2020
Total 10% 16%
Gender Male 76% 81%
Female 24% 19%
Age Group < 30 years 20% 17%
30-50 years 57% 45%
> 50 years 23% 38%
Region Europe 72% 42%
Americas 26% 57%
Other 2% 1%
Table 12
Table 11 details a slight change between 2020 and 2021 in terms of gender across new employee hires. In particular, the new female hires proportion decreased but still remains more than 20% (higher than the total company population). With an increase of age clus-ters below 30 years and above 50 we were able to improve our age diversity. Turning to the regions, our global footprint increased as the number of new hires in the Americas region increased to 35% (+5% points).
Employee retention and promotionAt INNIO, we work hard not only to attract the best talent but also to retain it. We hire people who are passionate about providing innovative solutions, and
To enable career development in all hierarchy levels, INNIO follows a “connection opportunities” strategy. That is to say, we make sure we provide opportunities for different people to work together. We connect people from different hierarchy levels and various departments and team them together for various projects. We also offer rotational possi-bilities, allowing individuals to gravitate towards the right positions and reducing turnover rates. In 2021, approximately 30% of vacancies were filled through internal transfers. In this way, we make sure we create opportunities for individuals to connect with other employees, gain valuable experience, and work with a variety of people, allowing them to expand their network. INNIO will continue to strive to fulfill internal
Finally, we make sure we advertise our job open-ings in a broad range of platforms, easily accessible to everyone.
Additionally, we have the option to use the Bias Blocker tool. When we receive a curriculum vitae (CV), the tool can redact from the resume information such as gender, race/nationality, name of the univer-sity, and others, while only keeping the most relevant information. We also train our HR recruiting team and hiring managers against unconscious bias.
once they are here, we want them to stay. We believe people thrive when their perspectives are valued, their work has a purpose, and they have opportuni-ties to grow. For this reason, we make sure we provide challenging and meaningful work to our employees. At INNIO, employee development opportunities and succession processes are based on merit. This means that we have a clear structured promotion path as well as a pipeline of promotion-eligible candidates, and this process is communicated to all employees. In this way, we aim to increase trans-parency, create continuity, increase morale, and offer motivation to people looking to move up in the organization.
transfers and promotions to meet rising demands for organizational growth but also a need for personal career development.
As part of our employee retention processes, we also provide training and development programs for underrepresented groups across the company to help them expand their skills. One example is INNIO’s “Talent Development Journey” program. The program’s purpose is to help participants define their ambitions and future professional path through a mix of individual coaching and guidance, inspirational speeches from INNIO’s top leadership team, group workshops, and emotional support. We also portrait the stories off the individuals we support to improve our systems and practices.
80 81TABLE OF CONTENTS

100%
173
8 5 9
323
62
100%
40%
2021 2020 2019
Number of work-related injuries in operations
Number of work-related injuries in services
Rate of recordable work-related injuries
Number of suppliers assessed for environmental topics
Number of suppliers identified as having significant actual or potential negative environmental impacts
Percentage (%) of new suppliers that were screenedusing environmental criteria
0.75
1510
26
812
53
1.87
1.12
2021 2020 2019
100%
173
8 6 7
323
62
100%
40%
Number of suppliers assessed for social topics
Number of suppliers identified as having significant actual or potential negative social impacts
Percentage (%) of new suppliers that were screenedusing social criteria
2021 2020 2019
HISTORICAL INCIDENTS
ENVIRONMENT, HEALTH & SAFETY MANAGEMENT ASPECTS
As illustrated in Figure 16, the EHS industrial field service division supports the leadership and EHS team in setting annual EHS goals and objectives, implements risk inspections and regular safety observation visits and walk throughs to the pro-duction facilities, and ensures that all workers and contractors adhere to INNIO’s EHS guidelines and regulations.
Finally, all departments and employees are required to be familiar with INNIO’s Health & Safety policy, implement the health- and safety-related activities described in INNIO’s EHS guidelines, work in a safety-conscious manner, and always immediately report incidents, accidents, and unsafe conditions through a dedicated hotline to the EHS representative.
HEALTH & SAFETYWhy it matters to us: High health & safety standards are a paramount prerequisites and responsibility we must meet to protect the security of all who interact with INNIO and ensure everyone returns home safely every day.
Our aspiration: Our employees do work that matters. For this reason INNIO has been seeking to create a strong corporate culture where employees are fully engaged and committed to making INNIO a healthier and safer place to work. Our health & safety goal of zero serious injuries and zero fatalities for all our employees and contractors is embedded in our group-wide Health & Safety Policy. To achieve this goal, a strong gover-nance system as well as proactive risk management are needed.
Key performance indicator: Rate of work-related injuries
Responsibility within INNIO: VP Operations & EHS managers—Operations Department; the Environment, Health & Safety (EHS) Committee
Management approach: Leadership responsibility for health & safety is as-signed to the Executive Board and the functional ex-ecutive leaders of the organization. The Environment, Health & Safety (EHS) Committee, chaired by INNIO’s site leaders and VP Operations, reports to the Exec-utive Board on a quarterly basis, providing updates about EHS performance indicators, the implemen-tation of EHS risk assessment and management, emergency preparedness, and our EHS programs and trainings.
INNIO’s VP Operations and our dedicated EHS department is responsible for supporting the imple-mentation, maintenance, and continuous improve-ment of the EHS management system through policies, targets, continuous EHS performance reviews, and improvement actions. The EHS staff ensures that the Health & Safety policy and EHS guidelines are shared with all employees, workers, contractors, and external stakeholders, and the staff
conducts regular internal EHS audits. The team also supports the implementation of annual, mandatory training programs for all employees, contractors, and other relevant parties.
Certified with ISO 45001, INNIO’s health & safety management approach includes employees and contractors as well as process safety procedures, internal audits, and dedicated, thorough and man-datory health & safety trainings and emergency preparedness simulations.
Progress and status: As illustrated in Table 13, for many consecutive years, fatalities remained zero. Furthermore, according to Graph 14, in 2021, the rate of recordable work-related injuries was 0.7526. Those 25 recordable work-related injuries were minor, without implications or, in some cases, resulting only in some days of medical leave.
ENVIRONMENT,HEALTH & SAFETY
DOCHECK
AUDIT & MANAGEMENTEVALUATION
ORGANIZATION, PERSONNEL &
SAFETY CULTURE
LEADERSHIP & RESPONSIBILITIES
INFORMATION COMMUNICATING
& SHARING
SUPPLIER MANAGEMENT
ENGINEERING & PROJECT
MANAGEMENT
OPERATIONS & PERFORMANCE MANAGEMENT
RISK ASSESS-MENT & RISK
MANAGEMENT
IMPLEMENTATION
CRISIS & EMERGENCY
MANAGEMENT
ACCIDENTMANAGEMENT
26 The rate of recordable work-related injuries was calculated as such: (Number of recordable work-related injuries/Number of hours worked) * 200,000. The number of hours worked was calculated as such: 38.5 working hours per week * (52 weeks in one year—5 weeks of holidays). The 38.5 working hours per week is based on our sector-specific collective agreements. The full-time equivalent (FTE) in 2021 was 3,689.
PROGRESS AND PERFORMANCE RESPONSIBLE OPERATIONS AND SOCIAL RESPONSIBILITY RESPONSIBLE OPERATIONS AND SOCIAL RESPONSIBILITYPROGRESS AND PERFORMANCE
Graph 14
Figure 15
HISTORICAL HEALTH & SAFETY DATA
Table 13
We adhere to the highest standards to provide our employees and contractors a safe workplace, and we implement mitigation measures to prevent ac-cidents. For this reason, all of our production sites have been certified to ISO 45001, covering 100% of our factory workers. Incidents, hazards, EHS internal audits, and findings are reported and tracked in a health & safety tool that helps us find the causes of incidents and implement suitable measures to prevent their reoccurrence. We regularly review, evaluate, and monitor the health & safety mitiga-
100%
173
8 5 9
323
62
100%
40%
2021 2020 2019
Number of work-related injuries in operations
Number of work-related injuries in services
Rate of recordable work-related injuries
Number of suppliers assessed for environmental topics
Number of suppliers identified as having significant actual or potential negative environmental impacts
Percentage (%) of new suppliers that were screenedusing environmental criteria
0.75
1510
26
812
53
1.87
1.12
2021 2020 2019
100%
173
8 6 7
323
62
100%
40%
Number of suppliers assessed for social topics
Number of suppliers identified as having significant actual or potential negative social impacts
Percentage (%) of new suppliers that were screenedusing social criteria
2021 2020 2019
tion measures. Health & safety risks are incorpo-rated into our overall enterprise risk management process and are directly reviewed by the top management of the company.
Our Executive Board exhibits strong leadership and commitment to this goal. ININO’s EHS manage-ment acts according to the Plan-Do-Check-Act cycle that enables us to improve our EHS perfor-mance through visible active leadership (Figure 15).
82 83TABLE OF CONTENTS
2021 2020 2019
Number & rate of fatalities as a result of work-related injury 0 0 0
Number of fatalities as a resultof work-related ill health 0 0 0
Number & rate of high- consequence work-related injuries (excluding fatalities)
0 0 0
Rate of high-consequence work-related injuries (excluding fatalities)
0 0 0

PROCESS SAFETY MANAGEMENT
The hotline is proactively communicated to all employees, contractors, and site visitors through a dedicated training as well as through posters around our facilities, and it is included on the employee/visitor ID card.
Employees also are encouraged to provide sug-gestions that could improve INNIO’s EHS system in our INNIOvative platform. We select these suggestions for improvements submitted by employees or contrac-tors and implement the most relevant. Additionally, all employees and contractors are trained on the EHS policy, guidelines, and their responsibilities, and they also participate in regular awareness programs, workshops, online sessions, and emergency simula-tions such as building evacuation.
EMERGENCY PLANNING &
RESPONSE
PROCESS TECHNOLOGY
AUDITING
INCIDENT INVESTIGATION & REPORTING
PROCESS HAZARDS ANALYSIS
MANAGEMENT OF CHANGE
OPERATING PROCEDURES &
SAFE PRACTICES
TRAINING & PERFORMANCE
MECHANICAL INTEGRITY
PERSONNEL SAFETY &
PERFORMANCE
QUALITY ASSURANCE
SAFETY REVIEWS
MANAGEMENT, LEADERSHIP &COMMITMENT
TECHNOLOGY
EMPLOYEES &
CO
NTR
ACTO
RS
FACILITIES
Emergency Planning & Response
Process Technology
Auditing
Incident Investigation & Reporting
Process Hazards Analysis
Management of Change
Operating Procedures & Safe Practices
Training & Performance
Mechanical Integrity
Personnel Safety &
Performance
Quality Assurance
Safety Reviews
Management of Change
MANAGEMENT, LEADERSHIP &COMMITMENT
TECHNOLOGY
EMPLOYEES
& C
ON
TRAC
TORS
FACILITIES
27 Fourteen elected members representing employees and fourteen elected members representing workers28 The works committee includes the following committees: Occupational Safety Committee, Working Hours Committee, Data Protection Committee, Canteen Committee, Nafing Committee, Transporter Committee, Events Committee, Economic Committee
INNIO’S INTERNAL CONTROL FOR HEALTH & SAFETY
INNIO’S EXECUTIVE BOARD
EHS COMMITTEEOversees overall EHS management
CORPORATE EHS DEPARTMENT– Establishes policies, targets, and plans according to international standards & regulations– Ensures the continual improvement of the EHS management system– Undertakes leadership audits – Supports the implementation of EHS trainings– Holds safety and health discussions with external stakeholders– Communicates proactively with EHS policy and EHS guidelines to all relevant stakeholders
EHS INDUSTRIAL FIELD SERVICE TEAM– Promotes health- & safety-related activities– Performs workplace risk inspection– Supports annual EHS goals and objectives – Undertakes regular safety observation visits and EHS walk throughs
ALL DEPARTMENTS– Implement the H&S related activities described in INNIO’s EHS guidelines– Report incidents, accidents, and unsafe conditions immediately to the EHS representative– Participate in mandatory annual EHS trainings and events (incl. emergency preparedness & building evacuation simulations)
Figure 16
Figure 17
PROGRESS AND PERFORMANCE RESPONSIBLE OPERATIONS AND SOCIAL RESPONSIBILITY RESPONSIBLE OPERATIONS AND SOCIAL RESPONSIBILITYPROGRESS AND PERFORMANCE
Health & Safety Initiatives
Employees’ Health & Safety committeeFor INNIO Jenbacher, the employees’ works com-mittee acts independently, represents the interests of the workforce (employees and workers), has the right to maintain dialogue with management, and provides consultation about economic, social, health, and cultural matters. Composed of 2827 members, the committee meets monthly. Part of the works committee28 is the occupational safety committee.
Furthermore, the INNIO Waukesha joint Health & Safety committee acts as an advisory body whose function is to promote the maintenance of a safe work environment that enhances the health, safety, and well-being of all employees. Some of the objectives of the committee are to evaluate and recommend strategies that will prevent or resolve workplace health & safety concerns as well as to provide ongoing dialogue between senior management and employees on health & safety issues. The committee is composed of 15 members, three management and 12 workers representing their team. Every worker member is chosen through an election process, annually, within their own team. Committee members meet on a monthly basis and occasionally at other times as recommended by the committee.
Safety and security training for all Jenbach site visitorsINNIO provides an advanced electronic check-in system that helps us ensure the security of visitors. In this next-generation entry protocol, visitors to INNIO’s headquarters must complete an interactive safety and security training and pass a quiz before being granted a photo ID visitor’s badge. This security and safety course is accessible in 11 languages.
Health MattersTo promote health and well-being among our employees, INNIO’s U.S. team provides a workplace wellness program, Health Matters. The Health Matters program provides up-to-date resources and forums that promote a healthful work environment and support the adoption of healthy habits by employees who want to improve their mental and physical health.
Health We CareAnalogous to the Health Matters program in the U.S and Canada, the Health We Care initiative is
designed to support and motivate employees to live healthier lives through healthy leadership, individual or team sporting activities, health prevention, healthy nutrition, and mindfulness. The initiative also provides employees with information about trends in work-place health through dedicated digital newsletters.
Process SafetyOne integral part of the Group’s overall EHS manage-ment is process safety management. Our process management guidelines and procedures are ISO 9001 certified (quality management).
As illustrated in Figure 17, INNIO’s process safety management covers areas that enable us to eliminate risks and near misses. Our process safety management is set in accordance with
international and local regulations, standards, and requirements. Employees and contractors are regularly trained and must pass an exam about our process management.
84 85TABLE OF CONTENTS

COMMUNITY AND SOCIAL ENGAGEMENT
2022 GOALS
AREAS OF FOCUS
EDUCATIONAL SUPPORT
– Donation to the United Way Campaign– Sponsorships to local public schools– Gold sponsor of Waukesha Education Foundation– Tutoring programs for young children and refugees– 1,000+ employee community service hours, icluding classroom, facilities and grounds cleanup
ENVIRONMENTAL SUPPORT
– Spring and fall community cleanup– Earth day cleanup in Welland– Provision of the thermal energy generated during our production activities to a swimming pool in the town of Jenbach
INDIVIDUAL SUPPORT
– Donations dedicated to support of local families who were impacted by the Christmas parade tragedy– Sponsorship in Waukesha Unlocked— 125th Anniversary of the City of Waukesha – Sponsored public cookout for the Waukesha community– Key event sponsor of Waukesha Octoberfest– Key sponsor for the Annual Waukesha County Gala– Food donation to disadvantaged groups
LOCAL BUSINESS SUPPORT
– Partnerships with local businesses for community support– Procurement of goods and services for INNIO’s corporate events and growth
MEDICAL SUPPORT
– Sponsor of CF Foundation in Austria– Dedicated COVID-19 vaccination buses– Provision of medical support by INNIO employees through blood or cell donations– Fundraising for medical support by INNIO Volunteers– Sponsor of American Red Cross blood drives
We plan to formalize INNIO’s efforts with the formation of a company-wide engagement initiative, including representation from all employee groups.
The initiative will function in an advisory capacity and seek input from all employees as we plan, schedule, and promote events, driving inclusion, engagement, and impact.
GOALS
LIVE OUR VALUES
DEMONSTRATE OUR COMMITMENT
TO THE COMMUNITY BEYOND CORPORATE
CITIZENSHIP
DRIVE ESPRIT DE CORPS
ENHANCE EMPLOYEE ENGAGEMENT
€ ~ 40,000Donations
through INNIO’svolunteers
The fundamental components of process safety management include our principles of inherent safety and management processes, a coherent approach to risk management, proactive com-munication to employees and contractors of the hazard management process, the assurance of competent and adequate resources, mainte-nance and verification of critical safety measures, internal and external audits, investigation and analysis of incidents, and continuous improvement through regularly updated plans.
Our factory employees work with large equip-ment that, if not properly handled, potentially could lead to (serious) process incidents and even fatalities. For this reason, we have robust emergency management plans in place, and we implement comprehensive measures to ensure process safety. Process safety risks are assessed through a variety of process hazard assessments including quantitative risk assessments according to international and local regulations and stan-dards. We have dedicated persons who lead process safety management and are in direct contact with the EHS division.
COMMUNITY ENGAGEMENT
Why it matters to us: INNIO plays a vital role in the communities where we operate. Our community engage- ment approach aims to ensure we are “good neighbors” by supporting the communities who live alongside and work with us while positively contributing to society’s progress overall. Through our volunteer network, we support organized employee events in the communities in which we work and reside with a special focus on education and skill building, environment, health, and financial stability.
Our aspiration: Our goals about community engagement are clear. At every action, we aim to implement our core values, strengthen our corporate culture, and drive “esprit de corps.” While doing this, we believe employee engagement can further be increased. As illustrated on the next page, INNIO’s employee out-reach efforts can be categorized in five areas that are seen as critical to building strong communities.
Key performance indicator: Charitable donations (in €) from “INNIO Volunteers”
Responsibility within INNIO: VPs of Operations, “INNIO Volunteers”, VP Communications
Management approach: We believe that giving back to the communities is critical to our success. In our community en-gagement goals, we incorporate our corporate values, and we aim to drive the esprit de corps. Through “INNIO Volunteers,” INNIO emphasizes our philanthropic efforts in five focus areas of support: educational, individual, environmental, local busi-ness, and medical. Our short-term plans include the creation of an official, company-wide Engage-ment Committee that will further help enhance our community engagement efforts.
Progress and status: In 2021, about 40,000 EUR donations were made through “INNIO Volunteers.” In 2022, we plan to formalize INNIO’s efforts with the formation of a company-wide engagement initiative, including representation from all employee groups. The initiative will function in an advisory capacity and seek input from all employees as we plan, schedule and promote events to drive inclusion, engagement, and impact.
Figure 18
PROGRESS AND PERFORMANCE RESPONSIBLE OPERATIONS AND SOCIAL RESPONSIBILITY RESPONSIBLE OPERATIONS AND SOCIAL RESPONSIBILITYPROGRESS AND PERFORMANCE86 87TABLE OF CONTENTS

ETHICAL AND TRANSPARENT BUSINESS
Why it matters to us:A cornerstone of INNIO’s compliance culture is a focus on integrity in all we do, including our respon-sibility for our actions around business conduct, prevention of fraud or corruption, protection of human rights, compliance with labor and em-ployment laws, and international trade controls. As a signatory of the UN Global Compact, we act in accordance with the highest ethical standards on an international level in all places we operate, and we aim to contribute to the UN’s 2030 Sustain-able Development Goals through our global activ-ities. Furthermore, we regularly review our business continuity and emergency preparedness plans, as well as our cybersecurity framework, to prepare for unforeseen circumstances.
Our aspiration: Commitment to the highest ethical standards is embedded at all levels of the company and applies to all employees and business partners. We are committed to continuously improve the way we do business.
Key performance indicator: Prevention of fines and non-monetary sanctions for non-compliance with laws and/or regulations
Responsibility within INNIO:General Counsel and Chief Compliance Officer & Group Head of Compliance—Legal & ComplianceDepartment
Management approach: INNIO’s Code of Conduct (CoC) explains what con-duct is expected of all employees and the potential consequences if they do not adhere to it. Through our comprehensive rules and systems, as well as systematic corporate strategic and emergency preparedness plans, we organize operational, risk management, reporting and financial processes to ensure that the Executive Board and INNIO’s shareholders are updated continually. Finally, we make sure we constantly communicate with our stakeholder groups, and we take their views into consideration for our business decisions.
Progress and status: In 2021, we formulated INNIO’s Labor & Human Rights Policy and a human rights framework to ensure comprehensive human rights actions.
INNIO’s mandatory online training courses include topics such as ethics and anti-corruption, avoidance, and reporting of conflicts of interest, data privacy, and personal data protection, among others. In 2021, the completion rate of these trainings reached approximately 95% of all INNIO employees.
INNIO’s strong security management system enabled us to avoid security incidents in 2021.
In 2021, INNIO had zero fines and non-monetary sanctions for non-compliance.
Code of ConductINNIO’s Code of Conduct provides to all of our in-ternal and external stakeholders a framework and description of ethical and compliance standards, rules, and regulations, as well as actions around business conduct.
This chapter covers the material topic of business ethics.
The Code of Conduct applies to all employees, regardless of their level of position in the company, and it is available on INNIO’s website and intranet in English, German, and other languages. It is important to us that employees internalize these rules and values. For this reason, all employees are required to complete annual mandatory compliance trainings. These trainings enable our employees to familiarize themselves with all as-pects of compliance and the general principles of conduct that apply in day-to-day business. Every new and existing employee must complete these trainings and subsequently refresh their knowledge on an annual basis.
Monitoring and review of compliance proceduresINNIO’s established Compliance Management System (CMS) enables us to manage compliance within the organization. Consisting of an integrated system of documents, processes, tools, controls, and functions, the CMS helps us better address risk management by assuring that our policies and procedures adhere to the requirements of applicable laws and regulations. It also enables us to address our culture of compliance which includes goals, risk identification, program, organization, training, communication, continuous monitoring, and corrective actions. At INNIO we make sure that our employees know their responsibilities for compliance and that compliance requirements are integrated into our business processes. We conduct periodic reviews to evaluate the effectiveness of the CMS. These reviews can include internal or external audits to deter, detect, and investigate bribery and other non-compliant behavior, risk assessment processes, and effectiveness testing. We report and provide periodic updates of the findings of these reviews to our Executive Board members, who ultimately are responsible for the management and improvement of our CMS.
Ethics management and complianceEthics, integrity, and compliance conduct are the foundation of our business. Compliance is not an option but a vital element that helps the company run safely and with integrity while maintaining a best-in-class reputation. INNIO has zero tolerance and strictly prohibits any behavior with regards to bribery, fraud, extortion, misuse, or misappropria-tion of our assets or impairment of the company’s interest for personal gain. Based on this policy, the company aims to detect any potential violations of our business conduct from an early stage. When such incidents are confirmed, the company deter-mines the appropriate organizational measures or sanctions for the individuals involved. We only con-duct business with partners who share the same understanding of and commitment to our ethical standards. The Group’s Compliance organization assesses that internal policies and standards are aligned with regulatory changes.
Compliance trainingINNIO has established a comprehensive CMS withmandatory trainings. To raise employee aware-ness of ethics and compliance as well as INNIO’s Code of Conduct, we provide a variety of annual mandatory training courses, available in INNIO’s learning platform, for all employees. Through posters located at our facilities, guidelines, FAQs on regulatory compliance on the Company’s intranet, and internal email distributions, INNIO helps ensure that all employees have timely access to new information on regulations and a deeply ingrained awareness of various issues.
88 89TABLE OF CONTENTSPROGRESS AND PERFORMANCE ETHICAL AND TRANSPARENT BUSINESS ETHICAL AND TRANSPARENT BUSINESSPROGRESS AND PERFORMANCE

Corruption preventionBefore we engage with new business partners, INNIO conducts exhaustive due diligence assess-ments. Such assessments involve the potential business partner and its direct and indirect share-holders, investors, and directly or indirectly involved legal entities. For this reason INNIO performs checks on counterparties to obtain information focused on corruption, money laundering, other criminal conduct, and related sanctions as per the Group’s standardized know-your-customer (KYC) and know-your-supplier (KYS) process. Key red flags are connections to government officials and companies referred to in high-attention media reports related to political and corruption cases, sanctioned entities, or any other suspected in-volvement in criminal conduct.
Whistleblower programs—SPEAK UP!We expect from all employees who observe or become aware of potential or actual misconduct or violation of internal rules or statutory regula-tions—committed by other employees or business partners—to report these incidents in SPEAK UP!, our dedicated whistleblower platform. This platform is available to all internal and external stakeholders, since we believe that all stakeholders represent a valuable source of information that can help identify breaches of ethical standards. All stake-holders can report an incident fully anonymously, if desired, without fear of retaliation. All reports are analyzed with the utmost discretion by INNIO’s dedi-cated compliance experts, and the SPEAK UP! data is treated with the highest confidentiality.
Data protection and information securityData protection under the standards of GDPR and other applicable jurisdictions and the protection of confidential information including but not limited to proprietary business information are commitments from the INNIO Group to our stakeholders, including customers, employees, and providers of capital. The Group’s Chief Information Security Officer (CISO) and the Information Security Team together with the Legal Team and the external Data Protection Officer oversee data privacy, information secu-rity, policy formulation and implementation, risk management, and security audits. The Information Security Team together with the Legal Team meets regularly to review and resolve guidelines and
policies and carry out adequate measures. The Executive Board, which is responsible for monitoring our corporate information security and cybersecu-rity management mechanisms, receive reports and updates on a regular basis.
State-of-the-art technologies and services are used to achieve the expected high level of internal and external security. In addition, organizational measures are implemented such as annual man-datory security awareness training, data privacy trainings, and security alerts for employees as well as phishing simulations.
The Group uses numerous security tools to prevent and respond to all types of attacks and block intrusion attempts. Some of these tools include adaptive security appliances such as firewalls, anti-virus, intrusion protection and VPN capabilities, artificial intelligence systems that predict and prevent threats in real-time, and cloud and endpoint security platforms designed to help enterprise networks investigate and respond to advanced threats. Additionally, INNIO has multi- factor authentication (MFA) deployed for all employees to further prevent intrusion attempts. In relation to data privacy the Group has imple-mented a data privacy lifecycle management.
Vulnerability Review BoardThe Group has continuous vulnerability management programs in place, including scheduled vulnerability scanning and patching. These programs review systems, networks, and applications for updates that remediate security vulnerabilities. INNIO also runs a weekly vulnerability Review Board where vulnerability status across all estates is reviewed by the Board to ensure remediation is happening and to assist with any issues faced.
Tax transparencyINNIO supports tax policies and incentives that encourage enterprise innovation and foster eco-nomic growth. For this reason, the Group aims to be transparent about its tax approach disclosure. INNIO’s business activities generate a substantial amount and variety of taxes. INNIO Group pays corporate federal, state, and local income taxes, stamp duties and a variety of other taxes. In ad-dition, we collect and remit not only payroll taxes but also indirect taxes such as excise duties and VAT. The taxes we collect and pay represent a
significant part of our economic contribution to the countries in which we do business.
We are committed to always acting in com-pliance with applicable laws and regulations, be transparent in our financial reporting disclosures, and developing strong, mutually respectful rela-tionships with tax authorities based on transparency and trust.
INNIO files a country-by-country report for the Group with the Austrian tax authorities in accordance with the Sec. 3 Transfer pricing documentation act and Action 13 of OECD’S Base Erosion and Profit Shifting Action Plan. This report breaks down among others from the consolidated financial statements the annual tax payments INNIO has made in the countries in which INNIO owns a legal presence.
Public policyINNIO strives to always implement the highest stan-dards of corporate governance and transparency, gaining the trust and respect of our stakeholders. In this context, as described also in our Code of Conduct, INNIO forbids any support of—or dona-tions to—political parties.
INNIO follows or is a member of several initiatives in areas such as energy, environment, and climate change. We are determined to remain fully trans-parent about our participation in different associ-ations, and we are fully compliant with all reporting obligations and transparency requirements. INNIO’s ESG-related initiatives can be found on pages 22-23 of the report.
Respecting & promoting labor and human rightsSince the beginning of our existence, INNIO has been committed to respecting human rights across our business activities, carrying out due diligence and human rights risk assessments with our supply chain, customers, and own operation and raising awareness, promoting best practices, and empow-ering people across our value chain.
Human rights are inextricably linked to corporate values. We respect human rights as described in the Universal Declaration of Human Rights, the International Labor Organization (ILO), and other internationally recognized treaties. We commit to upholding labor rights, including decent wages, working hours, employee representation, and provi-sions against forced labor, child labor, and human trafficking. We are determined to advance these rights throughout our value chain, contributing to a more fair and inclusive future for all people.
90 91TABLE OF CONTENTSPROGRESS AND PERFORMANCE ETHICAL AND TRANSPARENT BUSINESS ETHICAL AND TRANSPARENT BUSINESSPROGRESS AND PERFORMANCE
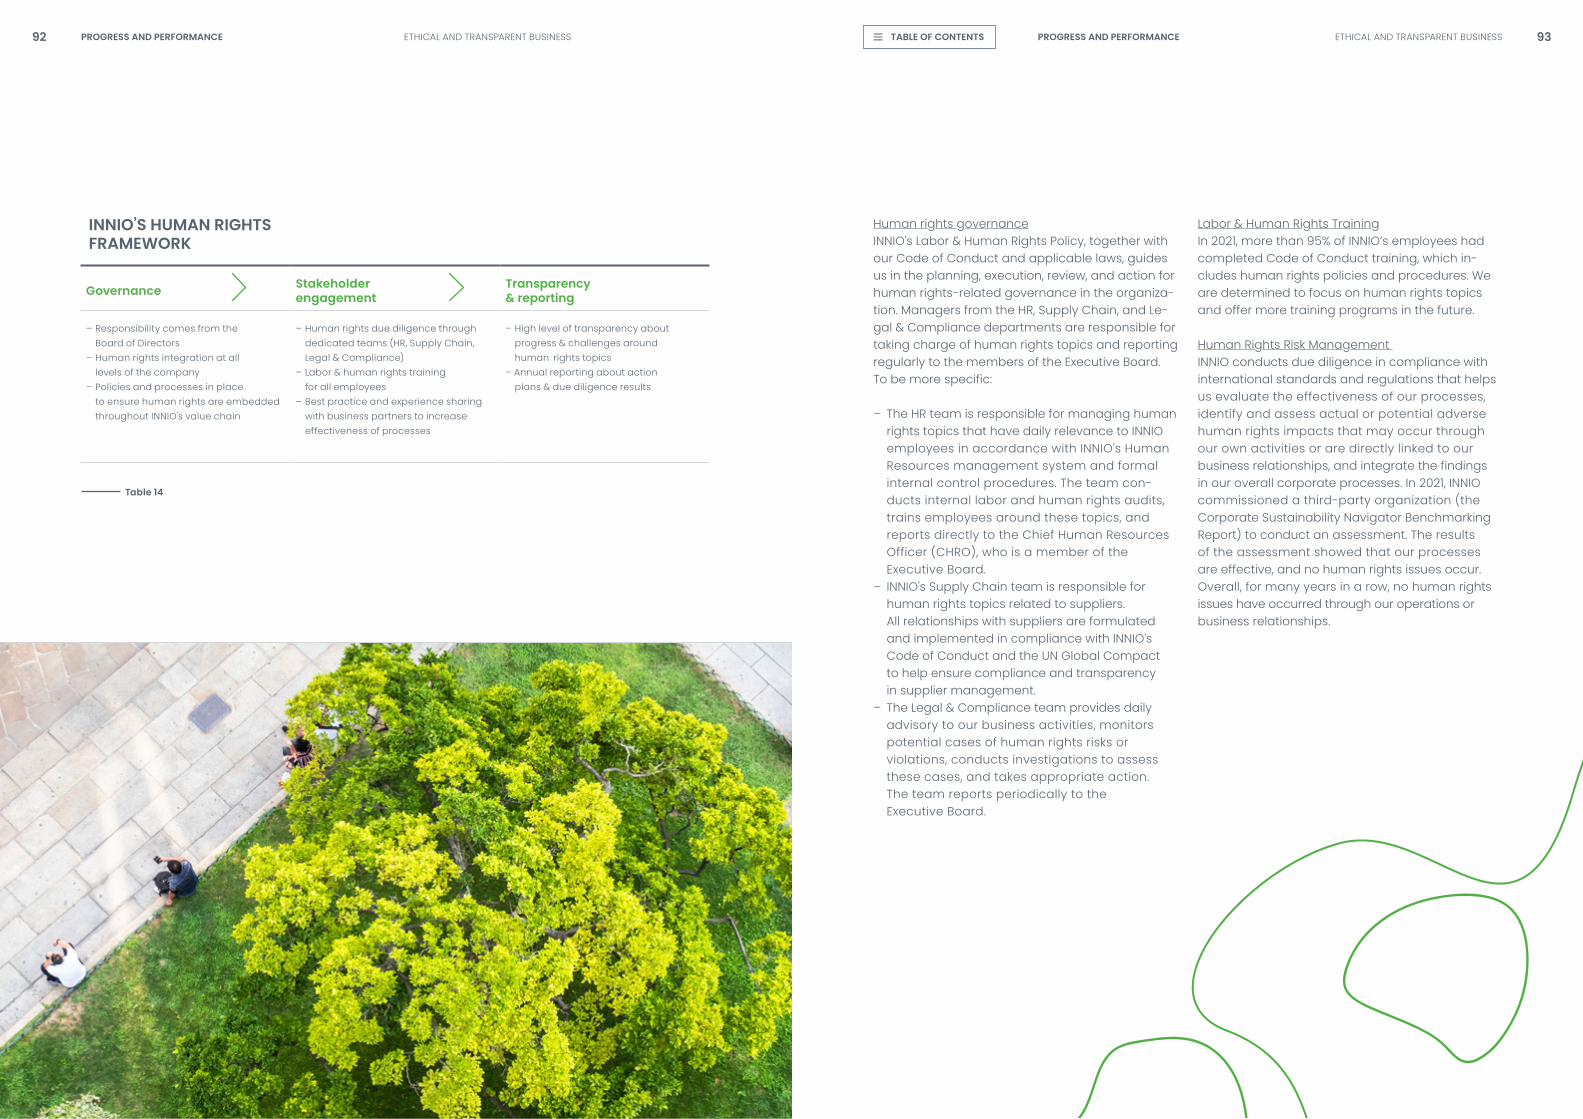
Labor & Human Rights TrainingIn 2021, more than 95% of INNIO’s employees had completed Code of Conduct training, which in-cludes human rights policies and procedures. We are determined to focus on human rights topics and offer more training programs in the future.
Human Rights Risk Management INNIO conducts due diligence in compliance with international standards and regulations that helps us evaluate the effectiveness of our processes, identify and assess actual or potential adverse human rights impacts that may occur through our own activities or are directly linked to our business relationships, and integrate the findings in our overall corporate processes. In 2021, INNIO commissioned a third-party organization (the Corporate Sustainability Navigator Benchmarking Report) to conduct an assessment. The results of the assessment showed that our processes are effective, and no human rights issues occur. Overall, for many years in a row, no human rights issues have occurred through our operations or business relationships.
Human rights governanceINNIO’s Labor & Human Rights Policy, together with our Code of Conduct and applicable laws, guides us in the planning, execution, review, and action for human rights-related governance in the organiza-tion. Managers from the HR, Supply Chain, and Le-gal & Compliance departments are responsible for taking charge of human rights topics and reporting regularly to the members of the Executive Board. To be more specific:
– The HR team is responsible for managing human rights topics that have daily relevance to INNIO employees in accordance with INNIO’s Human Resources management system and formal internal control procedures. The team con- ducts internal labor and human rights audits, trains employees around these topics, and reports directly to the Chief Human Resources Officer (CHRO), who is a member of the Executive Board.
– INNIO’s Supply Chain team is responsible for human rights topics related to suppliers. All relationships with suppliers are formulated and implemented in compliance with INNIO’s Code of Conduct and the UN Global Compact to help ensure compliance and transparency in supplier management.
– The Legal & Compliance team provides daily advisory to our business activities, monitors potential cases of human rights risks or violations, conducts investigations to assess these cases, and takes appropriate action. The team reports periodically to the Executive Board.
Governance Stakeholder engagement
Transparency & reporting
– Responsibility comes from the Board of Directors– Human rights integration at all levels of the company– Policies and processes in place to ensure human rights are embedded throughout INNIO’s value chain
– Human rights due diligence through dedicated teams (HR, Supply Chain, Legal & Compliance)– Labor & human rights training for all employees– Best practice and experience sharing with business partners to increase effectiveness of processes
– High level of transparency about progress & challenges around human rights topics– Annual reporting about action plans & due diligence results
INNIO’S HUMAN RIGHTS FRAMEWORK
92 93TABLE OF CONTENTS
Table 14
PROGRESS AND PERFORMANCE ETHICAL AND TRANSPARENT BUSINESS ETHICAL AND TRANSPARENT BUSINESSPROGRESS AND PERFORMANCE

CLIMATE CHANGE GOVERNANCE OVERVIEW
94 95TABLE OF CONTENTS
TCFD: CLIMATE RISKS AND OPPORTUNITIES
INNIO is committed to decarbonizing our own and our customers’ operations as well as reducing emissions in our supply chain through the following four approaches:
– INNIO’s Executive Board is responsible for reviewing and approving our vision and strategies for climate change.
– We help ensure strategies are realized, we implement mitigation and adaptation measures, and we provide advanced, sustainable techno- logies to enable our customers to enhance their green competitiveness.
– Climate change is incorporated into INNIO’s overall corporate risk management, including identifying the relevant climate risks and oppor- tunities and quantifying their financial impact in the future.
– We assess the severity and trends of climate change when setting performance indicators and quantitative goals. Progress and status updates towards these indicators are discussed with the Executive Board.
We are equally committed to demonstrating transparency on this journey and to be open with our stakeholders of the risks and opportunities we anticipate on the way. Therefore, as of the 2021 non-financial reporting cycle, INNIO took initial steps to seek alignment towards the Task Force on Climate-related Financial Disclosures (TCFD) Recommendations Framework, and we began adopting its disclosure recommendations. During 2021, we initiated several workstreams to create a group-wide understanding of the climate-related risks and opportunities our business could be ex-posed to, the risk mitigation processes in place, and opportunities and gaps needing more attention.
Oversight of climate-related risks and opportunitiesINNIO’s overall strategy around climate change management is under the direct supervision of the Executive Board. To be more specific, the Executive Board is responsible for overseeing the Group’s comprehensive climate change and sustainable management strategies as well as for delegat-ing responsibilities and goals regarding climate change across the company. The members of the Executive Board receive regular updates from the Sustainability Review Board (SRB) and employees authorized for climate change matters.
Climate change management responsibility The SRB is the Group’s top committee responsible for developing strategy, validating goals, and managing the ESG program, including action plans for climate change issues. As described in the Governance section, the SRB is chaired by the VP of Sustainability, and members include executive leaders, subject matter experts, and managers from various departments across the group.
The SRB is responsible for identifying climate risks and opportunities and discussing and setting INNIO’s climate change strategies and goals. The chairman of the SRB reports directly to the Execu-tive Board for updates related to the ESG program and climate change every month.
INNIO’s Risk Committee is responsible for briefing the Executive Board on the environmental factors INNIO is facing, the focus of the Group’s enterprise risk management, and risk assessment and mit-igation efforts, considering the ESG and climate change risk.
To further develop maturity of the INNIO ESG program, a cross-functional Circularity Task Force was formally established in late 2021—chaired by executive leaders of Product Line Management, Engineering, Procurement and Service Sales—which is responsible for identifying circular white spaces and extending INNIO’s circular growth strategies in line with INNIO’s ESG goals.
Figure 19
GOVERNANCEEstablish a cross-functional Sustain-ability Review Board (SRB), chaired by the Group VP Sustainability. The committee is responsible for approv-ing ESG and climate change visions, strategies, and long-term goals and promoting related actions. The chairman of the SRB reports to the Executive Board monthly.
METRICS & TARGETS– Set climate-related performance indicators and interim quantitative targets to regularly track progress and transparently disclose them to the public– Set science-aligned GHG reduction targets (incl. Scope 1, 2 & 3).
RISK MANAGEMENT– Climate risk is integrated into the Enterprise Risk Management (ERM) process. – Cross-functional cooperation is needed to assess climate- related risks and opportunities in the value chain; financial impacts must be assessed and countermeasures be formulated.
STRATEGY– Provide energy-efficient technologies to help custom- ers shape a greener future.– Promote responsible operations by adopting key mitigation technologies and increasing the use of renewable energy.– Build a resilient and low car- bon supply chain through extensive collaboration with suppliers.
Our governance of climate-related risks and opportunities
Impacts of climate-related risks and opportunities on our business
Processes we use to identify, assess, and manage climate-related risks
GOVER
NANCE
METRICS & TARGETS
STRATEGYRISK M
ANAGEMENT
The metrics and targets we use to assess and manage climate-related risks and opportunities
PROGRESS AND PERFORMANCE PROGRESS AND PERFORMANCETCFD: CLIMATE RISKS AND OPPORTUNITIES TCFD: CLIMATE RISKS AND OPPORTUNITIES

CLIMATE CHANGE GOVERNANCE AND MANAGEMENT FRAMEWORK CLIMATE RISKS & OPPORTUNITIES
SHORT-, MEDIUM-, AND LONG-TERM RISKS AND OPPORTUNITIES
96 97TABLE OF CONTENTS
Physical Risks/Opportunities
Potential Financial Impact
Key Response Strategy
– Extreme variability in weather patterns (flooding, heat waves, storms, etc.) – Rising temperature and/or extreme precipitations
– Extended periods of extreme weather events (short-term) or rising temperatures (long- term) can lead to production or sourcing disruption, leading to increased operating costs.
–/ We evaluate water stress risks for the Company’s manufacturing sites and we consider the establishment of climate change-related risk adaptive measures (Table 5, page 66)
INNIO continuously designs and invests in the development of products that are time- & energy-efficient as well as resilient to extreme weather events
– Provision of time- & energy- efficient products – Provision of emergency backup power – Increased manufacturing resilience against natural disasters
– Meeting customers’ demands for time- & energy-efficient products translate to incremental revenues – Strengthening climate resilience and lowering the risks of opera- tional disruption can lead to reduced indirect operating costs & financial losses
Transition Risks/Opportunities
Potential Financial Impact
Key Response Strategy
– Carbon taxes – Climate policies & regulations
– Energy transition policies, pollution control regulation, policies on resource conservation, and public subsidies potentially could cause restriction on manufacturing capacity expansion and increased operation costs.
–/ INNIO continuously invests in research and development of energy-efficient products that can enable our customers to comply with existing and future climate policies and regulations. INNIO is one of the first OEMs offering hydrogen-ready engines and digital solutions for real-time monitoring & performance optimization.
INNIO already has established concrete renewable energy programs, and we plan to further accelerate renewable energy development in manufacturing. INNIO energy solutions provide versatile application and flexibility of fuels for near-zero emissions. INNIO has expanded our remanufacturing programs to decrease life-cycle emissions (LCE) and use of resources. –/ INNIO promotes climate-friendly corporate actions through our products and operations and adheres to transparent disclosures of our sustainability efforts.
– Emerging technology & innovation– Digital solutions contributing to higher energy efficiency – Provision of CO2-neutral power solutions – Increase of renewable energy programs in manufacturing
– Potential decrease in revenues due to competition from energy storage innovation systems.– Incremental revenues resulting from increased demand for INNIO’s CO2-neutral power & digital MyPlant solutions.
– Market sentiment – Potential employee sentiment
– People’s awareness (incl. investors, consumers, etc.) and expectations concerning climate change are increasing, creating a shift in their behavior, preferences, and decisions. Failing to meet stakeholders’ expec- tations and perceptions of the com- pany may harm INNIO’s reputation.
– Enhanced company reputation – Attraction of best talent, reduced costs, & potentially increased revenues
PROCUREMENTDEPARTMENT
EXECUTIVE BOARD
SUSTAINABILITY REVIEW BOARD
RISK COMMITTEE CIRCULARITY TASK FORCE
OPERATIONSDEPARTMENT
ENGINEERING, R&D, SALES & PRODUCT MANAGEMENTDEPARTMENT
INNIO‘s highest decision-making committee for climate change management
Reviews and approvesclimate change risk controls
Responsible for shaping circular growth strategies
01. Extreme variability in weather patterns (flooding, heat waves, storms, etc.)02. Rising temperatures and/or extreme precipitation
01. Carbon taxes02. Climate policies & regulations03. Market sentiment04. Potential employee sentiment05. Emerging technology and innovation
01. Provision of time- and energy-efficient products02. Provision of emergency backup power 03. Digital solutions contributing to higher efficiency04. Provision of CO2-neutral power solutions05. Increase in manufacturing resilience against natural disasters06. Increase in renewable energy programs in manufacturing07. Enhanced company reputation
SHORT-TERM 1-3 YEARS
HIG
HLO
W
MEDIUM-TERM3-10 YEARS
LONG-TERM10+ YEARS
0102 03 04
05
06
03
01 02
04
01
05
07
02IMPA
CT
Opportunities
Transition RisksPhysical Risks
Table 15
Figure 20
Figure 21
PROGRESS AND PERFORMANCE PROGRESS AND PERFORMANCE
PROCUREMENTDEPARTMENT
EXECUTIVE BOARD
SUSTAINABILITY REVIEW BOARD
RISK COMMITTEE CIRCULARITY TASK FORCE
OPERATIONSDEPARTMENT
ENGINEERING, R&D, SALES & PRODUCT MANAGEMENTDEPARTMENT
INNIO‘s highest decision-making committee for climate change management
Reviews and approvesclimate change risk controls
Responsible for shaping circular growth strategies
01. Extreme variability in weather patterns (flooding, heat waves, storms, etc.)02. Rising temperatures and/or extreme precipitation
01. Carbon taxes02. Climate policies & regulations03. Market sentiment04. Potential employee sentiment05. Emerging technology and innovation
01. Provision of time- and energy-efficient products02. Provision of emergency backup power 03. Digital solutions contributing to higher efficiency04. Provision of CO2-neutral power solutions05. Increase in manufacturing resilience against natural disasters06. Increase in renewable energy programs in manufacturing07. Enhanced company reputation
SHORT-TERM 1-3 YEARS
HIG
HLO
W
MEDIUM-TERM3-10 YEARS
LONG-TERM10+ YEARS
0102 03 04
05
06
03
01 02
04
01
05
07
02IMPA
CT
Opportunities
Transition RisksPhysical Risks
TCFD: CLIMATE RISKS AND OPPORTUNITIES TCFD: CLIMATE RISKS AND OPPORTUNITIES

98 99TABLE OF CONTENTS
INNIO’s climate change strategies
Provide energy-efficient technologies to help customers shape a greener future At INNIO, we understand that to meet society’s growing demand for electricity and heat, while at the same time achieving the global goal of carbon-neutrality by the middle of the century, re-liable green or carbon-free technology is needed. Determined to use our position as a global energy provider to play our part in enabling a sustainable, carbon-free future, INNIO increased our focus on research and development in the use of low carbon fuels. In 2021, INNIO introduced our ‘Ready for H2’ product portfolio for our Jenbacher engines, enabling customers to use the fuel of the future in various options today.
Furthermore, INNIO promotes circularity by using more than 50% of recycled materials in our prod-ucts and by designing and manufacturing all our Waukesha and Jenbacher product lines to last for multiple lifetimes.
INNIO is committed to continue investing in re-search and development to enable our customers to flexibly move to a resilient, carbon-free future while providing long-term energy solutions such as distributed and decentralized power and heat.
Promote responsible operations by adopting key mitigation technologies & increasing the use of renewable energy INNIO has a long-standing commitment to ad-vanced green manufacturing and aspires to be a global leader in low carbon production. For many years now, our headquarters in Jenbach has followed a sustainable production model in which all test benches are integrated and controlled with our future-oriented myPlant energy management system for self-supply of electricity and heat as
well as with grid connection for electricity feed-in to the public grid. Furthermore, in 2021, we installed a new PV system that spans almost 2,000 square meters. It is estimated that this installation can lead to 180 tons of CO2 savings per year, beginning in 2022. As of 2021, INNIO’s headquarters in Jenbach took another significant step towards Scope 1 and 2 near-zero emissions by investing in the hydrogen network to supply green hydrogen for our test benches and engineering labs.
Additionally, our site in Welland was constructed taking into consideration sustainable design strat-egies, including low-emitting materials, proper air quality and thermal comfort, and energy-efficient building envelopes, equipment, and lighting sys-tems. Ninety-five percent of the electricity29 used at our facility in Welland is either renewable or climate neutral, coming from the hydro turbines at Niagara Falls. Furthermore, the factory’s initiative included the deployment of digital communica-tion throughout the facility, reducing waste. These considerations enable our production site in Welland to use less and more efficient energy and reduce greenhouse gas emissions.
For all our facilities, the Group has considered the establishment of climate change-related risk adaptive measures. These measures could help us successfully prevent potential operating losses from climate change and achieve zero interrup-tion to our operating activities.
We are determined to continue using the best available technology to reduce emissions of greenhouse gases (GHG). With respect to our own operations and in particular impact to GHG Scope 1 and 2, we aim towards low carbon manufacturing and decarbonizing our own emissions with our own future-proof technology. We will do this by increas-ing our energy efficiency through the adoption of new energy-saving measures on one side and by advancing the use of renewable energy in our operations on the other side. We are investing in research and development to fully utilize the flexibility of our solutions and successively expand near-zero technologies in both our own and our customers’ operations.
Build a resilient & low carbon supply chain through extensive collaboration with suppliers The GHG equivalent of purchased materi-al accounted in 2021 for about 70% of Scope 3 (excluding LCE). INNIO has set ambitious targets and collaborates with key suppliers to promote a more sustainable, less carbon-intensive journey by expanding use of recycled or reclaimed materials and by optimizing upstream transportation. To strengthen this commitment, INNIO started a part-nership with EcoVadis, a global leader in third-party evaluations of business sustainability performance.
This collaboration aims to assess the sustain-ability performance of INNIO’s suppliers through proactive ratings and evaluations using EcoVadis’ methodology. So far, this assessment enables us to gain a clearer view of INNIO’s suppliers, eval-uate them, and promote responsible business practices throughout the supply chain. On the other side we gain important insights into chal-lenges and collaboration opportunities to jointly decarbonize the value chain.
To formalize joint commitments, INNIO request-ed that our suppliers set ESG-related and carbon reduction goals. During INNIO’s annual Supplier Conference, the VP of Procurement commended suppliers that have made outstanding sustain-ability efforts and carbon reduction achievements. The goal was to inspire and assist other suppliers to join in with green actions to share carbon reduction measures and to set ambitious energy conservation goals. INNIO aims to further engage with suppliers and achieve the sustainable target of suppliers committing to 50% GHG reductions by 2030 and committing to net-zero by 2050, conserving approximately 30-40,000 tons of CO2e annually.
Physical climate risk Adaptation measures
Extreme heat INNIO, given the location of our main facilities, is currently not exposed to extreme heat scenarios.
Wildfires INNIO, given the location of our main facilities, is currently not exposed to wildfires.
DroughtsIn 2020 we assessed all our facilities’ water stress risk using the Aqueduct Water Risk Atlas. None of INNIO’s sites operate in areas with high water stress.
FloodingINNIO installed measures, such as protection walls and pumping systems, to prevent high water impact.
Strong windsINNIO’s facilities are built to high construction standards using durable materials to ensure
sufficient protection against strong winds and potential disintegration or structural damage of
buildings or adjacent infrastructure.
INNIO’S ADAPTIVE MEASURES AGAINST POTENTIAL PHYSICAL CLIMATE RISKS
29 1% grey energy
Table 16
PROGRESS AND PERFORMANCE PROGRESS AND PERFORMANCETCFD: CLIMATE RISKS AND OPPORTUNITIES TCFD: CLIMATE RISKS AND OPPORTUNITIES

100 101TABLE OF CONTENTS
Risk Management INNIO follows a holistic enterprise risk management approach that integrates financial, operational, and strategic risks as well as potential ESG risks, including physical and transition climate risks that could represent negative consequences to operations and financial results.
In 2021, INNIO performed our first Group-wide climate risk and opportunity workshop under the TCFD agenda. With participation from the Engineering, Commercial, Procurement, Manu-facturing, Accounting, Risk, ESG, and HR teams, an external advisory team presented the group with questionnaires and perspectives for func-tional review and scenario planning. Traditional risks associated with the energy sector include regulatory uncertainties, emission taxation, uncertainty around stimulation for large-scale hydrogen infrastructure adoption, and acute weather events potentially disrupting INNIO’s supplier operations. Opportunities identified include increased demand for efficient energy solutions run on low carbon fuel, backup power, and flare capturing.
The chair of the SRB reported to the Executive Board the outcome of the initial TCFD alignment workshop and potential climate change risks and opportunities. The Risk Committee agreed to continue work on the evaluation of the identified climate change risks and opportunities and the assessment of their impact on the company.
Through our risk identification and management mechanism, the Risk Committee will develop future heat maps and risk matrices to identify the proba-bility ranges and the related impact of the identified risks, including significant climate change risks.
Furthermore, the Committee will define the risk level and prioritization of risk controls as well as the implementation of risk management strategies according to the Group’s risk appetite.
INNIO’s risk management approach is described in the respective chapter.
Targets and MetricsIn 2021 INNIO continued to implement benchmark practices for calculating and reducing our Scope 1, 2, and 3 GHG emissions. To be more specific, we expanded the data inputs for our GHG footprint calculation, including additional components in our Scope 3 emissions, and refined methodology across some of the data points. We also con-ducted our first Scope 3 life-cycle analysis and reviewed the goal definition based on our learn-ings and observations. We redefined targets and metrics that will help us measure and disclose our progress in achieving our sustainability goals. We understand that this is an iterative process that requires close supervision in order to focus on meaningful and impactful efforts towards INNIO’s sustainability goals.
By continuing tangible initiatives and imple-menting projects, INNIO has effectively reduced about 4,000 metric tons of direct CO2e emissions (Scope 1) in comparison to 2019. Indirect emissions (Scope 2), caused by energy consumption, also were curbed in comparison to 2019 by approxi-mately 4,500 metric tons CO2e due to plant efficiencies. Indirect emissions30 (Scope 3) also have decreased significantly since 2019 by approximately 20,000 metric tons of CO2e.
“Sustainability isn’t something that can only be driven by activists.”
Ryan Ulrich Inventory Manager, INNIO Waukesha
“It is everyone’s responsibility as citizens of our world to look
after the earth we live on — not only for our own well-being
and survival, but for the well-being of generations to come.
Sustainability isn’t something that can only be driven by ac-
tivists. To see real change, businesses and corporations need
to lead by example, showing the path towards sustainable,
successful operation. INNIO is constantly striving to be on
the cutting edge of sustainability, not only in the products
we offer, but in the way we operate our business. By always
finding ways to reduce excess, recycle materials, and also
motivate our supply base to do the same, we are leading by
example in this field, and I am happy to be a part of that.
Our key strengths: 1) New technology, where our enginee-
ring team is constantly innovating to find ways to make our
engines more efficient and reduce emissions; 2) Employee
empowerment, because employees are constantly tasked to
take on new challenges and help make our business more
efficient; and 3) Supplier accountability, where we not only
are looking out for our own sustainable practices but asking
our suppliers to make that same commitment.”
30 The Scope 3 emissions reductions between 2021 and 2019 regard the following Scope 3 components: Purchased goods, fuel indirect, upstream and downstream transportation, waste, and employee commuting. Comparison for business travel and use of sold products is not possible since 2021 is the first year that INNIO included these Scope 3 components in our carbon footprint assessment.
PROGRESS AND PERFORMANCE PROGRESS AND PERFORMANCE
Future PlansOur short-term climate change-related plans include the expansion of the climate risks and opportunities assessment including a scenario analysis. Conducting a scenario analysis for two temperature pathways can help us with the struc-tured exploration of different possible futures and the integration of the potential outcomes into INNIO’s future strategy and financial planning. We acknowledge that full TCFD scenario planning is an ongoing process, and INNIO will focus on strengthening the efforts in these respects in the following non-financial reporting cycles.
TCFD: CLIMATE RISKS AND OPPORTUNITIES TCFD: CLIMATE RISKS AND OPPORTUNITIES

102 103TABLE OF CONTENTS
KEY PERFORMANCE INDICATORS
SUSTAINABILITY KEY PERFORMANCEINDICATORS31
Financial Information
Availability of information Unit 2021 2020 2019
Net Sales Group level EUR (in million)
1,426 1,331 1,468
Board Effectiveness
Availability of information Unit 2021 2020 2019
Average Board meeting attendance
Group level
Rate (%) 93% n/a n/a
Minimum attendance of members required
Rate (%) 57% n/a n/a
Board average tenure Months 15 (range
3-33 months)
n/a n/a
Compliance Availability of information Unit 2021 2020 2019
Significant fines and non-monetary sanctions for non-compliance with laws and/or regulations in the social and economic area
Group level
No. 0 0 0
Total monetary value of significant fines
€ 0 0 0
Total number of non-monetary sanctions
No. 0 0 0
Cases brought through dispute resolution mechanisms
No. 0 0 0
Cybersecurity Availability of information Unit 2021 2020 2019
Number of security incidents
Group level No. 0 n/a n/a
Supply chain management Availability of information Unit 2021 2020 2019
Percentage (%) of new suppliers that were screened using environmental criteria
Group level
Rate (%) 100% 100% 40%
Percentage (%) of new suppliers that were screened using social criteria
Rate (%) 100% 100% 40%
Number of suppliers assessed for environmental impacts
No. 173 323 6231 Data regarding workforce, new employee hires, employee turnover, women in leadership, gender and target nationalities are generated from our HR system. Environmental, Health & Safety (EHS) data regarding accidents, fatalities, near misses, energy consumption, waste generated, water and spills are reported through our Integrated Management System (IMS) based on submitted data from reporting entities within INNIO. Our IMS system meets the ISO 14001, ISO 50001, ISO 9001, ISO 45001 standards, ensuring a comprehensive and consistent approach in handling environmental and health & safety aspects, and is validated via regular (at least annual) internal audits and online trainings. The EHS data have been calculated following GRI methodology.
PROGRESS AND PERFORMANCE KEY PERFORMANCE INDICATIORS KEY PERFORMANCE INDICATIORSPROGRESS AND PERFORMANCE

104 105TABLE OF CONTENTS
Supply chain management Availability of information Unit 2021 2020 2019
Number of suppliers identified as hav-ing significant actual and potential negative environmental impacts
Group level
No. 8 6 7
Significant actual and potential nega-tive environmental impacts identified in the supply chain
No. 14 15 15
Percentage (%) of suppliers identified as having significant actual and potential negative environmental impacts—improvements agreed upon as a result of assessment
Rate (%) 100% 100% 100%
Percentage (%) of suppliers identified as having significant actual and potential negative environmental impacts— relationships terminated
Rate (%) 0% 0% 0%
Number of suppliers assessed for social impacts
No. 173 323 62
Number of suppliers identified as having significant actual and potential negative social impacts
No. 8 5 9
Significant actual and potential negative social impacts identified in the supply chain
No. 25 17 33
Percentage of suppliers identified as having significant actual and po-tential negative social impacts with which improvements were agreed upon as a result of assessment
Rate (%) 100% 100% 100%
Percentage of suppliers identified as having significant actual and po-tential negative social impacts with which relationships were terminated
Rate (%) 0% 0% 0%
Workforce32 Availability of information Unit 2021 2020 2019
Employee headcount
Group level
No. 3,903 3,599 3,623
Full-time equivalent (FTE) No. 3,689 3,354 3,850
Permanent No. 3,678 3,411 n/a
Temporary No. 225 188 n/a
Male 3,252 2,998 n/a
Permanent 3,061 2,837 n/a
Temporary 191 161 n/a
Full-time 3,113 2,734 n/a
Part-time 139 103 n/a
Female No. 651 601 n/a
Permanent 617 574 n/a
Temporary 34 27 n/a
Full-time 498 467 n/a
Part-time 153 107 n/a
By region (and employment contract)
Europe No. 3,228 2,938 n/a
Permanent 3,020 2,764 n/a
Temporary 208 174 n/a
Americas No. 610 593 n/a
Permanent 605 592 n/a
Temporary 5 1 n/a
Asia No, 64 66 n/a
Permanent 52 53 n/a
Temporary 12 13 n/a
Other No. 1 2 n/a
Permanent 1 2 n/a
Temporary 0 0 n/a
32 Workforce data include all INNIO employees, excluding contractors. INNIO’s workforce is not subject to any seasonal variations.
PROGRESS AND PERFORMANCE KEY PERFORMANCE INDICATIORS KEY PERFORMANCE INDICATIORSPROGRESS AND PERFORMANCE

106 107TABLE OF CONTENTS
Workforce Availability of information Unit 2021 2020 2019
Race33
Employees located in the U.S. & Canada
No.
Asian 47 n/a n/a
Black or African American
10 n/a n/a
Hispanic or Latino
36 n/a n/a
White 284 n/a n/a
Indigenous/ Native
1 n/a n/a
Other: Two or more
4 n/a n/a
New employee hires Availability of information Unit 2021 2020 2019
Total
Group level No.
346 444 n/a
Male 272 329 n/a
Female 74 115 n/a
Age Group
< 30 years 127 120 n/a
30–50 years 175 278 n/a
> 50 years 44 46 n/a
By region:
Europe 220 296 n/a
Americas 120 132 n/a
Asia 5 15 n/a
Employee turnover Availability of information Unit 2021 2020 2019
Total
Group level No.
402 559 n/a
Male 305 452 n/a
Female 97 107 n/a
Age Group
< 30 years 82 95 n/a
30–50 years 229 254 n/a
> 50 years 91 210 n/a
Employee turnover Availability of information Unit 2021 2020 2019
By region:
Group level No.
Europe 290 233 n/a
Americas 104 319 n/a
Asia 6 7 n/a
Other 2 0 n/a
Health & Safety34 Availability of information Unit 2021 2020 2019
Number of fatalities as a result of work-related injury
Group level
No. 0 0 0
Rate of fatalities as a result of work-related injury
Rate (%) 0% 0% 0%
Number of fatalities as a result of work-related ill health
No. 0 0 0
Number of high-consequence work-related injuries (excluding fatalities)
No. 0 0 0
Rate of high-consequence work-related injuries (excluding fatalities)
Rate (%) 0% 0% 0%
Number of identified and recorded near misses
No. 25 34 65
Rate of recordable work-related injuries35
Rate 0.75 1.12 1.87
Number of identified and recorded near misses
Number 104 61 33
Near miss frequency rate (NMFR)36 Rate 3.1 n/a n/a
Lost-time injuries frequency rate (LTIFR)37
Rate 3.75 5.6 n/a
Lost-time injury rate (LTIR)38 Rate 0.75 1.12 1.87
33 The data regard the race self-identification provided voluntarily from the employees in US and Canada.34 Currently, the health & safety data do not include contractors. The main work-related injuries for 2021 were contact with sharp objects, soreness, and slips. The numbers of hours worked for 2021 is 6,675,246.35 The rate or recordable work-related injuries was calculated as such: (Number of recordable work-related injuries/ Number of hours worked) * 200,000. The number of hours worked was calculated as such: 38.5 working hours per week * (52 weeks in one year - 5 weeks of holidays). The 38.5 working hours per week is based on our sector-specific collective agreements. The full-time equivalent (FTE) in 2021 was 3,689.36 NMFR= [number of close calls (near misses; near hits) identified*200,000]/ Number of hours worked for all employees37 LTIFR= (Number of lost-time injuries) / (Total hours worked in accounting period) x 1,000,00038 LTIR= (Number of lost-time injuries) / (Total hours worked in accounting period) x 200,000
PROGRESS AND PERFORMANCE KEY PERFORMANCE INDICATIORS KEY PERFORMANCE INDICATIORSPROGRESS AND PERFORMANCE

108 109TABLE OF CONTENTS
Training & Development Availability of information Unit 2021 2020 2019
Total number of training hours provided to employees
Group level
No. 105,785 n/a n/a
Average training hours per employee39
29 n/a n/a
Percentage (%) of total emp-loyees who received a regular performance and career development review
Rate (%) access 100%, execu-ted 97%
n/a n/a
Non-discrimination Availability of information Unit 2021 2020 2019
Total number of incidents of discrimination
Group level No. 0 0 0
Environmental Compliance40 Availability of information Unit 2021 2020 2019
Total monetary value of signifi-cant fines for non-compliance with environmental laws and/or regulations
Group level
€ 0 0 0
Total number of non-monetary sanctions for non-compliance with environmental laws and/or regulations
No. 0 0 0
Cases brought through dispute resolution mechanisms
No. 0 0 0
Materials Availability of information Unit 2021 2020 2019
Total material usage
Group level
Tons
44,292 44,077 57,550
Materials by type:
Metals 41,301 41,100 53,663
Wood 686 683 892
Paper 128 127 166
Sand 80 79 104
Chemicals 925 920 1202
Others 1,173 1167 1524
Percentage (%) of recycled input materials
Rate (%) 53% 53% 55%
41 The energy-related data for our four main facilities (Jenbach, Kapfenberg, Waukesha, Welland) come from bills and onsite calculations based on the GRI metho- dology. For our offices, we made assumptions based on employee headcount. We used the conversion factors from the U.S. Environmental Protection Agency (EPA). 42 Includes only electricity purchased and consumed. Electricity consumed from own generation is included in fuel consumption. 43 The energy-related data for our four main facilities (Jenbach, Kapfenberg, Waukesha, Welland) come from bills and onsite calculations and are used to calculate emissions for both Scope 1 and 2 emissions. Estimates are used where primary data is not available and are based on employee headcount. Furthermore, we apply the corresponding emission factors to calculate emissions. INNIO reports Scope 3 emissions for all relevant categories. INNIO identified 2020 as the base year for our GHG emissions (Scope 1, Scope 2, and Scope 3), since 2020 was the first year that INNIO conducted a comprehensive GHG carbon footprint assessment. For this reporting period, no significant changes in emissions triggered recalculations of our 2020 (base year) emissions. 44 Scope 3 refers to other indirect emissions that occur outside the organization, including both upstream and downstream emissions. INNIO identified as most relevant components of Scope 3 emissions the following: use of products, purchased goods, waste, upstream and downstream transportation, fuel indirect, employee commuting, and business travel. CO2 emissions related to the natural carbon cycle, as well as those resulting from the combustion, harvest, digestion, fermentation, decomposition, or processing of biologically based materials, are not considered relevant for INNIO’s Scope 3 inventory and are not included in the calculation.
39 Average training hours per employee = Total number of training hours/ Full-time equivalent40 INNIO uses environmental, energy, and occupational health & safety law compliance management tools, integrated into our Integrated Management System. These software-based tools provide the list of relevant EHS legal obligations the company must comply with, formulated as task, as well as changes in the law and a comparison of the previous and new legal situation. In this way, compliance with environmental, health & safety laws is reassured.
PROGRESS AND PERFORMANCE KEY PERFORMANCE INDICATIORS KEY PERFORMANCE INDICATIORSPROGRESS AND PERFORMANCE
Energy Availability of information Unit 2021 2020 2019
Total energy consumption
Group level41 GJ
640,509 793,422 826,728
Consumption from non-renewable sources
568,849 752,189 749,098
Natural gas 568,849 752,189 749,098
Consumption from renewable sources
62,863 37,564 39,512
Hydro 62,863 37,564 39,512
Electricity consumptio42 159,007 182,308 n/a
Heat consumption 113,941 136,606 n/a
Cooling consumption 0 0 0
Steam consumption 0 0 0
Electricity sold 35,644 30,539 24,527
Heat sold 0 0 0
Cooling sold 0 0 0
Steam sold 0 0 0
GHG emissions43 Availability of information Unit 2021 2020 2019
Scope 1 emissions
Group levelTons of CO2e
30,727 35,923 34,699
Stationary combustion 30,727 35,923 34,699
Scope 1 emissions intensity (tCO2e/tons of materials)
0.69 0.82 0.60
Scope 2 emissions (market-based)
5,850 7,617 10,458
Scope 2 emissions (location-based)
7,759 n/a n/a
Scope 2 emissions intensity (tCO2e/tons of materials)
0.13 0.17 0.18
Scope 3 emissions44
Use of products 6,230,144 n/a n/a
Purchased goods 43,228 43,018 56,168
Fuel Indirect (grey energy) 10,871 13,459 14,394

110 111TABLE OF CONTENTS
GHG emissions Availability of information Unit 2021 2020 2019
Upstream raw materials transport
Group levelTons of CO2e
4,760 3,519 4,793
Waste 1,170 1,718 1,816
Downstream product transport 2,104 1,604 2,531
Upstream leased assets 3,076 n/a n/a
Employee commuting 2,956 3,978 4,544
Business travel 280 n/a n/a
GHG emissions reductions Availability of information Unit 2021 2020 2019
Scope 1 & Scope 2 emissions reductions
Group level Tons of CO2e
6,963 n/a n/a
Spills Availability of information Unit 2021 2020 2019
Number of recorded significant spills
Spills are mea-sured in our four main facilities (Jenbach, Kapfen-berg, Waukesha, Welland)
No.
0 0 0
Oil spills 0 0 0
Fuel spills 0 0 0
Spills of wastes 0 0 0
Spills of chemicals 0 0 0
Others 0 0 0
Waste34 Availability of information Unit 2021 2020 2019
Total waste generated
Group level Tons
11,567 11,122 11,903
Waste diverted from disposal 9,915 10,038 8,536
Hazardous waste diverted from disposal
742 849 620
Hazardous waste for recycling 108 137 81
Non-hazardous waste diverted from disposal
8,589 8,242 9,206
Non-hazardous waste for recycling
8,179 7,190 8,437
Waste45 Availability of information Unit 2021 2020 2019
Preparation for reuse of non-hazardous waste
Group level Tons
132 n/a n/a
Other recovery operations of non-hazardous waste
1,441 1,464 1,660
Total weight of waste directed to disposal
1,220 1,060 1,105
Hazardous waste directed to disposal
0 n/a n/a
Non-hazardous waste directed to disposal
1,220 n/a n/a
Non-hazardous waste combusted (incineration)
1,220 n/a n/a
Water46 Availability of information Unit 2021 2020 2019
Total water withdrawn
Group levelMegaliters
(mL)
1,065 1,072 804
Sources of water withdrawn:
Groundwater 915 922 667
Third-party water 150 150 137
Total water discharge 1,030 765 576
Sources of water discharge:
Groundwater 915 660 490
Third-party water 115 105 86
Total water consumption 35 308 229
Environmental certifications for operations
Availability of information Unit 2021 2020 2019
ISO 14001
Group level Yes/No
Yes Yes Yes
ISO 50001 Yes Yes Yes
ISO 9001 Yes Yes Yes
ISO 45001 Yes No No
45 Primary data is used to calculate waste generation where INNIO operates. Estimates are used where primary data is not available. Waste generated is based on data from invoices and/or vendor/third party reports. In the absence of actual data, estimations and assumptions are used based on this source for commercial offices and based on employee headcount. 46 Primary data is used to calculate water withdrawal, discharge and consumption where INNIO operates, and in some cases estimations where primary data is not available. Water withdrawals are based on data from utility bills from our largest sites. Estimates are used based on employee headcount.
PROGRESS AND PERFORMANCE KEY PERFORMANCE INDICATIORS KEY PERFORMANCE INDICATIORSPROGRESS AND PERFORMANCE

TABLE OF CONTENTS
04A
PPEN
DIX
114 Appendix 1: Enterprise Risk Management
116 Appendix 2: Detailed Materiality Assessment Process
117 Appendix 3: GHG Emissions Inventory

114 115TABLE OF CONTENTSAPPENDIX ENTERPRISE RISK MANAGEMENT
ENTERPRISE RISK MANAGEMENT
Effective risk assessment and management are essential aspects of our success. Besides the conventional risk types—such as market and financial risks, operational risks, and strategic risks—the management of non-financial risks is becoming increasingly im- portant. Environmental, social and governance (ESG), including climate and regulatory, data protection and information or cyber- security play a significant role within the spectrum of enterprise risks.
INNIO’s enterprise risk management sets the frame-work under which proper identification, impact assessment, and evaluation and quantification of such risks occurs to provide comprehensive direc-tion to mitigate potential exposures and safeguard value for the company, our employees, customers, suppliers, and financial stakeholders.
The purpose of holistic risk management is to address risk areas throughout the organization in a structured bottom-up review cycle, allowing for objective monitoring and control of various
elements in the best interest of the organization without the potential conflict of interests coming from other business priorities.
Risk Identification & Risk ManagementThe identification of risks occurs through con-
tinuous monitoring of INNIO’s internal and external environment. We use structured risk identification techniques like workshops; continuous interviews with senior management, subject matter experts, and executives; as well as surveys and analyses
ENTERPRISE RISK MANAGEMENTAPPENDIX
of historical data. Furthermore, we use heat maps and/or risk matrices to support the assessment process, helping us identify probability ranges and the related consequences of the identified risks. For instance, in 2021 INNIO conducted a dedicated workshop to identify climate change risks and op-portunities following the TCFD Framework.
Regarding the risk management process, we use a bottom-up and top-down approach, providing a comprehensive risk profile of the organization. To be more specific, INNIO’s risk management process comprises five intertwined components.
Strategy & Target-Setting INNIO’s Executive Committee establishes overarch-ing strategic goals and sets financial targets that are communicated to all functions, ensuring align-ment across the organization. Senior management is responsible for the achievement of these goals and objectives. The goals and objectives of the de-partments and individual employees generally are aligned with the goals of the entire organization.
Risk Identification and AssessmentINNIO’s risk management function is responsible for the identification of risks and issues that might affect our ability to achieve established goals and objectives. Furthermore, business leaders work with the Group’s risk management function to determine the appropriate way to address identi-fied risks. Risk activities can be avoided, accepted, reduced, shared, or transferred, depending on the circumstances. To ensure that appropriate risk responses are in place, the risk management func-tion sets policies and defines guidelines that apply to our business activities. INNIO’s business leaders are responsible for the implementation of these policies and guidelines as well as for understand-ing where improvements might be needed.
Review & RevisionTo ensure that risks are effectively assessed and appropriate risk responses and controls are in place, we perform regular assessments and inter-nal reviews of our risk management processes. Our risk management function and business unitmanagement monitor the effectiveness of the risk mitigation activities and report the results of the assessment to the Executive Board and other senior leaders.
Risk Control & CommunicationAppropriate communication channels are in place to help ensure that business leaders and employ-ees are informed about the risks that fall into their area of responsibility. To ensure ownership of the identified risk, INNIO’s leadership team meets with the Executive Board and the Risk Committee on a regular basis.
Mandatory annual risk trainings (e.g. Cyber Security) are provided to all INNIO employees. Additionally, further information is provided to em-ployees through direct communications or via the intranet. Regular emails or memos summarizing key learnings from incidents or other identified trends also are provided to employees.
INNIO’s Code of Conduct and other formal policies are in place providing detailed guidance regarding incidents of non-compliance, adverse events, or critical unmitigated risks. Finally, INNIO’s SPEAK UP! digital platform offers all employees, suppliers, and others a formal mechanism to report anonymously potential violations of laws, regula-tions, or policies, or to raise concerns about safety, security, or ethical behavior.
Risk Governance & OversightINNIO’s Executive Board oversees the senior lead-ership’s management of risks. The Board meets regularly with the Risk Committee and other senior business leaders to discuss risk factors related to the Group.

116 117TABLE OF CONTENTSAPPENDIX DETAILED MATERIALITY ASSESSMENT PROCESS
DETAILED MATERIALITY ASSESSMENT PROCESS
The objective of conducting a materiality assessment is to assess the changing sustainability landscape, to understand and priori-tize the issues that matter to our business and stakeholders, and to help ensure we concentrate our strategy in the right areas. We use our materiality assessment to help us determine which issues to include, set targets for, and report on.
Our materiality assessment can be described in a five-stage process, detailed below:
PHASE 1 — Issue identificationWe identified an initial, extensive list of 55 potential sustainability topics for analysis. It included issues and topics covered by the sustainability land-scape and global frameworks such as the Global Reporting Initiative (GRI), Sustainability Accounting Standards Board (SASB), industry associations such as the Mechanical Engineering Industry Association (VDMA.com), the Paris Agreement, and the United Nations Sustainable Development Goals (UN SDGs), as well as competitor practices.
PHASE 2 — Issue prioritizationINNIO’s C-level executives were asked to review each clustered material topic, provide their per-spective, and assess each issue’s impact on the business and importance to our stakeholders. Their perspectives then were discussed at the material-ity workshop, where participants were asked to list the topics they considered to be most substantial. Each topic was rated high, medium, or low accord-ing to its importance to the participants.
PHASE 3 — Internal validationThe outcome of the materiality workshop was the identification of 12 significant areas listed in Table 3, page 29. INNIO’s Sustainability team worked with specific functions and stakeholders on the review and refinement of the draft materiality matrix. The matrix was presented to the senior management team and the Sustainability Review Board and finally approved by the INNIO Board of Directors in August 2021.
PHASE 4 — Disclosure, transparency & insightsThe outcomes of our materiality analysis help us review our management approach and assess where we can improve and create meaningful impact with respect to the environment and our business. Furthermore, it helped us shape our ESG disclosures and transparency on material topics.
PHASE 5 — Reporting on outcomesWe communicate the outcomes of our materiality assessment, the list of material topics, and their level of significance to the business and stakeholders as well as our approach and performance on each material topic.
GHG EMISSIONS INVENTORYAPPENDIX
GHG EMISSIONS INVENTORY
In 2021, INNIO, together with external expert consultants, reviewed our carbon footprint in line with the World Resource Institute Greenhouse Gas Protocol, the ISO 14064, and PAS 2060 corporate standards. The emissions listed in Graphs 5, 6, 7 (pages 61-63) cover more than 98% of the INNIO Group using the financial control approach.
All potential material sources of emissions were reviewed during the initial project scoping. To cal-culate INNIO’s carbon footprint, we included carbon dioxide (CO2), methane (CH4), and nitrous oxide (N2O) emissions, which are regulated under the Kyoto Protocol. The other GHGs are not relevant to our business and therefore have not been included in the assessment.
For the calculation, we used actual data, includ-ing data provided by suppliers or other value chain partners. In some cases, model-based assump-tions were made. To be more specific, in some of our office locations where data was not available,
emissions from natural gas, electricity, and waste generation were estimated based on employee headcount at each location.
As illustrated in Graph 6, INNIO conducted an extensive carbon assessment exercise, adding all relevant Scope 3 components for the year 2021. Furthermore, in 2021, INNIO proceeded to advance-ments in the carbon methodology — mainly the use of actual data and the decrease of assumptions—leading to adjustments of some components’ results from previous disclosures. Graphs 5, 6, and 7 illustrate figures calculated using the same com-prehensive methodology (pages 61-63).

TABLE OF CONTENTS
05IN
DEX
TA
BLES
,ES
G A
SSUR
AN
CE

GRI & UN SDG’SCONTENT INDEX
STATEMENT OF USEINNIO Group has reported the information cited in this GRI content index for the period Jan. 1, 2021-Dec. 31, 2021 in accordance with the GRI Standards: Core option
GRI # Disclosure Report Contents or Explanation UN SDG # Page
102-1 Name of the organization INNIO Group Holding GmbH (“About this Report” section)
6
102-2 Activities, brands, products, and services
“About INNIO” section 14
102-3 Location of headquarters Jenbach, Austria (“About this Report” section) 7
102-4 Location of operations “About INNIO” section 14
102-5 Ownership and legal form Since the end of 2018, has been operating independ-ently as a privately owned enterprise
102-6 Markets served “About INNIO”—Value Chain 16–17
102-7 Scale of the organization “Sustainability Key Performance Indicators” for net sales; Reason for omission: INNIO treats total capita-lization data
102–111
102-8 Information on employees and other workers
“Sustainability Key Performance Indicators” 8, 10 102–111
102-9 Supply chain “Value Chain”, “Sustainable supply chain” 16–17, 68–71
102-10 Significant changes to the organization and its supply chain
No significant changes occurred during 2021
102-11 Precautionary principle or approach
“Appendix: Enterprise risk management” 114–115
102-12 External initiatives “Leading the industry through collaborative action” 22–23
GRI # Disclosure Report Contents or Explanation UN SDG # Page
102-13 Membership of associations “Leading the industry through collaborative action” 22–23
102-14 Statement from senior decision-maker
“CEO Letter” 10–11
102-15 Key impacts, risks, and opportunities
“TCFD: Climate risks & opportunities” 94–101
102-16 Values, principles, standards, and norms of behavior
“About INNIO”—“Purpose, Vision & Mission” 16 14–15
102-17 Mechanisms for advice and concerns about ethics
“Business Ethics” 16 88–93
102-18 Governance structure “Governance” 30–33
102-40 List of stakeholder groups “Stakeholder engagement & materiality assessment” 24–29
102-41 Collective bargaining agreements
“68% of INNIO employees are covered by collective bargaining agreements”
8
102-42 Identifying and selecting stakeholders
“Stakeholder engagement & materiality assessment,” “Appendix: Detailed materiality assessment process”
24–29, 116
102-43 Approach to stakeholder engagement
“Stakeholder engagement & materiality assessment,” “Appendix: Detailed materiality assessment process”
24–29, 116
102-44 Key topics and concerns raised
“Stakeholder engagement & materiality assessment,” “Appendix: Detailed materiality assessment process”
24–29, 116
102-45 Entities included in the consoli- dated financial statements
“About this report”: e.g., “The data presented in the report is consolidated at Group level and covers 100% of business operations and 90% of global locations.”
6–7
102-46 Defining report content and topic boundaries
“About this report” 6–7
102-47 List of material topics “Stakeholder engagement & materiality assessment” 24-29
102-48 Restatements of information changes in reporting
Any restatements or changes in comparison to INNIO’s previous report are clearly stated in the text
102-49 Changes in reporting No changes in reporting occurred in comparison to 2020 report
102-50 Reporting period Fiscal year 2021
102-51 Date of most recent report September 2021
102-52 Reporting cycle “About this report” 6–7
120 121TABLE OF CONTENTSINDEX TABLES GRI CONTENT INDEX GRI CONTENT INDEXINDEX TABLES
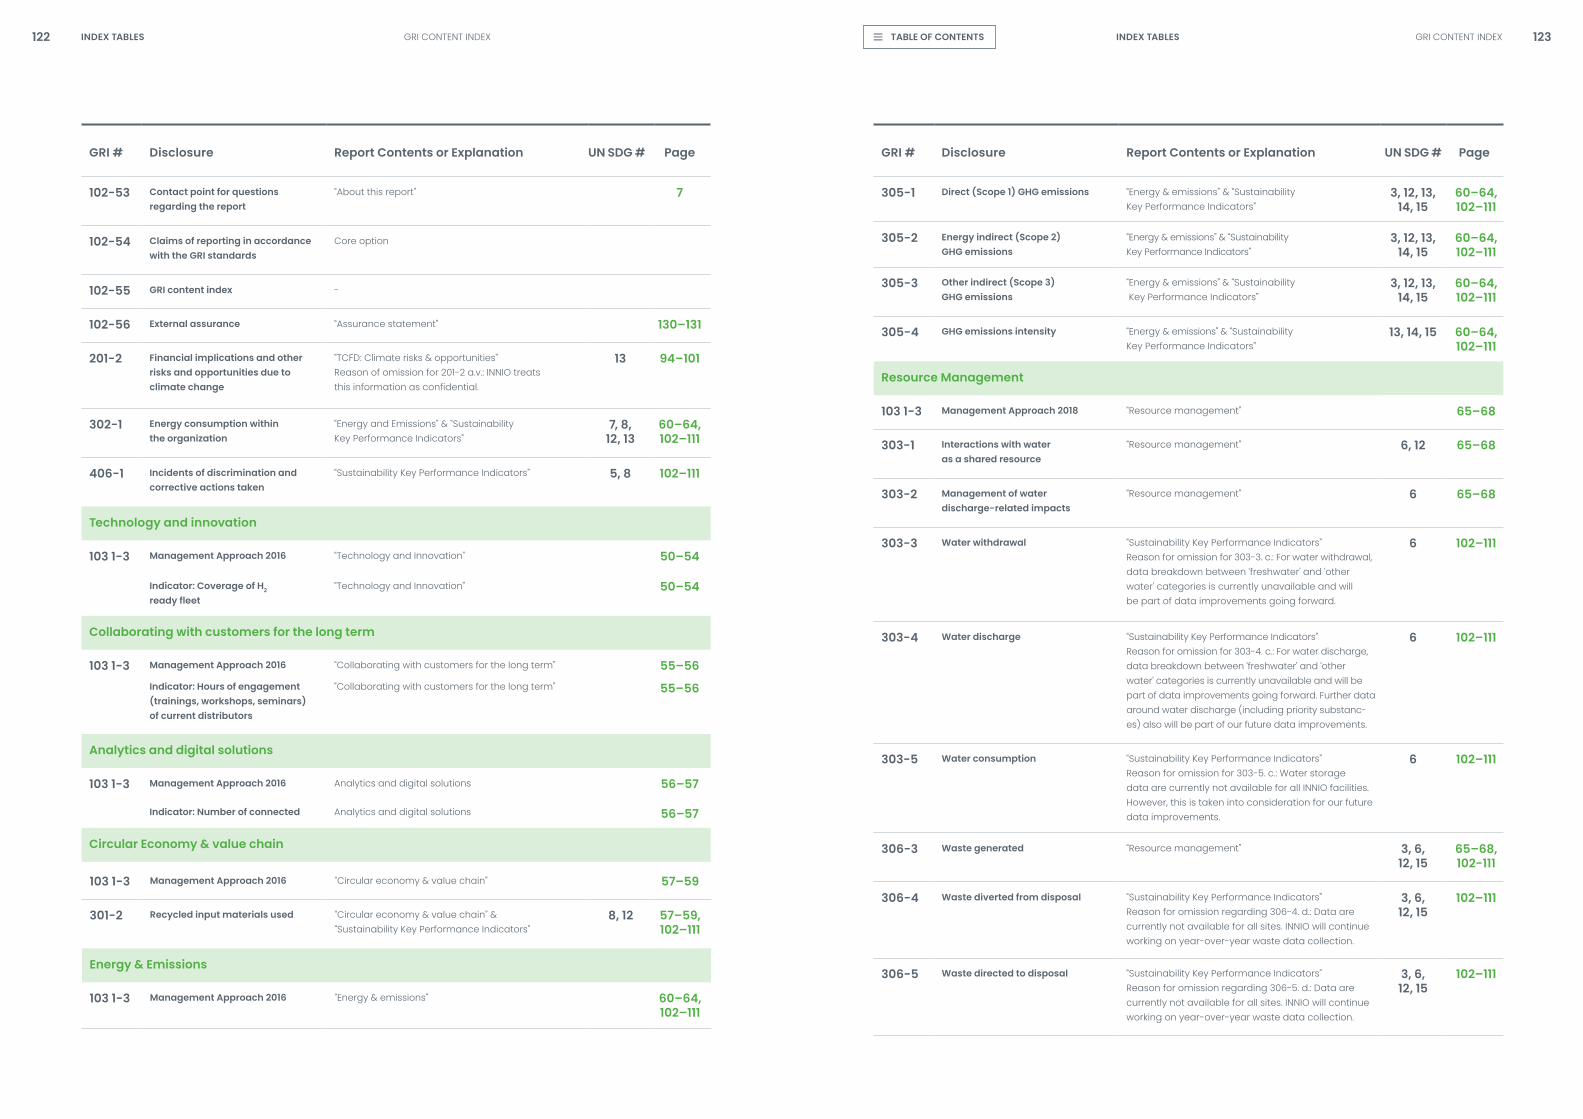
GRI # Disclosure Report Contents or Explanation UN SDG # Page
102-53 Contact point for questions regarding the report
“About this report” 7
102-54 Claims of reporting in accordance with the GRI standards
Core option
102-55 GRI content index -
102-56 External assurance “Assurance statement” 130–131
201-2 Financial implications and other risks and opportunities due to climate change
“TCFD: Climate risks & opportunities”Reason of omission for 201-2 a.v.: INNIO treats this information as confidential.
13 94–101
302-1 Energy consumption within the organization
“Energy and Emissions” & “Sustainability Key Performance Indicators”
7, 8, 12, 13
60–64,102–111
406-1 Incidents of discrimination and corrective actions taken
“Sustainability Key Performance Indicators” 5, 8 102–111
Technology and innovation
103 1-3 Management Approach 2016 “Technology and Innovation” 50–54
Indicator: Coverage of H2
ready fleet“Technology and Innovation” 50–54
Collaborating with customers for the long term
103 1-3 Management Approach 2016 “Collaborating with customers for the long term” 55–56Indicator: Hours of engagement (trainings, workshops, seminars) of current distributors
“Collaborating with customers for the long term” 55–56
Analytics and digital solutions
103 1-3 Management Approach 2016 Analytics and digital solutions 56–57
Indicator: Number of connected Analytics and digital solutions 56–57
Circular Economy & value chain
GRI # Disclosure Report Contents or Explanation UN SDG # Page
305-1 Direct (Scope 1) GHG emissions “Energy & emissions” & “Sustainability Key Performance Indicators”
3, 12, 13, 14, 15
60–64,102–111
305-2 Energy indirect (Scope 2) GHG emissions
“Energy & emissions” & “Sustainability Key Performance Indicators”
3, 12, 13, 14, 15
60–64,102–111
305-3 Other indirect (Scope 3) GHG emissions
“Energy & emissions” & “Sustainability Key Performance Indicators”
3, 12, 13, 14, 15
60–64,102–111
305-4 GHG emissions intensity “Energy & emissions” & “Sustainability Key Performance Indicators”
13, 14, 15 60–64,102–111
Resource Management
103 1-3 Management Approach 2018 “Resource management” 65–68
303-1 Interactions with water as a shared resource
“Resource management” 6, 12 65–68
303-2 Management of water discharge-related impacts
“Resource management” 6 65–68
303-3 Water withdrawal “Sustainability Key Performance Indicators”Reason for omission for 303-3. c.: For water withdrawal, data breakdown between ‘freshwater’ and ‘other water’ categories is currently unavailable and will be part of data improvements going forward.
6 102–111
303-4 Water discharge “Sustainability Key Performance Indicators”Reason for omission for 303-4. c.: For water discharge, data breakdown between ‘freshwater’ and ‘other water’ categories is currently unavailable and will be part of data improvements going forward. Further data around water discharge (including priority substanc-es) also will be part of our future data improvements.
6 102–111
303-5 Water consumption “Sustainability Key Performance Indicators”Reason for omission for 303-5. c.: Water storage data are currently not available for all INNIO facilities. However, this is taken into consideration for our future data improvements.
6 102–111
306-3 Waste generated “Resource management” 3, 6, 12, 15
65–68, 102-111
306-4 Waste diverted from disposal “Sustainability Key Performance Indicators”Reason for omission regarding 306-4. d.: Data are currently not available for all sites. INNIO will continue working on year-over-year waste data collection.
3, 6, 12, 15
102–111
306-5 Waste directed to disposal “Sustainability Key Performance Indicators”Reason for omission regarding 306-5. d.: Data are currently not available for all sites. INNIO will continue working on year-over-year waste data collection.
3, 6, 12, 15
102–111
103 1-3 Management Approach 2016 “Circular economy & value chain” 57–59
301-2 Recycled input materials used “Circular economy & value chain” & “Sustainability Key Performance Indicators”
8, 12 57–59, 102–111
Energy & Emissions
103 1-3 Management Approach 2016 “Energy & emissions” 60–64,102–111
122 123TABLE OF CONTENTSINDEX TABLES GRI CONTENT INDEX GRI CONTENT INDEXINDEX TABLES

GRI # Disclosure Report Contents or Explanation UN SDG # Page
Sustainable Supply chain
103 1-3 Management Approach 2016 “Sustainable supply chain” 68–71
308-1 New suppliers that were screened using environmental criteria
“Sustainable supply chain” & “Sustainability Key Performance Indicators”
68–71, 102–111
308-2 Negative environmental impacts in the supply chain and actions taken
“Sustainable supply chain” & “Sustainability Key Performance Indicators”
68–71, 102–111
414-1 New suppliers that were screened using social criteria
“Sustainable supply chain” & “Key Performance Indicators”
68–71, 102–111
414-2 Negative social impacts in the supply chain and actions taken
“Sustainable supply chain” & “Key Performance Indicators”
68–71, 102–111
Health & Safety
103 1-3 Management approach “Health & Safety” 82–86
403-1 Occupational health & safety management system
“Health & Safety” 8 82–86
403-2 Hazard identification, risk assess-ment, and incident investigation
“Health & Safety” 8 82–86
403-3 Occupational health services “Health & Safety” 8 82–86
403-4 Worker participation, consultation, and communication on occupatio-nal health & safety
“Health & Safety” 8, 16 82–86
403-5 Worker training on occupational health & safety
“Health & Safety” 8 82–86
403-9 Work-related injuries “Sustainability Key Performance Indicators”Reason for omission for 403-9 b.: Currently, the health & safety data for contractors are not available.
3, 8, 16 102–111
Diversity & Inclusion
103 1-3 Management approach 2016 “Diversity and inclusion” 75–81
401-1 New employee hires and employee turnover
“Diversity and inclusion” & “Sustainability Key Performance Indicators”
5, 8, 10 75–81, 102–111
GRI # Disclosure Report Contents or Explanation UN SDG # Page
Employee Experience
103 1-3 Management Approach 2016 “Employee Experience” 72–74
404-1 Average hours of training per year per employee
“Sustainability Key Performance Indicators”Reason for omission regarding employee training by gender and employee type: Data cannot be provided due to manual calculation for onsite trainings.
4, 5, 8, 10
72–74,102–111
404-3 Percentage of employees receiving regular performance and career development reviews
“Sustainability Key Performance Indicators” 5, 8, 10 102–111
Business Ethics
103 1-3 Management Approach 2016 “Business ethics” 88–93
419-1 Significant fines and non-monetary sanctions for non-compliance with laws and/or regulations
“Business ethics” & “Sustainability Key Performance Indicators”
16 88–93,102–111
Community Engagement
103 1-3 Management Approach 2016 “Community engagement” 86–87
Indicator: Charitable donations (in €) from “INNIO Volunteers”
“Community engagement” 86–87
124 125TABLE OF CONTENTSINDEX TABLES GRI CONTENT INDEX GRI CONTENT INDEXINDEX TABLES

SASB INDEX
Topic Code Accounting metric Category Unit of Measure
Description, References
Energy Management
RT-EE-130a.1/ (1) Total energy consumed Quantitative Gigajoules (GJ)
Pages 102–111RT-IG-130a.1 (2) Percentage grid electricity Quantitative Percentage (%)
(3) Percentage renewable Quantitative Percentage (%)
Hazardous Waste Management
RT-EE-150a.1 Amount of hazardous waste generated
Quantitative Metric tons (t) Pages 102–111
Percentage recycled Quantitative Percentage (%)
Number of reportable spills Quantitative Number
RT-EE-150a.2 Aggregate quantity of reportable spills
Quantitative Kilograms (kg)
Quantity recovered Quantitative Kilograms (kg)
Product Safety
RT-EE- 250a.1 Number of recalls issued Quantitative Number INNIO had zero recalls in 2021 and we had no monetary losses as a result of legal proceedings associated with product safety. Please also see pages 60–61 for product safety & pages 102–111
Total units recalled Quantitative Number
RT-EE- 250a.2 Total amount of monetary losses as a result of legal proceedings associated with product safety
Quantitative Reporting currency
Fuel Economy & Emissions in Use-phase
RT-IG-410a.1 Sales-weighted fleet fuel efficiency for medium- and heavy-duty vehicles
Quantitative Gallons per 1,000 ton miles
INNIO is working on data ana-lytics for disclosure of Scope 3 emissions from products and their life-cycles. We are not measuring sales-weighted fuel efficiency, but rather overall me-chanical, electrical, and thermal product efficiencies. In addition, and specifically in relation to Code RT-IG-410a.4, we are not manufacturing any diesel equipment. Instead, we direct our investments towards research and development related to reciprocating engines that generate fewer direct emissions. Please also refer to “Energy transition in action.”
RT-IG-410a.2 Sales-weighted fuel efficiency for non-road equipment
Quantitative Gallons per hour
RT-IG-410a.3 Sales-weighted fuel efficiency for stationary generators
Quantitative Watts per gallon
RT-IG-410a.4 Sales-weighted emissions of: (1) nitrogen oxides (NOx) and (2) particulate matter (PM) for: (a) marine diesel engines, (b) locomotive diesel engines, (c) on-road medium- and heavy-duty engines, and (d) other non-road diesel engines
Quantitative Grams per kilo-watt hour
Topic Code Accounting metric Category Unit of Measure
Description, References
Materials Sourcing
RT-EE-440a.1/RT-IG-440a.1
Description of the manage-ment of risks associated with the use of critical materials
Discussion and analysis
n/a “Appendix: Enterprise risk management” section
Remanufac-turing Design and Services
RT-IG-440b.1 Revenue from remanufactured products and remanufactur-ing services
Quantitative Reporting currency
INNIO’s revenues from re-manufacturing offerings have increased by approximately 25% since 2018.
Business Ethics
RT-EE-510a.1 Description of policies and practices for prevention of: (1) corruption and bribery and (2) anticompetitive behavior
Discussion and analysis
n/a “Business Ethics” pages 88–93
RT-EE-510a.2 Total amount of monetary losses as a result of legal proceedings associated with bribery or corruption
Quantitative Reporting currency (€)
Zero, “Business Ethics” pages 88–93 & pages 102–111
RT-EE-510a.3 Total amount of monetary losses as a result of legal proceedings associated with anticompetitive behavior regulations
Quantitative Reporting currency (€)
Zero, “Business Ethics” pages 88–93 & pages 102–111
Employee Health & Safety
RT-IG-320a.1 (1) Total recordable incident rate (TRIR)
Quantitative Rate Pages 102–111
RT-IG-320a.2 (2) Fatality rate Quantitative Rate Zero, pages 102–111
RT-IG-320a.3 (3) Near miss frequency rate (NMFR)
Quantitative Rate 3.1
Accounting Metrics
RT-IG-000.A/RT-EE-000.A
Number of units produced by product category
Quantitative Number INNIO Group delivers more than 2 GW of newly installed base annually.
RT-IG-000.B/RT-EE-000.B
Number of employees Quantitative Number Pages 102–111
126 127TABLE OF CONTENTSINDEX TABLES SASB INDEX SASB INDEXINDEX TABLES

TCFD INDEX
UN GLOBAL COMPACT INDEX
Disclosure Reference/ Report section
Governance
Describe the Board’s oversight of climate-related risks and opportunities
Please refer to “TCFD: Climate risks & opportunities” sectionDescribe management’s role in assessing and managing
climate-related risks and opportunities
Strategy
Describe the climate-related risks and opportunities the organi-zation has identified over the short, medium, and long term.
Please refer to “TCFD: Climate risks & opportunities” sectionDescribe the impact of climate-related risks and opportunities on
the organization’s businesses, strategy, and financial planning.
Describe the resilience of the organization’s strategy, taking into consideration different climate-related scenarios, including a 2°C or lower scenario
INNIO is currently working on expanding our TCFD-related practices by including climate-related scenarios in our initial identification of climate risks and opportunities that will further help us assess the resilience of our climate strategy.
Risk Management
Describe the organization’s processes for identifying and assessing climate-related risks.
Please refer to “TCFD: Climate risks & opportunities” & “Appendix: Enterprise risk management” sections
Describe the organization’s processes for managing climate-related risks.
Describe how processes for identifying, assessing, and managing climate-related risks are integrated into the organization’s overall risk management.
Metrics and targets
Disclose the metrics used by the organization to assess climate-related risks and opportunities in line with its strategy and risk management process
Please refer to “TCFD: Climate risks & opportunities,” “Strategy,” & “Sustainability Key Performance Indicators” sections
Disclose Scope 1, Scope 2, and, if appropriate, Scope 3 greenhouse gas (GHG) emissions, and the related risks.
Describe the targets used by the organization to manage climate-related risks and opportunities and performance against targets.
Global Compact Principle Reference/ Report section Sustainability Report reference
Principles 1 & 2
Businesses should support and respect the protection of internationally proclaimed human rights. Businesses should make sure that they are not complicit in human rights abuses.
Labor & human rights policy, Supplier Code of Conduct
“Business Ethics” section
Principle 3
Businesses should uphold the freedom of asso-ciation and the effective recognition of the right to collective bargaining.
Labor & human rights policy, Supplier Code of Conduct
“Business Ethics,” “Human Rights & Commu-nity Development,” and “Sustainable Supply Chain” section
Principles 4 & 5
Businesses should uphold the elimination of all forms of forced and compulsory labor.Businesses should uphold the effective abolition of child labor.
Labor & human rights policy, Supplier Code of Conduct
“Business Ethics” and “Sustainable Supply Chain” section
Principle 6
Businesses should uphold the elimination of discrimination in respect of employment and occupation.
Labor & human rights policy, Diversity, Equity & Inclusion policy
“Business Ethics” & “Diversity and Inclusion” sections
Principle 7
Businesses should support a precautionary approach to environmental challenges.
Environmental Policy “Energy and emissions” & “Resource management” sections
Principle 8
Businesses should undertake initiatives to promote greater environmental responsibility.
Environmental Policy “Leading the industry through collaborative action,” “Strategy,” “Energy transition in action,” “Sustainable supply chain,” & “Resource management” sections
Principle 9
Businesses should encourage the development and diffusion of environmentally friendly tech-nologies.
Quality Policy, Environmental Policy “Energy transition in action” and “Technology & Innovation” sections
Principle 10
Businesses should work against corruption in all its forms, including extortion and bribery.
Code of Conduct, Supplier Code of Conduct
“Business Ethics” section
TABLE OF CONTENTS 129128 INDEX TABLES TCFD INDEX UN GLOBAL COMPACT INDEXINDEX TABLES

130 131TABLE OF CONTENTS
INNIO Group Holding GmbH, JenbachIndependent Assurance Report on the Non-financial Report
in line with the GRI Standards as of 31 December 2021
ToThe Management TeamINNIO Group Holding GmbHJenbach
This English language independent assurance report is a translation provided for information pur-poses only. The original German text shall prevail in the event of any discrepancies between the English translation and the German original. We do not accept any liability for the use of, or reliance on, the English translation nor for any errors or misunder-standings that may derive from the translation.
Independent Assurance Report on the Non-financial Reporting in line with the GRI standards
We have performed an independent limited assur-ance engagement on the combined consolidated non-financial report (“NFI report”) for the financial year 2021, which has been published as the Sus-tainability report 2021 of
INNIO Group Holding GmbH,Jenbach, (referred to as “INNIO” or “the Company”).
CONCLUSIONBased on the procedures performed and the evidence we have obtained, nothing has come to our attention that causes us to believe that the NFI report of the Company is not in accordance with the sustainability reporting guidelines of the Global Reporting Initiative (GRI Standards) Option “Core” in all material respects.
MANAGEMENT’S RESPONSIBILITYThe Company’s management is responsible for the proper preparation of the NFI report in accordance with the reporting criteria. The Company applies the sustainability reporting guidelines of the Global Reporting Initiative (GRI Standards) Option “Core” as reporting criteria.
The Company’s management is responsibile for the selection and application of appropriate
methods for non-financial reporting (especially the selection of significant matters) as well as the use of appropriate assumptions and estimates for indi-vidual non-financial disclosures, given the circum-stances. Furthermore, their responsibilities include the design, implementation and maintenance of systems, processes and internal controls that are relevant for the preparation of the sustainability report in a way that is free of material misstate-ments—whether due to fraud or error.
AUDITORS’ RESPONSIBILITY Our responsibility is to state whether, based on our procedures performed and the evidence we have obtained, anything has come to our attention that causes us to believe that the Company’s NFI report is not in accordance with the sustainability report-ing guidelines of the Global Reporting Initiative (GRI Standards) Option “Core” in all material respects.
Our engagement was conducted in conformi-ty with the International Standard on Assurance Engagements (ISAE 3000) applicable to such en-gagements. These standards require us to comply with our professional requirements including inde-pendence requirements, and to plan and perform the engagement to enable us to express a con-clusion with limited assurance, taking into account materiality.
An independent assurance engagement with the purpose of expressing a conclusion with limited assurance (“limited assurance engagement”) is substantially less in scope than an indepen-dent assurance engagement with the purpose of expressing a conclusion with reasonable assur-ance (“reasonable assurance enagement”), thus providing reduced assurance. Despite diligent engagement planning and execution, it cannot be ruled out that material misstatements, illegal acts, or irregularities within the non-financial report will remain undetected.
ESG ASSURANCE TO THE MANAGEMENT TEAM
The procedures selected depend on the auditor’s judgment and included the following procedures in particular:
– Inquiries of personnel at the group level, who are responsible for the materiality analysis, in order to gain an understanding of the processes for determining material sustainability topics and respective reporting thresholds of the Company;
– A risk assessment, including a media analysis, on relevant information on the Company’s sustainability performance in the reporting period;
– Evaluation of the design and implementation of the systems and processes for the collection, processing and monitoring of disclosures on environmental, social and employee matters, respect for human rights, anti-corruption as well as bribery, and also includes the consolidation of data;
– Inquiries of personnel at the group level, who are responsible for providing, consolidating, and implementing internal control procedures relating to the disclosure of concepts, risks, due diligence processes, results, and performance indicators;
– Inspection of selected internal and external documents, in order to determine whether qualitative and quantitative information is supported by sufficient evidence and presented in an accurate and balanced manner; – Assessment of the processes for local data collection, validation and reporting, as well as the reliability of the reported data through a survey performed on a sample basis at the Jenbach site, Austria;
– Analytical evaluation of the data and trend of quantitative disclosures regarding the GRI Standards listed in the GRI-Index, submitted by all locations for consolidation at the group level; – Evaluation of the consistency and application of the GRI Standards, Option “Core” to disclosures and indicators of the NFI report, which apply to the Company;
– Evaluation of the overall presentation of the disclosures by critically reading the NFI report.
ESG ASSURANCE TO THE MANAGEMENT TEAM

132
Dr Olaf Berlien President & Chief Executive Officer
For the INNIO Group Holding GmbHThe procedures that we performed do not constitute an audit or a review. Our engage-ment did not focus on revealing and clarifying of illegal acts (such as fraud), nor did it focus on assessing the efficiency of management. Furthermore, it is not part of our en-gagement to audit future-related disclosures, prior year figures, statements from external sources of information, expert opinions, or references to more extensive external reporting formats of the Company.
RESTRICTION ON USEBecause our report will be prepared solely on behalf of and for the benefit of the principal, its contents may not be relied upon by any third party, and consequently, we shall not be liable for any third party claims. We agree to the publication of our assurance certificate and NFI report. However, publication may only be performed in its entirety and as a version that has been certified by us.
GENERAL CONDITIONS OF CONTRACT Our responsibility and liability towards the Company and any third party is subject to paragraph 7 of the General Conditions of Contract for the Public Accounting Professions.
KPMG Austria GmbHWirtschaftsprüfungs- und Steuerberatungsgesellschaft
Mag. Michael NayerWirtschaftsprüfer (Austrian Chartered Accountant)
Dr Dennis Schulze Chief Financial Officer
Dr Klaus-Peter Weber Executive General Counsel & Chief Compliance Officer
Jenbach, 20 June, 2022
ESG ASSURANCE TO THE MANAGEMENT TEAM

ENERGY SOLUTIONS.EVERYWHERE, EVERY TIME.
INNIO is a leading energy solution and service provider that empowers industries and communities to make sustainable energy work today. With our product brands Jenbacher and Waukesha and our digital platform myPlant, INNIO offers innovative solutions for the power generation and compression segments that help industries and communities generate and manage energy sustainably while navigating the fast-changing landscape of traditional and green energy sources. We are individual in scope, but global in scale. With our flexible, scalable, and resilient energy solutions and services, we are enabling our customers to manage the energy transition along the energy value chain wherever they are in their transition journey.
INNIO is headquartered in Jenbach (Austria), with other primary operations in Waukesha (Wisconsin, U.S.) and Welland (Ontario, Canada). A team of more than 3,500 experts provides life-cycle support to the more than 54,000 delivered engines globally through a service network in more than 80 countries.
INNIO has received recognition by ESG rating agencies for our sustainability efforts. The rating of 11-“Low risk level” from Sustainalytics* ranks the INNIO Group number one in the Machinery industry, and INNIO Jenbacher received the Gold Medal from EcoVadis.
For more information, visit INNIO’s website at www.innio.com. Follow INNIO on
* as of February 2022
© Copyright 2022 INNIO.Information provided is subject to change without notice.
INNIO, , Jenbacher, , myPlant, Waukesha are trademarks in the European Union or elsewhere owned by INNIO Jenbacher GmbH & Co OG or one of its affiliates. All other trademarks and company names are property of their respective owners.
Related Documents