Today’s MEDICAL PRACTICE Coding Productivity Benchmarks How your peers are doing — do you measure up? WHITE PAPER Do you measure up?

Welcome message from author
This document is posted to help you gain knowledge. Please leave a comment to let me know what you think about it! Share it to your friends and learn new things together.
Transcript
Today’s MEDICAL PRACTICE
Coding Productivity BenchmarksHow your peers are doing — do you measure up?
WHITE PAPER
Do you measure up?

www.decisionhealth.com | Toll-free: 1-855-CALL-DH1 | Fax: 1-301-287-2535Two Washingtonian Center, 9737 Washingtonian Blvd., Ste. 502, Gaithersburg, MD 20878-7364
2
Introduction
When it comes to coding productivity, today’s medical practices are hard pressed to
ensure their coders peform at levels that keep reimbursements flowing to meet financial
goals. Your practice’s continued profitability hinges upon their ability to stay productive,
accurate and efficient. There is a lot of noise that can distract coders from this primary
purpose. Medical practice decision makers must stay current on resources available
to them to ensure their coders are adequately equipped to meet new and challenging
distractions; or go under. This white paper illustrates the top productivity benchmarks to
help you compare your own productivity and assess how your coders measure up based
on 4 key metrics. It will also expose the recipe for a high achieving coding department
(hint: stack your department with coders that match this profile) and lastly the broader
trends related to evolving coder responsibilities.
WHAT’S INSIDE:
Introduction ........................................... 2
Executive Summary .............................. 3
Productivity metrics for coders ......... 4
Coding metrics by practice size, location .................................................... 9
Profile of a productive coder ...........12
Trends in coder responsibility .........15
Conclusion ............................................18

www.decisionhealth.com | Toll-free: 1-855-CALL-DH1 | Fax: 1-301-287-2535Two Washingtonian Center, 9737 Washingtonian Blvd., Ste. 502, Gaithersburg, MD 20878-7364
3
EXECUTIVE SUMMARY
Establishing coder productivity standards can be difficult because you must take various factors into
account, and there are no apple-to-apple comparisons on which you can base your own requirements.
However, medical practice managers and administrators can develop coder productivity standards by
learning from their peers. DecisionHealth surveyed 178 medical practice administrative professionals
— including 90 coders — to determine benchmarks for productivity by measuring common repetitive
activities: charts reviewed, claims coded, claims submitted and denials appealed.
Some of the key findings are:
` Productivity of medical practice coders varies by specialty. Orthopedic and pain
management coders have the highest per-day average of claims coded at 94 and 93, respectively.
Otolaryngology (26), urology (38) and gastroenterology (39) have the lowest average numbers of
claims coded per day.
` The most experienced coders are not the most productive. Generally, coders with six to 10
years of experience in medical administration had the highest averages on productivity metrics.
Interestingly, coders who had less than a year or more than 20 years of experience had similar
productivity numbers, according to the survey.
` Coders use online coding tools more than reference books. Only official manuals, which
100% of coders employed to code, were more widely used than online coding tools (87%).
Reference books were used by 72% of coders and payer/carrier websites were used by 70% of
that group.
The results of the survey are a snapshot into coder productivity and their current job responsibilities. But
increasingly, coders are asked to diversify their roles at their practices, adding management, billing and
compliance responsibilities. Those factors could affect productivity benchmarks in the future.

www.decisionhealth.com | Toll-free: 1-855-CALL-DH1 | Fax: 1-301-287-2535Two Washingtonian Center, 9737 Washingtonian Blvd., Ste. 502, Gaithersburg, MD 20878-7364
4
Productivity metrics for coders
Coders in medical practices have a variety of tasks to perform as part of their daily workflow.
The survey measured four metrics that demonstrate a coder’s productivity: charts reviewed,
claims coded, claims submitted and denials appealed. While not every coder performs each
task, the ones captured illustrate the expanding role for coders.
Overall, the coders in the study averaged these metrics for productivity on those topics:
ALL CODERS (AVERAGE PER DAY)
Separating those metrics by specialty shows variation in productivity. (Note that the all coder average
contains more specialties than are listed on the following pages.)
0 20 40 60 80 100
Denials appealed
Claims submitted
Claims Coded
Charts Reviewed
Coder Averages (first page)
78
89
79
4
AVERAGE PER DAY

www.decisionhealth.com | Toll-free: 1-855-CALL-DH1 | Fax: 1-301-287-2535Two Washingtonian Center, 9737 Washingtonian Blvd., Ste. 502, Gaithersburg, MD 20878-7364
5
CHARTS REVIEWED
0 20 40 60 80 100
Urology
Radiology
Primary care
Pediatrics
Pain management
Otolaryngology
Orthopedics
Obstetrics/gynecology
General surgery
Gastroenterology
Cardiology
Anesthesia
All coder average
CHART 1 Charts reviewed per day, by specialty
78
83 61
31
41 50
72 32
68 50
72
32
86
NUMBER OF CHARTS REVIEWED PER DAY
Coders in radiology and anesthesiology have the highest chart-per-day review averages at 86 and 83,
respectively. Primary care — which includes family practice, general practice and internal medicine —
and orthopedic coders review an average of 72 claims per day, also among the highest averages.
Conversely, gastroenterology (31 charts reviewed per day), otolaryngology (32) and urology (32) coders
had the lowest averages of charts reviewed per day.

www.decisionhealth.com | Toll-free: 1-855-CALL-DH1 | Fax: 1-301-287-2535Two Washingtonian Center, 9737 Washingtonian Blvd., Ste. 502, Gaithersburg, MD 20878-7364
6
CLAIMS CODED
While coding isn’t the only task many coders perform, it’s the main one. Almost 99% of coders do
diagnosis coding while 92% do E/M and procedure coding.
89 75
58
39 49
53 94
26
93 46
82
59
CHART 2 Claims coded per day, by specialty
0 20 40 60 80 100
Urology
Radiology
Primary care
Pediatrics
Pain management
Otolaryngology
Orthopedics
Obstetrics/gynecology
General surgery
Gastroenterology
Cardiology
Anesthesia
All coder average
38
CLAIMS CODED PER DAY
Orthopedics has the highest average number of claims coded per day at 94. At one orthopedic practice
DecisionHealth interviewed, a program embedded in the electronic health record (EHR) system helped
physicians drill down to the most specific ICD-10 codes with drop-down menus. The EHR would prompt
them to answer questions about laterality and initial, subsequent and sequela encounters for fractures.
That program helped ease code selection.
Pain management coders also had a high number of per-day claims coded at 93, followed by primary
care with an average of 82 and anesthesia with an average of 75.
Among the lowest averages for claims coded per day were otolaryngology (26), urology (38) and
gastroenterology (39).

www.decisionhealth.com | Toll-free: 1-855-CALL-DH1 | Fax: 1-301-287-2535Two Washingtonian Center, 9737 Washingtonian Blvd., Ste. 502, Gaithersburg, MD 20878-7364
7
CLAIMS SUBMITTED
Coders no longer are tasked with just selecting codes, according to the DecisionHealth survey.
Increasingly, they are taking on billing responsibilities. In fact, 53% of coders said they perform billing
functions daily and almost 40% file claims.
79 56
32
57
42 45
14 66
108
28 65
34
30
CHART 3 Claims submitted per day, by specialty
0 20 40 60 80 100 120
Urology
Radiology
Primary care
Pediatrics
Pain management
Otolaryngology
Orthopedics
Obstetrics/gynecology
General surgery
Gastroenterology
Cardiology
Anesthesia
All coder average
CLAIMS SUBMITTED PER DAY
Submitting claims is most prevalent at orthopedic practices where coders average 108 claims submitted
per day, according to the survey. That’s far above the all-coder average of 79 claims submitted.
Pain management coders submit an average of 66 claims per day and primary care coders submit an
average of 65 claims per day.
Practices where coders provide billing functions less often not surprisingly have lower average claims
submitted per day. For example, just 27% of otolaryngology coders perform billing functions daily, and
that may account for the low claims-submitted-per-day average of 14. Similarly, 18% of pediatric coders
perform billing functions daily, and coders in that specialty submit an average of 28 claims per day.

www.decisionhealth.com | Toll-free: 1-855-CALL-DH1 | Fax: 1-301-287-2535Two Washingtonian Center, 9737 Washingtonian Blvd., Ste. 502, Gaithersburg, MD 20878-7364
8
DENIALS APPEALED
Appealing claims denials is a task that 16% of coders perform daily, 29% perform weekly and 11%
perform monthly.
4
1 9
10 10
9 6
9 7
10
9
10
CHART 4 Denials appealed per day, by specialty
0 2 4 6 8 10
Urology
Radiology
Primary care
Pediatrics
Pain management
Otolaryngology
Orthopedics
Obstetrics/gynecology
General surgery
Gastroenterology
Cardiology
Anesthesia
All coder average
DENIALS APPEALED PER DAY
Coders in gastroenterology, general surgery, pediatrics, radiology and urology appeal an average of 10
claims per day. Cardiology, obstetrics/gynecology, otolaryngology and primary care coders appeal an
average of nine claims per day.
Anesthesia coders average just one appeal per day, notably fewer than their counterparts in other
specialties. But interestingly, 60% of anesthesiology coders said they never appeal claims denials, which
relates to the specialty’s low number of denials appealed per day.
www.decisionhealth.com | Toll-free: 1-855-CALL-DH1 | Fax: 1-301-287-2535Two Washingtonian Center, 9737 Washingtonian Blvd., Ste. 502, Gaithersburg, MD 20878-7364
9
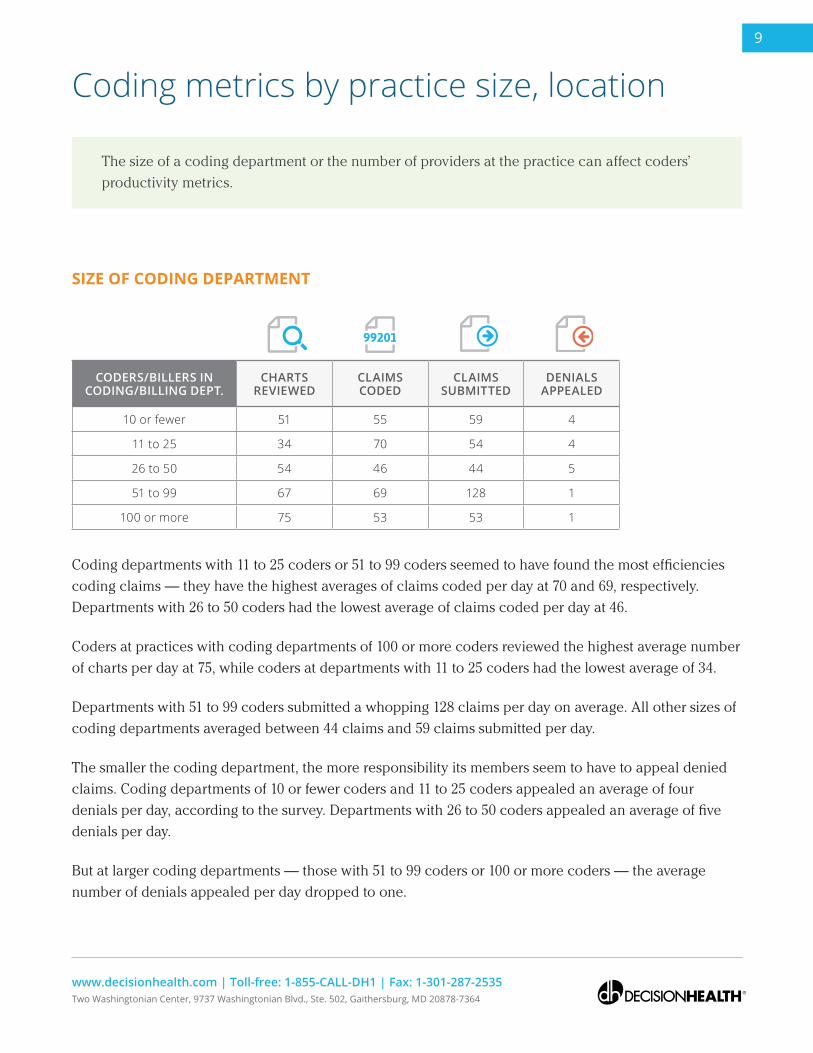
Coding metrics by practice size, location
The size of a coding department or the number of providers at the practice can affect coders’
productivity metrics.
SIZE OF CODING DEPARTMENT
CODERS/BILLERS IN CODING/BILLING DEPT.
CHARTS REVIEWED
CLAIMS CODED
CLAIMS SUBMITTED
DENIALS APPEALED
10 or fewer 51 55 59 4
11 to 25 34 70 54 4
26 to 50 54 46 44 5
51 to 99 67 69 128 1
100 or more 75 53 53 1
Coding departments with 11 to 25 coders or 51 to 99 coders seemed to have found the most efficiencies
coding claims — they have the highest averages of claims coded per day at 70 and 69, respectively.
Departments with 26 to 50 coders had the lowest average of claims coded per day at 46.
Coders at practices with coding departments of 100 or more coders reviewed the highest average number
of charts per day at 75, while coders at departments with 11 to 25 coders had the lowest average of 34.
Departments with 51 to 99 coders submitted a whopping 128 claims per day on average. All other sizes of
coding departments averaged between 44 claims and 59 claims submitted per day.
The smaller the coding department, the more responsibility its members seem to have to appeal denied
claims. Coding departments of 10 or fewer coders and 11 to 25 coders appealed an average of four
denials per day, according to the survey. Departments with 26 to 50 coders appealed an average of five
denials per day.
But at larger coding departments — those with 51 to 99 coders or 100 or more coders — the average
number of denials appealed per day dropped to one.

www.decisionhealth.com | Toll-free: 1-855-CALL-DH1 | Fax: 1-301-287-2535Two Washingtonian Center, 9737 Washingtonian Blvd., Ste. 502, Gaithersburg, MD 20878-7364
10
NUMBER OF PROVIDERS IN THE PRACTICE
NUMBER OF PROVIDERS
CHARTS REVIEWED
CLAIMS CODED
CLAIMS SUBMITTED
DENIALS APPEALED
1 to 5 25 27 34 4
6 to 10 43 60 30 2
11 to 25 72 62 137 6
26 to 50 67 103 71 4
51 to 100 55 70 135 3
101 to 250 44 48 52 7
More than 250 60 44 35 2
Practices with one to five providers had the lowest daily average numbers of charts reviewed and claims
coded at 25 and 27, respectively. Their average claims submitted per day — 34 — was the second lowest
behind practices with six to 10 providers.
But being larger doesn’t mean you’ll have more productive coders. The biggest practices, those with more
than 250 providers, averaged per day 60 charts reviewed, 44 claims coded, 35 claims submitted and two
denials appealed.
The practices with the highest average of charts reviewed per day, 72, have 11 to 25 providers. The highest
average of claims coded was in the group of practices with 26 to 50 providers. And practices with 11 to 25
or 51 to 100 providers had the highest average number of claims submitted at 137 and 135, respectively.

www.decisionhealth.com | Toll-free: 1-855-CALL-DH1 | Fax: 1-301-287-2535Two Washingtonian Center, 9737 Washingtonian Blvd., Ste. 502, Gaithersburg, MD 20878-7364
11
LOCATION OF CODERS
LOCATION CHARTS REVIEWED
CLAIMS CODED
CLAIMS SUBMITTED
DENIALS APPEALED
Great Plains (KS, ND, NE, OK, SD) 29 64 131 4
Mid-Atlantic (DC, DE, MD, NJ, NY, PA, VA, WV) 143 88 192 2
Midwest (IA, IL, IN, MI, MN, MO, OH, WI) 101 103 65 3
New England (CT, MA, ME, NH, RI, VT) 91 174 136 14
Pacific (AK, CA, HI, OR, WA) 54 92 141 3
Rocky Mountains (CO, ID, MT, UT, WY) 49 94 45 1
Southeast (AL, AR, FL, GA, KY, LA, MS, NC, SC, TN) 70 73 47 8
Southwest (AZ, NM, NV, TX) 47 42 19 1
The data show an emphasis on different metrics based on location.
Charts reviewed: Mid-Atlantic, Midwest and New England states have the highest average charts
reviewed per day at 143, 101 and 91, respectively. Coders in the Great Plains (29), Southwest (47) and
Rocky Mountains (49) have the lowest averages.
Claims coded: Coders in New England average the highest number of claims coded per day (174) by
far. Midwest coders average 103 claims coded per day followed by the Rocky Mountains (94) and Pacific.
Coders in the Southwest average the fewest claims coded per day at 42.
Claims submitted: Coders in the Mid-Atlantic submit the most claims per day on average at 192. The
average for coders in the Southwest is just 19.
Denials appealed: The data show that some regions place more emphasis on coders appealing denials.
Coders in New England average 14 appealed denials per day, and coders in the Southeast average eight
denials appealed per day. Coders in the Rocky Mountains and Southwest average one denied claim per
day, indicating that task may not be among their responsibilities.

www.decisionhealth.com | Toll-free: 1-855-CALL-DH1 | Fax: 1-301-287-2535Two Washingtonian Center, 9737 Washingtonian Blvd., Ste. 502, Gaithersburg, MD 20878-7364
12
Profile of a productive coder
Experience and tools play roles in how productive coders are. But having more experience
doesn’t necessarily mean being more productive, the survey shows.
YEARS OF EXPERIENCE IN MEDICAL ADMINISTRATION
CHARTS REVIEWED
CLAIMS CODED
CLAIMS SUBMITTED
DENIALS APPEALED
Less than 1 year 68 56 36 3
1 to 5 years 90 137 116 2
6 to 10 years 108 115 129 11
11 to 20 years 83 92 65 6
More than 20 years 64 74 36 3
Coders with six to 10 years in medical administration have the highest daily averages of charts reviewed
(108), claims submitted (129) and denials appealed (11).
Their counterparts with one to five years in medical administration have the highest average of claims
coded at 137 a day.
Coders with more than 20 years of experience in medical administration on average reviewed 44 fewer
charts, coded 63 fewer charts, submitted 93 fewer claims and appealed eight fewer denials than the most
productive coders.
New coders — those with less than one year in medical administration — actually had similar numbers
to those with more than 20 years of experience, with the exception of average claims coded per day. New
coders code almost 20 fewer claims than their highly experienced counterparts.
www.decisionhealth.com | Toll-free: 1-855-CALL-DH1 | Fax: 1-301-287-2535Two Washingtonian Center, 9737 Washingtonian Blvd., Ste. 502, Gaithersburg, MD 20878-7364
13
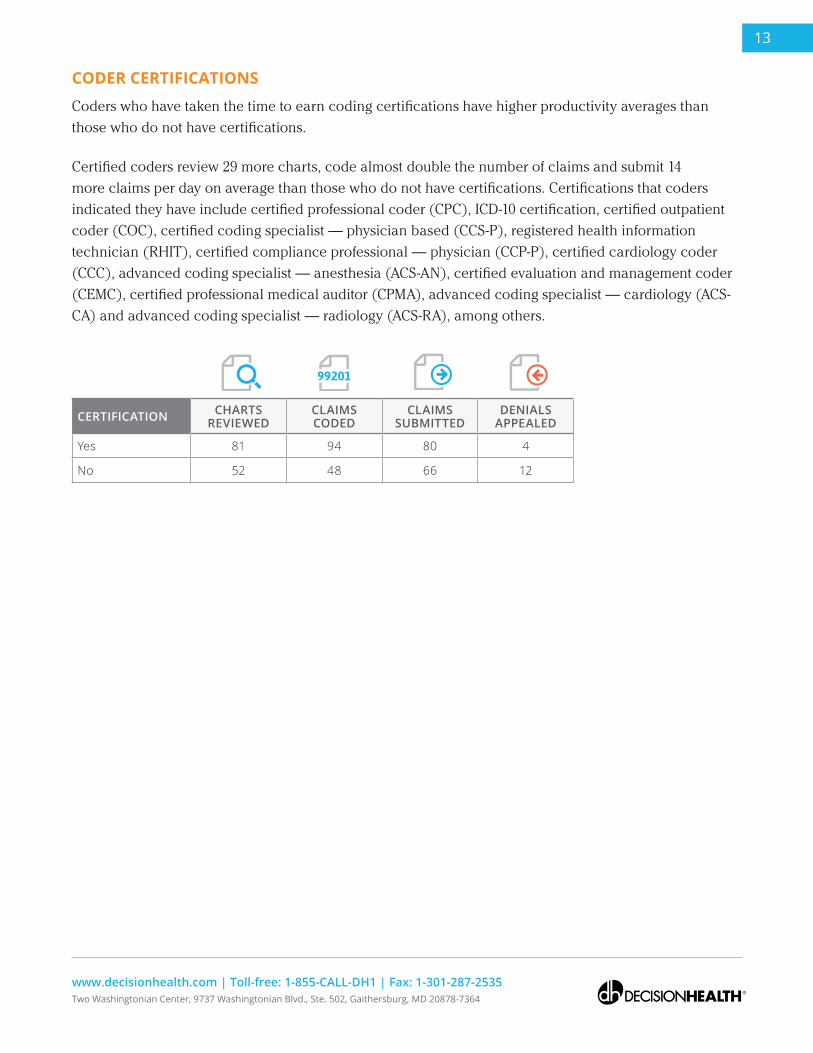
CODER CERTIFICATIONS
Coders who have taken the time to earn coding certifications have higher productivity averages than
those who do not have certifications.
Certified coders review 29 more charts, code almost double the number of claims and submit 14
more claims per day on average than those who do not have certifications. Certifications that coders
indicated they have include certified professional coder (CPC), ICD-10 certification, certified outpatient
coder (COC), certified coding specialist — physician based (CCS-P), registered health information
technician (RHIT), certified compliance professional — physician (CCP-P), certified cardiology coder
(CCC), advanced coding specialist — anesthesia (ACS-AN), certified evaluation and management coder
(CEMC), certified professional medical auditor (CPMA), advanced coding specialist — cardiology (ACS-
CA) and advanced coding specialist — radiology (ACS-RA), among others.
CERTIFICATION CHARTS REVIEWED
CLAIMS CODED
CLAIMS SUBMITTED
DENIALS APPEALED
Yes 81 94 80 4
No 52 48 66 12

www.decisionhealth.com | Toll-free: 1-855-CALL-DH1 | Fax: 1-301-287-2535Two Washingtonian Center, 9737 Washingtonian Blvd., Ste. 502, Gaithersburg, MD 20878-7364
14
RESOURCES CODERS USE
Coders use a variety of tools to help them increase accuracy and efficiency. Among them, online coding
tools are used by 87% of coders, second to only official manuals (CPT®, ICD-10, ASA Crosswalk).
Online coding tools also are used more often than reference books (Answer Books, Coder’s Desk
Reference, specialty specific books) and payer/carrier websites.
In fact, more than 80% of the most productive coders — the ones with one to five years or six to 10 years
of medical-administration experience — use online coding tools, the survey shows.
XXXXXXXXXXXXXXXXXXXXXXXXXXXXXXXXXXXXXX
Resources coders use to do their jobs
0 20 40 60 80 100
Other
Apps
Cheat sheets
EHR
Medical dictionary
Newsletters
Payer/carrier websites
Reference books
Online coding tools
Official manuals
8%
56%
59%
63%
66%
70%
87%
100%
72%
14%

www.decisionhealth.com | Toll-free: 1-855-CALL-DH1 | Fax: 1-301-287-2535Two Washingtonian Center, 9737 Washingtonian Blvd., Ste. 502, Gaithersburg, MD 20878-7364
15
Trends in coder responsibility
Assigning CPT or diagnosis codes to claims is the traditional role for a medical practice
coder, but that’s changing. A host of responsibilities are inching into coders’ job descriptions,
according to surveys conducted by DecisionHealth from 2012 to 2016.
Take note of these trends in new responsibilities:
APPEALING DENIED CLAIMSCoders Responsibilites (2012 to 2016)
0
20
40
60
80
100
20162015201420132012
41% 45%50% 51%
60%
` Appealing denied claims: The percentage of coders
performing this task has steadily increased from 2012 when
41% of coders said they appeal denied claims to 2016 when
the figure was 60%.
BILLINGCoders Responsibilites (2012 to 2016)
0
20
40
60
80
100
201620152014201320120%0%
55% 54%
79%
` Billing: Performing billing functions jumped 44% since
2014. In that year, 55% of coders said they completed billing
tasks; in 2016, that number jumped to 79%. (Note: This
option was not offered as a response in 2012 or 2013.)
19% increase over 4 years
24% jump from 2015 to 2016

www.decisionhealth.com | Toll-free: 1-855-CALL-DH1 | Fax: 1-301-287-2535Two Washingtonian Center, 9737 Washingtonian Blvd., Ste. 502, Gaithersburg, MD 20878-7364
16
PERFORMING COMPLIANCE-RELATED ACTIVITIESCoders Responsibilites (2012 to 2016)
0
20
40
60
80
100
201620152014201320120% 0%
74% 76% 79%
FILING CLAIMSCoders Responsibilites (2012 to 2016)
0
20
40
60
80
100
20162015201420132012
30% 32%39% 40%
47%
` Performing compliance-related activities: Because
of the nature of medical practice coding, compliance
is essential, but coders have been taking on more
compliance-related activities, according to the surveys.
In 2014, 74% of respondents noted that they performed
compliance-related activities as part of their jobs; that
number increased to 79% in 2016. (Note: This option
was not offered as a response in 2012 or 2013.)
` Filing claims: Traditionally a billing function, this
task has become more common for coders to the point
in which almost half of coders in 2016 reported filing
claims as part of their jobs. Just 30% said so in 2012 —
that’s a 17% increase over four years.
CONDUCTING AUDITS/INTERNAL REVIEWCoders Responsibilites (2012 to 2016)
0
20
40
60
80
100
20162015201420132012
71%
56%
69% 73% 73%
` Conducting audits/internal review: This task was
common for coders in 2012 when 71% of them reported
conducting audits/internal review was part of their jobs.
The number dropped to 56% in 2013 but climbed back
up to 73% in 2016.
5% rise over 2 years
17% increase over 4 years
Subtle 2% increase by 2016

www.decisionhealth.com | Toll-free: 1-855-CALL-DH1 | Fax: 1-301-287-2535Two Washingtonian Center, 9737 Washingtonian Blvd., Ste. 502, Gaithersburg, MD 20878-7364
17
QUERYING CLINICIANS ABOUT DOCUMENTATIONCoders Responsibilites (2012 to 2016)
0
20
40
60
80
100
201620152014201320120% 0%
89% 93%97%
` Querying clinicians about documentation: Because
of the preparation for the switch to the ICD-10 code set,
it’s not surprising that coders have increasingly found
themselves asking clinicians for more details. The
percentage of coders who asked clinicians for details
rose from 89% in 2014 to 97% in 2016, the surveys show.
(Note: This option was not offered as a response in 2012
or 2013.)
8% climb over 2 years

www.decisionhealth.com | Toll-free: 1-855-CALL-DH1 | Fax: 1-301-287-2535Two Washingtonian Center, 9737 Washingtonian Blvd., Ste. 502, Gaithersburg, MD 20878-7364
18
Conclusion
DecisionHealth’s surveys show that coding — assigning procedural or diagnosis codes to claims
based on provider documentation — continues to be the main task of those with the title of
coder or coding specialist.
But they also show that coders and coding specialists need to expand their skills and take advantage of
resources to become efficient and productive at all of the tasks now under their purview.
This report has shown these key elements of understanding medical coder productivity:
` Coder productivity is measured in a variety of ways but commonly charts reviewed, claims
coded, claims submitted and denials appealed. Coders average 89 claims coded per day, but that
number fluctuates depending on the specialty.
` The most experienced coders aren’t necessarily the most productive. The most productive
coders — those with the highest average number of claims coded per day — were those with one
to five years of experience.
` Successful coders are certified. Averages of productivity metrics are notably higher for coders
who have certifications — such as CPC, CCS-P, CCP-P and certified evaluation and management
coder (CEMC). And almost all coders (93%) have a coding certification.
` Online coding tools are used more often than reference books and even payer/carrier websites. A full 87% of coders use online coding tools, making those tools the second most used
resource behind only official manuals.
DEMOGRAPHICS:
Of the 178 total survey takers, 90 respondents were coders
` All respondents (note that most of the data is coders only, but this is an overview of everyone):
ā 33% have some college education but no degree, and 47% have a two-year or four-year
college degree
ā 66% have a coding certification
ā 97% are female
www.decisionhealth.com | Toll-free: 1-855-CALL-DH1 | Fax: 1-301-287-2535Two Washingtonian Center, 9737 Washingtonian Blvd., Ste. 502, Gaithersburg, MD 20878-7364
19
ā 74% are between ages 36 and 60
ā 41% work for a physician-owned medical practice, 9% work for a health system, 9% work
for a multi-specialty group
ā 55% work 40 to 44 hours per week
` Just coders:
ā 37% have some college education but no degree, and 44% have a two-year or four-year
college degree
ā 93% have a coding certification
ā 99% are female
ā 78% are between ages 36 and 60
ā 37% work for a physician-owned medical practice, 10% work for a hospital-owned practice
ā 71% work 40 to 44 hours per week
For 30 years, DecisionHealth has been the industry’s leading source for coding, compliance and billing and reimbursement resources. From current news coverage, analysis and instructional guidance, medical practice providers and their staffs continue to rely on the high-quality information our unique blend of award-winning on-staff editorial professionals, health care executives and experts deliver day in and day out. From leading brands including Part B News, Coder’s Pink Sheets and SelectCoder, our customers are always well-equipped to make the best business decision on issues affecting their operations.
SelectCoder is DecisionHealth’s all-in-one online coding solution that simplifies medical practice coder processes to save them time and improve practice profitability. With cutting edge features that improve coder accuracy and productivity, they get to the right code faster to submit error-free clams and ensure full reimbursement. No matter the provider size, specialty or location, SelectCoder has an access level to meet any medical practice’s needs and budget.
Related Documents