Today we are covering from the specification:

Today we are covering from the specification:. Investigating Populations - Key Terms Habitat Abundance Random sampling Systematic sampling Quadrat Transect.
Dec 21, 2015
Welcome message from author
This document is posted to help you gain knowledge. Please leave a comment to let me know what you think about it! Share it to your friends and learn new things together.
Transcript
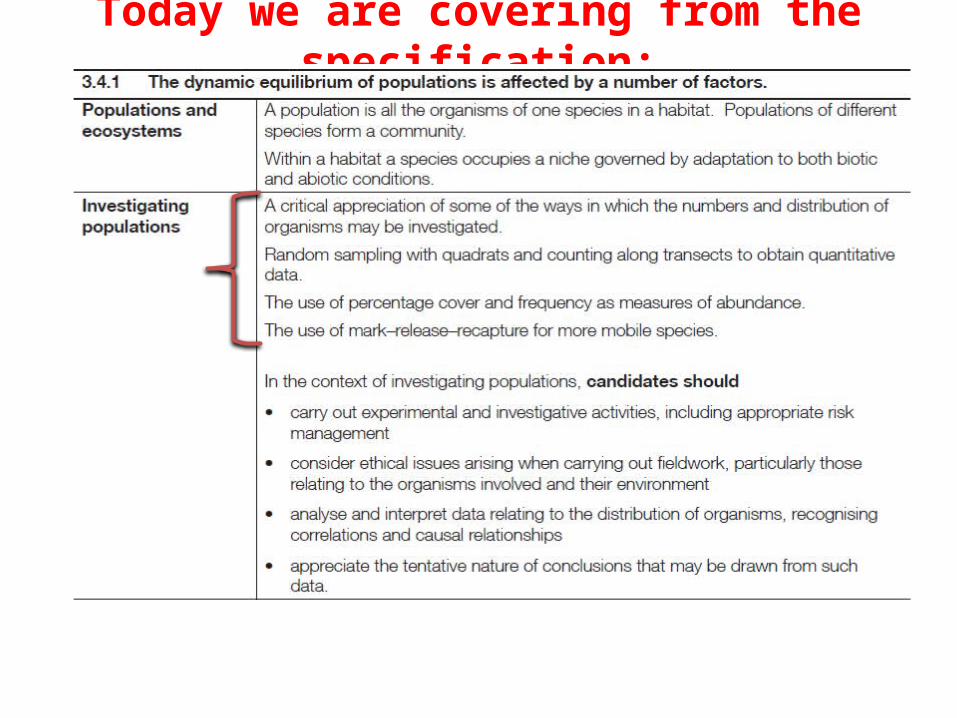
Today we are covering from the specification:
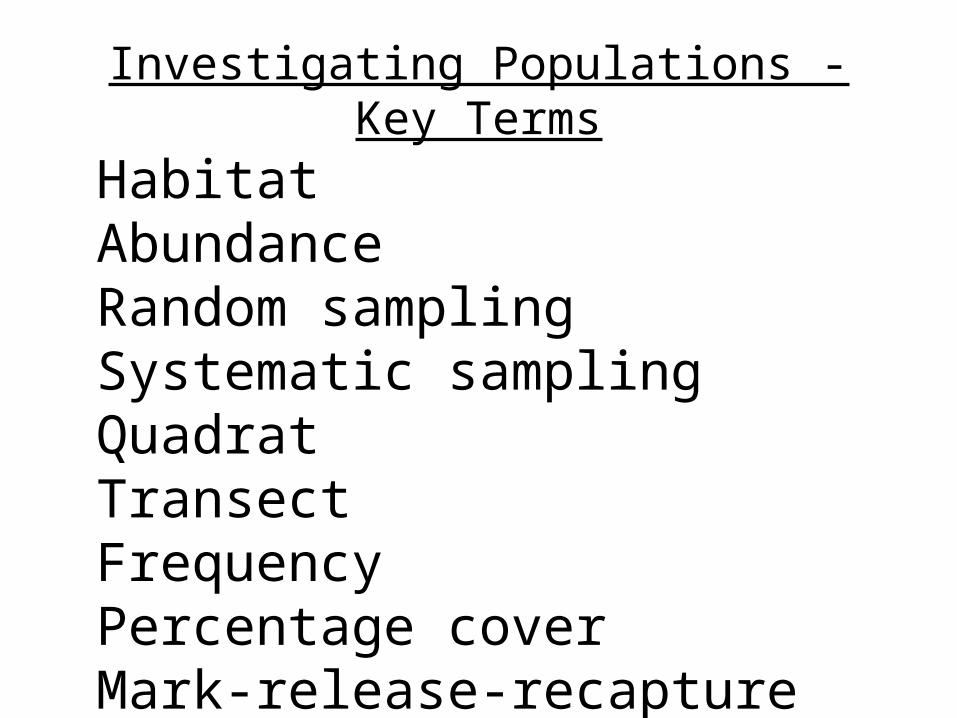
Investigating Populations - Key Terms
HabitatAbundanceRandom samplingSystematic samplingQuadratTransectFrequencyPercentage coverMark-release-recapture

Studying Habitats
• When studying a habitat, ecologists will first estimate the populations of the species living there.
• The abundance of each species can never be known exactly, but sampling can give reasonably accurate estimates.
Why would it be wrong to try to count every individual of a population?
• Small samples are studied at random locations, and then scaled up to fit the entire habitat.
• There are of course, a range of ecological techniques at an ecologist’s disposal.
Definitions
Write a definition for the terms:
- Habitat
- Abundance
- Quantitative data
- Qualitative data

Introducing Sampling TechniquesThe approach to sampling can be in one of two ways:
1. Random2. Systematic
Random Sampling:This is usually employed when trying to eliminate bias. Two numbered axis can be laid out over the sample area. Generation of random numbers provides co-ordinates for areas to study.
Systematic Sampling:A similar grid is laid over the entire area, but samples are taken at regular intervals. Time-consuming... but more reliable?
How do we go about sampling in the field?
6 of 39 © Boardworks Ltd 2008
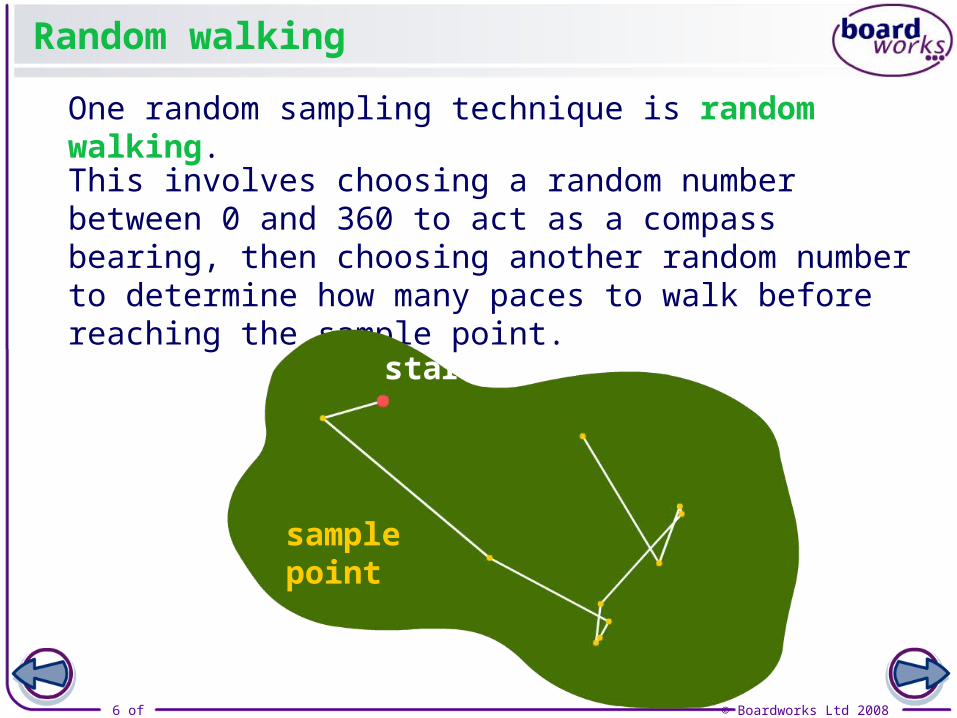
One random sampling technique is random walking.
This involves choosing a random number between 0 and 360 to act as a compass bearing, then choosing another random number to determine how many paces to walk before reaching the sample point.
Random walking
start
sample point
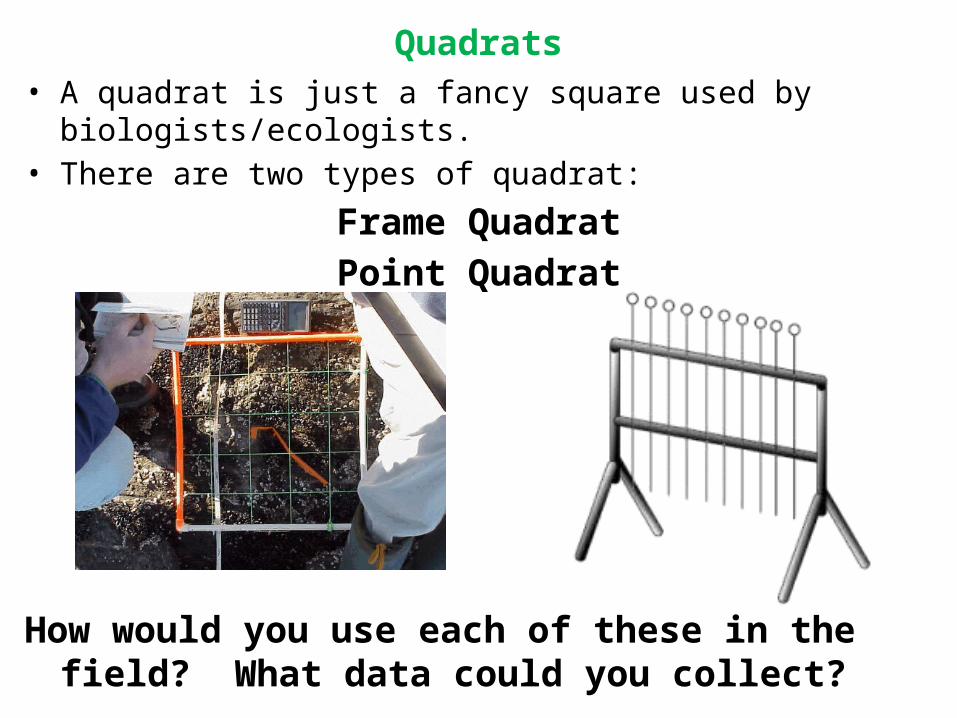
Quadrats• A quadrat is just a fancy square used by biologists/ecologists.• There are two types of quadrat:
Frame QuadratPoint Quadrat
How would you use each of these in the field? What data could you collect?
8 of 39 © Boardworks Ltd 2008
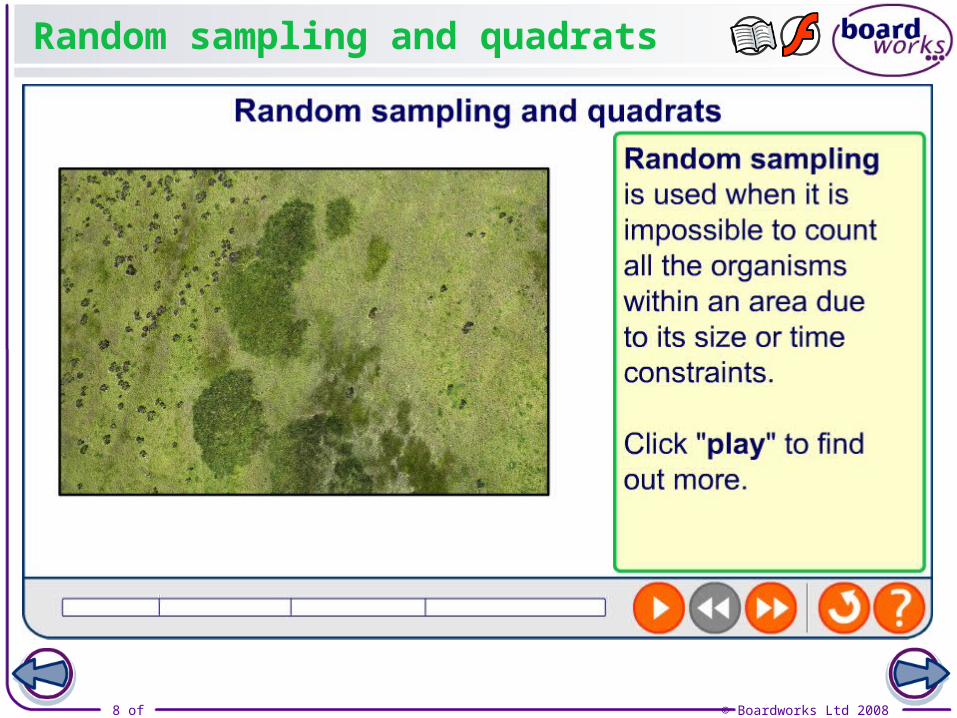
Random sampling and quadrats

More About QuadrattingThree things to consider when using quadrats:
1. The size of the quadrat:Depends on the size of species being investigated, or what kind of groups or colonies the species live in.
2. The number of samples being taken in the area:The more samples you take in the habitat, the more reliable the results will be - depends if time is an issue.
3. The position of each quadrat:Producing unbiased results within a small time-frame is the best idea. Random sampling would work well.
A problem that arises during quadrat sampling is the clumping of plants. To get around this... We measure the ‘mean density’ or
‘percentage cover’ instead.

How could you use a quadrat to estimate the population of daisies in this field?
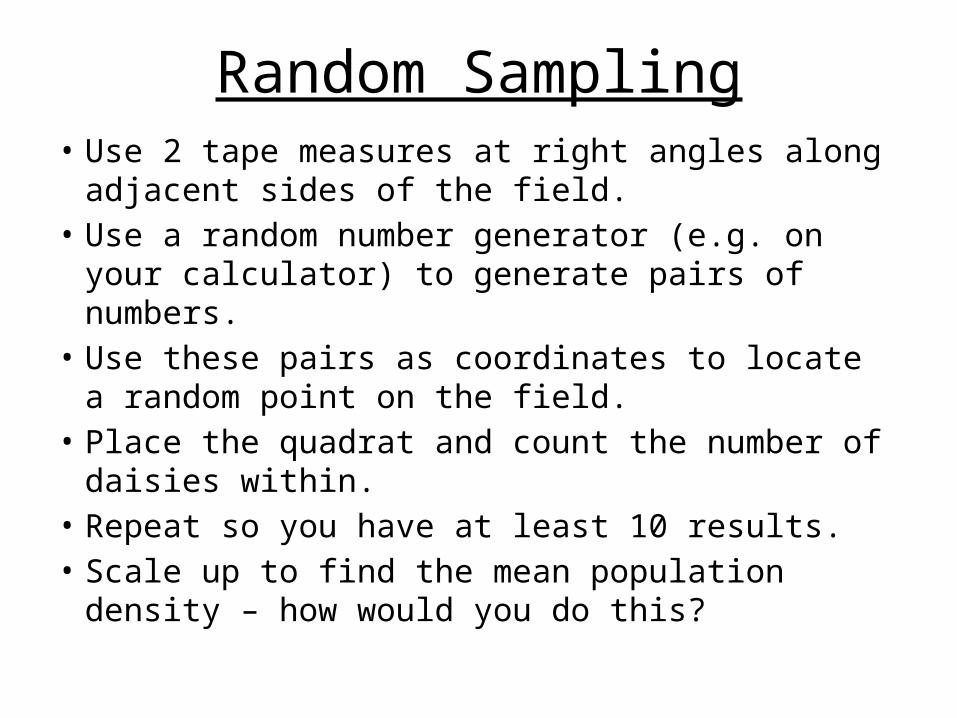
Random Sampling• Use 2 tape measures at right angles along adjacent
sides of the field.• Use a random number generator (e.g. on your
calculator) to generate pairs of numbers.• Use these pairs as coordinates to locate a random
point on the field.• Place the quadrat and count the number of daisies
within.• Repeat so you have at least 10 results.• Scale up to find the mean population density – how
would you do this?
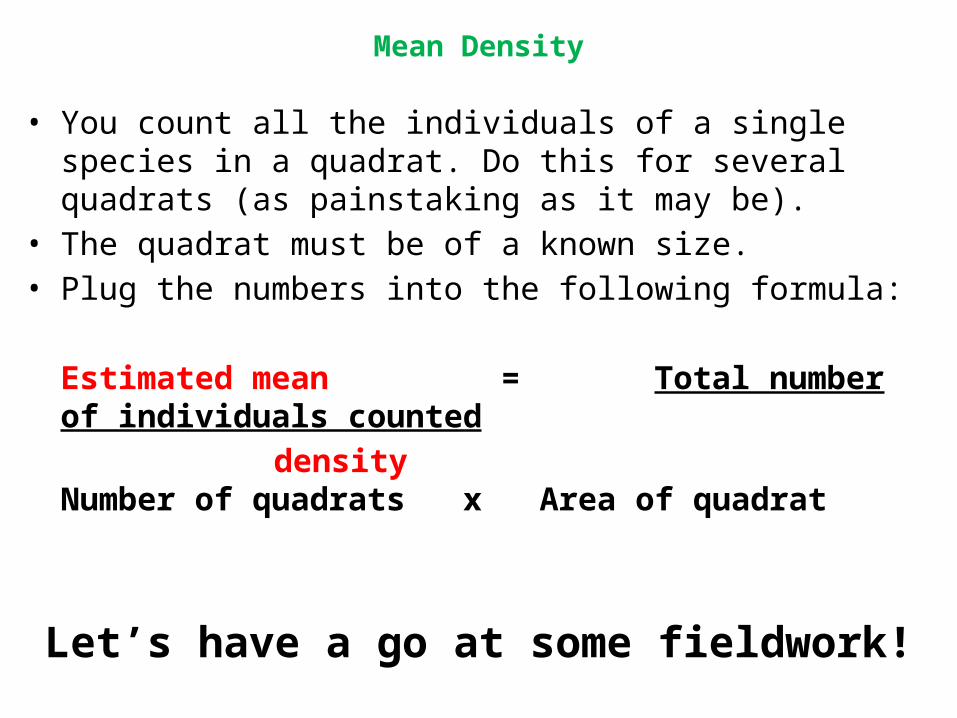
Mean Density
• You count all the individuals of a single species in a quadrat. Do this for several quadrats (as painstaking as it may be).
• The quadrat must be of a known size.• Plug the numbers into the following formula:
Estimated mean = Total number of individuals counted density Number of quadrats x Area of quadrat
Let’s have a go at some fieldwork!

What to do with your results
We use statistical tests to see if the results are significant.• Χ2 (Chi-squared) – used to test whether there is a
significant difference between your observed results and some theoretical expected data.
• Spearman’s rank – used to test for correlation between sets of data from the same sample.
• Standard error and 95% confidence limits – used to test for differences between mean values.

Standard Error and 95% Confidence Limits
• Is there a significant difference between the mean population densities in the two areas we tested?

You’ll get one of these in the
EMPA.

Statistics and EMPAs
- State null hypothesis
- Which test will you use?
- Why?
- Calculate test statistic
- Interpret the test statistic in relation to your null hypothesis. Use the words probability and chance in your answer.

Null hypothesis
Results of an experiment could be due to random chance.
Only way to support your hypothesis is to reject a null hypothesis.
Null hypothesis states there is no link/correlation/difference between results.
→ Depends on statistical test used.

Probabilities
• We normally work at the 5% probability level (P=0.05).
• To reject the null hypothesis (and accept your own hypothesis), you must be sure that there is ≤5% probability that the results are due to chance.
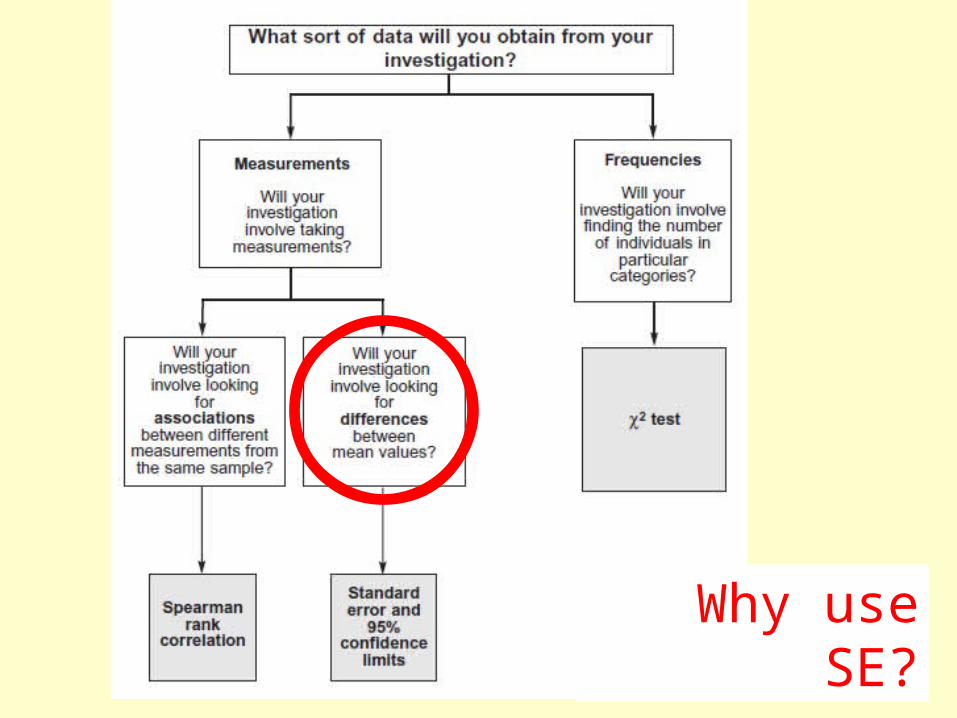
Why use SE?
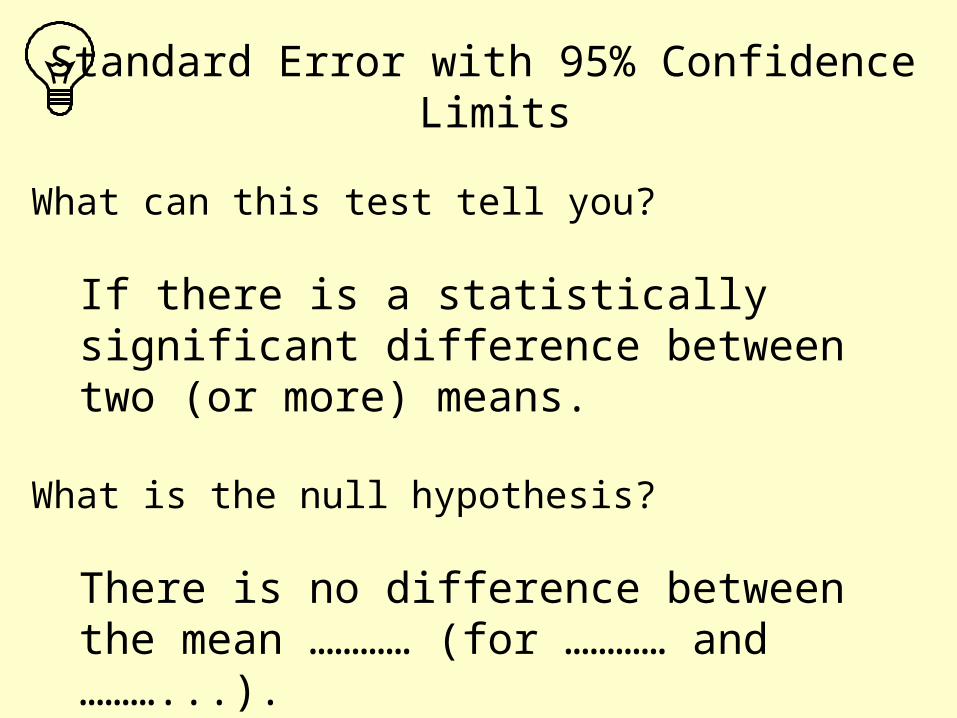
What can this test tell you?
If there is a statistically significant difference between two (or more) means.
What is the null hypothesis?
There is no difference between the mean ………… (for ………… and ………...).
Standard Error with 95% Confidence Limits

Worked example
A student investigated the variation in the length of mussel shells on two different locations on a rocky shore.
The student measured the shell length of 10 mussels at each location.
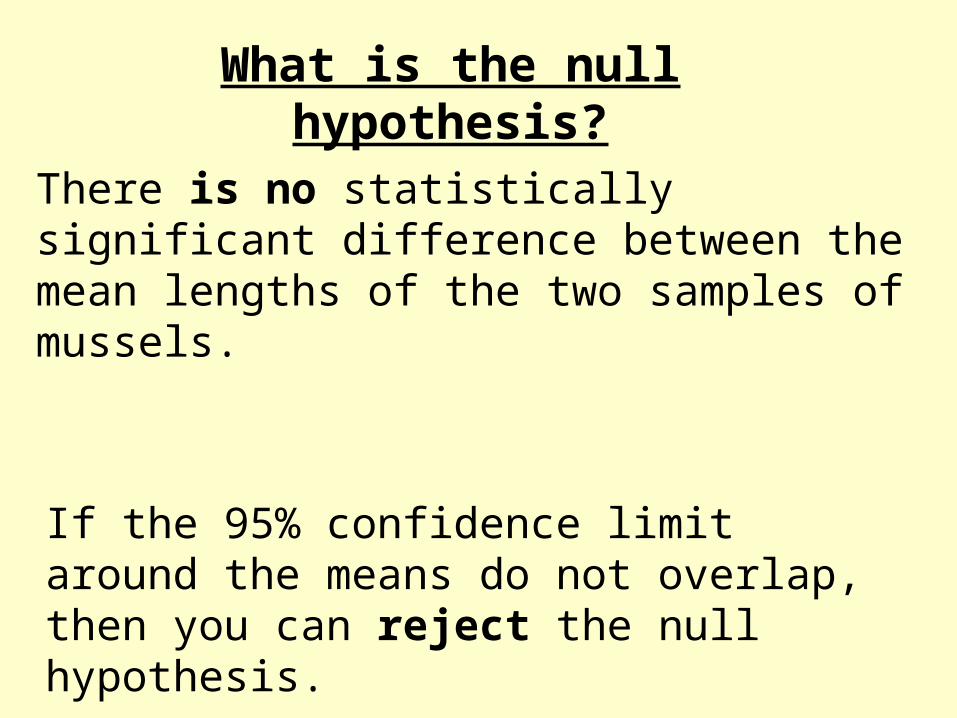
There is no statistically significant difference between the mean lengths of the two samples of mussels.
If the 95% confidence limit around the means do not overlap, then you can reject the null hypothesis.
What is the null hypothesis?

e
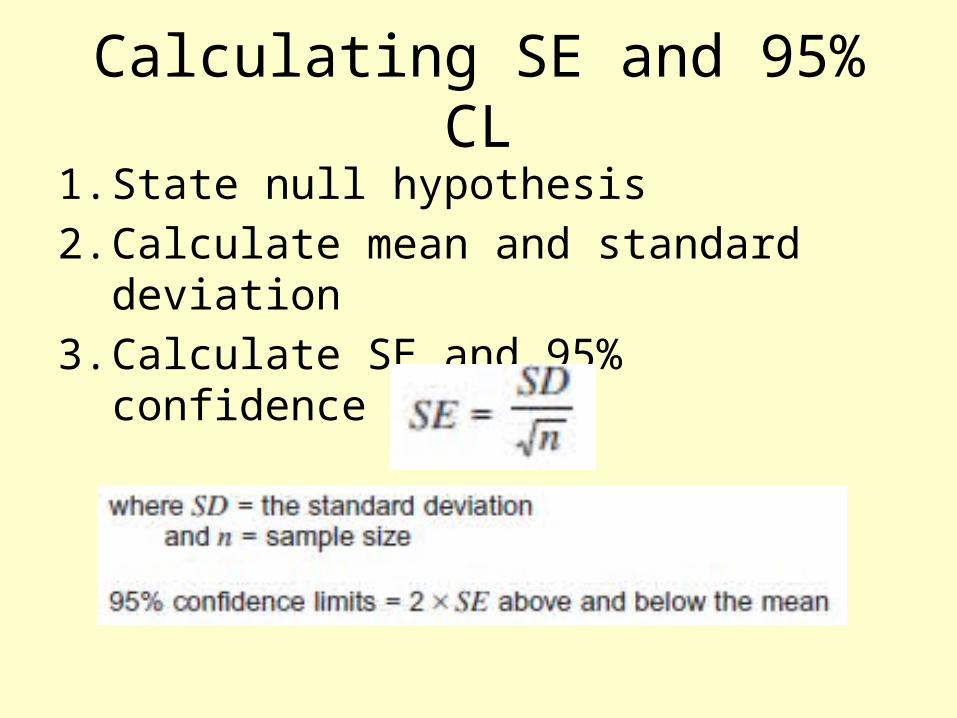
Calculating SE and 95% CL
1. State null hypothesis
2. Calculate mean and standard deviation
3. Calculate SE and 95% confidence limits:

Step 2: Calculate mean and SD for both groups
SD = (x – x)2
n – 1
SD = (x – x)2
n – 1
Group 1:
Group 2:
= 1296
10 – 1
=368
10 – 1
= 12
= 6.4
Group 1 mean = 58mm Group 2 mean = 31mm
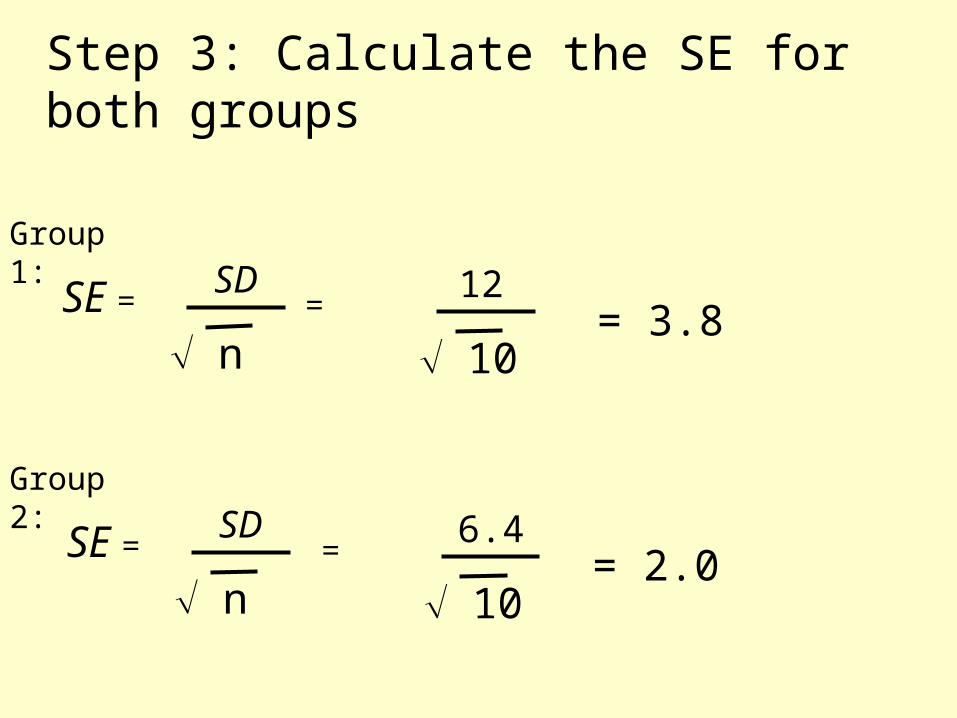
Step 3: Calculate the SE for both groups
SD
n
SE =
SD
n
SE =
Group 1:
Group 2:
6.4
10
=
12
10
= = 3.8
= 2.0

Step 3: Calculate the 95% confidence limitsMean ± 2 x SE
Group 1:
Upper limit = 58 + (2 x 3.8) = 66
Lower limit = 58 – (2 x 3.8) = 50
Group 2:
Upper limit = 31 + (2 x 2.0) = 35
Lower limit = 31 – (2 x 2.0) = 27
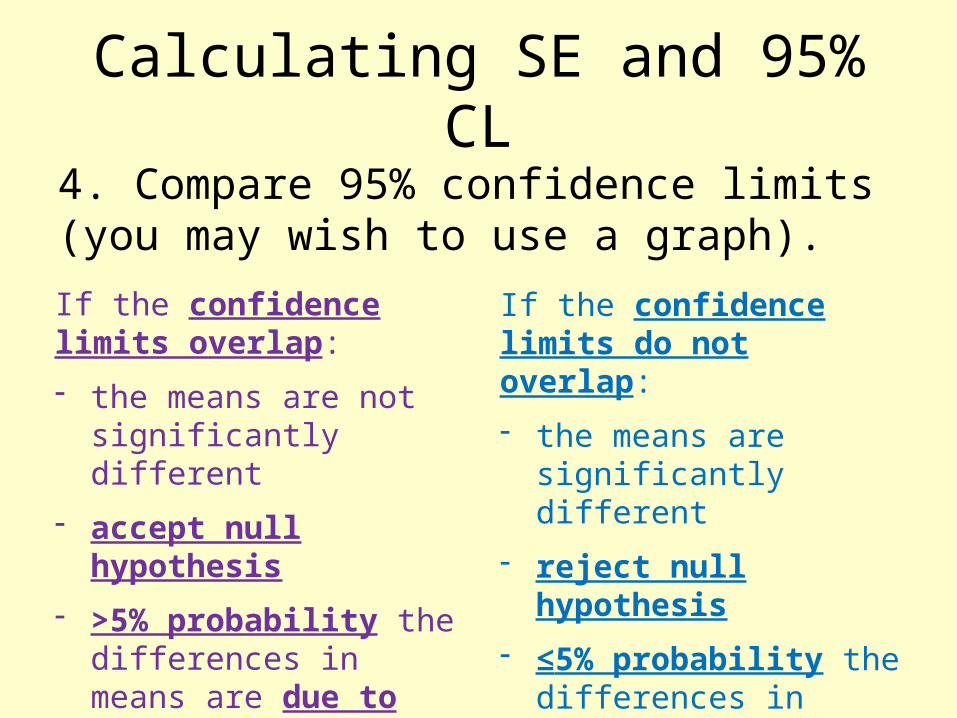
Calculating SE and 95% CL
4. Compare 95% confidence limits (you may wish to use a graph).
If the confidence limits overlap:
- the means are not significantly different
- accept null hypothesis
- >5% probability the differences in means are due to chance.
If the confidence limits do not overlap:
- the means are significantly different
- reject null hypothesis
- ≤5% probability the differences in means are due to chance.

The 95% confidence limits do not overlap, therefore there is a significant difference between the two means. We reject the null hypothesis as there is equal to or less than a 5% probability that the differences in means are due to chance.
Step 4: Plot means and confidence limits
Data set
Mean ± 2 x SE
Mean shell length/mm

Now try the examples on the sheet.
Remember:
1. State your null hypothesis.
2. Calculate the mean and standard deviation.
3. Calculate the standard error.
4. Calculate the 95% confidence limits.
5. Check to see whether the confidence limits overlap or not.
6. Write a conclusion, stating:
1. Whether or not the confidence limits overlap
2. Whether you accept or reject the null hypothesis
3. What the probability is that the differences between means occurred by chance.

Now:
• Use the data you collected (you can also collect data from other groups to provide a more reliable mean) to work out whether or not there is a significant difference in the population density for the two areas.
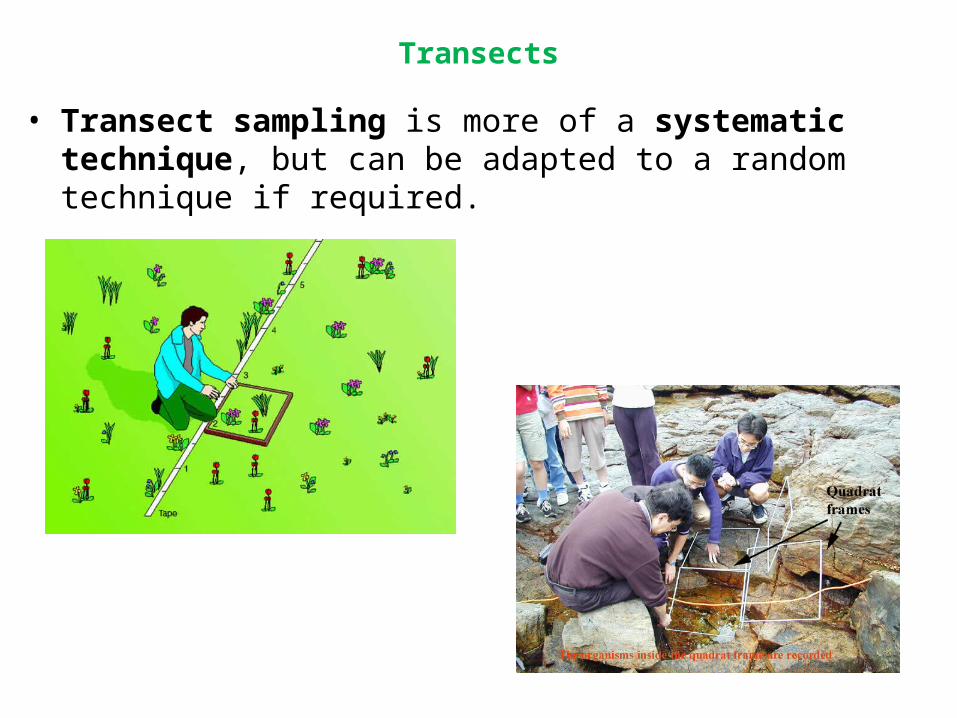
Transects
• Transect sampling is more of a systematic technique, but can be adapted to a random technique if required.

33 of 39 © Boardworks Ltd 2008
A line transect is useful for examining the effect of a change in habitat on biodiversity; for example, the effect of a stream running through a field or wood.
A line is drawn through the area to be examined. Any species touching the line at fixed intervals (e.g. 1 m) is recorded.
Line transects
34 of 39 © Boardworks Ltd 2008
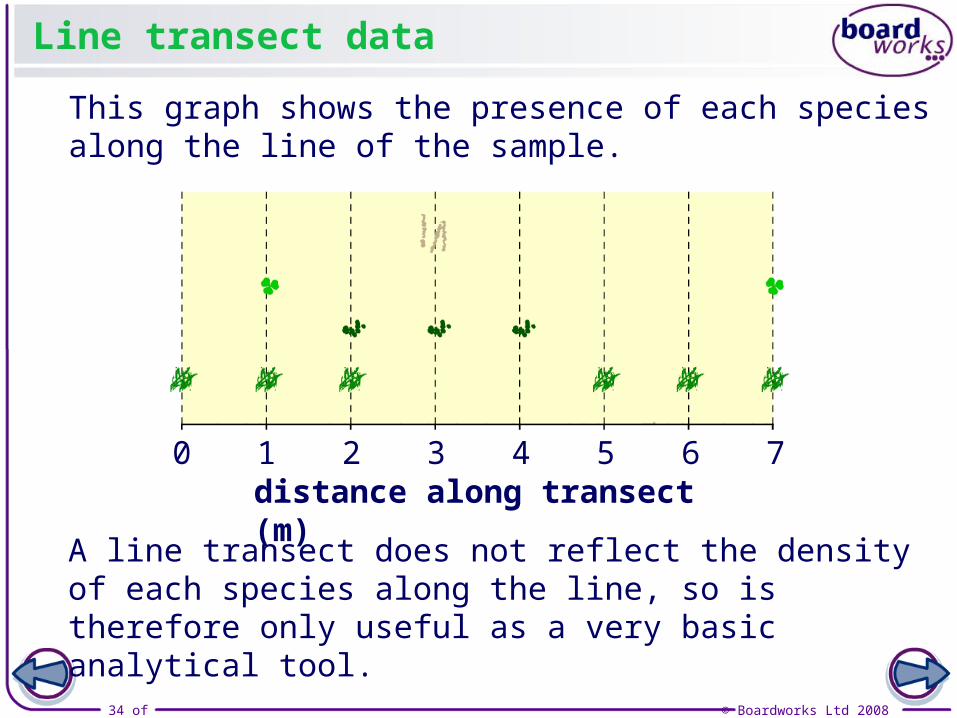
A line transect does not reflect the density of each species along the line, so is therefore only useful as a very basic analytical tool.
This graph shows the presence of each species along the line of the sample.
Line transect data
0 1 2 3 4 5 6 7distance along transect (m)
35 of 39 © Boardworks Ltd 2008
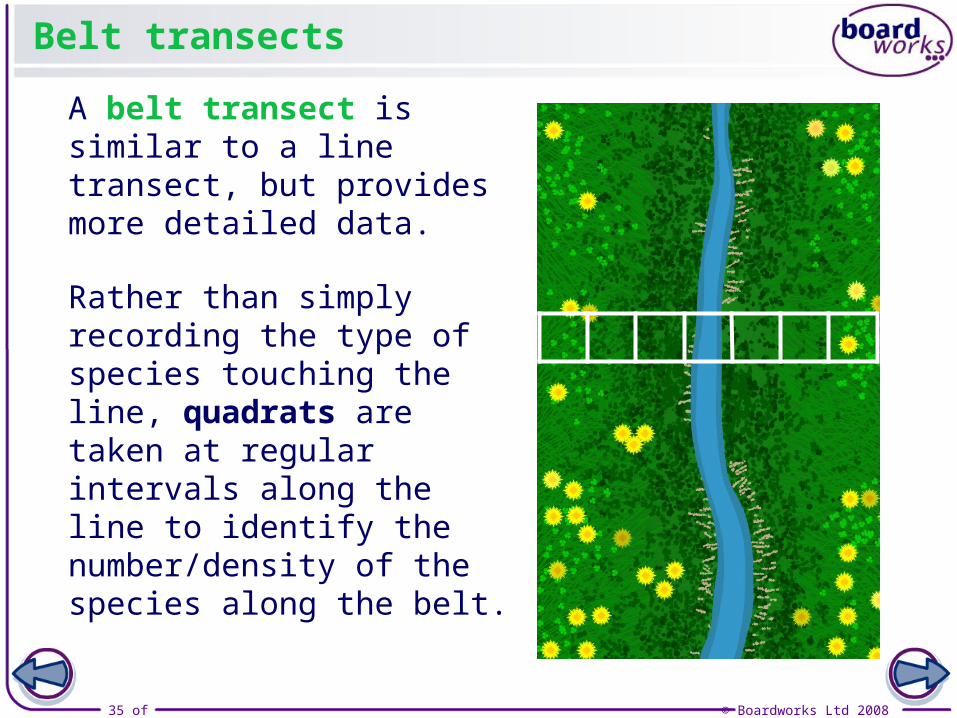
A belt transect is similar to a line transect, but provides more detailed data.
Rather than simply recording the type of species touching the line, quadrats are taken at regular intervals along the line to identify the number/density of the species along the belt.
Belt transects

36 of 39 © Boardworks Ltd 2008
The graph for a belt transect shows the density of the species present in the area, rather than just presence/absence.
Belt transect data
mossgrass reed dandelion clover
1 2 3 4 5 6 7
quadrat no.
no
. in
div
idu
als
0
20
40
60
80
100
120

Transects
• Use a tape measure or transect line.• Allow us to see changes as you move across an
area,e.g. does the population density of bluebells change as you move further into the woods?
• Line transect/belt transect?• With/without quadrats?• Placed randomly
Depends upon what you’re investigating!

What about animals?What we’ve seen up until now is fine for sampling plant populations, but studying animals and insects is trickier.
1. A set of animals are caught and then marked in some way.2. They’re then released back into the community.3. After a specified length of time, the community is revisited and a
number of individuals are caught again. 4. The number of marked individuals is counted.
The population size is calculated:

39 of 37 © Boardworks Ltd 2009
Studying animal populations

40 of 37 © Boardworks Ltd 2009
Field study

41 of 37 © Boardworks Ltd 2009
Common sampling techniques
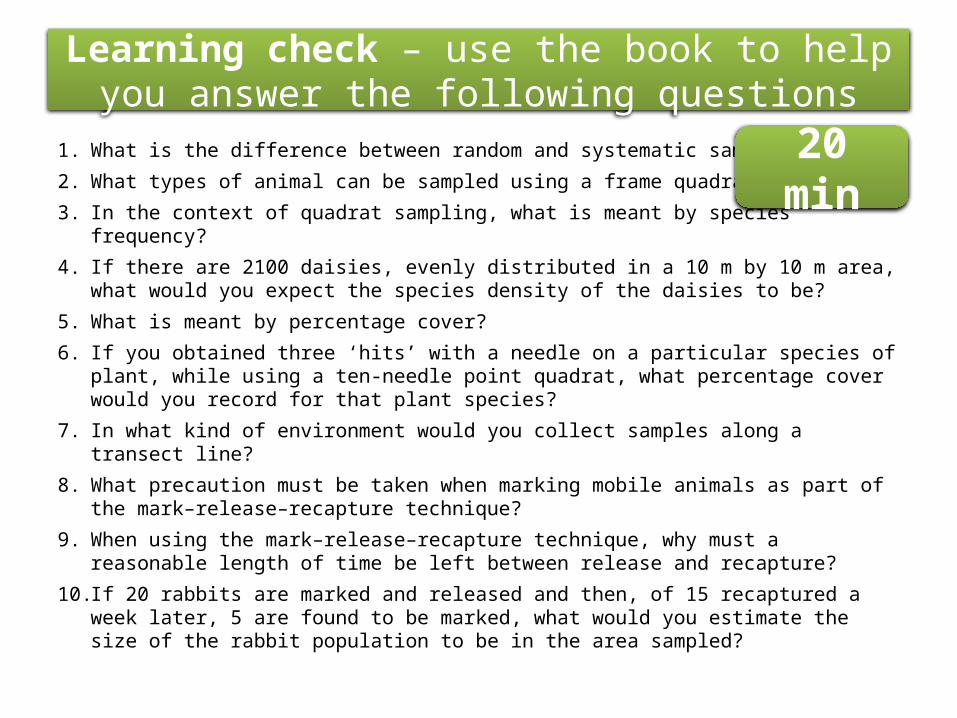
Learning check – use the book to help you answer the following questions
1. What is the difference between random and systematic sampling?
2. What types of animal can be sampled using a frame quadrat?
3. In the context of quadrat sampling, what is meant by species frequency?
4. If there are 2100 daisies, evenly distributed in a 10 m by 10 m area, what would you expect the species density of the daisies to be?
5. What is meant by percentage cover?
6. If you obtained three ‘hits’ with a needle on a particular species of plant, while using a ten-needle point quadrat, what percentage cover would you record for that plant species?
7. In what kind of environment would you collect samples along a transect line?
8. What precaution must be taken when marking mobile animals as part of the mark–release–recapture technique?
9. When using the mark–release–recapture technique, why must a reasonable length of time be left between release and recapture?
10. If 20 rabbits are marked and released and then, of 15 recaptured a week later, 5 are found to be marked, what would you estimate the size of the rabbit population to be in the area sampled?
20 min

1. What is the difference between random and systematic sampling?In random sampling, sampling points are chosen randomly. In systematic sampling, sample points are taken at regular intervals or in some other fixed pattern.
2. What types of animal can be sampled using a frame quadrat?Sessile, or non-moving, animals and sedentary, or slow-moving, animals.
3. In the context of quadrat sampling, what is meant by species frequency?The number of quadrats in which a particular species is found.
4. If there are 2100 daisies, evenly distributed in a 10 m by 10 m area, what would you expect the species density of the daisies to be?21 per m2.
5. What is meant by percentage cover?The proportion of an area covered by a plant or sessile or sedentary animal.
Learning check

6. If you obtained three ‘hits’ with a needle on a particular species of plant, while using a ten-needle point quadrat, what percentage cover would you record for that plant species?30%
7. In what kind of environment would you collect samples along a transect line?One in which there is a transition between communities along an environmental gradient, e.g. a beach.
8. What precaution must be taken when marking mobile animals as part of the mark–release–recapture technique?The marking must not affect the animals’ mobility or survival chance.
9. When using the mark–release–recapture technique, why must a reasonable length of time be left between release and recapture?To allow marked animals to mix in with the unmarked population.
10. If 20 rabbits are marked and released and then, of 15 recaptured a week later, 5 are found to be marked, what would you estimate the size of the rabbit population to be in the area sampled?60
Learning check

Key words & definitions
Key word Definition
Habitat The place where an organism normally lives, which is characterised by physical conditions and the species of other organisms present.
Random sampling Random sampling is used to avoid any bias in collecting data. Avoiding bias ensures that the data obtained is valid.
Systematic sampling
Samples are taken at regular intervals within a set sampling area. Time-consuming... But more reliable?
Abundance Counting the number of individuals of a species in a given space.
Frequency Frequency is the likelihood of a particular species occurring in a quadrat. It gives a quick idea of the species present and their general distribution within an area. However it does not provide information on the density and detailed distribution of species.
Percentage cover Is an estimate of the area within a quadrat that a particular plant species covers. Advantage – data be collected rapidly & individual plants do not need be counted Disadvantage – less useful organisms occur in several overlapping layers.
Mark-release-recapture
Known number animals caught, marked and released. Some time later given number of individuals are collected randomly and mark recorded.
Related Documents