Today: compute the experimental electron density map of proteinase K Fourier synthesis r(xyz)=S |F hkl | cos2p(hx+ky+lz -a hkl ) hkl

Today: compute the experimental electron density map of proteinase K Fourier synthesis (xyz)= …
Jan 20, 2018
Measureable differences 2) Anomalous Differences (i.e. differences between Friedel pairs): 3) Dispersive differences (differences due to changing the wavelength) : F P (hkl) =F PH (hkl) - f H (hkl) 1) Isomorphous differences (between native and derivative) F P (hkl) =F PH (hkl) n - f H (hkl) n F P (hkl) =F PH (-h-k-l) * - f H (-h-k-l) *
Welcome message from author
This document is posted to help you gain knowledge. Please leave a comment to let me know what you think about it! Share it to your friends and learn new things together.
Transcript

Today: compute the experimental electron density
map of proteinase K
Fourier synthesisr(xyz)=S |Fhkl| cos2p(hx+ky+lz -ahkl)
hkl

3 Crystals5 Measured Quantities
H K L |FP| |FPH (+)| |FPH (-)| |FPH (+)| |FPH (-)|)1 1 1 681.4 725.8 722.4 730.8 707.61 1 2 752.8 733.6 695.3 813.9 805.31 1 3 332.1 444.5 456.2 296.1 312.51 1 4 526.9 575.8 564.7 527.4 518.31 1 5 719.2 827.8 805.4 759.6 766.31 1 6 358.4 349.8 354.2 375.6 358.91 1 7 273.3 359.4 390.8 300.5 286.61 1 8 400.7 362.5 411.2 396.7 411.51 2 0 162.5 73.8 132.3 149.8 159.8
Native PCMBS (Hg) EuCl3 (Eu)
Sawaya
Heavy atom derivatives produce measureable changes in intensity that may be related to the phase of FP.Heavy atoms give us a way of deriving the phase of FP from measureable changes in the diffraction pattern produced by the heavy atom.We measured structure factor amplitudes for the native crystal. I am showing only a few here because the board is not long enough to show the full data set.How many think we have more than 100 reflections? 1000? 10000? 100000? It is between 30,000 and 50,000 and depends on resolution limit.

Measureable differences
2) Anomalous Differences (i.e. differences between Friedel pairs):
3) Dispersive differences (differences due to changing the
wavelength):
FP(hkl)=FPH (hkl)
- fH(hkl)
1) Isomorphous differences(between native and derivative)
FP(hkl)=FPH (hkl) ln
- fH(hkl) ln
FP(hkl)=FPH(-h-k-l)
* - fH(-h-k-l)*
Michael Sawaya
Heavy atoms can produce three types of measurable changes to the diffraction pattern.Each of these measured changes can be related to the phase of FP by a vector equation.Which of these types have we measured in our experiment?How many of each type of differences have we measured in our experiment?How many vector equations can we write for this experiment?How many vector equations are required to determine a phase unambiguously?What is the purpose of collecting more than 2 types of differences?
sawaya
Each equation promises that we could obtain the phase of the protein structure factor if we subtract the heavy atom contribution from the derivative structure factor.The problem is that we don't have enough information to make an unambiguous identification of the phase. We have enough data to narrow the posibilities of phase to two values.What information do we have? We know the amplitudes of all three vectors. Two of these are measured in the diffraction experiment. These are the protein and the derivative. The amplitude of the heavy atom structure factor is derived from knowing its position in the unit cell. We get it from a fourier transform of the heavy atom coordinates. We get its phase to. The phase of the derivative and protein are unknown.The information we have can be graphed in the complex plane as two sets of candidate vectors.The left half of the equation describes a set of candidate vectors of length |Fp| with tail at the origin.The right half of the equation describes a set of candidate vectors of length |FPH| with tail displaced from the origin by -fH.There are only two candidate vectors which give where the equality holds true.Each of these equations give us two choices of phase of Fp.If the data is perfect, then two of these equations is enough to uniquely resolve the choice of phase.

3 Crystals5 Measured Quantities
H K L |FP| |FPH (+)| |FPH (-)| |FPH (+)| |FPH (-)|1 1 1 681.4 725.8 722.4 730.8 707.61 1 2 752.8 733.6 695.3 813.9 805.31 1 3 332.1 444.5 456.2 296.1 312.51 1 4 526.9 575.8 564.7 527.4 518.31 1 5 719.2 827.8 805.4 759.6 766.31 1 6 358.4 349.8 354.2 375.6 358.91 1 7 273.3 359.4 390.8 300.5 286.61 1 8 400.7 362.5 411.2 396.7 411.51 2 0 162.5 73.8 132.3 149.8 159.8
Native PCMBS (Hg) EuCl3 (Eu)
Sawaya
Which type of differences did we measure?How many of each type of difference did we measure?How many vector equations can we write for this experiment?How many vector equations do we need to resolve a phase unambiguously?Why did we collect more data than needed to resolve the ambiguity?

Vector equations for this experiment
Isomorphous and
Anomalous Differences
Isomorphous and
Anomalous Differences
FP(hkl)=FPHg (hkl)
- fHg(hkl)
FP(hkl)=FPHg(-h-k-l)
* - fHg(-h-k-l)*
FP(hkl)=FPEu (hkl)
- fEu(hkl)
FP(hkl)=FPEu(-h-k-l)
* - fEu(-h-k-l)*
PCM
BS
(Hg)
For E
uCl 3
(Eu)
Sawaya
Note that this is a vector equation. Not scalars.Some of the information required to solve for Fp is not given in our data set. We have to compute it.It is the heavy atom structure factor.

Vector equations for this experiment
Isomorphous Differences FP(hkl)=FPHg (hkl)
- fHg(hkl)
We have collecting data on the native and derivative crystals.We know the coordinates of Hg.How many unknown quantities remain?
Sawaya
Note that this is a vector equation. Not scalars.Some of the information required to solve for Fp is not given in our data set. We have to compute it.It is the heavy atom structure factor.

SIR Phasing
500
500
-500
-250
-500
250-250
250
H K L |FP| |FPH (+)| |FPH (-)| |FPH (+)| |FPH (-)|
9 2 1 486 586 611 536 499
Real axis
Imaginary axis
|FP |
FP=FP·Hg(+) - fHg(+)
Sawaya
How is the structure factor amplitude represented in the graph?The right side of the equation is represented by points on the blue circle.The left side of the equation is represented by points on the green circle.There are only two points where there is an equivalence between left and right sides of the equation. That is where the circles intersect.

SIR Phasing
500
500
-500
-250
-500
250-250
250
H K L |FP| |FPH (+)| |FPH (-)| |FPH (+)| |FPH (-)|
9 2 1 486 586 611 536 499 Imaginary axis
fHg=fHg+f’+if[e2pi*(h(x)+k(y)+l(z))+e2pi*(h(-x)+k(-y)+l(½+z))+e2pi*(h(½-y)+k(½+x)+l(¾+z)+e2pi*(h(½+y)+k(½-x)+l(¼+z)+e2pi*(h(½-x)+k(½+y)+l(¾-z)+e2pi*(h(½+x)+k(½-y)+l(¼-z)+e2pi*(h(y)+k(x)+l(-z)+e2pi*(h(-y)+k(-x)+l(½-z)]
|FP |
FP=FP·Hg(+) - fHg(+)
Real axis
f’ and f” are anomalous scattering corrections specific for wavelength used.
x,y,z are Hg coordinates from Patterson map (0.197, 0.755, 0.935)
fHg is a real number proportional to the number of e- in Hg
Sawaya
How is the structure factor amplitude represented in the graph?The right side of the equation is represented by points on the blue circle.The left side of the equation is represented by points on the green circle.There are only two points where there is an equivalence between left and right sides of the equation. That is where the circles intersect.

SIR Phasing
500
500
-500
-250
-500
250-250
250
H K L |FP| |FPH (+)| |FPH (-)| |FPH (+)| |FPH (-)|
9 2 1 486 586 611 536 499 Imaginary axis
No!fHg=fHg[e2pi*(h(x)+k(y)+l(z))+e2pi*(h(-x)+k(-y)+l(½+z))+e2pi*(h(½-y)+k(½+x)+l(¾+z)+e2pi*(h(½+y)+k(½-x)+l(¼+z)+e2pi*(h(½-x)+k(½+y)+l(¾-z)+e2pi*(h(½+x)+k(½-y)+l(¼-z)+e2pi*(h(y)+k(x)+l(-z)+e2pi*(h(-y)+k(-x)+l(½-z)]+f’+if”
|FP |
FP=FP·Hg(+) - fHg(+)
Real axis
fHg ≠ |FP|-|FPH (+)|
f’ and f” are anomalous scattering corrections specific for wavelength used.
x,y,z are Hg coordinates from Patterson map (0.197, 0.755, 0.935)
fHg is a real number proportional to the number of e- in Hg
Sawaya
Sawaya2/4/2014Now we graph the right side of the equation.Should we approximate fHg as the isomorphous difference? No! It is a bad, minimal estimate of the amplitude. It was appropriate to use this in the difference Patterson map. But now we know the position of the heavy atom, we calculate its amplitude and phase.

SIR Phasing
500
500
-500
-250
-500
250-250
250
H K L |FP| |FPH (+)| |FPH (-)| |FPH (+)| |FPH (-)|
9 2 1 486 586 611 536 499
|fHg|=282 aHg=58°
Imaginary axis
|FP |
FP=FP·Hg(+) - fHg(+)
-
Real axis
282
58°fHg(+)
Sawaya
How is the structure factor amplitude represented in the graph?The right side of the equation is represented by points on the blue circle.The left side of the equation is represented by points on the green circle.There are only two points where there is an equivalence between left and right sides of the equation. That is where the circles intersect.

SIR Phasing
500
500
-500
-250
-500
250-250
250
H K L |FP| |FPH (+)| |FPH (-)| |FPH (+)| |FPH (-)|
9 2 1 486 586 611 536 499 Imaginary axis
|FP |
FP=FP·Hg(+) - fHg(+)
-fHg(+)
Real axis
|FP·Hg(+)|Let’s look at the quality of the phasing statistics
up to this point.
Sawaya
How is the structure factor amplitude represented in the graph?The right side of the equation is represented by points on the blue circle.The left side of the equation is represented by points on the green circle.There are only two points where there is an equivalence between left and right sides of the equation. That is where the circles intersect.

SIR Phasing H K L |FP| |FPH (+)| |FPH (-)| |FPH (+)| |FPH (-)|
9 2 1 486 586 611 536 499
0 90 180 270 360
0 90 180 270 360
0 90 180 270 360
Which of the following graphs best represents the phase probability
distribution, P(a)?
a)
b)
c)
500
500
-500
-250
-500
250-250
250
Imaginary axis
|FP |
-fHg(+)Real axis
|FP·Hg(+)|

SIR Phasing H K L |FP| |FPH (+)| |FPH (-)| |FPH (+)| |FPH (-)|
9 2 1 486 586 611 536 499
500
500
-500
-250
-500
250-250
250
Imaginary axis
|FP |
-fHg(+)Real axis
|FP·Hg(+)|
0 90 180 270 360
The phase probability distribution, P(a) is sometimes
shown as being wrapped around the phasing circle.
90
0180
270

SIR Phasing H K L |FP| |FPH (+)| |FPH (-)| |FPH (+)| |FPH (-)|
9 2 1 486 586 611 536 499Which of the following is the best choice of Fp?
a)
b)
c)
Radius of circle is approximately |Fp|
500
500
-500
-500
Imaginary axis
|FP |
Real axis
|FP·Hg(+)|
90
0180
270
90
0180
270
90
0180
270
90
0180
270

500
SIR Phasing H K L |FP| |FPH (+)| |FPH (-)| |FPH (+)| |FPH (-)|
9 2 1 486 586 611 536 499
500
-500
-500
Imaginary axis
|FP |
Real axis
|FP·Hg(+)|
best FP = |Fp|eia•P(a)daa
Sum of probability weighted vectors Fp
Usually shorter than Fp
0
90
180
270

500
SIR Phasing H K L |FP| |FPH (+)| |FPH (-)| |FPH (+)| |FPH (-)|
9 2 1 486 586 611 536 499
500
-500
-500
Imaginary axis
|Fbest | Real axis
|FP·Hg(+)|
best FP = |Fp|eia•P(a)daa
Sum of probability weighted vectors Fp
Usually shorter than Fp
0
90
180
270

90
0180
270
SIR
Sum of probability weighted vectors Fp
Best phase
best F = |Fp|eia•P(a)daa

90
0180
270
SIR
a) 1.00b) 2.00c) 0.50d) -0.10
Which of the following is the best approximation to the Figure Of Merit
(FOM) for this reflection?
FOM=|Fbest|/|FP|Radius of circle is approximately |Fp|

Which phase probability distribution would yield the most desirable Figure of Merit?
0
90
180
270 ++
0
90
180
270 ++
a) b)
c)
90
0180
270

Fbest|FPH|
|FPH|
Imaginary axis
SIR
Real axis
|Fp | a) 2.50b) 1.00c) 0.50d) -0.50
Which of the following is the best approximation
to the phasing power for this reflection?
Lack of closure = |FPH|-|FP+FH| = 0.5(at the aP of Fbest)
|Fp |fH
|fH ( h k l) | = 1.4
Phasing Power = |fH| Lack of closure

Fbest|FPH|
|FPH|
Imaginary axis
SIR
Real axis
|Fp | a) 2.50b) 1.00c) 0.50d) -0.50
Which of the following is the most
desirable phasing power?
|Fp |fH
What Phasing Power is sufficient to solve the structure? >1
Phasing Power = |fH| Lack of closure
sawaya
The greater |FH| is, the more |FPH| will be offset from |FP| and so the less these two circles (|FP| and |FPH| will coincide, and so the sharper the phase probability distribution will be.This quality translates into POWER.
fH
SIR
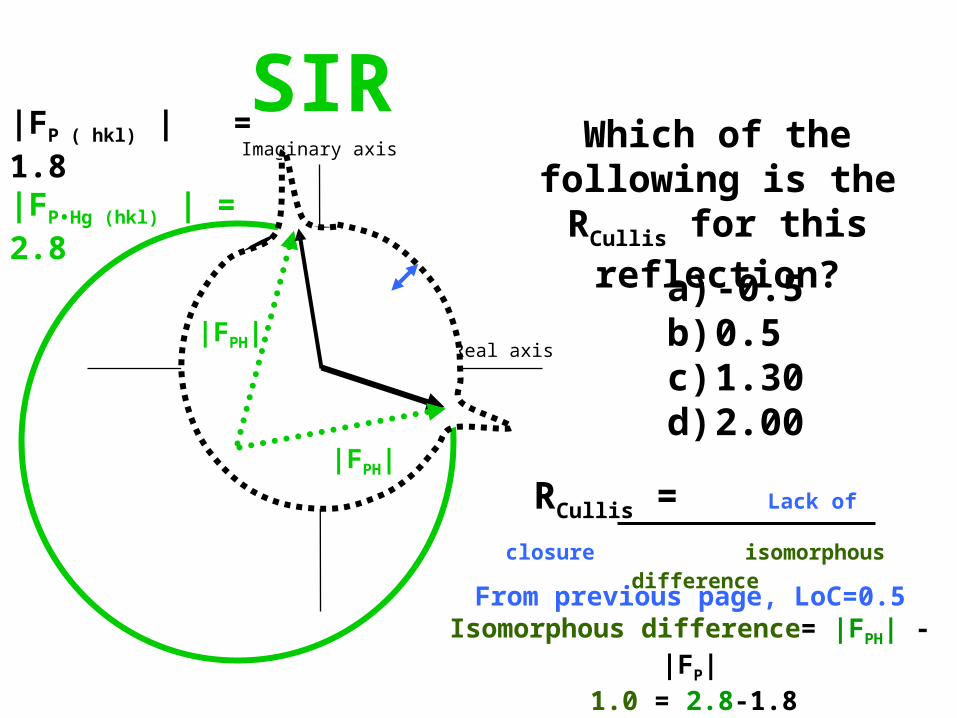
a) -0.5b) 0.5c) 1.30d) 2.00
Which of the following is the RCullis for this
reflection?
RCullis = Lack of closure isomorphous difference
From previous page, LoC=0.5Isomorphous difference= |FPH| - |FP|
1.0 = 2.8-1.8
|FP ( hkl) | = 1.8|FP•Hg (hkl) | = 2.8
Fbest
Imaginary axis
Real axis
|Fp |
|Fp |
|FPH|
|FPH|

SIRAS Phasing
500
500
-500
-250
-500
250-250
250
H K L |FP| |FPH (+)| |FPH (-)| |FPH (+)| |FPH (-)|
9 2 1 486 586 611 536 499 Imaginary axis
|FP |
FP=FP·Hg(-)* - fHg(-)*
Real axis
|fHg|=282 aHg*=48°
282
48°
fHg(-)*
|FP·Hg(+)|
-fHg(+)
Sawaya
How is the structure factor amplitude represented in the graph?The right side of the equation is represented by points on the blue circle.The left side of the equation is represented by points on the green circle.There are only two points where there is an equivalence between left and right sides of the equation. That is where the circles intersect.

SIRAS Phasing
500
500
-500
-250
-500
250-250
250
H K L |FP| |FPH (+)| |FPH (-)| |FPH (+)| |FPH (-)|
9 2 1 486 586 611 536 499 Imaginary axis
|FP |
FP=FP·Hg(-)* - fHg(-)*
Real axis
-fHg(-)*
|FP·Hg(+)||FP·Hg(-)|
-fHg(+)
Sawaya
How is the structure factor amplitude represented in the graph?The right side of the equation is represented by points on the blue circle.The left side of the equation is represented by points on the green circle.There are only two points where there is an equivalence between left and right sides of the equation. That is where the circles intersect.

Isomorphous differencesAnomalous differencesSIRAS
0 90 180 270 360
Which P(a) corresponds to SIR?Which P(a) corresponds to SIRAS?

Remember, because the position of Hg was determined using a Patterson map there is an ambiguity in handedness.
The Patterson map has an additional center of symmetry not present in the real crystal. Therefore, both the site x,y,z and -x,-y,-z are equally consistent with Patterson peaks.
Handedness can be resolved by calculating both electron density maps and choosing the map which contains structural features of real proteins (L-amino acids, right handed a-helices).
If anomalous data is included, then one map will appear significantly better than the other.
Note: Inversion of the space group symmetry (P43212 →P41212) accompanies inversion of the coordinates (x,y,z→ -x,-y,-z)
Center of inversion ambiguity
Patterson map

Choice of origin ambiguity
• I want to include the Eu data (derivative 2) in phase calculation.
• I can determine the Eu site x,y,z coordinates using a difference Patterson map.
• But, how can I guarantee the set of coordinates I obtain are referred to the same origin as Hg (derivative 1)?
• Do I have to try all 48 possibilities?

Use a Cross difference Fourier to resolve the handedness ambiguity
With newly calculated protein phases, aP, a protein electron density map could be calculated.
The amplitudes would be |FP|, the phases would be aP. r(xyz)=1/V*S|FP|e-2pi(hx+ky+lz-a
P)
Answer: If we replace the coefficients with |FPH2-FP|, the result is an electron density map corresponding to this structural feature.

r(x)=1/V*S|FPH2-FP|e-2pi(hx-aP
)
What is the second heavy atom, Alex.When the difference FPH2-FP is taken, the protein contribution
is cancelled and we are left with only the contribution from the second heavy atom.
This cross difference Fourier will help us in two ways:1) It will resolve the handedness ambiguity
-high peak in difference map calculated with aP in correct hand-only noise in difference map calculated with aP in incorrect
hand.2) It will improve our electron density map of the protein
-identify the position of the 2nd heavy atom -include 2 new vector equations for Eu (more accurate aP)

Phasing Procedures
1) Calculate phases for site x,y,z of Hg and run cross difference Fourier to find the Eu site. -Note the height of the peak and Eu coordinates.
2) Negate x,y,z of Hg and invert the space group from P43212 to P41212. Calculate a second set of phases and run a second cross difference Fourier to find the Eu site. -Compare the height of the peak with step 1.
3) Chose the handedness which produces the highest peak for Eu. Use the corresponding hand of space group and Hg, and Eu coordinates to make a combined set of phases.

|FP | = 486 ± 2
MIRAS Phasing
500
500
-500
-250
-500
FP=FP·Hg(+) - fHg(+)
250-250
250
H K L |FP| |FPH (+)| |FPH (-)| |FPH (+)| |FPH (-)|
9 2 1 486 586 611 536 499
H K L fH+f’ f”(-) aH fH+f’ f” aH9 2 1 281 27 53° 100 24 -114°
FP=FP·Hg(-)* - fHg(-)*
Real axis
Imaginary axis
Structure Lab
How is the structure factor amplitude represented in the graph?

SIR SIRAS MIRAS

SIR SIRAS MIRAS

Density modification
A) Solvent flattening.• Calculate an electron density map.• If r<threshold, -> solvent• If r>threshold -> protein• Build a mask• Set density value in solvent region
to a constant (low).• Transform flattened map to structure
factors• Combine modified phases with
original phases. • Iterate
• Histogram matching

MIR phased map + Solvent Flattening + Histogram Matching
MIRAS phased map

MIR phased map + Solvent Flattening + Histogram Matching
MIRAS phased map

Density modificationB) Histogram matching.
• Calculate an electron density map.
• Calculate the electron density distribution. It’s a histogram. How many grid points on map have an electron density falling between 0.2 and 0.3 etc?
• Compare this histogram with ideal protein electron density map.
• Modify electron density to resemble an ideal distribution.
Number of times a particular electron density value is observed.
Electron density value

HOMEWORK

Barriers to combining phase information from 2 derivatives
1) Initial Phasing with PCMBS1) Calculate phases using coordinates you determined.2) Refine heavy atom coordinates
2) Find Eu site using Cross Difference Fourier map.1) Easier than Patterson methods. 2) Want to combine PCMBS and Eu to make MIRAS phases.
3) Determine handedness (P43212 or P41212 ?)1) Repeat calculation above, but in P41212.2) Compare map features with P43212 map to determine
handedness. 4) Combine PCMBS and Eu sites (use correct hand of
space group) for improved phases.5) Density modification (solvent flattening & histogram
matching)1) Improves Phases
6) View electron density map
Related Documents

![Final Report for AmeriCorps Opportunity Youth Evaluation ......[26 /xyz 70 448 0.00] [27 /xyz 70 445 0.00] [28 /xyz 70 720 0.00] [28 /xyz 70 483 0.00] [30 /xyz 70 420 0.00] [31 /xyz](https://static.cupdf.com/doc/110x72/5f2350203f441e0a236e3614/final-report-for-americorps-opportunity-youth-evaluation-26-xyz-70-448.jpg)