Suggested citation: Chaloupka, F., Drope, J., Siu, E., Vulovic, V., Mirza, M., Rodriguez-Iglesias, G., Ngo, A., Laternser, C., Lee, H., Dorokhina, M., & Smith, M. (2021). Tobacconomics cigarette tax scorecard, 2nd Edition: Scoring component policy note – affordability change. Chicago, IL: Health Policy Center, Institute for Health Research and Policy, University of Illinois Chicago. www.tobacconomics.org Authors: This policy note was written by the Tobacconomics team: Frank Chaloupka, PhD; Jeff Drope, PhD; Erika Siu, JD LLM; Violeta Vulovic, PhD; Maryam Mirza, PhD; Germán Rodriguez- Iglesias, MSc; Anh Ngo, PhD; Christina Laternser, PhD (c); Hye Myung Lee, PhD (c); Margaret Dorokhina, MPH (c); and Mareda Smith, MPH (c). About Tobacconomics: Tobacconomics is a collaboration of leading researchers who have been studying the economics of tobacco control policy for over 30 years. The team is dedicated to helping researchers, advocates, and policy makers access the latest and best research about what’s working—or not working—to curb tobacco consumption and its economic impacts. As a program of the University of Illinois Chicago, Tobacconomics is not affiliated with any tobacco manufacturer. Visit www.tobacconomics.org or follow us on Twitter at www.twitter.com/tobacconomics. This Policy Note was funded by Bloomberg Philanthropies. The University of Illinois Chicago (UIC) is a partner of the Bloomberg Initiative to Reduce Tobacco Use. The views expressed in this document cannot be attributed to, nor do they represent, the views of UIC, the Institute for Health Research and Policy, or Bloomberg Philanthropies. For any comments or questions please email us at [email protected]. Tobacconomics Cigarette Tax Scorecard 2nd Edition Scoring Component Policy Note – Affordability Change | 1 Copyright © 2021 by Tobacconomics. All rights reserved.

Welcome message from author
This document is posted to help you gain knowledge. Please leave a comment to let me know what you think about it! Share it to your friends and learn new things together.
Transcript
Suggested citation: Chaloupka, F., Drope, J., Siu, E., Vulovic, V., Mirza, M., Rodriguez-Iglesias, G.,Ngo, A., Laternser, C., Lee, H., Dorokhina, M., & Smith, M. (2021). Tobacconomics cigarette taxscorecard, 2nd Edition: Scoring component policy note – affordability change. Chicago, IL: HealthPolicy Center, Institute for Health Research and Policy, University of Illinois Chicago.www.tobacconomics.org
Authors: This policy note was written by the Tobacconomics team: Frank Chaloupka, PhD; JeffDrope, PhD; Erika Siu, JD LLM; Violeta Vulovic, PhD; Maryam Mirza, PhD; Germán Rodriguez-Iglesias, MSc; Anh Ngo, PhD; Christina Laternser, PhD (c); Hye Myung Lee, PhD (c); MargaretDorokhina, MPH (c); and Mareda Smith, MPH (c).
About Tobacconomics: Tobacconomics is a collaboration of leading researchers who have beenstudying the economics of tobacco control policy for over 30 years. The team is dedicated to helpingresearchers, advocates, and policy makers access the latest and best research about what’sworking—or not working—to curb tobacco consumption and its economic impacts. As a program ofthe University of Illinois Chicago, Tobacconomics is not affiliated with any tobacco manufacturer. Visitwww.tobacconomics.org or follow us on Twitter at www.twitter.com/tobacconomics.
This Policy Note was funded by Bloomberg Philanthropies. The University of Illinois Chicago (UIC) isa partner of the Bloomberg Initiative to Reduce Tobacco Use. The views expressed in this documentcannot be attributed to, nor do they represent, the views of UIC, the Institute for Health Research andPolicy, or Bloomberg Philanthropies.
For any comments or questions please email us at [email protected].
Tobacconomics Cigarette Tax Scorecard2nd Edition
Scoring Component PolicyNote – Affordability Change
| 1Copyright © 2021 by Tobacconomics. All rights reserved.
Why is the change in affordability important?
Cigarette consumption typically increases when prices decrease. At the same time, changes in incomealso affect smoking behavior, with increases in income often resulting in greater consumption. Cigaretteaffordability addresses both price and income by reflecting an individual’s ability to purchase cigarettes.Generally, excise tax increases that lead to an increase in price make tobacco products less affordablebecause—all else equal—more resources are now required to purchase the same amount of tobaccoproducts (U.S. National Cancer Institute & World Health Organization [NCI & WHO], 2016).
Cigarette affordability is measured as the ratio of cigarette price to income, using various measures ofprices and income. The most widely used metric is the affordability index provided by RGTE data. It isdefined as the percentage of gross domestic product (GDP) per capita required to purchase 2000cigarettes of the most-sold brand. The index value rises when the price increase is more significant thanthe increase in income (all other variables remaining constant). A higher index indicates that cigarettesare less affordable since more of an individual’s income is needed to purchase the same number ofcigarettes.
The Guidelines for Article 6 of the WHO FCTC state that increases in real prices reduce tobacco use(WHO, 2014). However, in recent decades, many low- and middle-income countries (LMICs) have seenrapid growth in incomes and inflation, and these increases in inflation and purchasing power can erodethe impact of tax and price increases on consumption (NCI & WHO, 2016; World Bank, 2017). For thisreason, the Article 6 Guidelines emphasize the importance of taking income growth and inflation intoconsideration when raising tobacco taxes, recommending that tax increases should be large enough tomake tobacco products less affordable over time.
The latest evidence on cigarette affordability shows that from 2010 to 2020 cigarettes became lessaffordable in 84 countries—evenly distributed across high-, middle-, and low-income countries—andaffordability remained unchanged in 68 countries. Over the same time period cigarettes became moreaffordable in 20 countries, 17 of which are LMICs (WHO 2021a). Although the evidence remains mixedon whether the effect size differs by country income level, there is strong evidence that increases inrelative prices (lower affordability) lead to reductions in cigarette consumption (Blecher & Van Walbeek,2004, 2009; He et al., 2018). Thus, tax practitioners must assess cigarette prices not only in absoluteterms but also in terms of whether cigarettes are becoming more or less affordable over time (WHO2021b).
This Scorecard focuses on the changes in affordability over time rather than a static measure ofcigarette affordability. Cigarette affordability is likely to be correlated with the cigarette price, which is one
2 | Tobacconomics Cigarette Tax Scorecard: Scoring Component Policy Note – Affordability Change
The Tobacconomics Cigarette Tax Scorecard evaluates countries’cigarette tax systems based on a five-point rating system that incorporates internationalguidance and best practices in tobacco taxation developed by the World Health Organization(WHO), the WHO Framework Convention on Tobacco Control (FCTC), the World Bank (WB),and academics and researchers worldwide. The five-point index uses data from the WorldHealth Organization’s biennial Report on the Global Tobacco Epidemic (RGTE) (WHO, 2021a)to score countries on the following four components: cigarette price, changes in theaffordability of cigarettes over time, the share of taxes in retail cigarette prices, and thestructure of cigarette taxes. The total score reflects an average of the four component scores.

| 3
of the other three components in the Scorecard. However, reduced affordability over time is critical forreducing tobacco use—something that will not be captured by the cigarette price component of theScorecard.
Scoring criteria of affordability change
The Scorecard evaluates the trend in cigarette affordability in each country by utilizing the averageannual percentage change (AAPC) in the affordability index over six years. The AAPC is computed byfitting a linear regression trend line to the logarithmic values of the affordability index. Scores are basedon both a statistically significant change in AAPC and at least one tax increase during the time periodand are determined as follows:
Strengths and weaknesses of the measure
Using the average annual change in the affordability index is a simple yet effective method to examinetrends over a given period of time. Observing the change in affordability helps tax practitioners understandthe changes in price relative to changes in income and purchasing power and implement an effective taxpolicy to make cigarettes less affordable.
There is some methodological debate, however, regarding the best income measure to use. The presentanalysis uses GDP per capita, following the method used in the WHO RGTE (WHO, 2015, 2017, 2019,2021). It is a broad and widely available measure of income and includes the provision of public goods andservices such as education and medical expenses. However, in highly unequal societies, which are many,the per capita measure can be very distant from the actual median income, which better represents theincome available to most people but is not consistently available in many countries.
Data availability issues exist for prices as well. In some countries, the price of the most-sold brand used inRGTE data does not capture the variability in cigarette prices in the market. For example, in Bangladesh,the price of the most-sold brand used in the analysis is more than twice the price of the cheapest brandavailable. The Scorecard uses ‘most-sold brand’ because it provides data for the most countries over time.Unfortunately, data for the price of the least-expensive brand—an indicator of a consumer’s barrier to entryinto the marketplace—are less available. The tax structure score, which is one of the other threecomponents in the Scorecard, partially addresses these concerns since the price variability of cigaretteprices is greatly affected by the tax structure in each country: better structures greatly compress thatvariability. The cigarette affordability measure also does not capture opportunities to substitute to othertobacco products for which the trend in affordability may differ from the trend for cigarettes.
Despite these shortcomings, reducing the affordability of tobacco products is paramount to reducingtobacco use. Especially as countries experience rapid economic growth, like many LMICs haveexperienced in the last two decades, increases in taxes that raise prices above both inflation and incomegrowth are critical to achieving public health goals. Hence, it is not only important to increase the retail priceof tobacco products but, more importantly, to reduce their affordability.
Scoring – Change in Affordability:
5: 7.5% average annual reduction or higher4: 5.0% ≤ average annual reduction < 7.5%3: 2.5% ≤ average annual reduction < 5.0%2: Average annual reduction < 2.5%1: Reduced affordability, but no tax increase0: Increased affordability or no significant reduction
4 | Tobacconomics Cigarette Tax Scorecard: Scoring Component Policy Note – Affordability Change
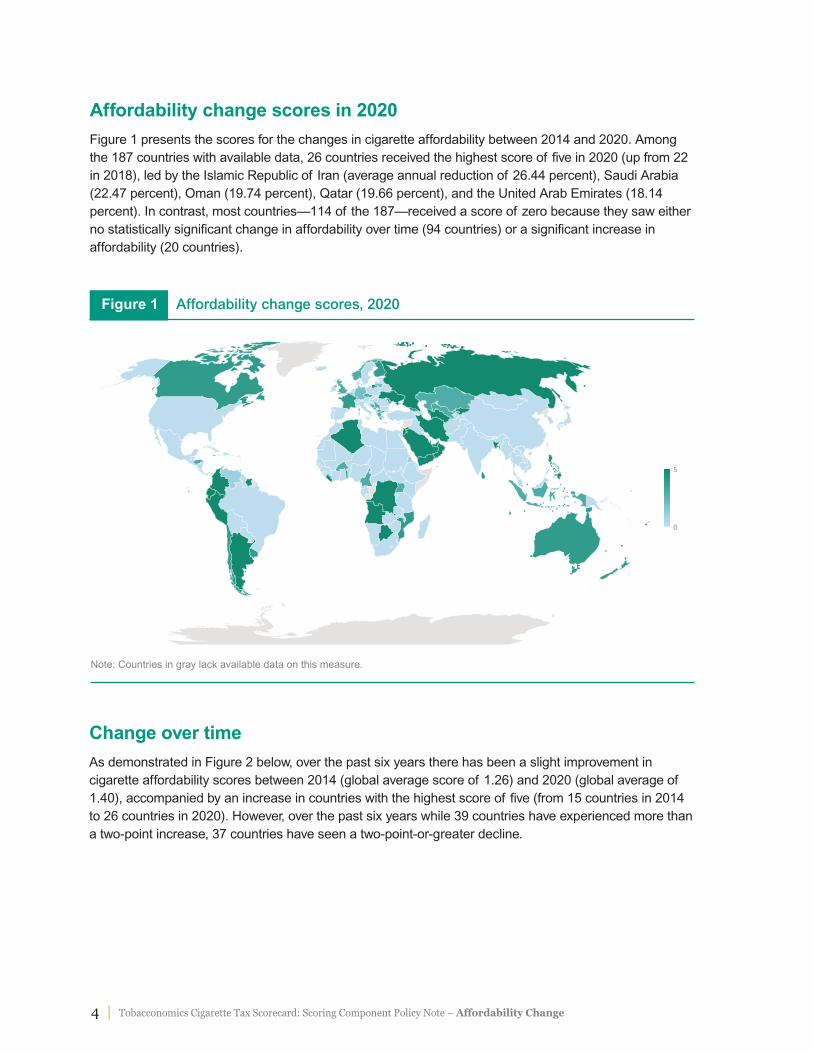
Affordability change scores in 2020
Figure 1 presents the scores for the changes in cigarette affordability between 2014 and 2020. Amongthe 187 countries with available data, 26 countries received the highest score of five in 2020 (up from 22in 2018), led by the Islamic Republic of Iran (average annual reduction of 26.44 percent), Saudi Arabia(22.47 percent), Oman (19.74 percent), Qatar (19.66 percent), and the United Arab Emirates (18.14percent). In contrast, most countries—114 of the 187—received a score of zero because they saw eitherno statistically significant change in affordability over time (94 countries) or a significant increase inaffordability (20 countries).
6
6
66
66 6 6 6
/
4
Note: Countries in gray lack available data on this measure.
Figure 1 Affordability change scores, 2020
Change over time
As demonstrated in Figure 2 below, over the past six years there has been a slight improvement incigarette affordability scores between 2014 (global average score of 1.26) and 2020 (global average of1.40), accompanied by an increase in countries with the highest score of five (from 15 countries in 2014to 26 countries in 2020). However, over the past six years while 39 countries have experienced more thana two-point increase, 37 countries have seen a two-point-or-greater decline.

| 5
Figure 3 shows the average scores regionally and globally for the affordability component of theScorecard. From 2014 to 2020, the European region saw a score decline in affordability change (from2.46 to 1.38), while all other regions had increases in their average affordability change scores. TheSouth-East Asia region experienced the greatest average score increase in affordability changecomponent from 0.00 to 1.44.
/ / // /
/ / // // // // // // // // // // // // // // // // // // // // // // // // // // // // // // // // // // // // // // // // // // // // // // /
( ( ( ( ( ( (
56/7"-$%/-$1&2+02
QR5/7"-$%/-$1&2+02
SRQ/7"-$%/-$1&2+02
$"/13+$42
SRQ/7"-$%/*21.-$2
QR5/7"-$%/*21.-$2
56/7"-$%/*21.-$2
$"/*+%+
Note: Countries in gray lack available data on this measure.
Figure 2 Changes in countries’ affordability change scores, 2014–2020
AMRAFR
2014 2016 2018 2020
EMR EUR SEAR WPR Global0
5
4
3
2
1
Note: Affordability scores from 2018 were revised using the updated affordability measures in the most recent RGTE data (2021). A full listcan be found in Appendix 4 of the Scorecard, second edition.
Figure 3 Average affordability change score, globally and by WHO region, 2014–2020

6 | Tobacconomics Cigarette Tax Scorecard: Scoring Component Policy Note – Affordability Change
Low
2014 2016 2018 2020
Lower-middle Upper-middle High Global0
5
4
3
2
1
Note: Affordability scores from 2018 were revised using the updated affordability measures in the most recent RGTE data (2021). A full listcan be found in Appendix 4 of the Scorecard, second edition.
Figure 4 Average affordability change score, globally and by World Bank income group, 2014–2020
As shown in Figure 4, lower-middle-income countries scored worst on the affordability measure in 2020,while the upper-middle-income countries scored highest. The lower scores for lower-middle-incomecountries are at least in part attributable to the relatively greater increases in income in these countries.From 2014 to 2020, the average score of the high-income countries dropped from 2.58 to 1.52, althoughthe score slightly increased between 2018 and 2020.

| 7
References
Blecher, E., & Van Walbeek, C. (2004). An international analysis of cigarette affordability. TobaccoControl, 13(4), 339-346.
Blecher, E., & Van Walbeek, C. (2009). Cigarette affordability trends: An update and somemethodological comments. Tobacco Control, 18(3), 167-175.
He, Y., Shang, C., & Chaloupka, F. J. (2018). The association between cigarette affordability andconsumption: An update. PLoS One, 13(12), e0200665.
U.S. National Cancer Institute and World Health Organization. (2016). The economics of tobacco andtobacco control. National Cancer Institute Tobacco Control Monograph 21. NIH Publication No. 16-CA-8029A. Bethesda, MD: U.S. Department of Health and Human Services, National Institutes of Health,National Cancer Institute; and Geneva, CH: World Health Organization.
World Bank. (2017). Tobacco tax reform at the crossroads of health and development.
World Health Organization. (2014). Guidelines for implementation of Article 6 of the WHO FCTC.
World Health Organization. (2015). WHO report on the global tobacco epidemic, 2015: Raising taxes on tobacco.
World Health Organization. (2017). WHO report on the global tobacco epidemic, 2017: Monitoring tobaccouse and prevention policies.
World Health Organization. (2019). WHO report on the global tobacco epidemic, 2019: Offer help to quittobacco use.
These data show that affordability of cigarettes isa metric that must be regularly evaluated givendynamic shifts in inflation and income growth. The scores also reveal
that the majority (over 60 percent) of countries are not reducing the
affordability of cigarettes with effective cigarette tax policies. Modest
increases in cigarette taxes that do not, at the very least, account for
these shifts in inflation and income growth will not be as effective in
achieving public health goals. By imposing higher and better-designed
cigarette taxes, countries can continuously increase the prices and
reduce the affordability of cigarettes, thus decreasing cigarette
consumption.
Policy recommendations

8 | Tobacconomics Cigarette Tax Scorecard: Scoring Component Policy Note – Affordability Change
World Health Organization. (2021a). WHO report on the global tobacco epidemic, 2021: Addressing newand emerging products.
World Health Organization. (2021b). WHO technical manual on tobacco tax policy and administration.
www.tobacconomics.org | @tobacconomics
Related Documents